Author Contributions
Conceptualization, J.Y.H., Y.J.L., H.G.J. and J.K.S.; methodology, J.Y.H., Y.J.L., H.G.J. and J.K.S.; software, J.Y.H. and Y.J.L.; validation, J.Y.H., H.G.J. and J.K.S.; formal analysis, J.Y.H., H.G.J. and J.K.S.; investigation, J.Y.H.; resources, J.Y.H. and Y.J.L.; data curation, J.Y.H.; writing—original draft preparation, J.Y.H.; writing—review and editing, Y.J.L., H.G.J. and J.K.S.; visualization, J.Y.H.; supervision, Y.J.L., H.G.J. and J.K.S.; project administration, J.K.S.; funding acquisition, J.K.S. All authors have read and agreed to the published version of the manuscript.
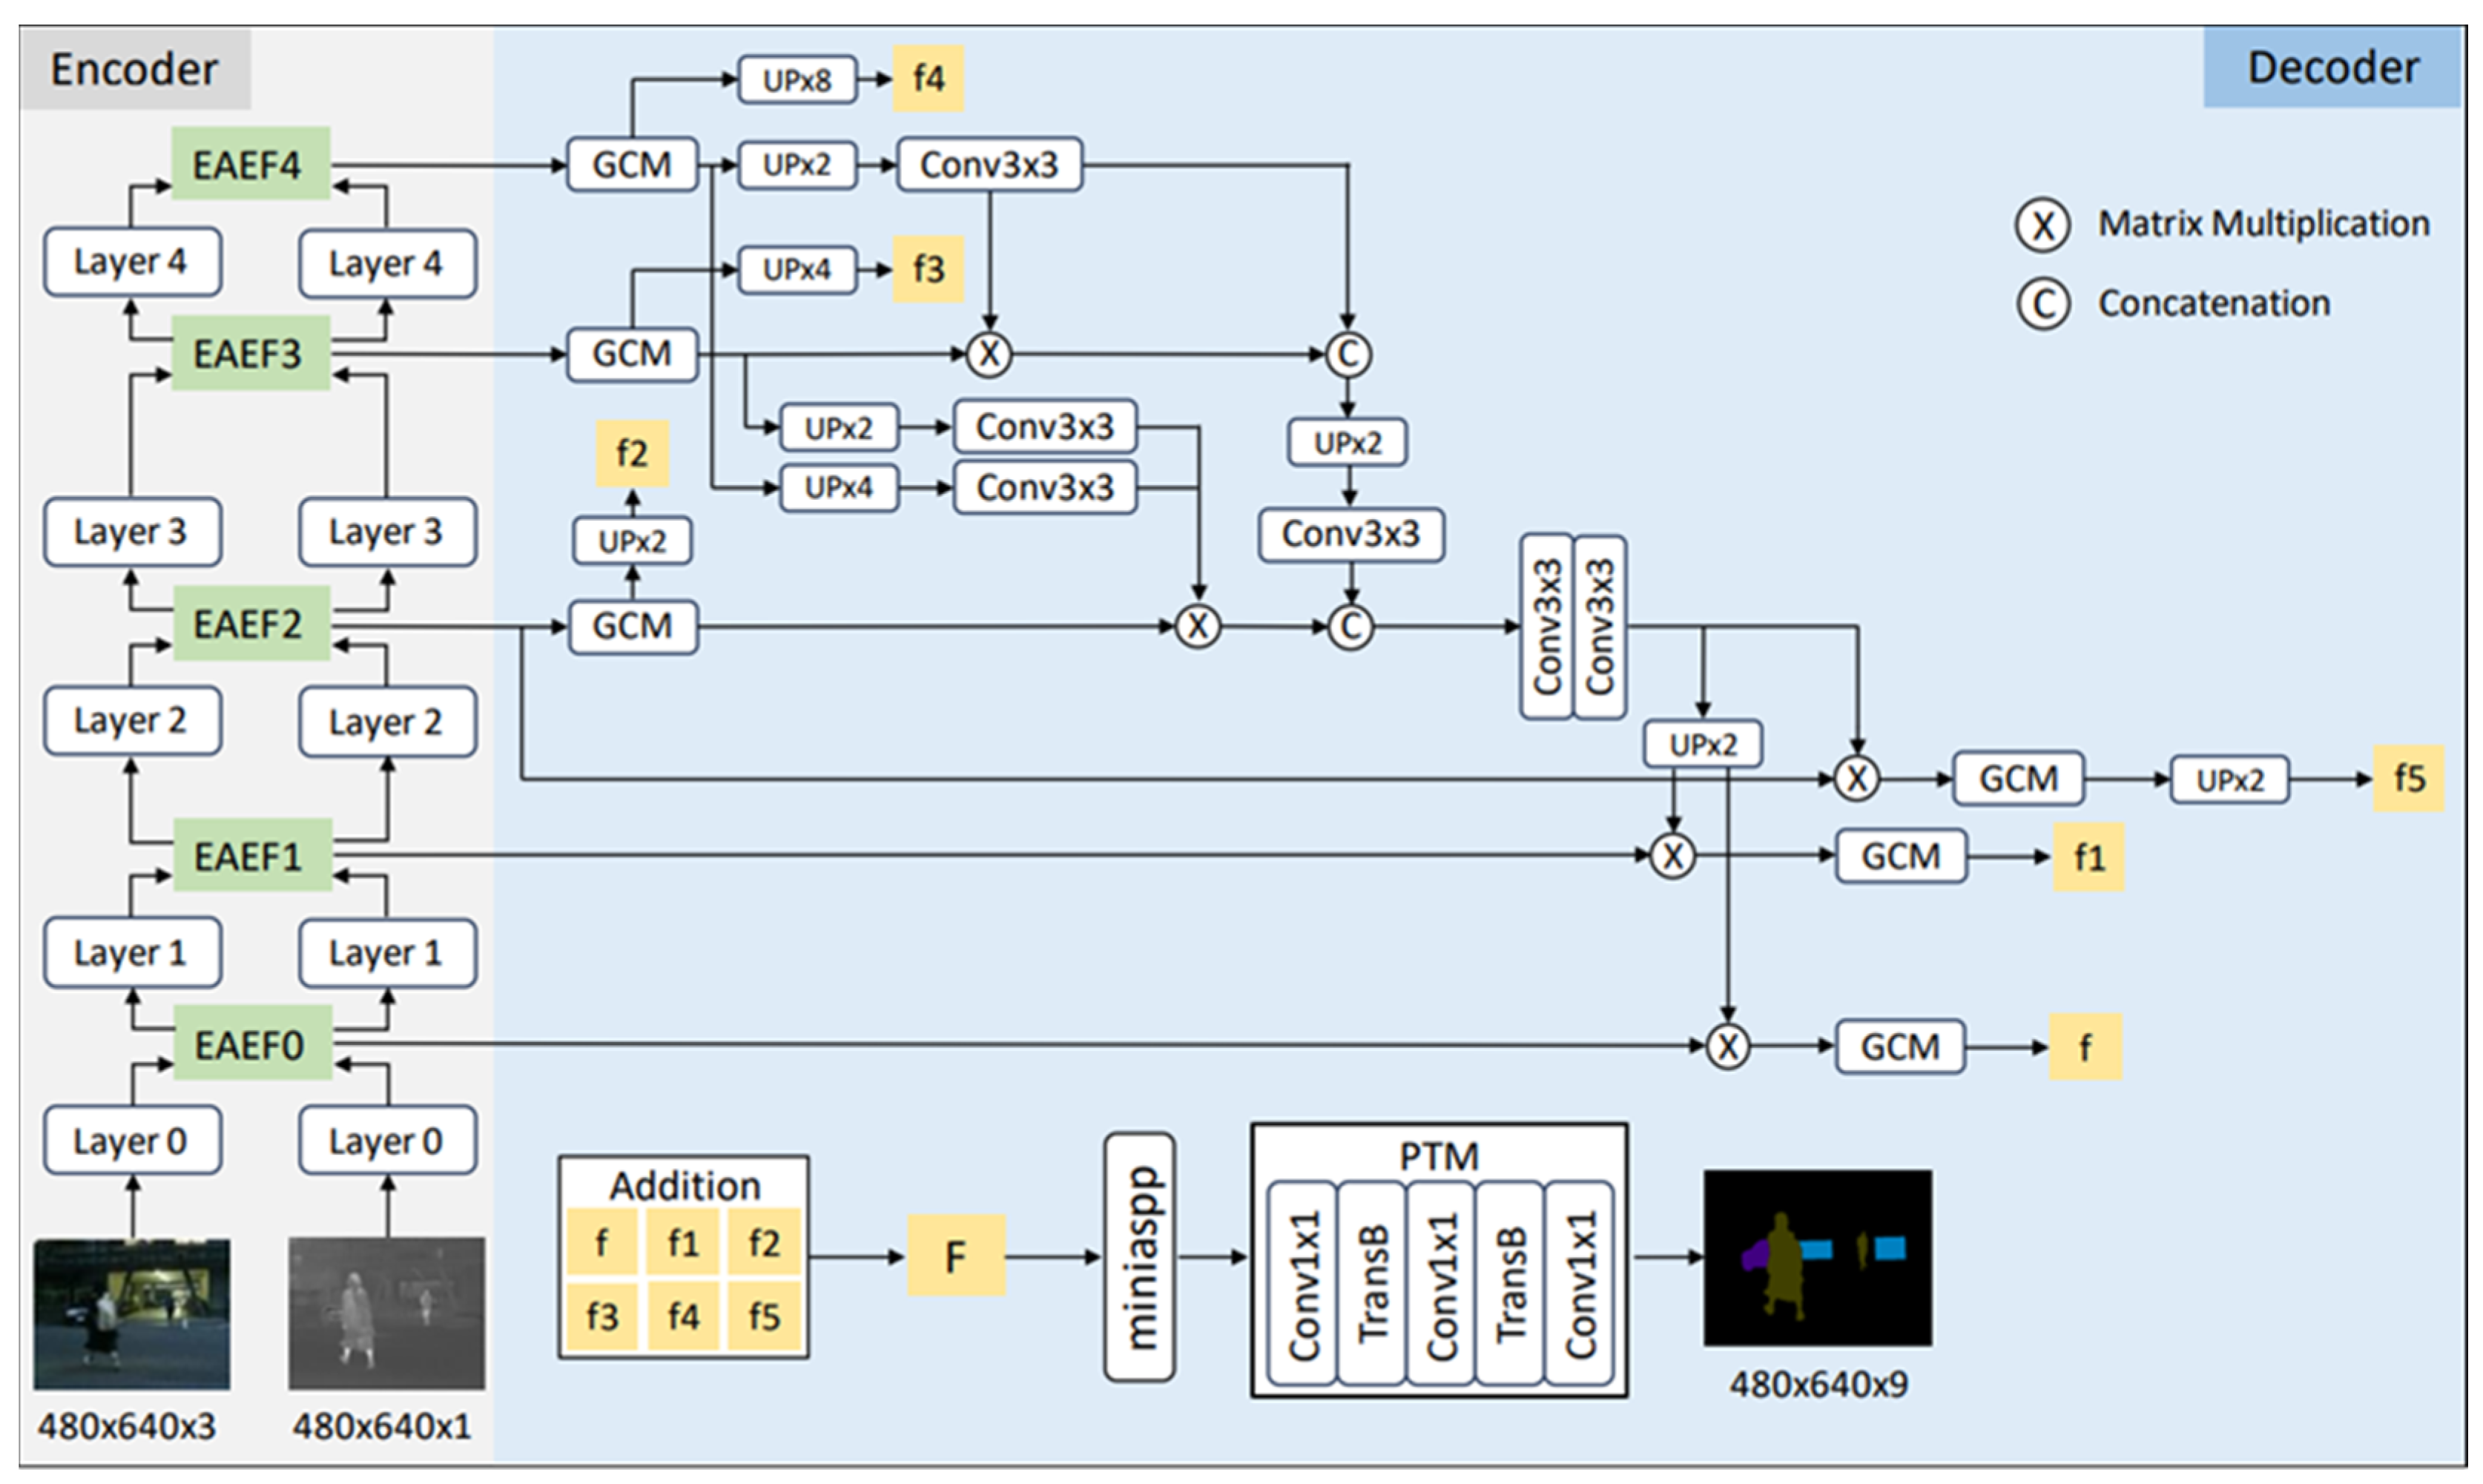
Figure 1.
Architecture of EAEFNet. EAEFNet consists of a dual encoder for RGB and thermal images, EAEF modules for RGB-T feature fusion, and a decoder with multiple modules.
Figure 1.
Architecture of EAEFNet. EAEFNet consists of a dual encoder for RGB and thermal images, EAEF modules for RGB-T feature fusion, and a decoder with multiple modules.
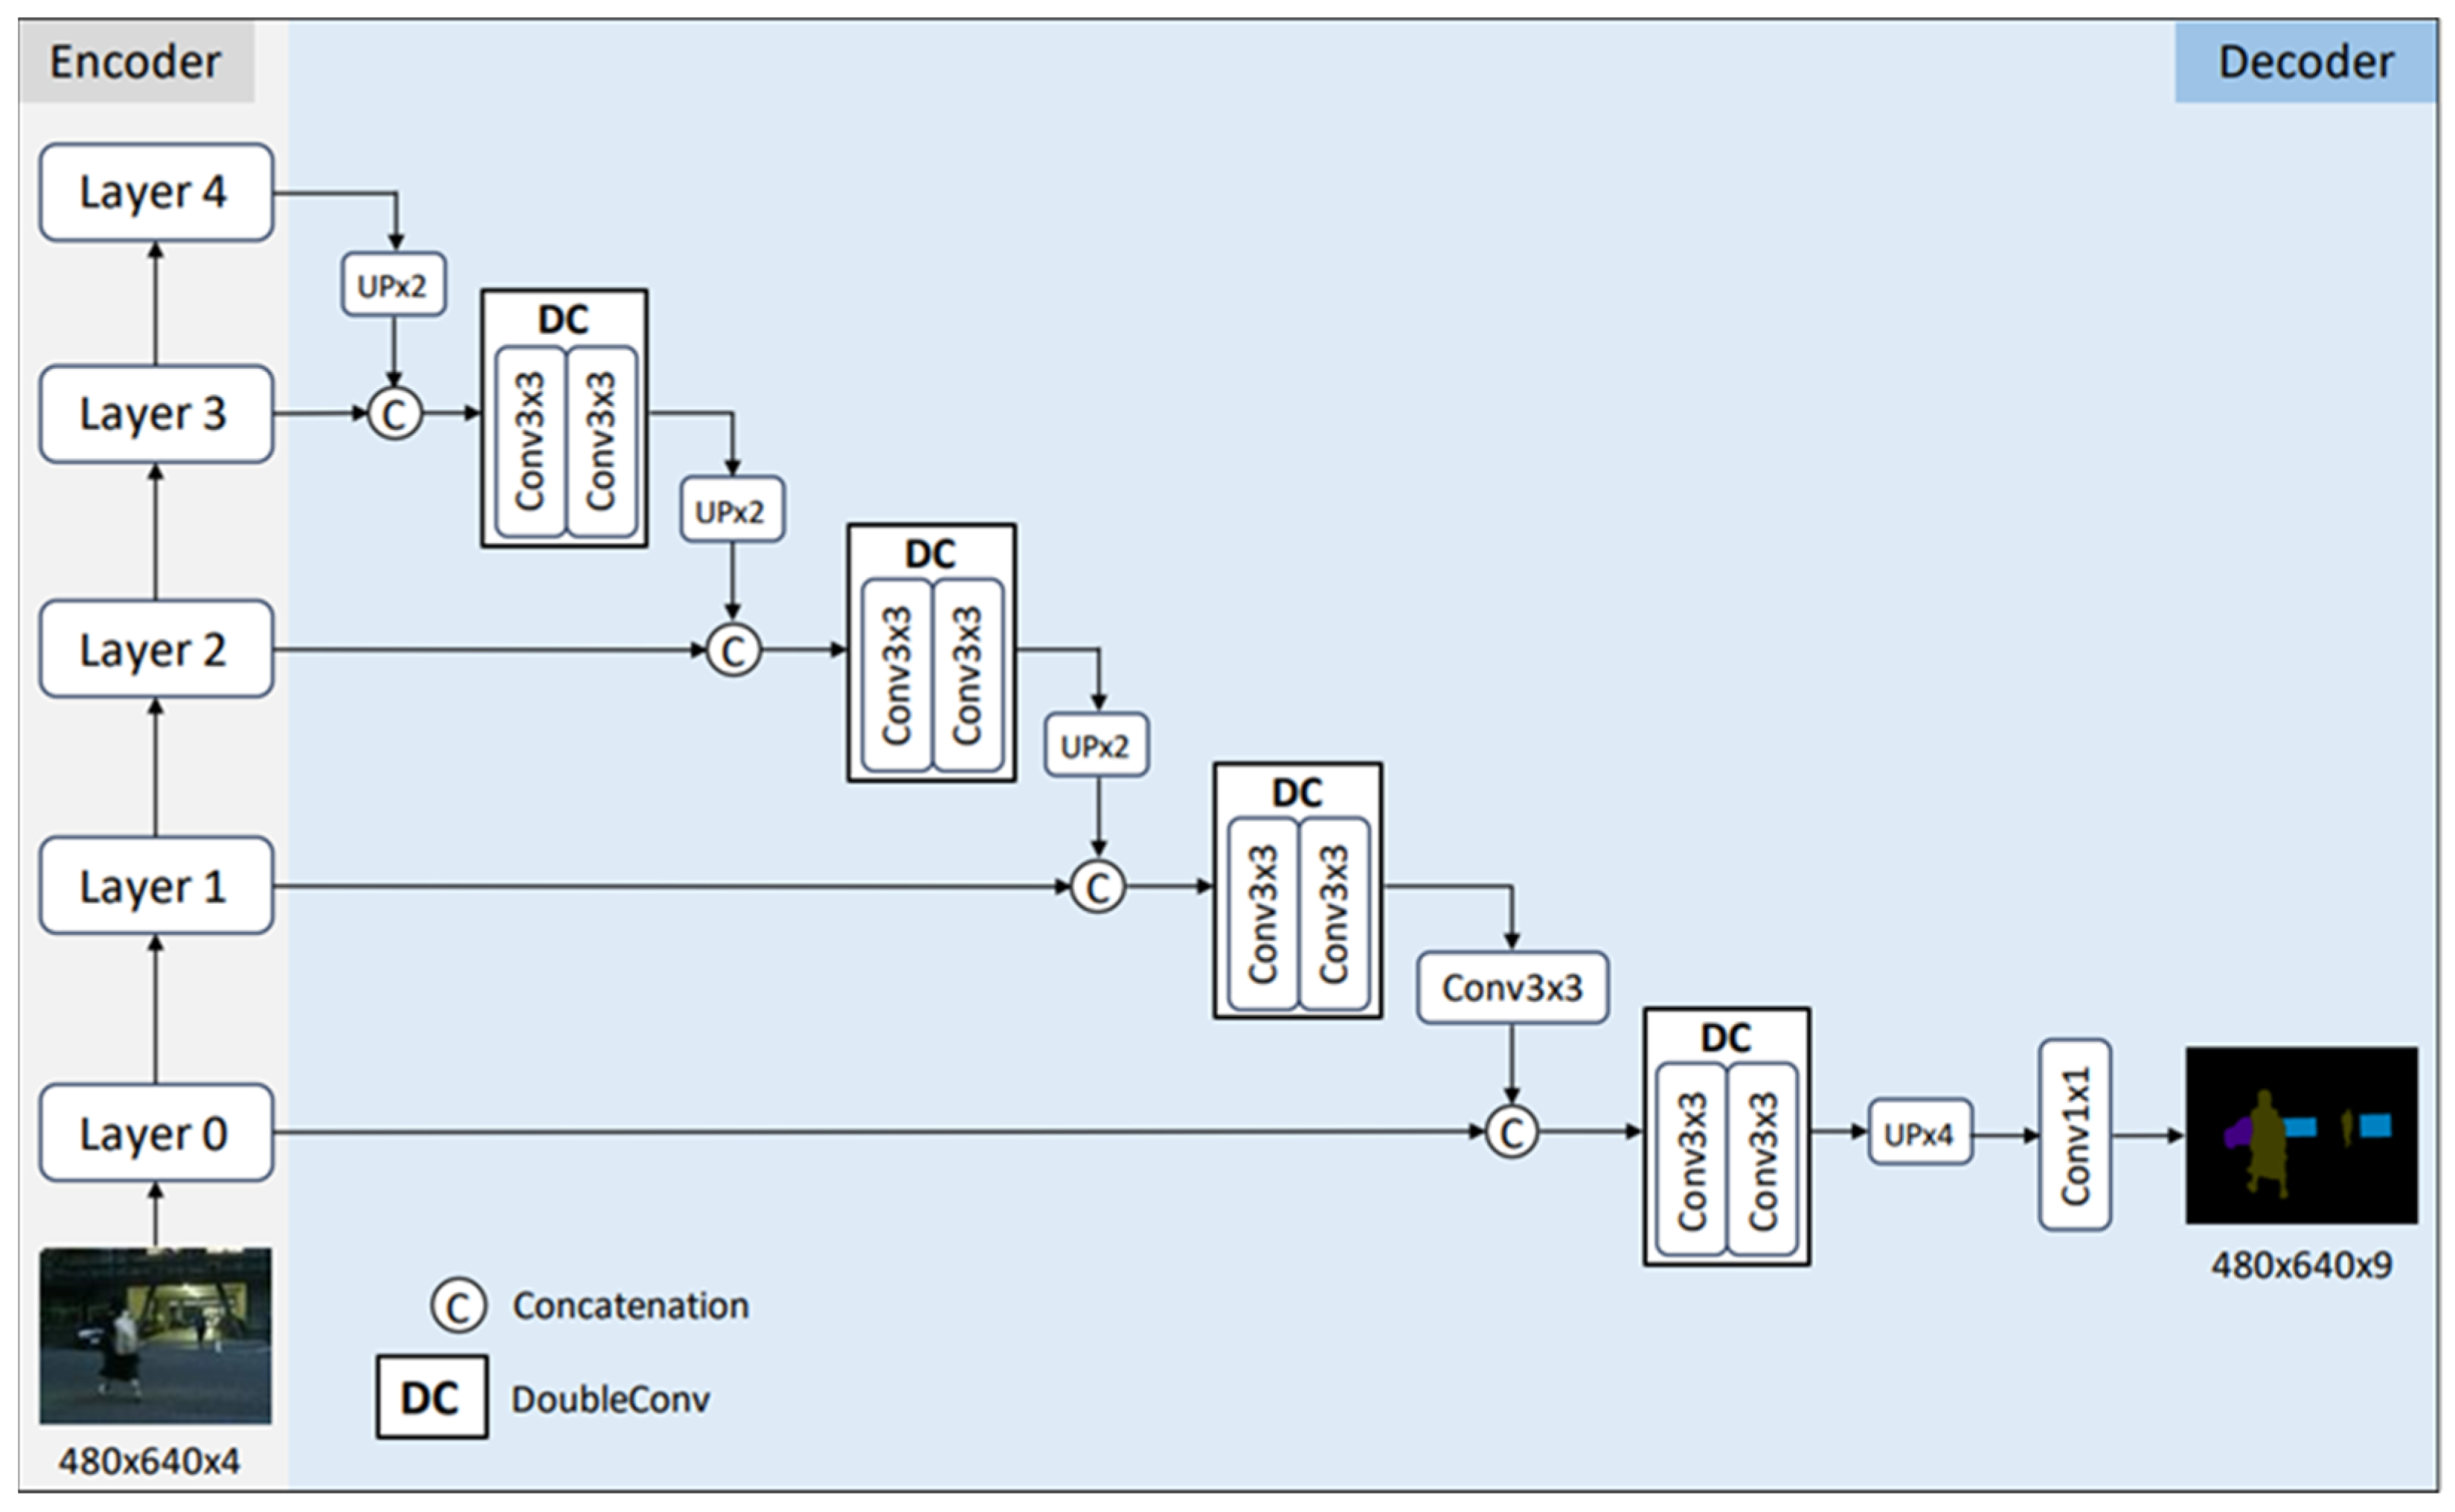
Figure 2.
Architecture of Base Network. Base Network consists of a single encoder based on ResNet50 and a decoder based on U-Net.
Figure 2.
Architecture of Base Network. Base Network consists of a single encoder based on ResNet50 and a decoder based on U-Net.
Figure 3.
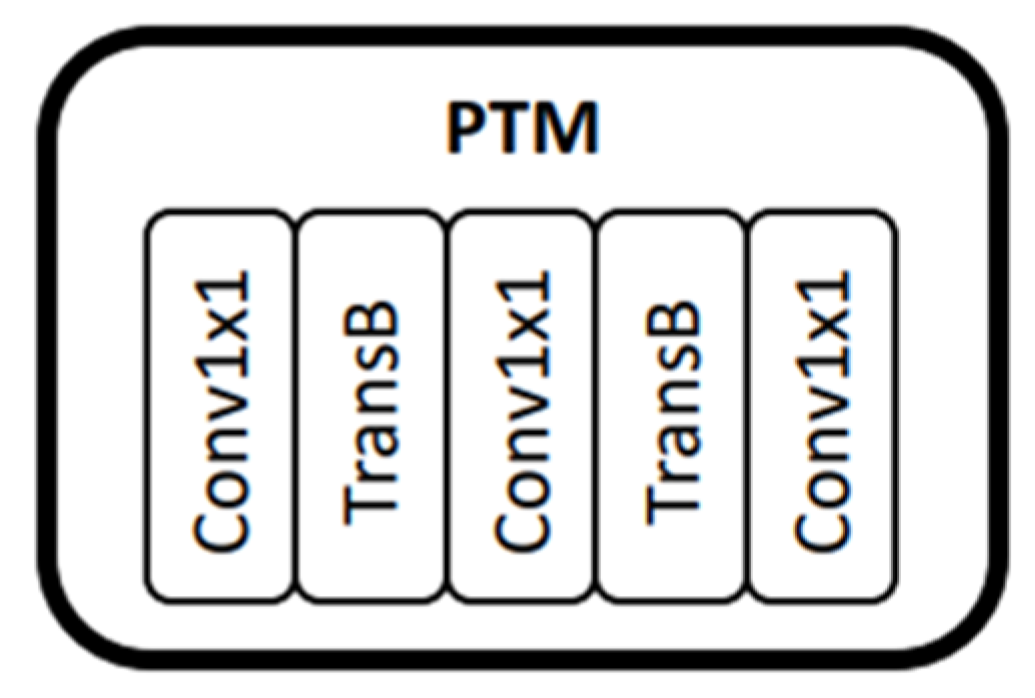
Architecture of Proposed Network. Proposed Network shares the same encoder as the Base Network. However, its decoder consists of PixelShuffle, miniASPP, and PTM modules, replacing the bilinear upsampling operations.
Figure 3.
Architecture of Proposed Network. Proposed Network shares the same encoder as the Base Network. However, its decoder consists of PixelShuffle, miniASPP, and PTM modules, replacing the bilinear upsampling operations.
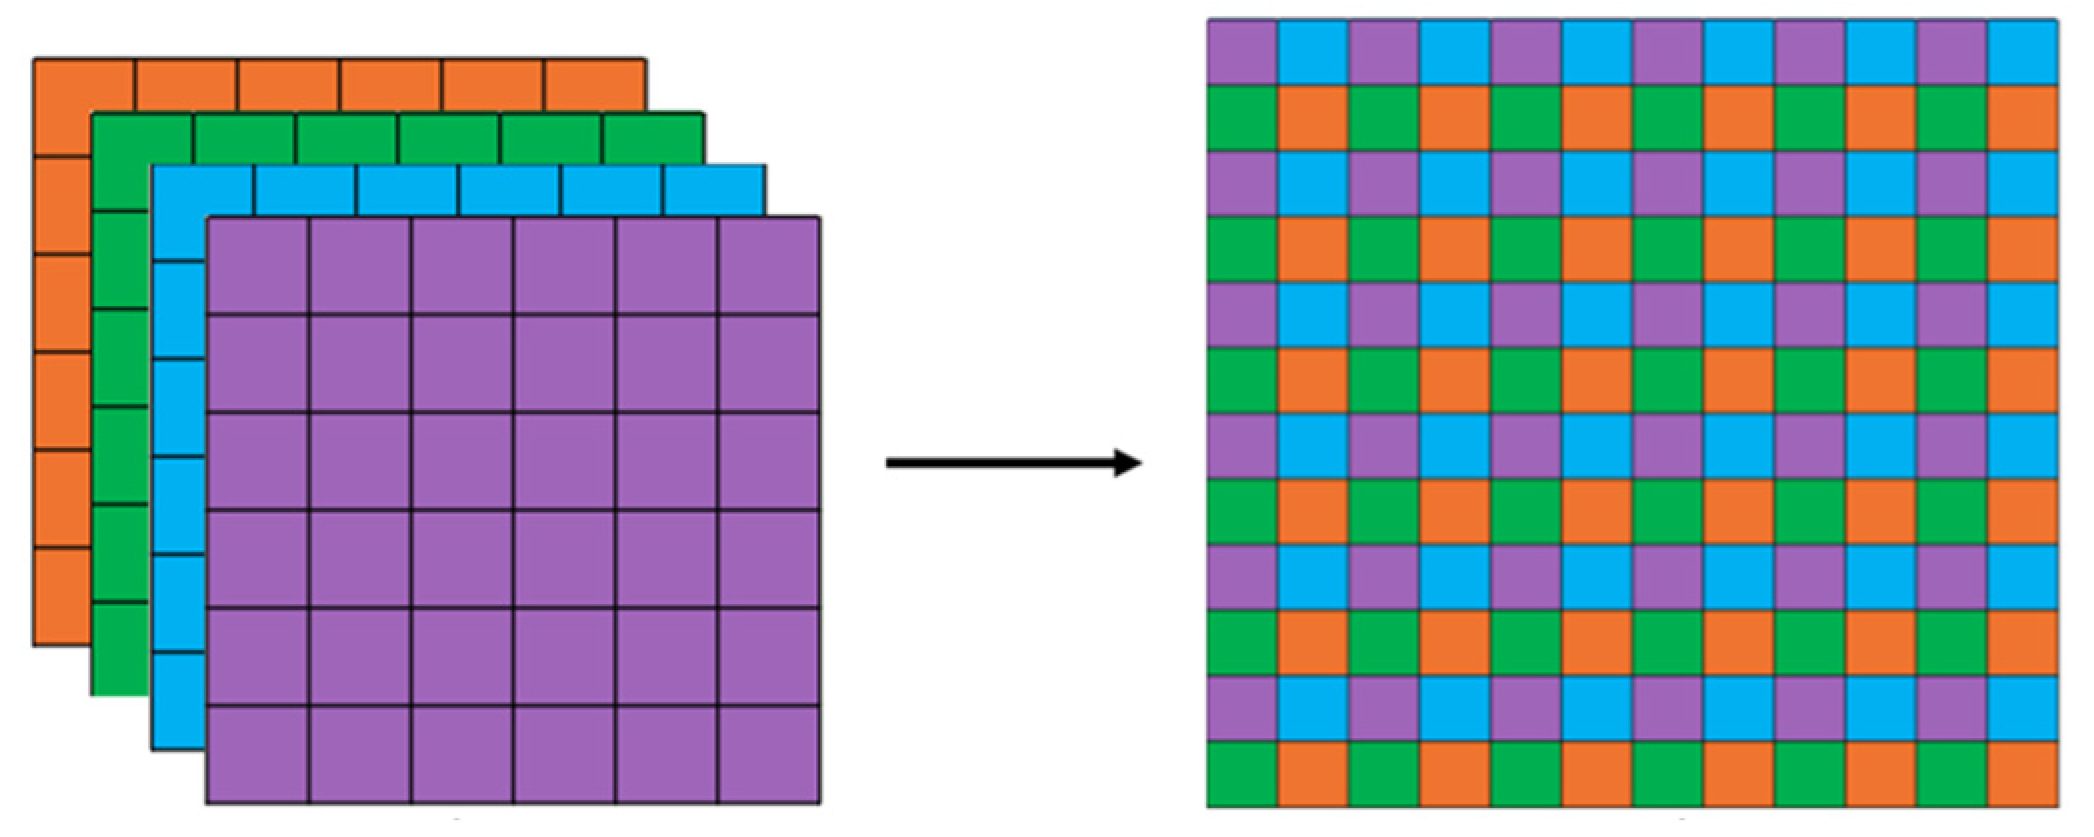
Figure 4.
Result of applying PixelShuffle to 4-channel feature map.
Figure 4.
Result of applying PixelShuffle to 4-channel feature map.
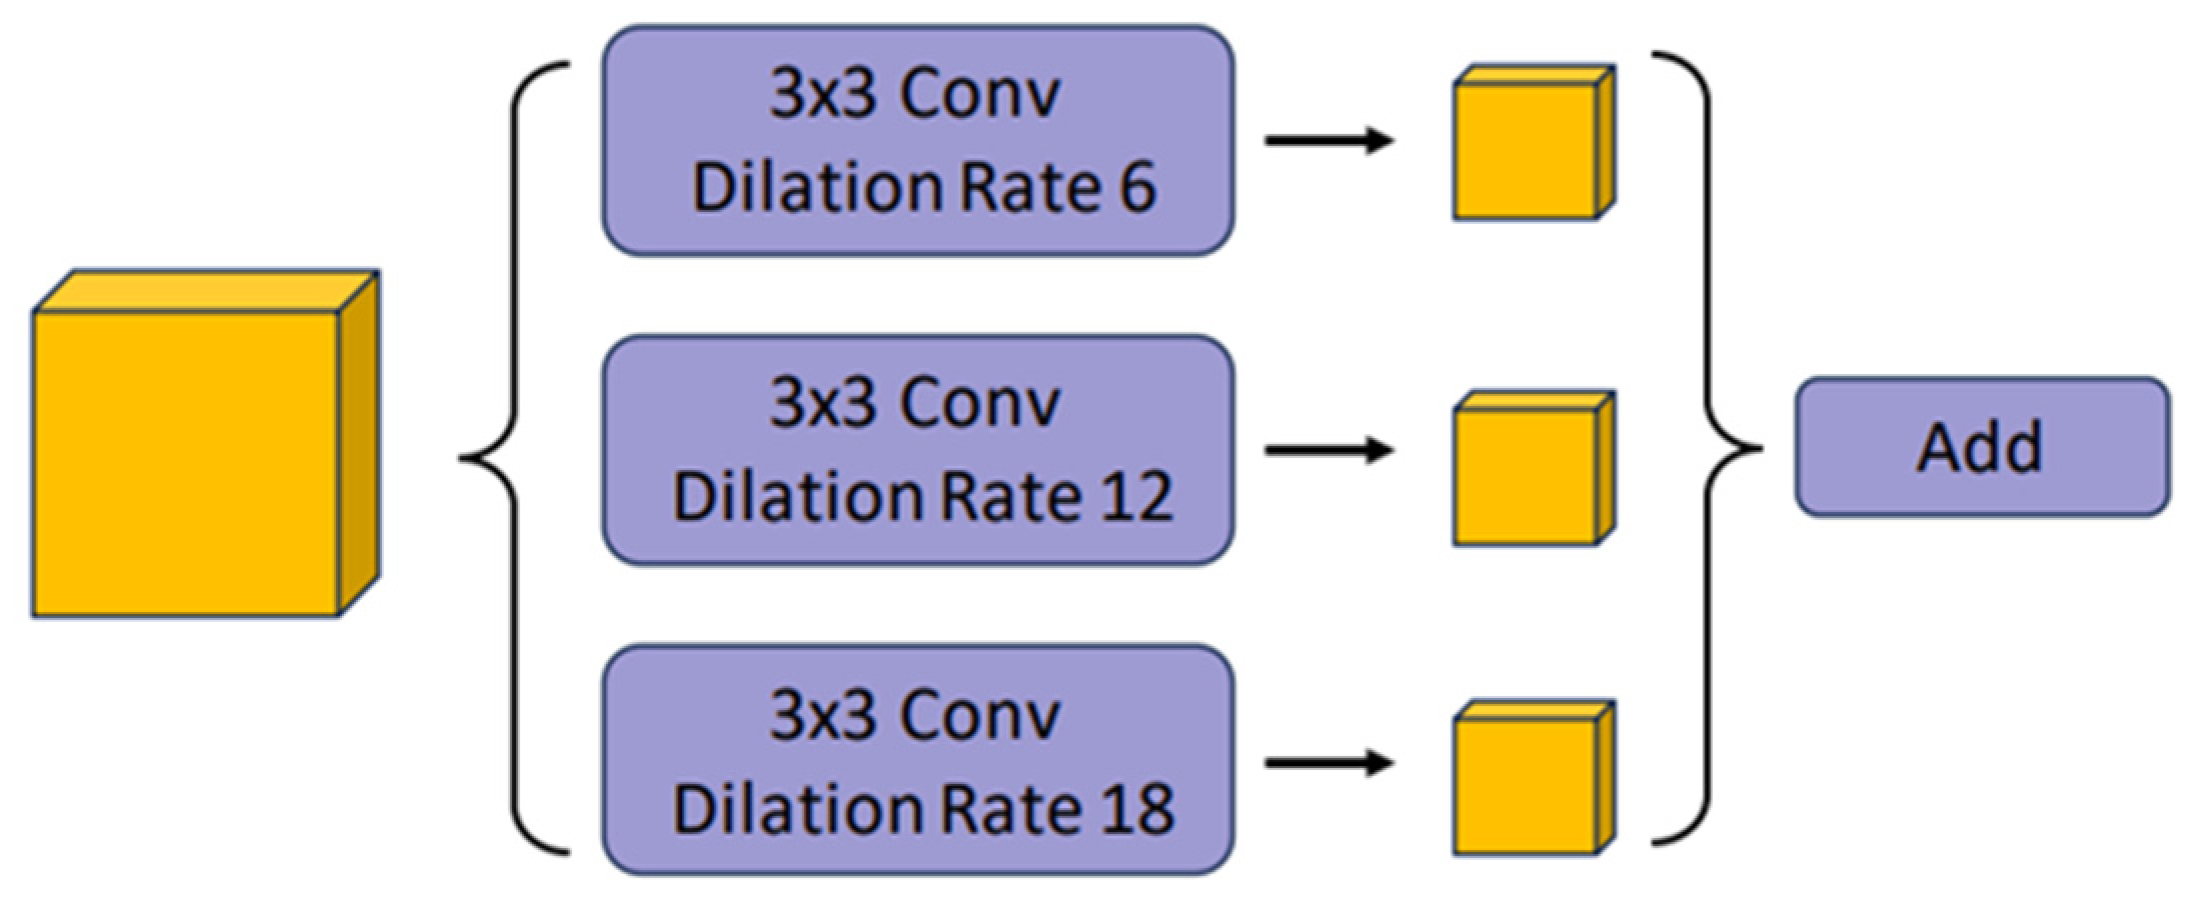
Figure 5.
Structure of miniASPP module.
Figure 5.
Structure of miniASPP module.
Figure 6.
Structure of PTM module.
Figure 6.
Structure of PTM module.
Figure 7.
Process of embedding a simplified network in QCS6490.
Figure 7.
Process of embedding a simplified network in QCS6490.
Figure 8.
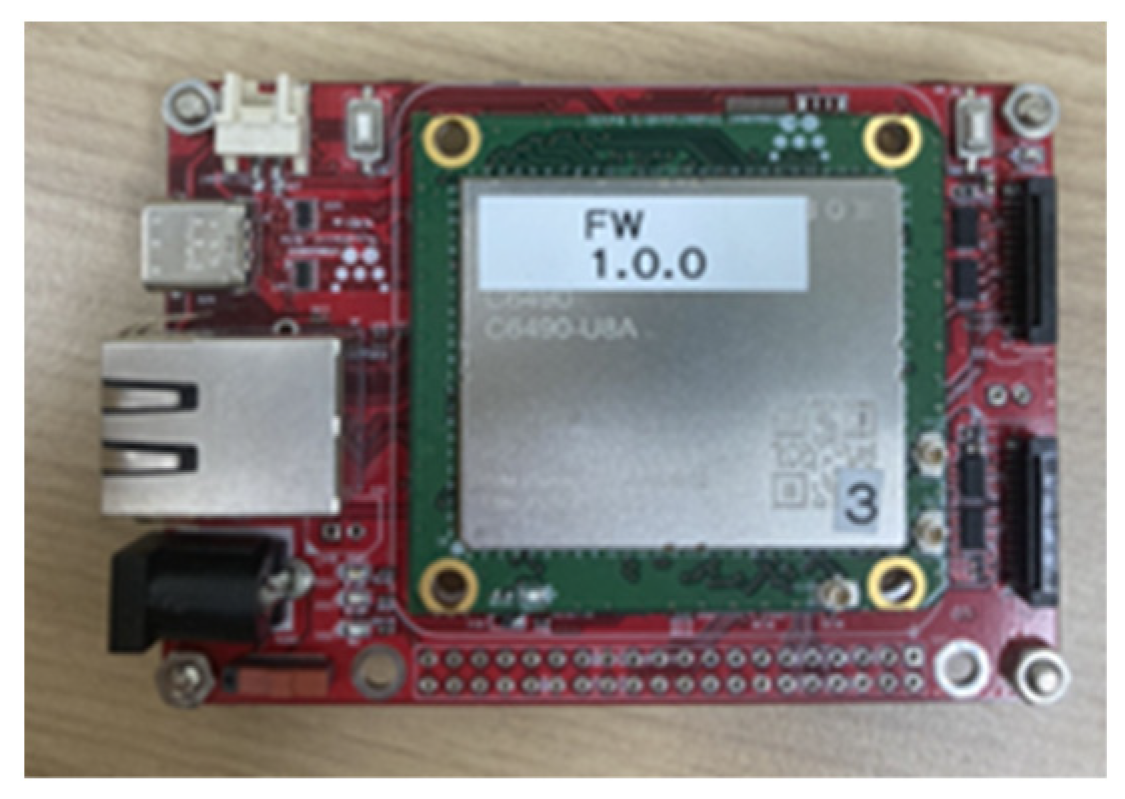
Chameleon8 board from WITHROBOT, equipped with Qualcomm’s QCS6490 SoC.
Figure 8.
Chameleon8 board from WITHROBOT, equipped with Qualcomm’s QCS6490 SoC.
Figure 9.
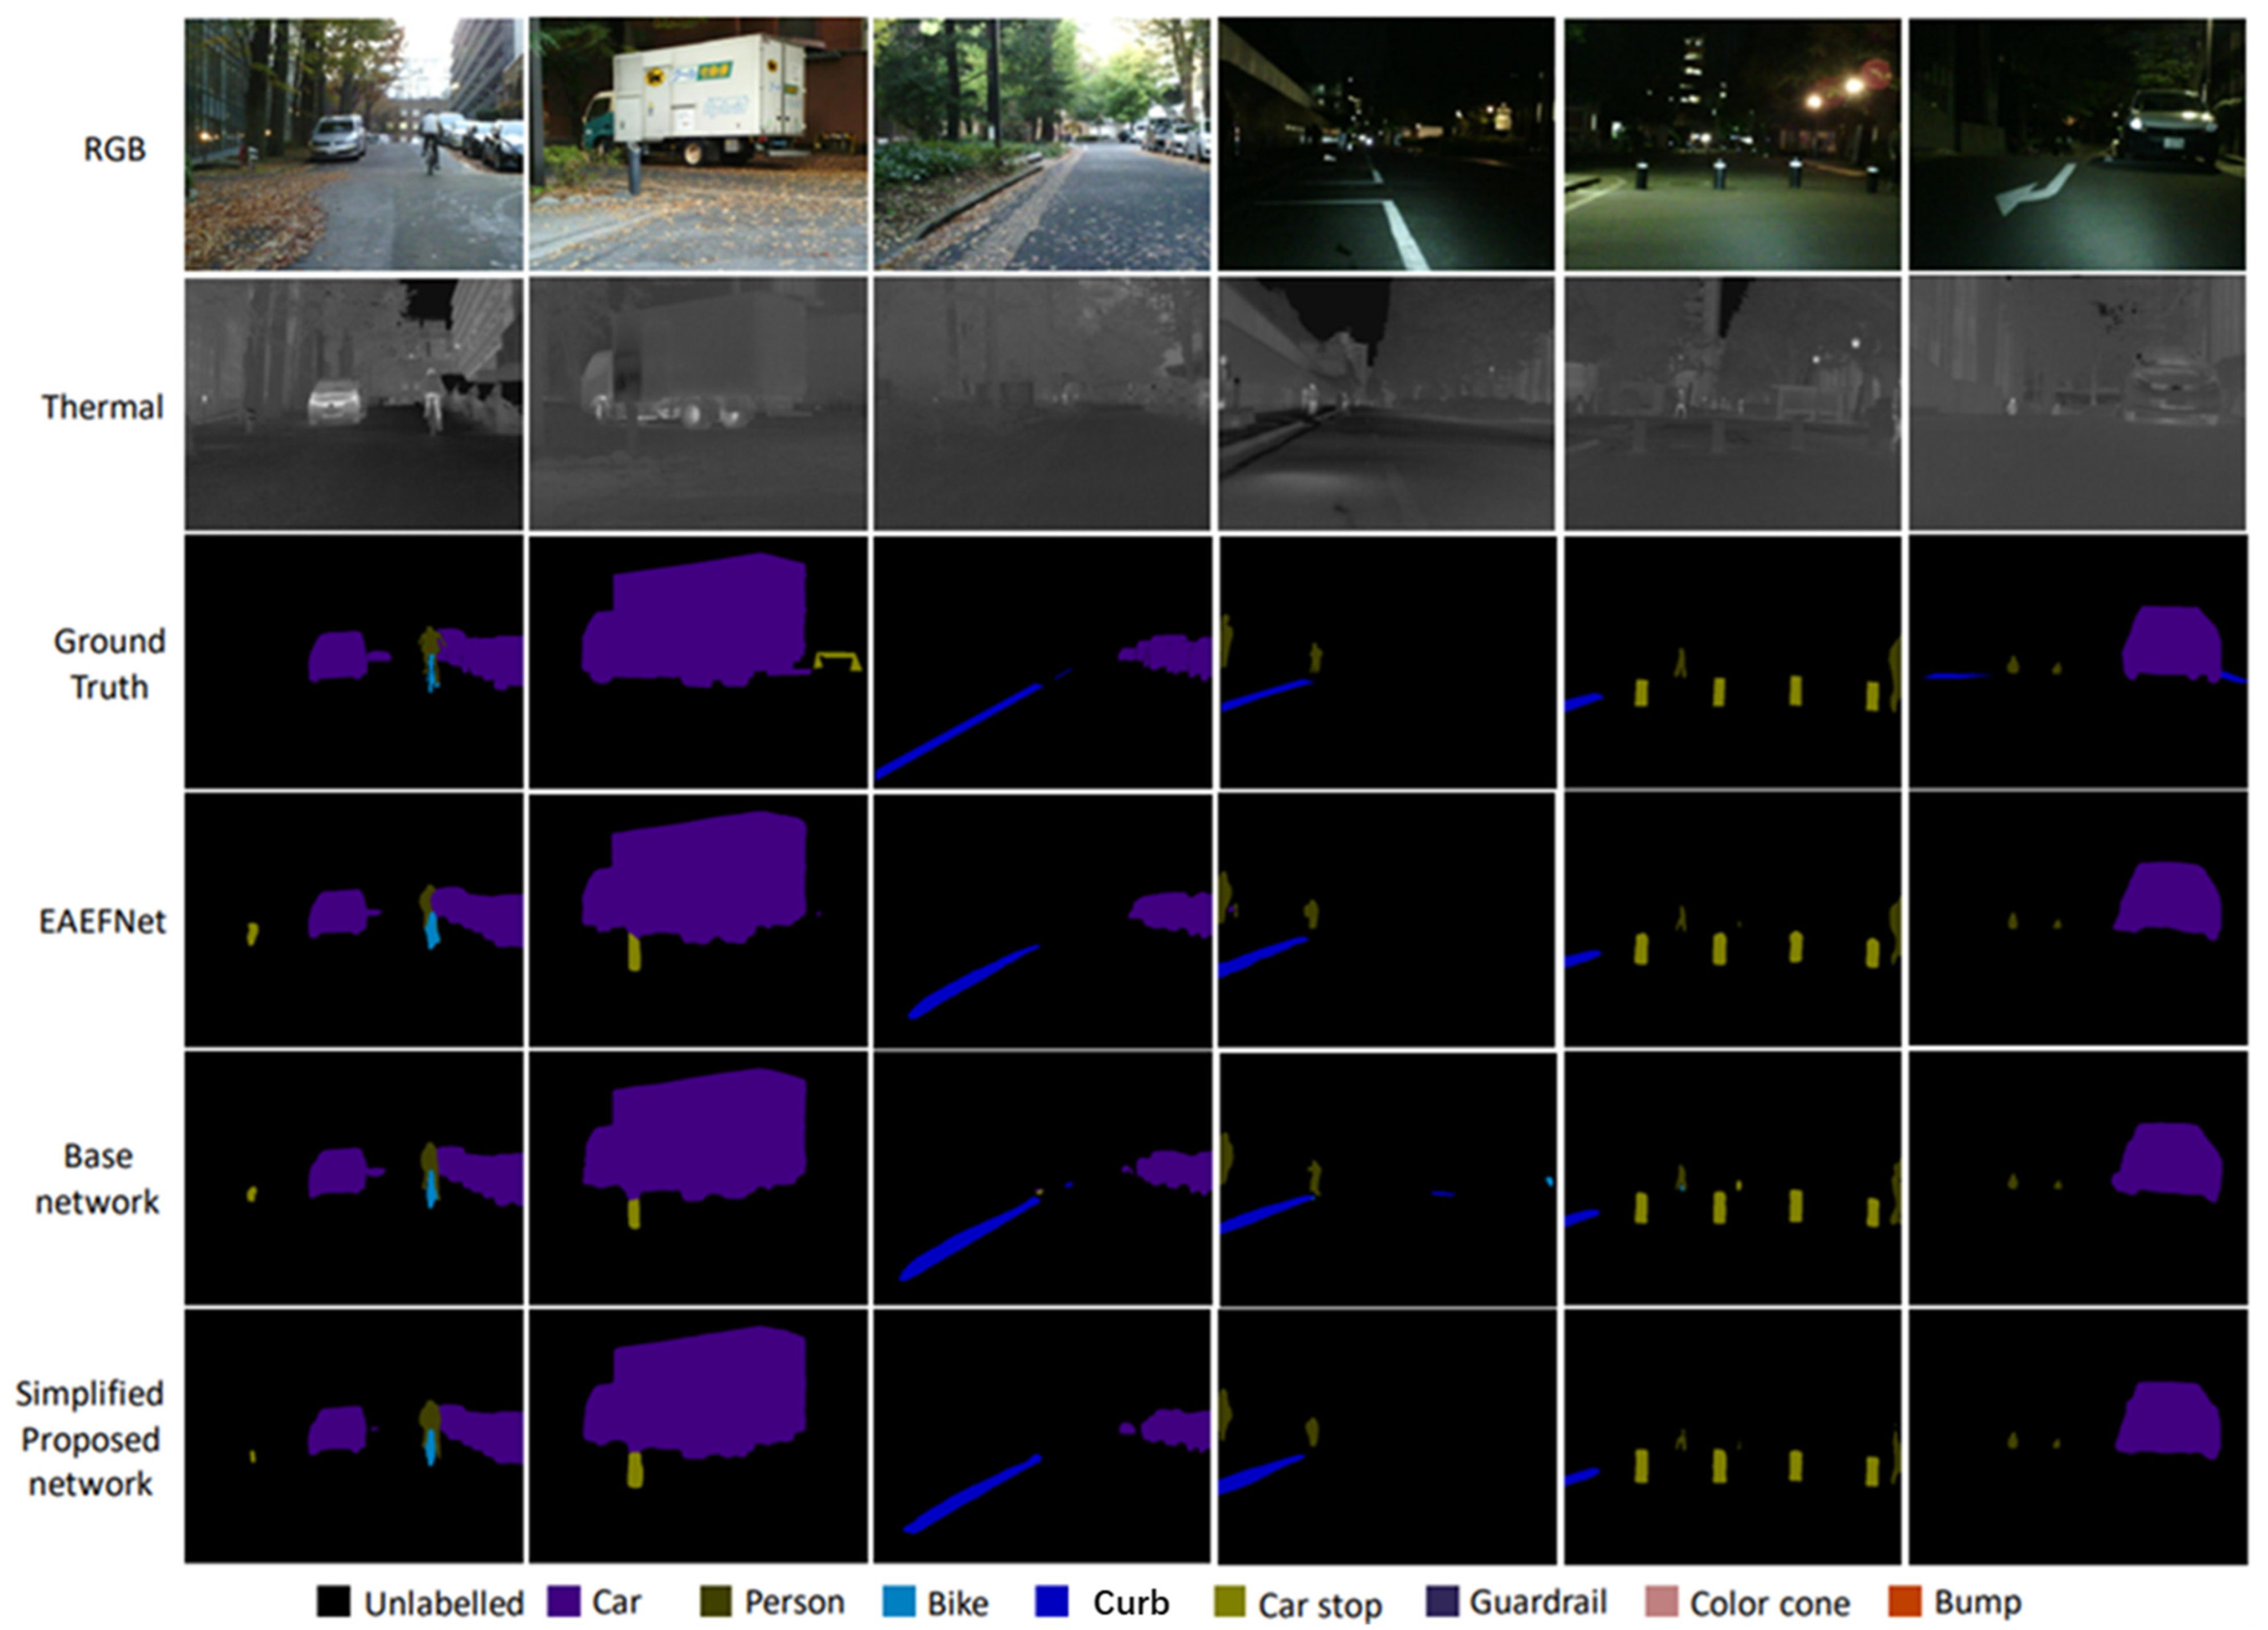
Examples of cases where EAEFNet, Base Network, and Simplified Proposed Network yield similarly good results.
Figure 9.
Examples of cases where EAEFNet, Base Network, and Simplified Proposed Network yield similarly good results.
Figure 10.
Examples of cases where EAEFNet, Base Network, and Simplified Proposed Network yield slightly different results: (a–c) for daytime input images; (d–f) for nighttime input images.
Figure 10.
Examples of cases where EAEFNet, Base Network, and Simplified Proposed Network yield slightly different results: (a–c) for daytime input images; (d–f) for nighttime input images.
Figure 11.
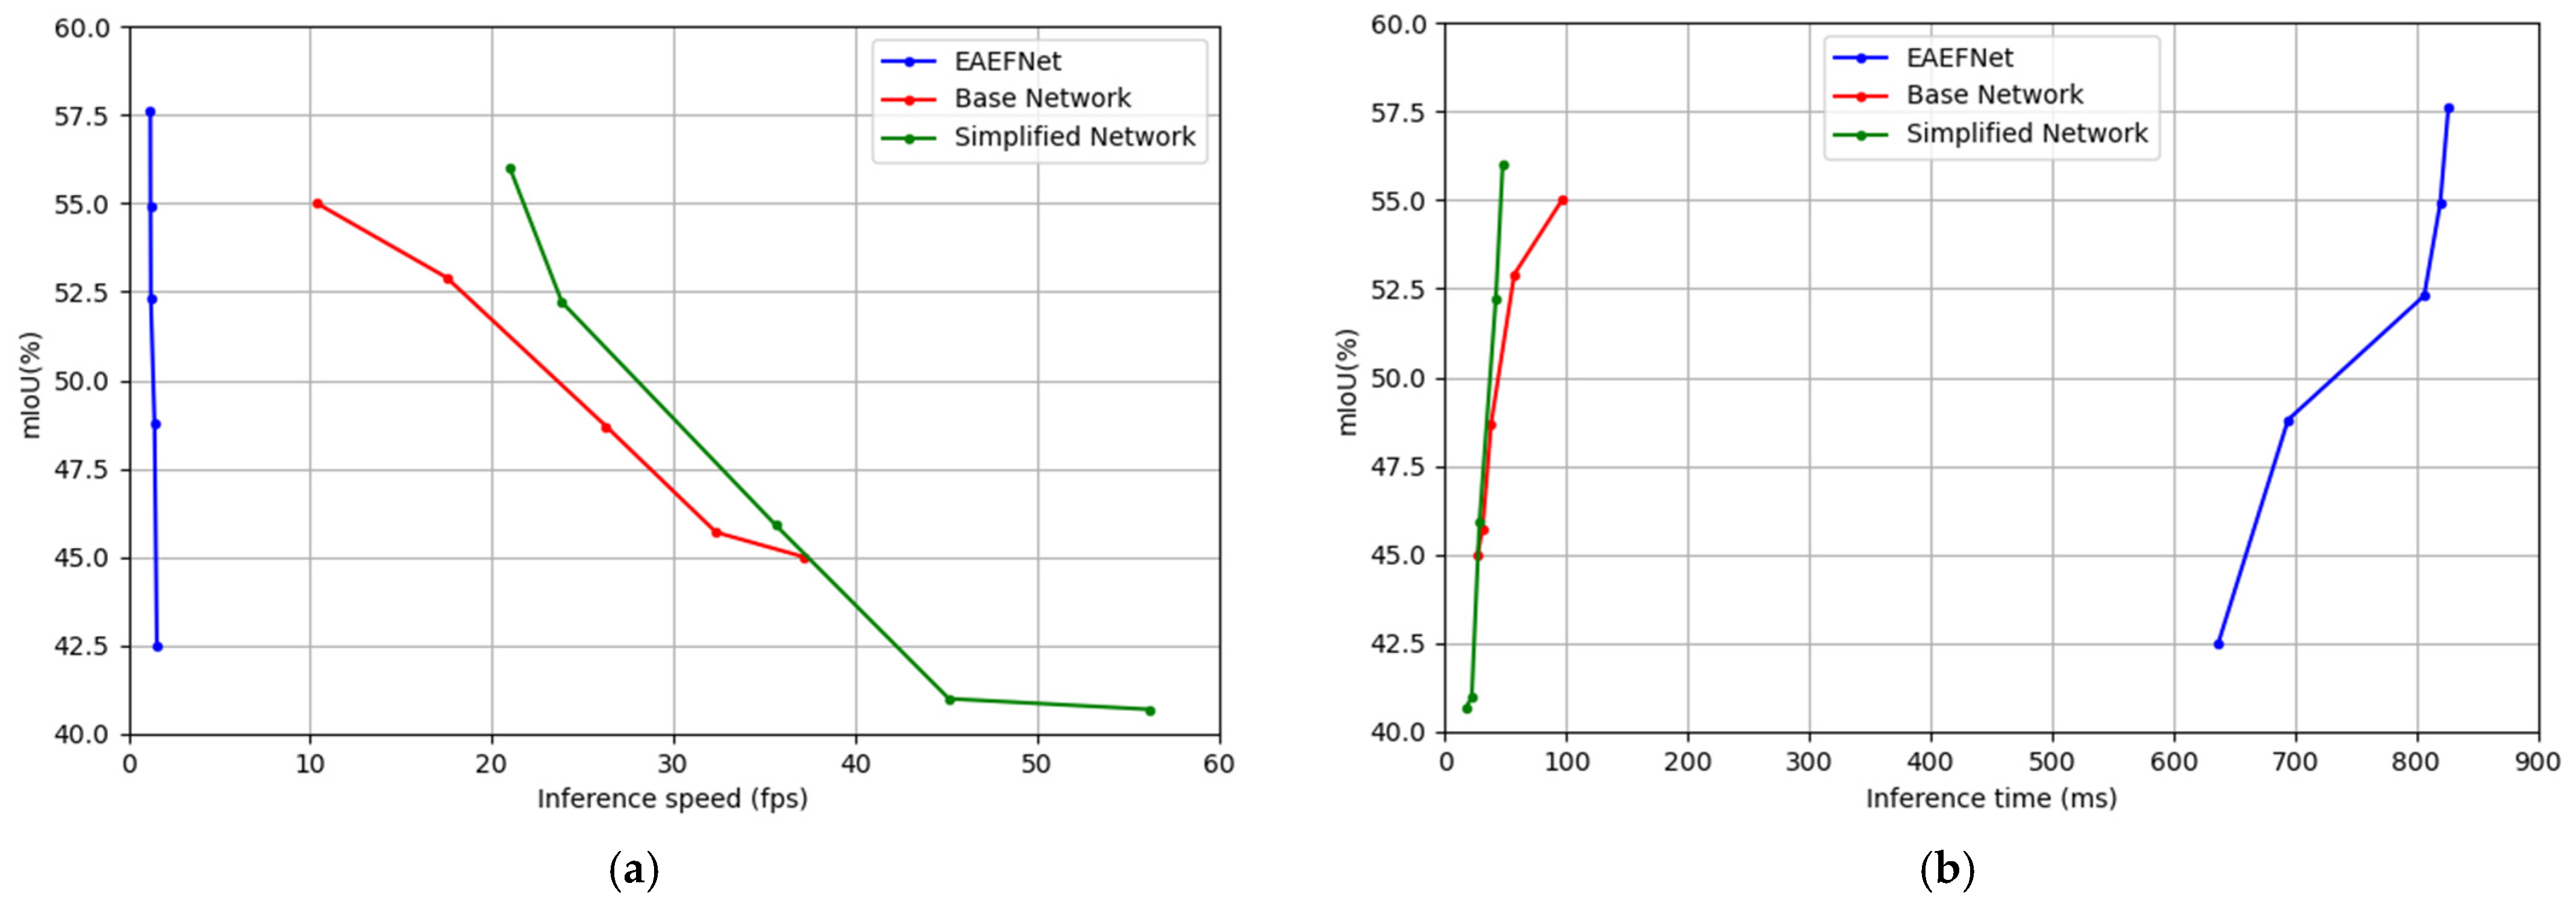
Performance comparison graphs for EAEFNet, Base Network, and Simplified Proposed Network on MFNet dataset: (a) semantic segmentation performance (mIoU) versus inference speed (fps); (b) semantic segmentation performance (mIoU) versus inference time (ms).
Figure 11.
Performance comparison graphs for EAEFNet, Base Network, and Simplified Proposed Network on MFNet dataset: (a) semantic segmentation performance (mIoU) versus inference speed (fps); (b) semantic segmentation performance (mIoU) versus inference time (ms).
Figure 12.
Segmentation results of Simplified Proposed Network after applying 4× speed pruning.
Figure 12.
Segmentation results of Simplified Proposed Network after applying 4× speed pruning.
Figure 13.
Performance comparison graphs for EAEFNet, Base Network, and Simplified Proposed Network on PST900 Dataset: (a) semantic segmentation performance (mIoU) versus inference speed (fps); (b) semantic segmentation performance (mIoU) versus inference time (ms).
Figure 13.
Performance comparison graphs for EAEFNet, Base Network, and Simplified Proposed Network on PST900 Dataset: (a) semantic segmentation performance (mIoU) versus inference speed (fps); (b) semantic segmentation performance (mIoU) versus inference time (ms).
Table 4.
Ablation study on the impact of PixelShuffle, miniASPP, and PTM modules on the performance of the Proposed Network.
Table 4.
Ablation study on the impact of PixelShuffle, miniASPP, and PTM modules on the performance of the Proposed Network.
| PixelShuffle | miniASPP | PTM | mIoU (%) |
|---|
| | | | 55.1 |
| √ | | | 56.5 |
| | √ | | 55.9 |
| | | √ | 55.2 |
| √ | √ | √ | 57.6 |
Table 5.
Performance Comparisons among Base Network, Proposed Network, and Simplified Proposed Network. (Base Network = Single encoder + U-Net decoder, Proposed Network = Single encoder + Modified U-Net decoder, Simplified Proposed Network = Single encoder + Modified U-Net decoder with 1 × 1 convolution layers).
| Network | mIoU (%) | Model Size (MB) | FPS on DSP |
|---|
| Base Network | 55.1 (+0.0) 1 | 288.9 | 10.3 (+0.0) |
| Proposed Network | 57.6 (+2.5) | 222.8 | 12.5 (+2.2) |
| Simplified Proposed Network | 56.6 (+1.5) | 112.1 2 | 20.9 (10.6) |
Table 6.
Performance comparisons among Base Network, Proposed Network, Simplified Proposed Network on QCS6490. (EAEFNet =Dual encoder + EAEFNet decoder, Base Network = Single encoder + U-Net decoder, Simplified Proposed Network = Single encoder + Modified U-Net decoder with 1 × 1 convolution layers).
| Network | mIoU (%) | Model Size (MB) | FPS | Inference Time (ms) |
|---|
| EAEFNet | 57.6 (+0.0) | 113.6 | 1.2 | 826.4 |
| Base Network | 55.0 (−2.6) | 72.2 | 10.3 | 96.5 |
| Simplified Proposed Network | 56.0 (−1.6) | 21.8 | 20.9 | 47.6 1 |
Table 7.
Performance comparisons on MFNet dataset. The best result is shown in bold font.
Table 7.
Performance comparisons on MFNet dataset. The best result is shown in bold font.
| Network | mIoU (%) |
|---|
| MFNet [2] | 39.7 |
| GMNet (ResNet50) [30] | 57.3 |
| ABMDRNet (ResNet50) [29] | 54.8 |
| FEANet (ResNet152) [28] | 55.3 |
| EAEFNet (ResNet50) [10] | 57.8 |
| Base Network (ResNet50) | 55.1 |
| Proposed Network (ResNet50) | 57.6 |
| Simplified Proposed Network (ResNet50) | 56.6 |
Table 8.
Performance of EAEFNet at different speed-up parameters of channel pruning.
Table 8.
Performance of EAEFNet at different speed-up parameters of channel pruning.
| Speed Up | mIoU (%) | Model Size (MB) | FPS | Inference Time (ms) |
|---|
| 1× (baseline) | 57.6 (−0.0) | 113.6 | 1.2 (+0.0) | 826.4 |
| 2× | 54.9 (−2.7) | 64.4 | 1.2 (+0.0) | 819.7 |
| 4× | 52.3 (−3.5) | 42.9 | 1.2 (+0.0) | 806.5 |
| 7× | 48.8 (−8.8) | 23.2 | 1.4 (+0.2) | 694.4 |
| 10× | 42.5 (−15.1) | 15.3 | 1.5 (+0.3) | 636.9 |
Table 9.
Performance of Base Network at different speed-up parameters of channel pruning.
Table 9.
Performance of Base Network at different speed-up parameters of channel pruning.
| Speed Up | mIoU (%) | Model Size (MB) | FPS | Inference Time (ms) |
|---|
| 1× (baseline) | 55.0 (−0.0) | 72.2 | 10.3 (+0.0) | 96.5 |
| 2× | 52.9 (−2.1) | 35.3 | 17.5 (+7.2) | 57.1 |
| 4× | 48.7 (−6.3) | 18.0 | 26.2 (+15.9) | 38.1 |
| 7× | 45.7 (−9.3) | 9.3 | 32.3 (+22.0) | 30.9 |
| 10× | 45.0 (−10.0) | 6.7 | 37.2 (+26.9) | 26.9 |
Table 10.
Performance of Simplified Proposed Network at different speed-up parameters of channel pruning.
Table 10.
Performance of Simplified Proposed Network at different speed-up parameters of channel pruning.
| Speed Up | mIoU (%) | Model Size (MB) | FPS | Inference Time (ms) |
|---|
| 1× (baseline) | 56.0 (−0.0) | 28.1 | 20.9 (+0.0) | 47.6 |
| 2× | 52.2 (−3.8) | 15.3 | 23.8 (+2.9) | 41.9 |
| 4× | 45.9 (−10.1) | 8.0 | 35.6 (+14.7) | 28.4 |
| 7× | 41.0 (−15.0) | 4.8 | 45.1 (+24.2) | 22.1 |
| 10× | 40.7 (−15.3) | 3.9 | 56.1 (+35.2) | 17.8 |
Table 11.
Performance comparisons among EAEFNet, Base Network, Proposed Network, and Simplified Proposed Network on PST900 dataset. The best result is shown in bold font.
Table 11.
Performance comparisons among EAEFNet, Base Network, Proposed Network, and Simplified Proposed Network on PST900 dataset. The best result is shown in bold font.
| Network | mIoU (%) on Desktop | mIoU (%) on DSP | Model Size (MB) | FPS on DSP |
|---|
| EAEFNet | 82.9 (+0.0) | 79.8 (+0.0) | 113.9 | 1.2 (+0.0) |
| Base Network | 80.2 (−2.7) | 79.7 (−0.1) | 72.3 | 10.7 (+9.5) |
| Proposed Network | 81.7 (−1.2) | 81.2 (+1.4) | 55.8 | 13.1 (+11.9) |
| Simplified Proposed Network | 79.2 (−3.7) | 78.6 (−1.2) | 28.1 | 22.8 (+21.6) |
