Article

Hippopotamus Optimization-Sliding Mode Control-Based Frequency Tracking Method for Ultrasonic Power Supplies with a T-Type Matching Network

School of Electrical & Electronic Engineering, Hubei University of Technology, Wuhan 430068, China
*
Author to whom correspondence should be addressed.
Electronics 2025, 14(17), 3358; https://doi.org/10.3390/electronics14173358
Submission received: 22 July 2025 / Revised: 18 August 2025 / Accepted: 22 August 2025 / Published: 24 August 2025
(This article belongs to the Special Issue Advanced Intelligent Methodologies for Power Electronic Converters)

Abstract

The ultrasonic power supply constitutes the core component of an ultrasonic welding system, and its main function is to convert the industrial frequency electricity into resonant high-frequency electricity in order to achieve mechanical energy conversion. However, factors such as changes in ambient temperature or component aging may cause the resonant frequency of the transducer to drift, thus detuning the resonant system and seriously affecting system performance. Therefore, an ultrasonic welding system requires high-frequency tracking in real time. Traditional frequency tracking methods (such as acoustic tracking, PID control, etc.) have defects such as poor stability, narrow bandwidth, or cumbersome parameter setting, making it difficult to meet the demand for fast tracking. To address these problems, this study adopts a T-matching network and utilizes sliding mode control for frequency tracking. In order to solve the problems of slow convergence and obvious jitter in sliding mode control (SMC), a Hippopotamus Optimization (HO) algorithm is introduced to simulate hippopotamuses’ group behavior and predation mechanisms, thereby optimizing the control parameters. It is verified through simulation that the SMC algorithm optimized by the HO algorithm (HO-SMC) is able to suppress frequency drift more effectively and demonstrates the advantages of fast response, high accuracy, and strong robustness in the scenario of sudden load changes.

1. Introduction

The ultrasonic power supply is the core component of ultrasonic welding systems, and its core function is to convert the industrial frequency alternating current into a high-frequency alternating current with a resonance frequency that matches that of the transducer, and then convert the electrical energy into mechanical energy through the transducer to complete the ultrasonic welding process [1,2,3,4]. To achieve optimal energy conversion efficiency in ultrasonic welding systems, the output frequency of the ultrasonic power supply must match the resonant frequency of the transducer, i.e., the system must operate at resonance [5,6]. However, in practice, the resonant frequency point of the ultrasonic system can shift due to the different operating conditions of ultrasonic loads [7,8]. Ultrasonic welding systems in precision manufacturing applications, such as welding batteries for new energy vehicles and semiconductor packaging, typically require the completion of single-point welds within 0.1–0.5 s. In the case of lithium copper–aluminum lug welding, for example, a welding frequency deviation of more than ±0.05% may produce false welding or weld-through defects, resulting in the loss of a single battery scrap. Especially in high-speed automated production lines, the system needs to complete frequency tracking within 0.02 s to match sudden changes in the material thickness. Therefore, it is imperative to enhance the automatic frequency tracking capability of ultrasonic power supplies [9,10].
To address the frequency tracking issue, academia has proposed various solutions: the admittance locking technology developed by B. Mortimer’s team [11] can accurately track the optimal power conversion frequency of the transducer; ZHU Wu et al. [12] innovatively adopted a phase-current dual-parameter criterion to identify the resonant state of the system and verified the effectiveness of this method on a 20 kHz ultrasonic plastic welding machine; the current feedback method proposed by H. Dong et al. [13] can quickly lock the parallel resonant frequency of the transducer, and it exhibits excellent stability; T. Suzuki et al. [14] achieved intelligent matching between the output impedance of the inverter and the load resonant frequency by designing a high-performance output transformer; C. Wei et al. [15] developed an automatic impedance matching circuit integrated with a frequency tracking function; and Z. Zhang et al. [16] successfully designed and tested an ultrasonic transducer system operating at 135 kHz based on the PID control principle. Each of these methods has its advantages and disadvantages: the phase difference method and the electrical tracking method are simple to implement but less stable; the frequency band of the phase-locked loop frequency tracking method is narrower, and it is easy to lose the lock when the power supply starts up; the matched inductance regulation increases the topological complexity of the main circuit and sacrifices the control accuracy of the system; and the classical PID control method is more cumbersome in parameter calibration, cannot operate in real time, lacks robustness, and is unable to adjust the parameters adaptively according to external changes, making it difficult to meet the demand of an ultrasonic power supply for fast frequency tracking.
In the era of industrial intelligence, the use of intelligent algorithms to study such problems has become a research hotspot. For the frequency tracking problem, ref. [17] uses fuzzy PID control, which combines the fuzzy control strategy with PID control to make up for the shortcomings of traditional PID control. However, the formulation of the quantization factor and proportionality factor in fuzzy PID control often relies on artificial experience, which limits its optimization effect to a certain extent. Advanced control theories and algorithms, such as BP neural network predictive control [18], particle swarm control [19], and closed-loop DDS control [20], have been gradually integrated into ultrasonic welding systems to address the limitations of PID controllers in multivariable, nonlinear, and strongly coupled systems. Yinghua Hu et al. [21] achieved frequency tracking and amplitude control through a voltage-sensing bridge, ensuring that the automatic frequency tracking was unaffected by environmental and load variations while maintaining precise mechanical functionality. Jeonghoon Moon et al. [22] proposed a novel high-speed resonant frequency tracking (RFT) method, enabling ultrasonic systems to accurately track the mechanical resonant frequency of piezoelectric transducers (PTs) within a short time period.
Among the many control algorithms, sliding mode control is widely used due to its robustness, fast response, and direct implementation without online identification [23]. However, the method still has inherent shortcomings, including insufficient convergence speed, difficulty in determining the upper bound of perturbation, and a significant vibration jitter phenomenon [24]. To address these limitations, researchers have developed a variety of improvement schemes, such as a higher-order sliding mode control technique to effectively suppress jitter [25], delayed fractional-order reaction–diffusion amnestic neural network control [26], ship longitudinal rocking motion prediction algorithms [27], and non-singular fast terminal control combined with a dual-observer design [28], among others. It is worth noting that although sliding mode control has been successfully applied in ultrasonic power supply power regulation [29], it has rarely been practiced in the field of frequency control. This mainly stems from the fact that ultrasonic welding systems require extremely high real-time accuracy of frequency tracking, and the existing sliding mode control scheme does not yet fully meet the practical requirements in terms of dynamic response speed and anti-interference robustness.
To address the above issues, consideration has been given to adopting intelligent optimization algorithms to improve the control strategy for reducing system chattering. The Hippopotamus Optimization algorithm, an intelligent optimization algorithm, is characterized by fast convergence speed and high solution accuracy [30]. It is able to efficiently search for the global optimal solution and avoid falling into local minima by simulating the group behavior, predator behavior, and local trap handling mechanism of hippopotamuses. The method is suitable for complex optimization problems with a high speed of convergence and a global search capability. References [31,32] show that, compared with algorithms such as RIME, DE, and PSO, HO exhibits the characteristics of fast convergence and excellent optimization performance, which provides strong support for its application in the field of frequency control to improve control effects.
In this study, firstly, the piezoelectric transducer and matching network are analyzed. Next, a kind of T-type matching network is used, and the voltage difference method is used to determine whether the transducer is operating at the resonance frequency. Finally, sliding mode control is used to track the series resonance frequency, and the HO algorithm optimizes the sliding mode control to achieve a wide tracking range, high accuracy, fast control speed, and minimal overshoot, and its feasibility is confirmed by simulation experiments.

2. Analysis of the PT and Matching Network

2.1. Equations for the Piezoelectric Transducers Equivalent Model

Piezoelectric transducers (PTs) are energy conversion devices capable of transforming high-frequency electrical signals into high-frequency vibrational acoustic wave signals, thereby achieving electrical-to-mechanical energy conversion [33,34]. In the application of ultrasonic technology, transducers are primarily categorized as magnetostrictive transducers or PTs.
PTs are inherently capacitive and are classified as non-linear capacitive loads [35]. Figure 1 includes the ultrasonic power supply schematic and the equivalent circuit, where L1 is the dynamic inductance determined by the vibrating mass of the PT, C1 is the dynamic capacitance corresponding to the mechanical compliance, R1 characterizes the dynamic resistance reflecting the mechanical system losses, and C0 is the static capacitance determined by the dielectric constant of the piezoelectric ceramic and the electrode dimensions. The series branch composed of L1, C1, and R1 shows parameter variability under operating conditions, while the parallel branch containing C0 remains stable during practical operation. Prior to the implementation of the PT, impedance analyzers are typically used to measure these equivalent parameters for accurate resonant frequency determination. Diodes VD1 to VD4 form a single-phase uncontrolled rectifier circuit; inductor L and capacitor C constitute a filter circuit; power switches VT2 to VT4 are IGBTs, with D5 to D8 as anti-parallel diodes, C5 to C8 as snubber capacitors, and R5 to R8 as snubber resistors, and T is a high-frequency transformer; together, these form a phase-shifted full-bridge inverter circuit.
This study takes a 20 kHz PT with the model number NK19110601 as the research subject. It is manufactured by HYUSONIC, located in Kunshan, China. The parameters of this PT under static conditions, measured using an impedance analyzer, are presented in Table 1. It should be noted that since this PT is a custom-made component, there is no publicly available literature or product manuals for reference, and the measured data in the table are derived from laboratory tests. These equivalent circuit parameters will be used in subsequent sections for constructing the PT model.
Based on the PT’s equivalent circuit, its equivalent impedance can be expressed as follows:
Z = R + j X = 1 j ω C 0 + 1 j ω L 1 + R 1 + 1 j ω C 1
Simplifying the above equation yields its real part, R, as follows:
R = R 1 1 ω C 0 ω L 1 1 ω C 1 2 + ω 2 C 0 2 R 1 2
where the imaginary part X is
X = ω L 1 1 ω C 1 ω C 0 R 1 2 + ω L 1 1 ω C 1 2 1 ω C 0 ω L 1 1 ω C 1 2 + ω 2 C 0 2 R 1 2
From the PT’s equivalent circuit, it can be observed that there are two resonant frequency points: the parallel resonant frequency fp and the series resonant frequency fs.
When the PT operates at the series resonant frequency fs, its equivalent resistance and equivalent reactance are given by the following:
R s = R 1 1 + ( ω s C 0 R 1 ) 2 C s = C 0 + R 1 ω s 2 C 0 R 1 2
In the formula, R s represents equivalent resistance, C s represents equivalent reactance, and ωs represents the period at the series resonant frequency.
When the PT operates at the parallel resonant frequency fp, its equivalent resistance and equivalent reactance can be expressed as follows:
R p = 1 ω p 2 C 0 2 R 1 C p = C 0
In the formula, R p represents equivalent resistance, C p represents equivalent reactance, and ωp represents the period at the series resonant frequency.
Given that the static capacitance C0 has a value of 4.5 nF, the equivalent resistance at series resonance is significantly smaller than that at parallel resonance. As a result, the PT’s ability to acquire electrical energy during series resonance is substantially greater than during parallel resonance. When the PT operates at series resonance, it achieves maximum output power. Therefore, this study selects the series resonance frequency as the target point for frequency tracking.
When the PT operates at the series resonance point, its series branch exhibits purely resistive behavior. However, due to the presence of the static capacitance C0, the PT still retains capacitive characteristics. In order to avoid a low power factor in the overall system output, it is necessary to design an appropriate matching circuit between the ultrasonic drive power supply and the PT. This matching circuit is essential to counteract the effects of the capacitive load and thereby improve the stability of the control system operation [36].

2.2. Matching Network

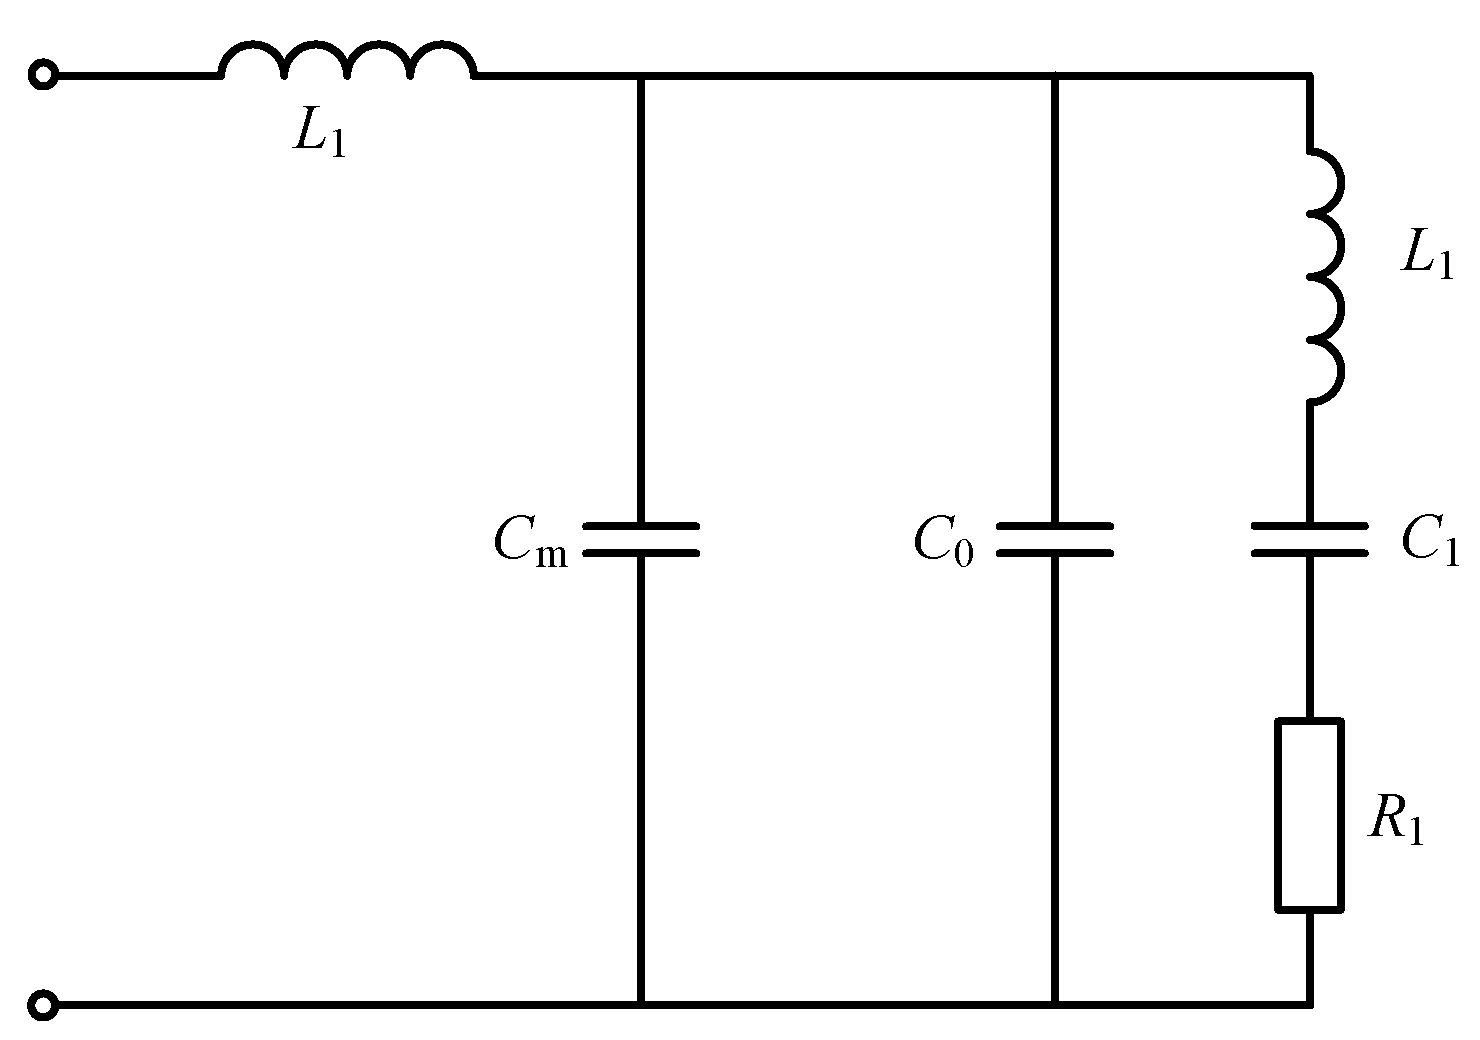
A matched network connection between the drive power supply and the PT is essential for the efficient and stable operation of the ultrasound system. As mentioned above, PTs operating at series resonant frequencies exhibit resistive and capacitive characteristics. A matching network must be designed to compensate for the capacitance, a process called tuning, in order to improve the efficiency of the energy transfer [33]. The commonly used inductor–capacitor (LC) matching network is shown in Figure 2, where L1 is the matching inductor and Cm is the matching capacitor, which can reduce the equivalent resistance while providing active impedance regulation. It also effectively filters harmonic components in the output of the ultrasonic power supply, improving the purity of the PT voltage waveform.
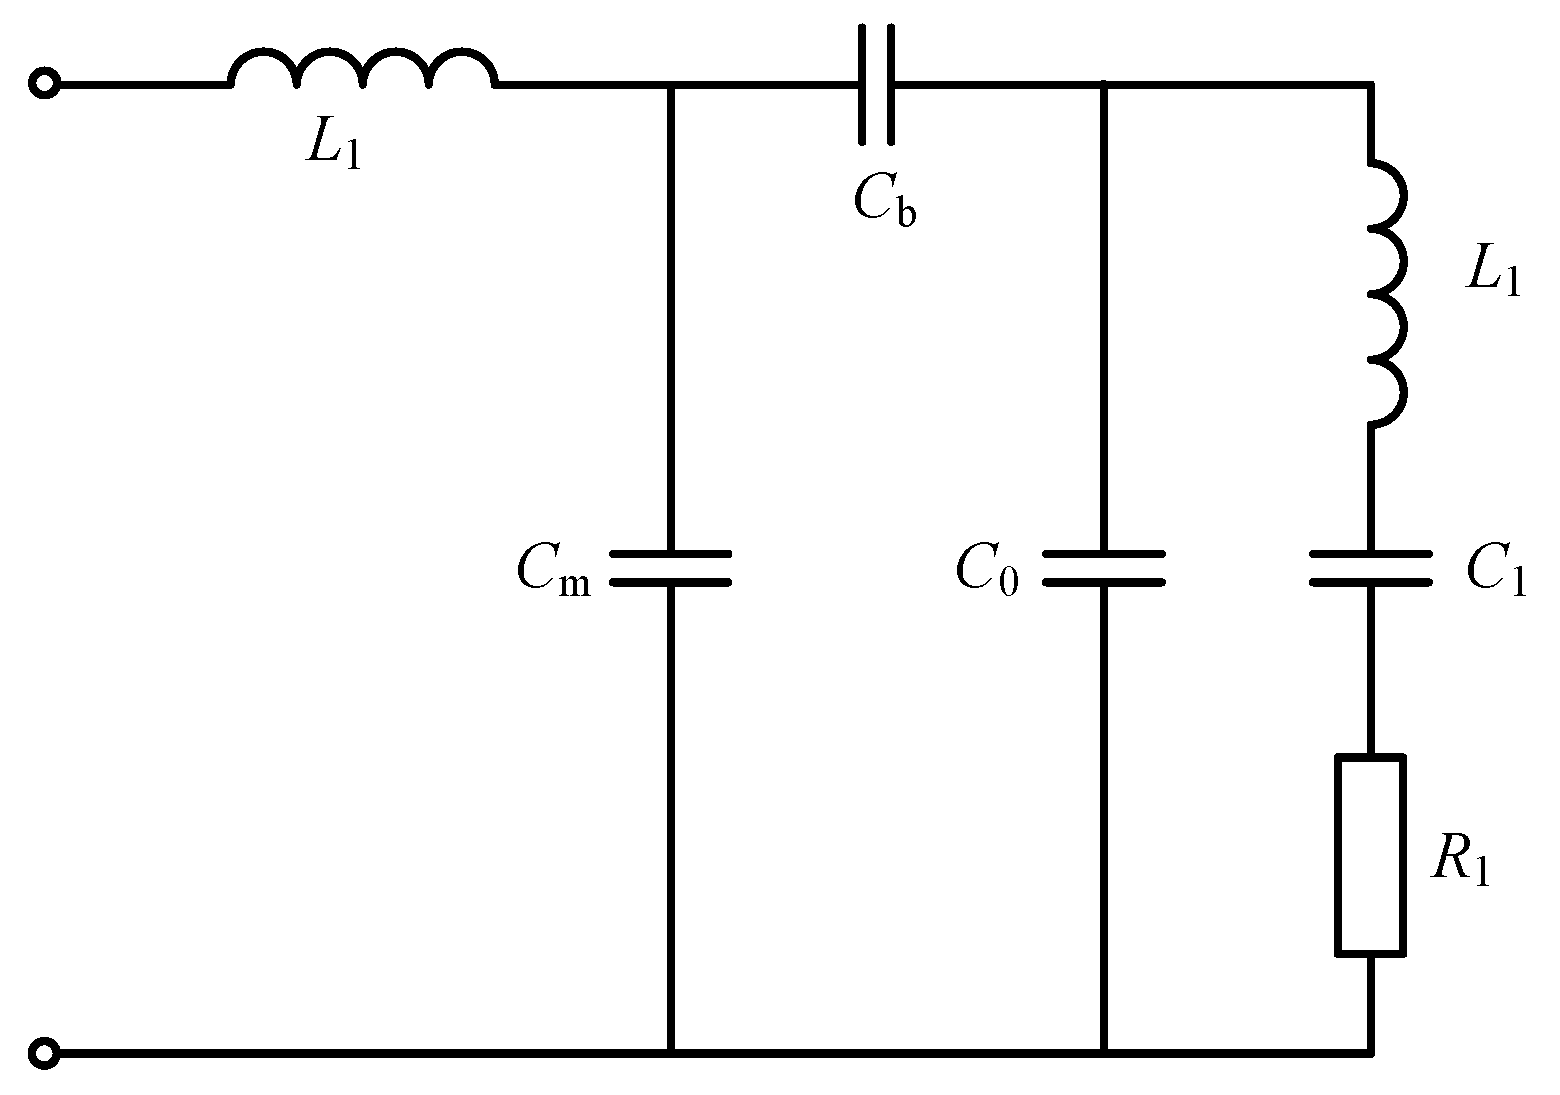
As LC matching exhibits excellent varistor performance and a better filtering effect [37], and in order to analyze the dynamic branch in an indirect way through the matching network, this study adopts a kind of T-type matching network. That is, in the middle of the LC matching circuit and the PT, we add an additional matching capacitance Cb, which inherits the advantages of the LC matching circuit while at the same time has a better varistor performance. Figure 3 shows the network after the improvement of the LC matching circuit, where L1 is the matching inductor and Cb and Cm are the matching capacitors.

3. Tracking Method

3.1. Principle of the Voltage Difference Method

The T-type matching network employed in this study is illustrated in Figure 3. By splitting the capacitor in the diagram into a series combination of capacitors C2 and C4, the matching network can be transformed into the configuration shown in Figure 4 [38].
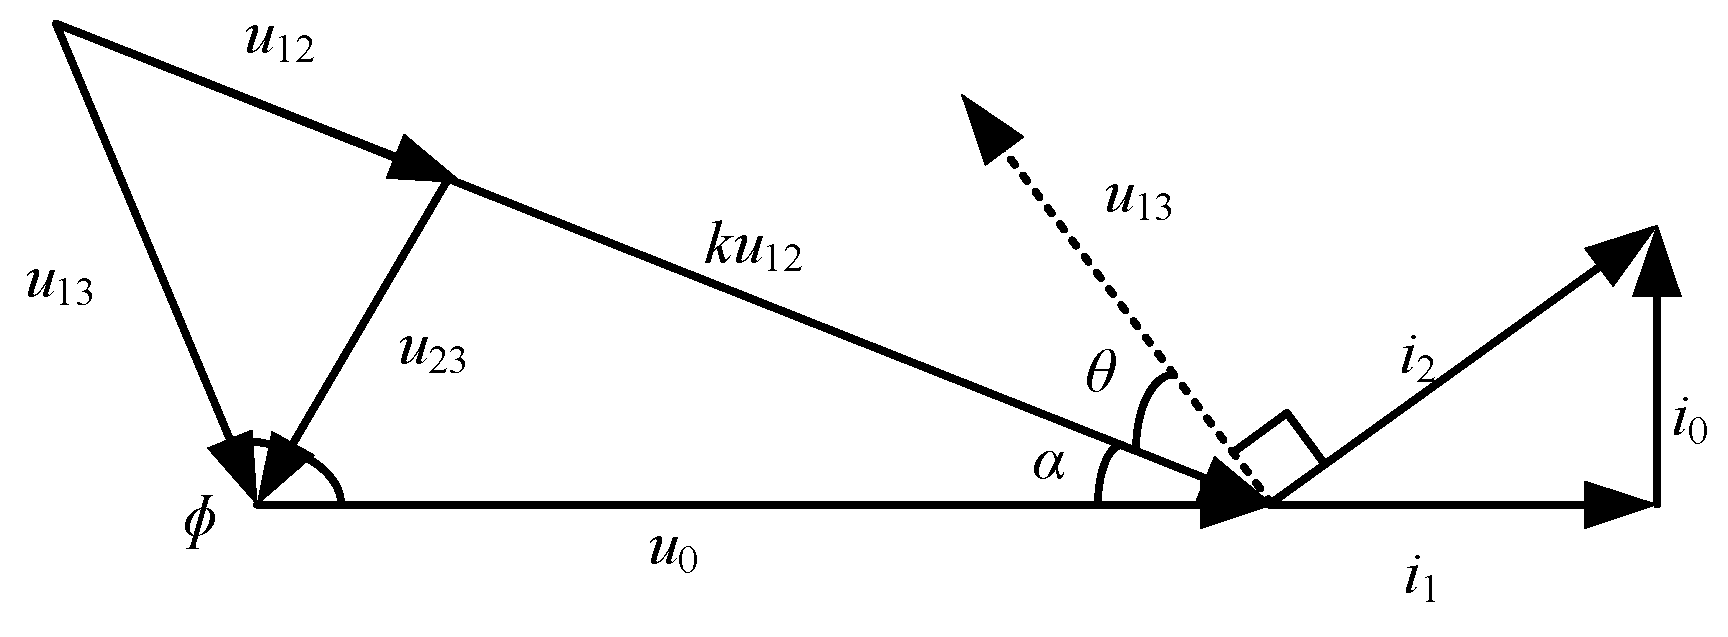
In Figure 4, u0 is the voltage on the PT; i0, i1, and i2 are the PT parallel branch current, the series branch current, and the total current, respectively; u12, u13, and u23 are the voltages between the two points of endpoints 1, 2, and 3 in the matching circuit, respectively (the reference direction of the voltages is specified in Figure 5); and uc is the sum of the voltages on the matching capacitors C2 and C4. For ease of derivation, let uc = ku12.
The principle can be further explained as follows: When the series branch of the PT is in resonance, the voltage u0 and the current i1 become parallel, and the currents i0, i1, and i2 form a right-angled triangle. Figure 5 illustrates the phase relationships of the variables in the circuit.
From the phase relationships of the vectors, it can be readily deduced that
i 2 sin ( 90 ° α θ ) = i 2 cos ( α + θ ) = i 0
When the series branch exhibits inductive characteristics, i1 falls short of u0 by a certain angle, resulting in i2cos(α + θ) < i0. Conversely, when the series branch exhibits capacitive characteristics, i1 exceeds u0 by a certain angle, leading to i2cos(α + θ) > i0. Let
d = i 2 cos ( α + θ ) i 0
By evaluating the value of d, when d > 0, the series branch exhibits capacitive characteristics, and the system increases the frequency. Conversely, when d < 0, the series branch exhibits inductive characteristics, and the system reduces the frequency, which serves as the foundation for frequency determination.
Given that i2 = wCbu13 and i0 = wC0u0, Equation (7) can be rewritten as follows:
u 13 = cos ( α + θ ) = k 1 u 0
For ease of derivation, let k1 = C0/Cb in Equation (8).
In Figure 5, the cosine theorem yields the following:
u 0 2 = u 13 2 + k 2 u 12 2 2 k u 13 u 12 cos θ k 2 u 12 2 = u 0 2 + u 13 2 2 u 13 u 0 cos θ u 23 2 = u 13 2 + u 12 2 2 u 13 u 12 cos θ
Substituting Equation (9) into Equation (8) yields the following:
d = 1 + 2 k 1 k 2 1 + k 1 u 13 2 + k 1 + 2 k 1 2 k k 1 u 12 2 k 1 + 2 k 1 u 23 2
where it is defined that
k 1 = k + 2 k k 1 2 k 1 2 k 2 = k + 2 k k 1 2 k 2 k 1 k 3 = k 2 k k 1
Then, we have the following:
d = k 1 u 13 2 + k 2 u 12 2 k 3 u 23 2
where the series resonance point of the PT is the system operating frequency corresponding to d = 0. In practical applications, due to factors such as system voltage sampling errors, inherent background noise, and rounding errors in internal function calculations, the value of d1 will not precisely equal zero. Therefore, the following discriminant is established:
d Δ
where Δ represents the allowable error, which can be set during practical debugging.
As evidenced by the preceding discussion, since k1′, k2′, and k3′ are constants, the value of d can be calculated by sampling the three voltage signals from the matching circuit through the sampling circuit, processing them via the signal conditioning circuit, and then sending them to the controller for computation. By evaluating the magnitude and sign of d1, the system frequency can be adjusted accordingly: when d > Δ, the series branch exhibits capacitive characteristics, and the system increases the frequency; when d < −Δ, the series branch exhibits inductive characteristics, and the system decreases the frequency; when ∣d∣ < ∣Δ∣, the PT operates at the series resonance frequency, and the system maintains stable operation.

3.2. Application of SMC in Ultrasonic Power Supply

As a nonlinear control method, sliding mode control shows unique advantages in managing system uncertainty and nonlinear disturbances by virtue of its strong robustness and fast dynamic response characteristics, and the overshoot of sliding mode control is very small, which is suitable for systems with strict control accuracy requirements. Moreover, the equivalent capacitance of the PT is very small, and a slight overshoot of the regulation will cause a large change in the impedance characteristics of the PT. For these reasons, this study focuses on the core challenge of frequency control and transcends the limitations of traditional methods by constructing a sliding mode control strategy. The sliding mode surface S can be mathematically expressed as follows:
S = a x 1 + x 2
In the above equation,
x 1 = d r e f β d x ˙ 1 = x 2
where dref represents the desired value of d, β denotes the sampling coefficient, and x1 represents the rate of change of d.
Substituting Equation (15) into Equation (14) yields the following:
x 1 = d r e f β d x ˙ 1 = x 2 = 2 ω β d x ˙ 2 = u
where ω represents the working cycle of the ultrasonic power supply, and u is the control law of this system.
To ensure system stability, the Lyapunov function is defined as follows:
V ( t ) = 1 2 s 2
From the stability condition of the SMC,
V ˙ ( t ) = s s ˙ < 0
The reaching law of sliding mode control can be designed as a constant rate reaching law, expressed as follows:
s ˙ = ε sgn ( s )
The sliding mode control law can be designed as follows:
u = 2 ω β d ε sgn ( s )
Since the value of d1 cannot be changed directly, in combination with the principle of the voltage difference method described in Section 3.1, we can obtain the equivalent control rate of the sliding mode:
u 1 = f ε sgn ( s )

3.3. HO Algorithm Optimization for SMC

The HO algorithm is a population-based optimization algorithm similar to other population optimization algorithms, where the value of each decision variable represents the position of a certain type of population in a given search space, mathematically expressed in terms of vectors to represent the population individuals and in terms of matrices to represent the population itself. The population behavioral approach of the HO algorithm mimics the behavior of hippopotamuses to find an iterative solution [30].
The HO algorithm follows these computational steps for iteration:
  • The initial population positions are generated. In this step, the initial solution vectors are generated using the following equation:
χ i : χ i j = L j + r ( U j L j ) i = 1 , 2 , , N ; j = 1 , 2 , , m
where χi denotes the position of the i-th initial solution; Lj and Uj represent the lower and upper bounds of the j-th variable, respectively; N signifies the population size; and m indicates the number of variables.
The population matrix is expressed as follows:
χ i = χ 1 χ i χ N = χ 1.1 χ 1 . j χ 1 . m χ i .1 χ i . j χ i . m χ N .1 χ N , j χ N , m
2.
Within the spatial domain, the population positions are updated.
In this step, Equations (24)–(29) describe the population position updates:
χ i M . h i p p o : χ i j M . h i p p o = x i j + y 1 ( D h i p p o I 1 x i j ) i = 1 , 2 , , N / 2 ; j = 1 , 2 , , m
where χ i j M . h i p p o represents the position of the male hippopotamus; Dhippo denotes the position of the dominant hippopotamus; y1 is a random value from 0 to 1; and I1 is a random integer value from 1 to 2.
h = I 2 × r 1 + ( ~ p 1 ) 2 × r 2 1 r 3 I 1 × r 4 + ( ~ p 1 ) r 5
where r1, ꞏꞏꞏ, r4 are random vectors within the range [0, 1]; r5, ꞏꞏꞏ, r7 are random numbers within the range [0, 1]; and I2 is a random integer value between 1 and 2.
T = exp ( l τ )
χ i F B . h i p p o : χ i j F B . h i p p o = x i j + h 1 ( D h i p p o I 1 M G i ) , T > 0.6 Θ , e l s e
Θ = x i j + h 2 ( I 1 M G i D h i p p o ) , r 6 > 0.5 U j + r 7 ( U j L j ) e l s e i = 1 , 2 , , [ N / 2 ] ; j = 1 , 2 , , m
where χ i j F B . h i p p o represents the position of female and juvenile hippopotamuses; h1 and h2 are numbers or vectors randomly selected from the five scenarios in the h equation; and MGi is the mean of the randomly selected hippopotamuses.
x i : = χ i M . h i p p o , F i M . h i p p o < F i χ i , e l s e x i : = χ i F B . h i p p o , F i F B . h i p p o < F i χ i , e l s e
where Fi represents the objective function value.
3.
Local optimization is performed during the position update process to avoid entrapment in local minima.
In this step, the predator’s position in the space is represented by the following equation:
P r e d a t o r : P r e d a t o r j = L j + r 8 ( U j L j ) j = 1 , 2 , m
where Predatorj denotes the position of the predator, and r8 is a random vector within the range [0, 1].
D = P r e d a t o r j x i j
where D represents the distance between the i-th individual and the predator.
χ i H h i p p o R : χ i j H h i p p o R = R L P r e d a t o r j γ c d × cos ( 2 π g ) ( 1 D ) , F P r e d a t o r j < F i R L P r e d a t o r j γ c d × cos ( 2 π g ) ( 1 2 × D + r 9 ) , F P r e d a t o r j F i i = [ N / 2 ] + 1 , [ N / 2 ] + 2 , , N ; j = 1 , 2 , , m
where χ i H i p p o R represents the posture of the population in response to the predator; r9 is a 1 × m-dimensional random vector; γ, c, d, and g are random numbers distributed across different intervals; and RL is a random variable with a Levy distribution used to capture changes in the predator’s position. The governing equation characterizing this behavior is as follows:
χ i : = χ i H i p p o R , F i H i p p o R < F i χ i , e l s e
4.
A random exploration mechanism is applied for population position updates.
When population position updates encounter local traps or boundaries, the population attempts to leave the area and move to a random position near the current location. The following equation describes this behavior:
L j l o c a l = L j t , U j l o c a l = U j t , t = 1 , 2 , τ i = 1 , 2 , , N ; j = 1 , 2 , , m
χ i Hippo ε : x i j hippo ε = x i j + r 10 L j l ocal + k 1 U j l ocal L j l ocal i = 1 , 2 , , N ; j = 1 , 2 , , m
where χ i j H i p p o ε represents the identified safe position; t denotes the current iteration; τ signifies the maximum number of iterations; and k1 is a vector or value randomly selected from the following equation:
h = 2 × r 11 1 r 12 r 13
χ i Hippo ε : x i j hippo ε = x i j + r 10 L j l ocal + k 1 U j l ocal L j l ocal i = 1 , 2 , , N ; j = 1 , 2 , , m
where r11 is a random vector within the range [0, 1]; and r12 and r13 are random numbers distributed across different intervals, with r13 being a random number following the standard normal distribution.
HO’s procedural details are shown in Figure 6.
After each iteration of the HO algorithm, the population individual positions are updated according to steps (2) to (4), continuing until the final iteration. During the algorithm execution, dominant solutions are continuously identified and stored. When the algorithm finishes, the final dominant solution is selected as the ultimate solution.
Combined with the sliding mode surface defined in Section 3.2, it can be seen that the performance of the SMC mainly relies on the selection of the sliding mode surface coefficient a and the sampling coefficient β. This pair of parameter combinations [a, β] directly affects the dynamic response and disturbance immunity of the system, which in turn determines the control effect. Most current studies use the trial-and-error method or traditional optimization algorithm to determine [a, β], and although the values of the parameter combinations can be confirmed in the end, they often suffer from computational inefficiency and tend to experience the problem of local extreme values.
To address these issues, the HO algorithm is utilized to optimize the sliding mode control parameters, thereby obtaining the optimal parameter combination [a, β]. The specific design steps are as follows:
  • Definition of the fitness function.
The fitness function is employed to evaluate the performance of the sliding mode control parameters. For the frequency control problem, the Integral of Absolute Error Criterion (IAE) of the value error d1 can be adopted as the fitness function:
Fitness = 0 T d r e f d 1 d t
2.
Initialization of the HO algorithm parameters.
The HO algorithm parameters, including population size, iteration count, territory radius, etc., are set, and the search range for the sliding mode control parameters is defined.
3.
Iterative optimization of the HO algorithm.
By simulating the group behavior, foraging strategies, and territory protection of hippopotamuses, the position of each individual in the population (the parameter combination [a, β]) is updated, and the fitness value is calculated. The specific steps are as follows:
Group Collaboration: Hippopotamus individuals share information and update their positions to find better solutions.
Foraging Behavior: The search range of individuals is adjusted based on fitness values to perform local optimization.
Territory Protection: Over-concentration of individuals is prevented, population diversity is maintained, and local optima are avoided.
4.
Determination of the optimal parameters.
The optimal slide mode control parameters [a, β] are determined once the algorithm satisfies the termination criteria, such as attaining the predefined maximum iteration count or achieving fitness value convergence.
5.
Application of the optimized parameters.
The optimized sliding mode control parameters are implemented in the frequency control system to validate their control effectiveness.
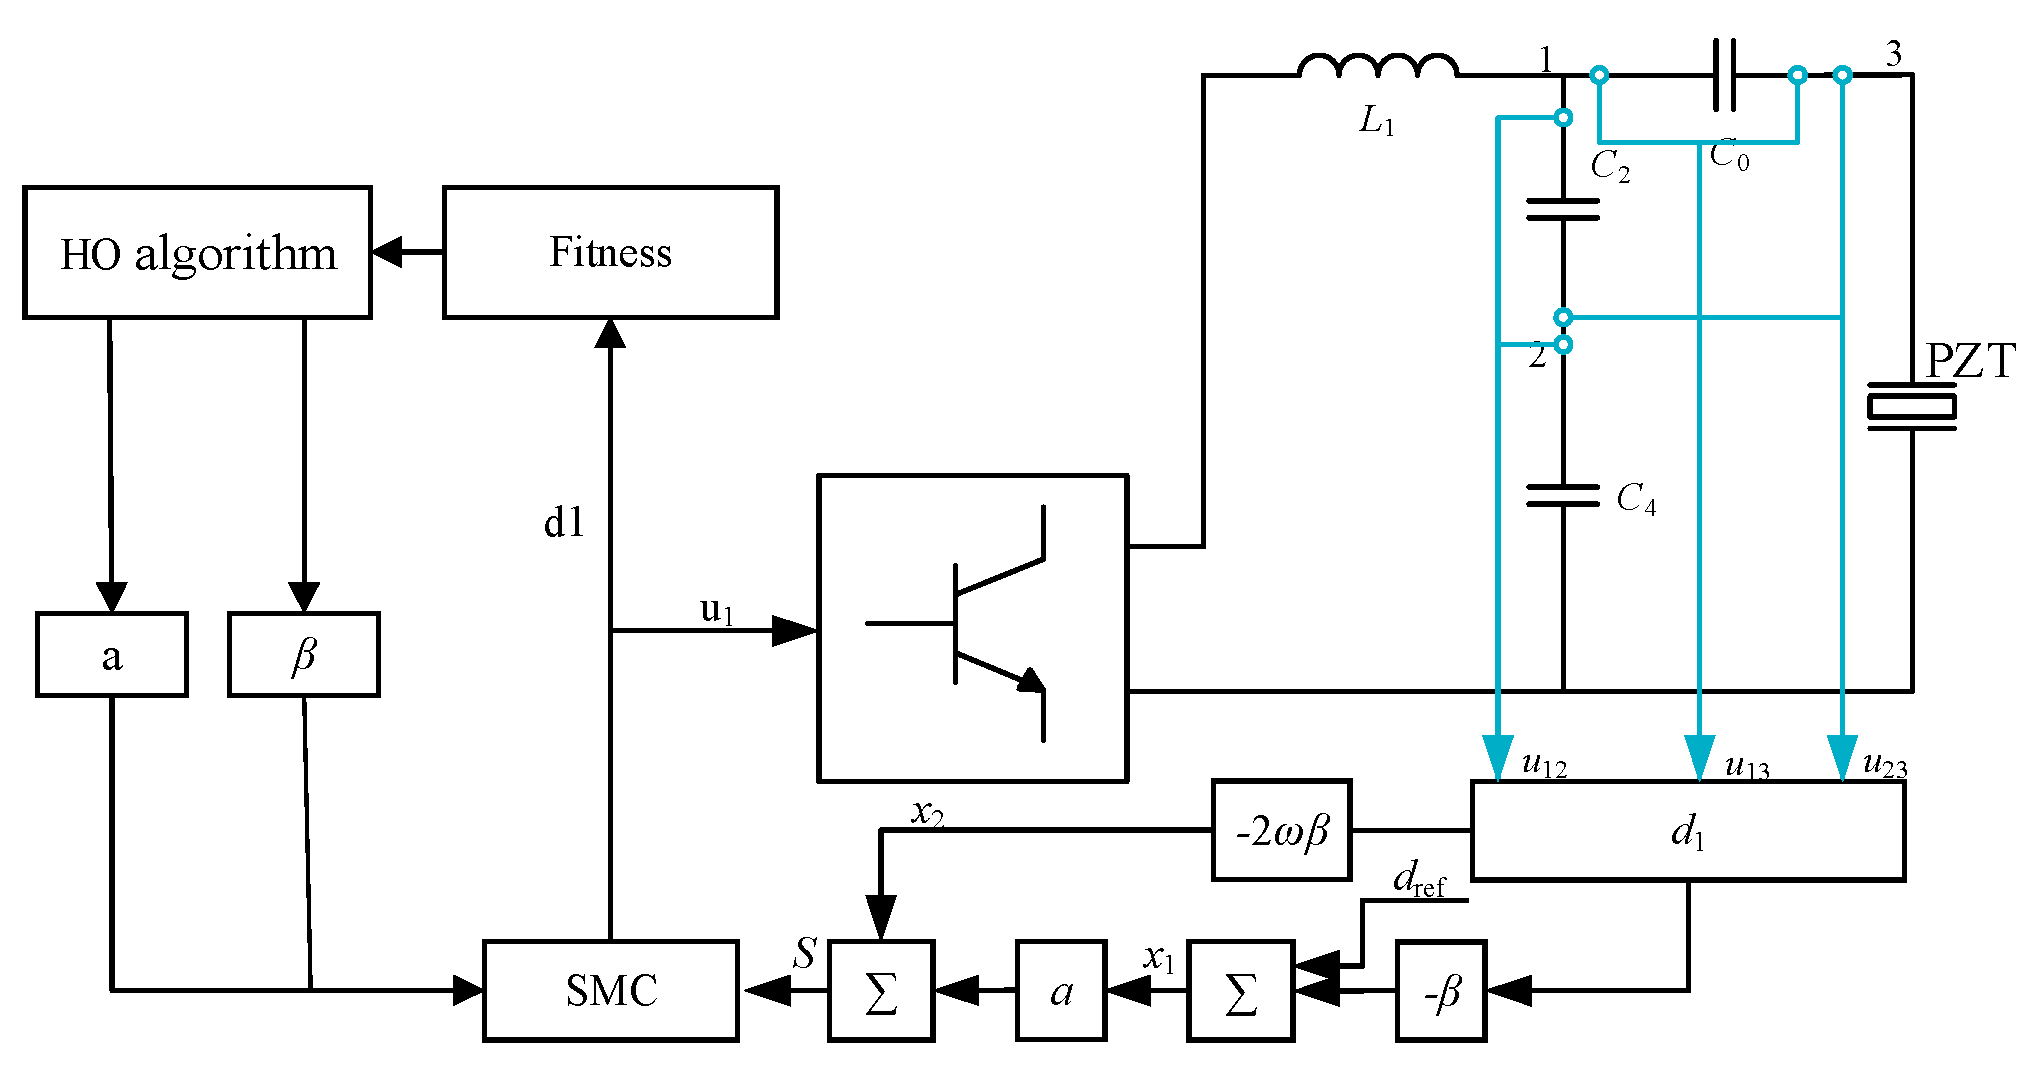
The structure of the HO-SMC is illustrated in Figure 7.

4. Simulation and Analysis

4.1. Simulation Parameters

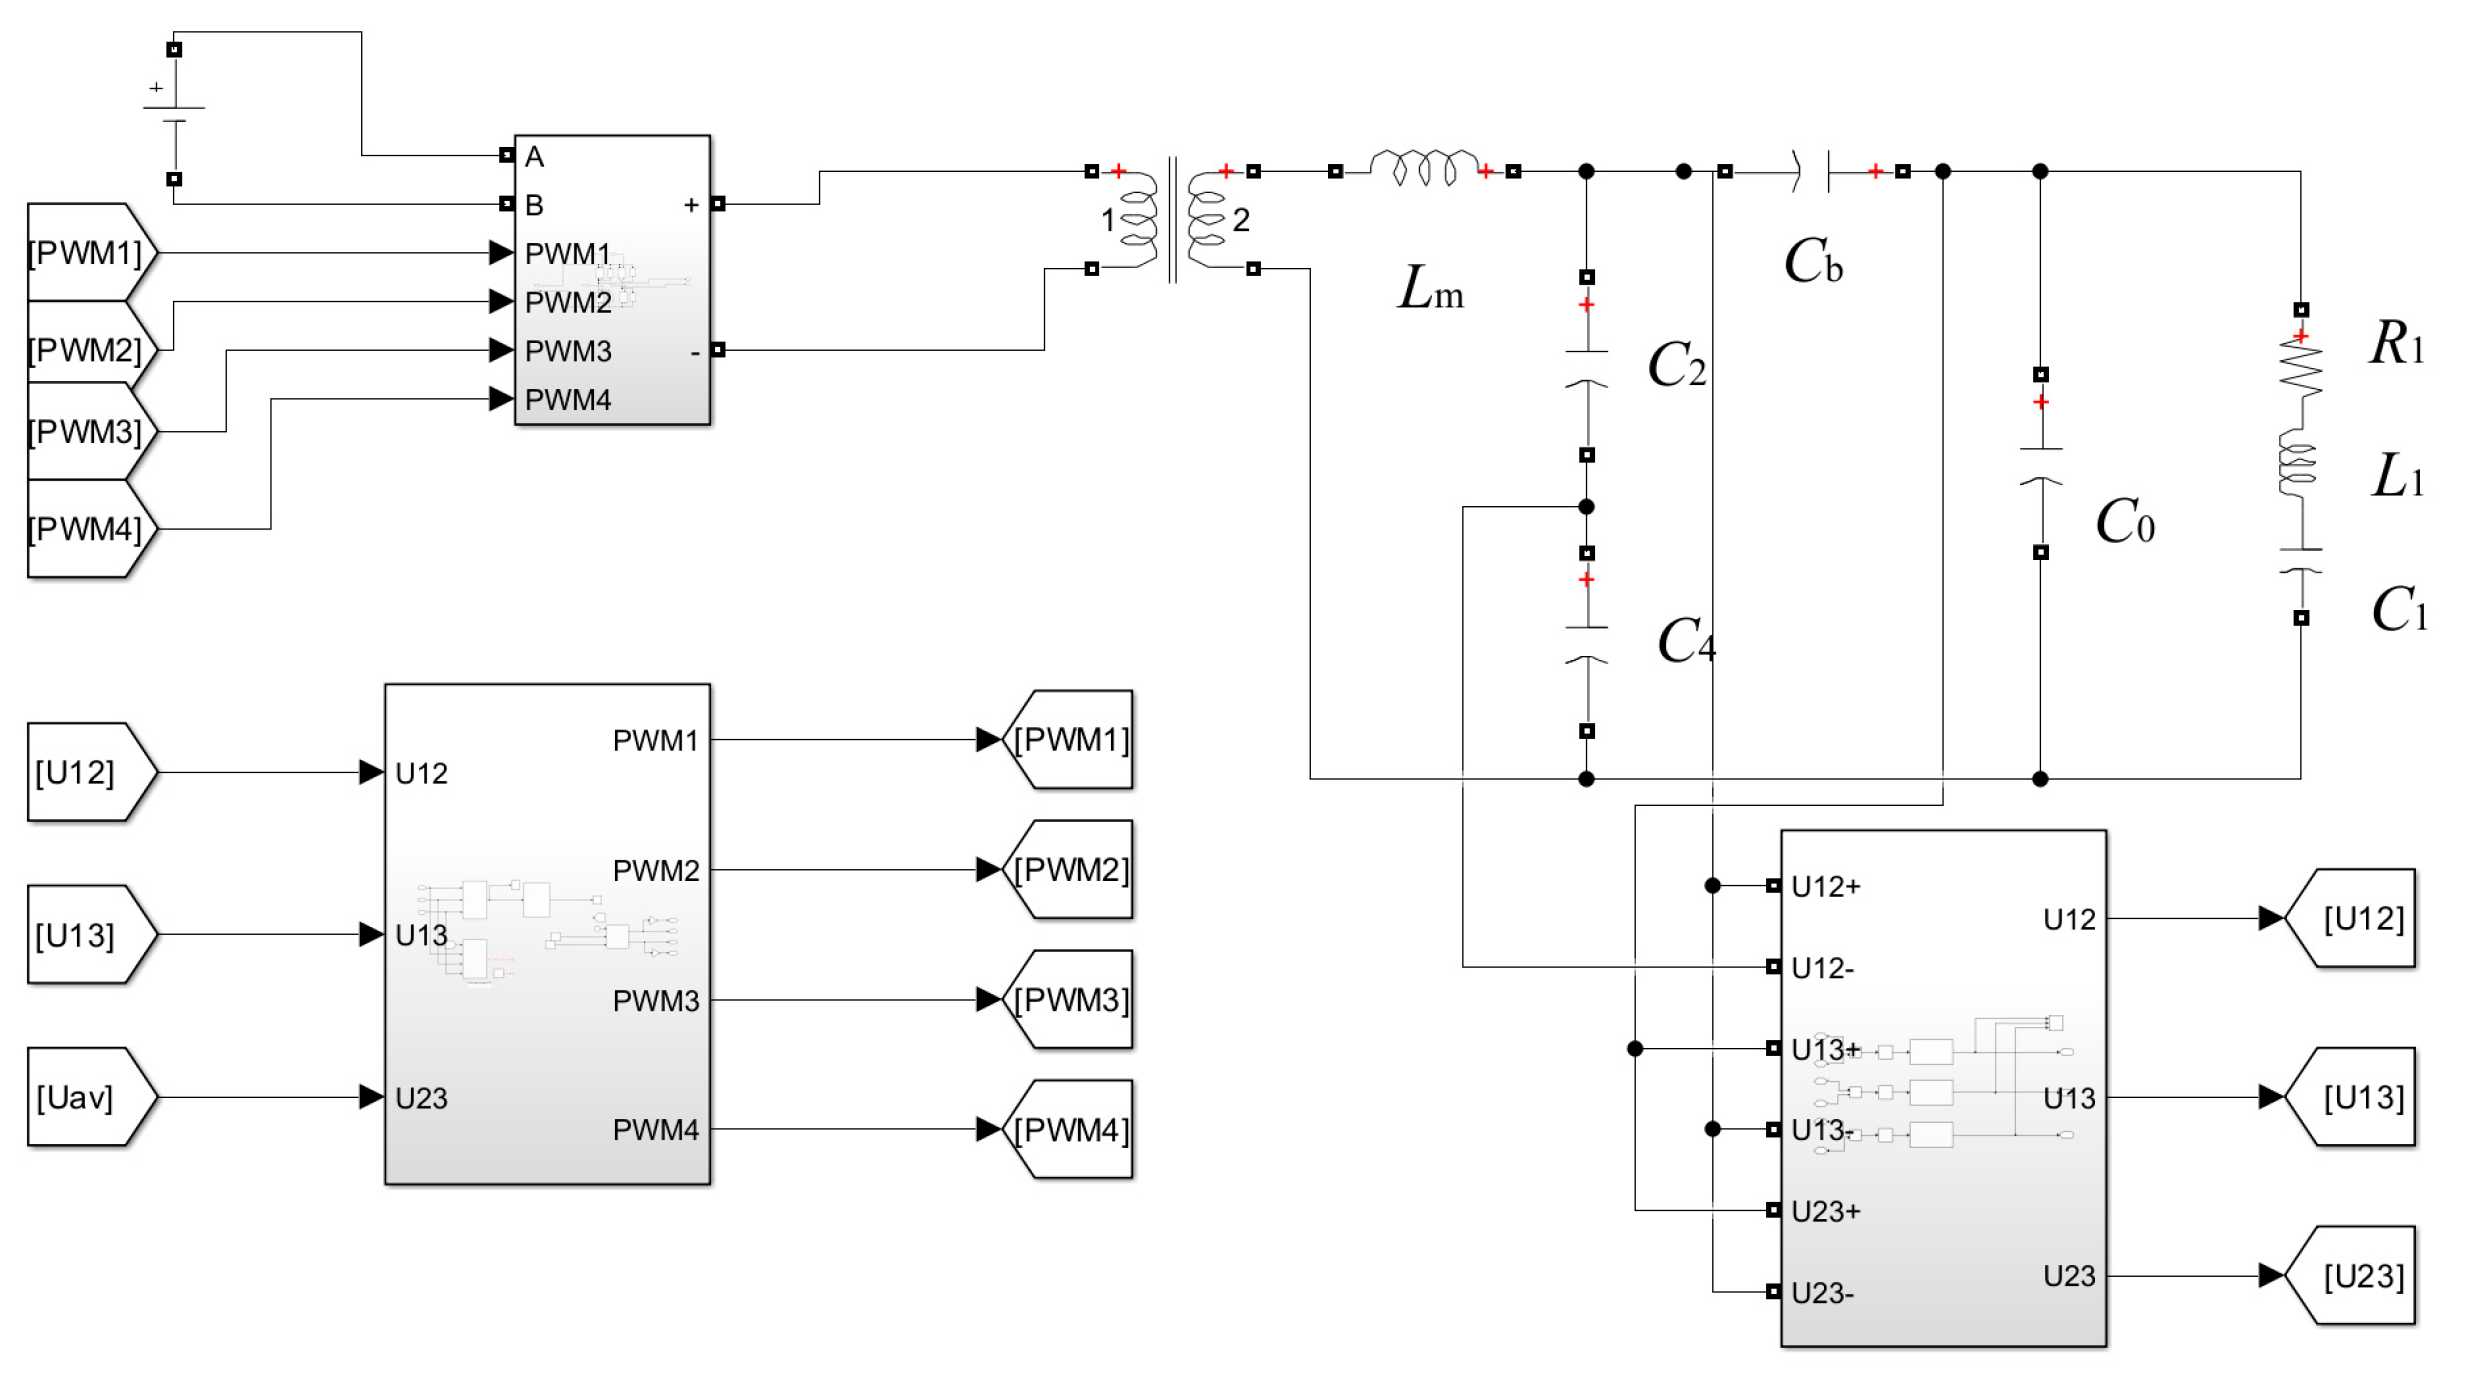
The experimental environment was built based on the MATLAB 2023/Simulink simulation platform, and a complete virtual prototype of the ultrasonic welding power supply system was constructed, as shown in Figure 8. This model accurately reproduces the load impedance parameters in actual working conditions. The simulation was conducted on a computer equipped with an Intel Core i7-12700H processor (14 cores, 4.7 GHz), 32 GB of DDR4 memory, a 1 TB solid-state drive, and the Windows 11 operating system.
To evaluate the improvement effects of HO-optimized SMC, this study constructs four comparative models: traditional PI control, basic SMC, particle swarm optimization PSO-optimized SMC, and the HO algorithm-optimized SMC control scheme. The core simulation parameters of the ultrasonic driving power supply system are detailed in Table 2.
The basic parameters of the HO algorithm are set as shown in Table 3, and the optimal combination is screened based on orthogonal experimental design to effectively balance the computational cost and optimization accuracy of the algorithm.
This study focuses on a 20 kHz PT as the research subject. The PT parameters measured under static conditions using an impedance analyzer are presented in Table 1. The parameters of the equivalent circuits will be utilized in subsequent sections for constructing the PT model.

4.2. Simulation Comparison

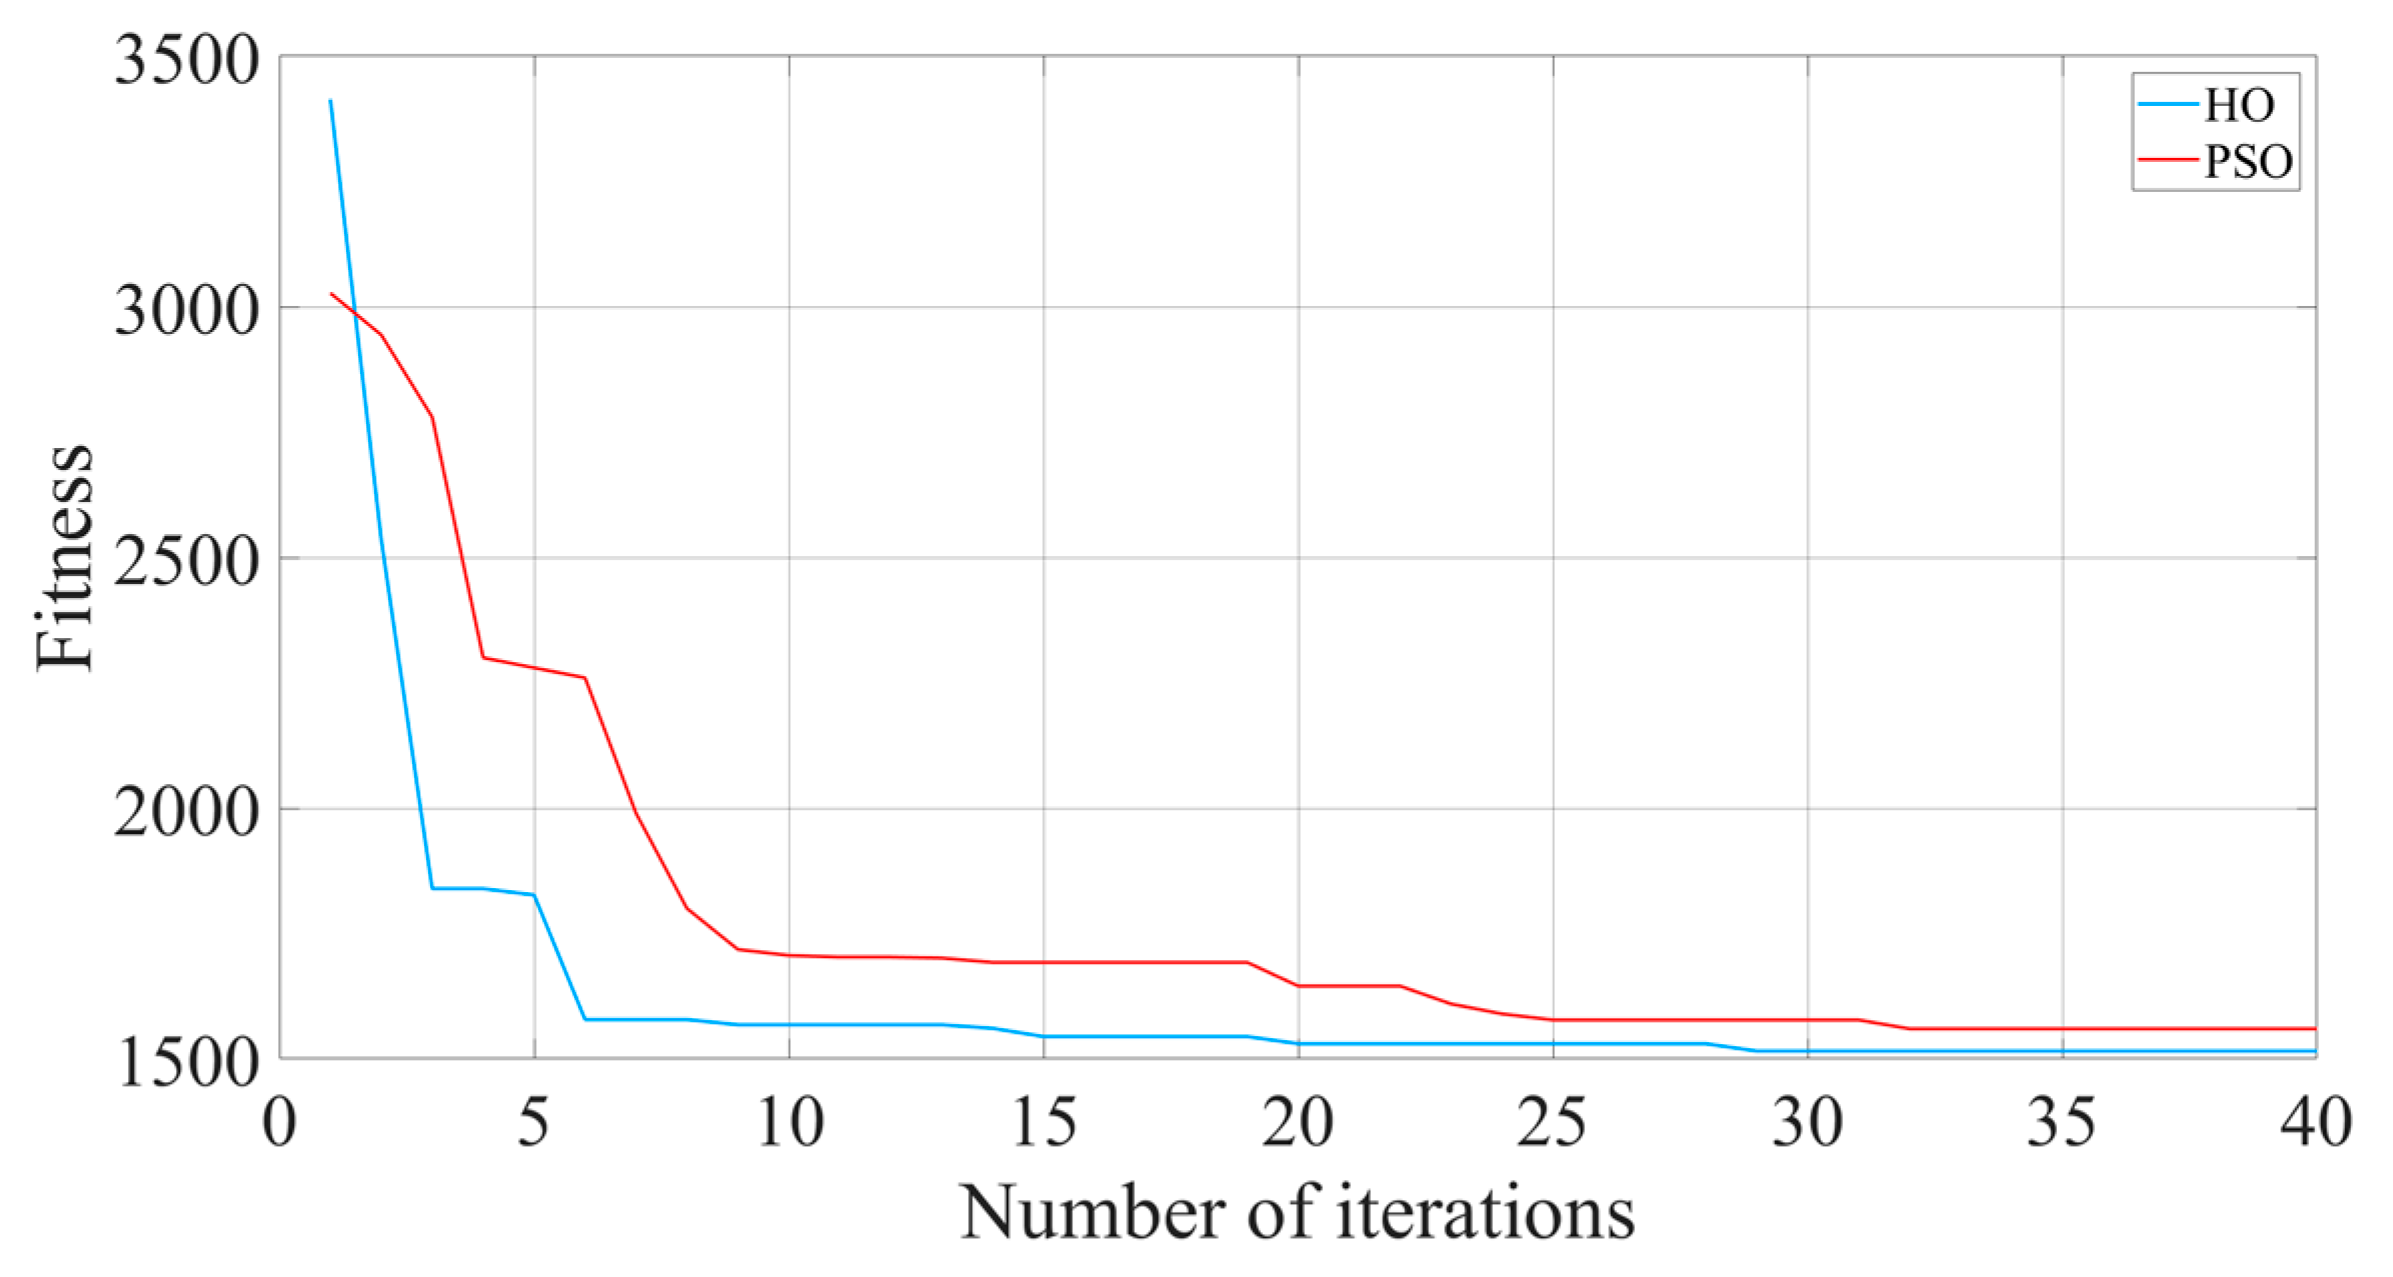
The algorithm iteration comparison curves are shown in Figure 9, revealing a significant difference between the two optimization algorithms in tuning the parameters of the SMC controller: the PSO algorithm’s fitness value stabilizes after approximately 25 iterations, whereas the HO optimization strategy converges in just 14 iterations. This result verifies the superior efficiency of the HO algorithm in exploring the solution space. Its swarm behavior, foraging strategy, and territory protection mechanism effectively avoid local optima traps. Compared to the random inertial search mode of the PSO algorithm, the convergence speed is improved by approximately 15%.
In actual welding work, due to changes in the external ambient temperature, changes in the output load, and the PT’s own heat, aging, and other factors, the PT’s own series resonant frequency will drift; therefore, in order to verify the frequency auto-tracking function of the ultrasonic drive power supply, the experimental simulation needs to be performed with the PT under both the static and dynamic conditions.
  • Simulation analysis under static conditions.
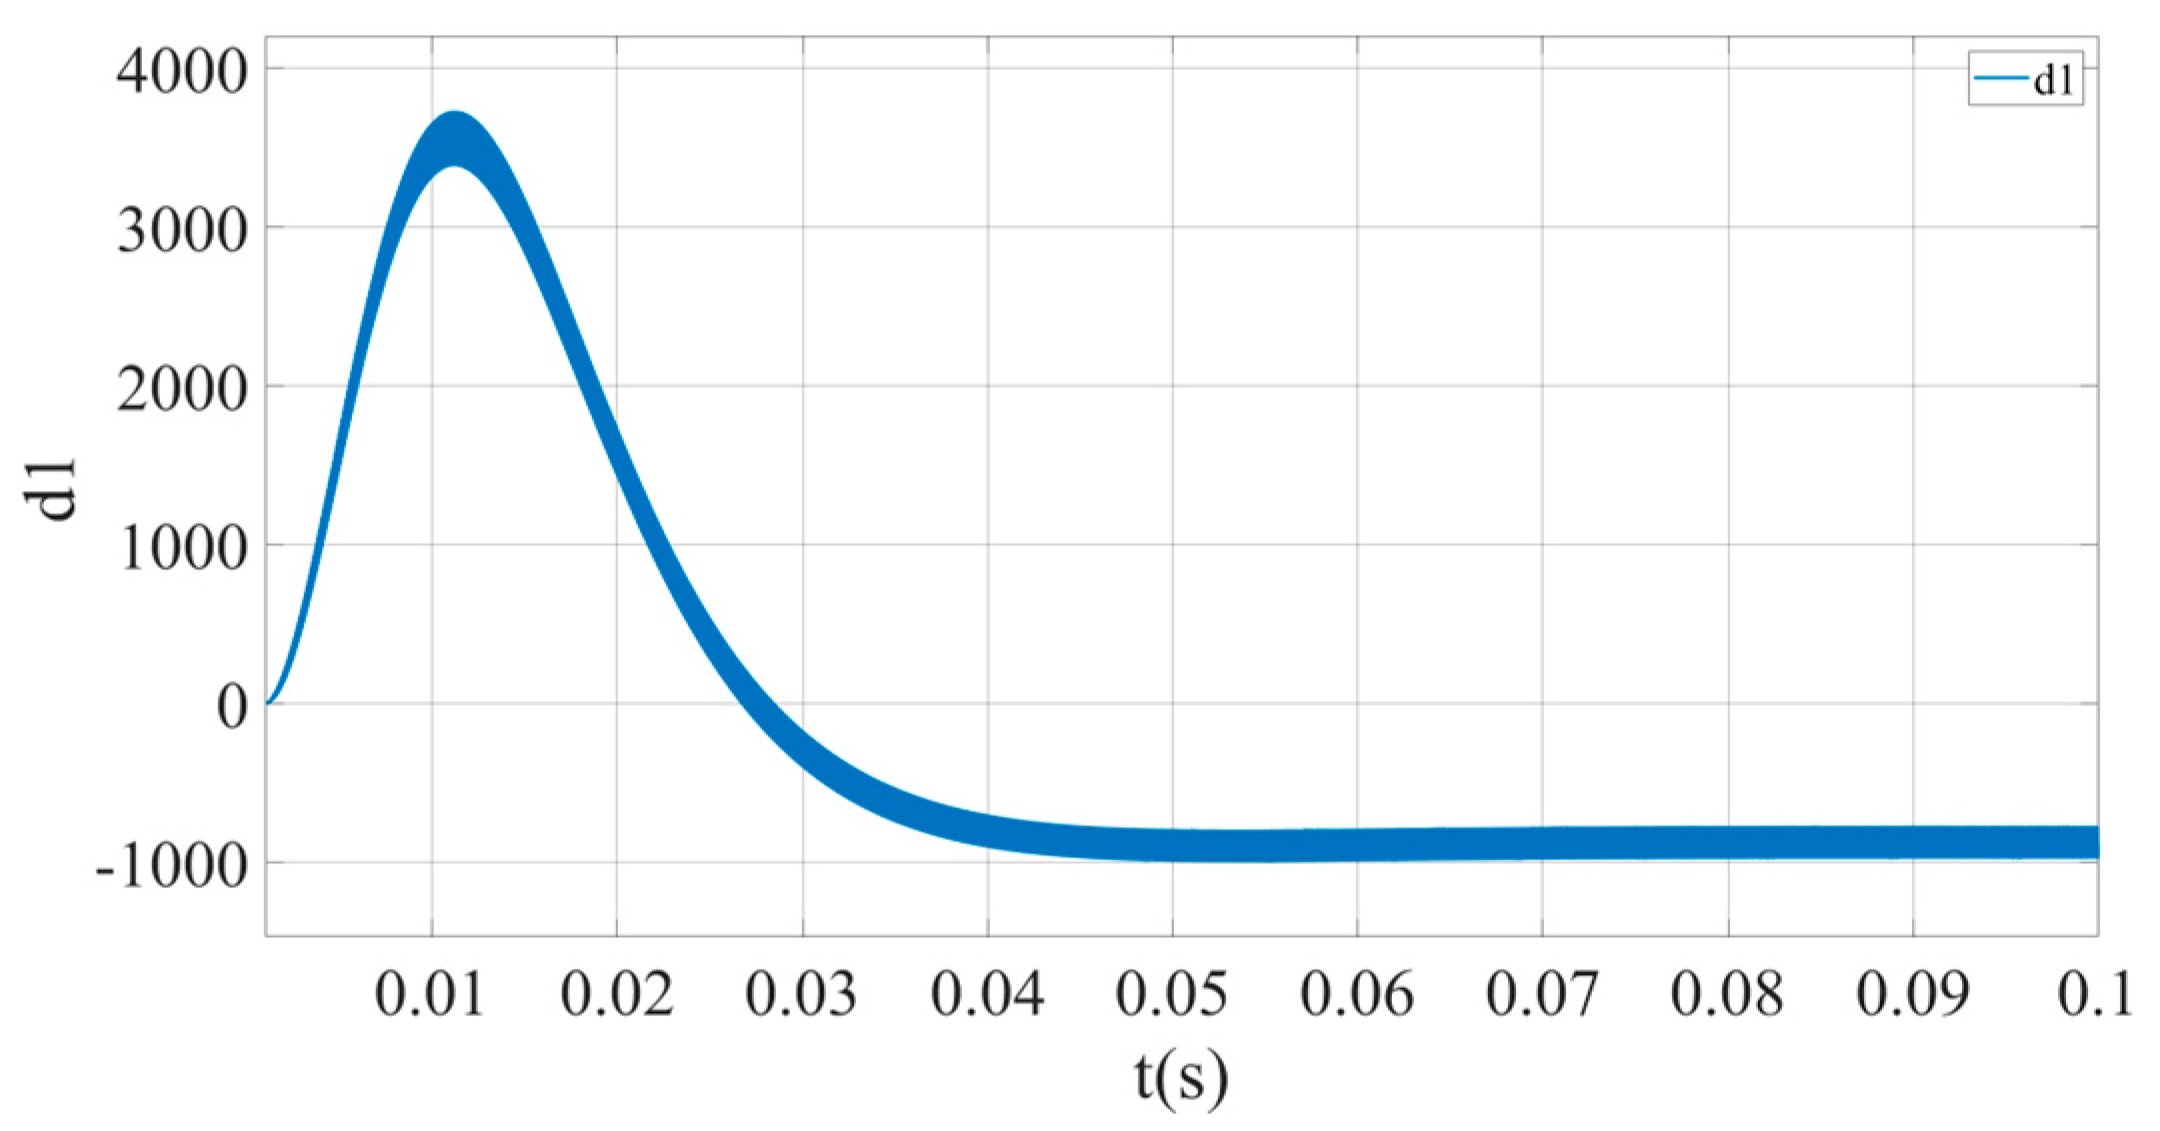
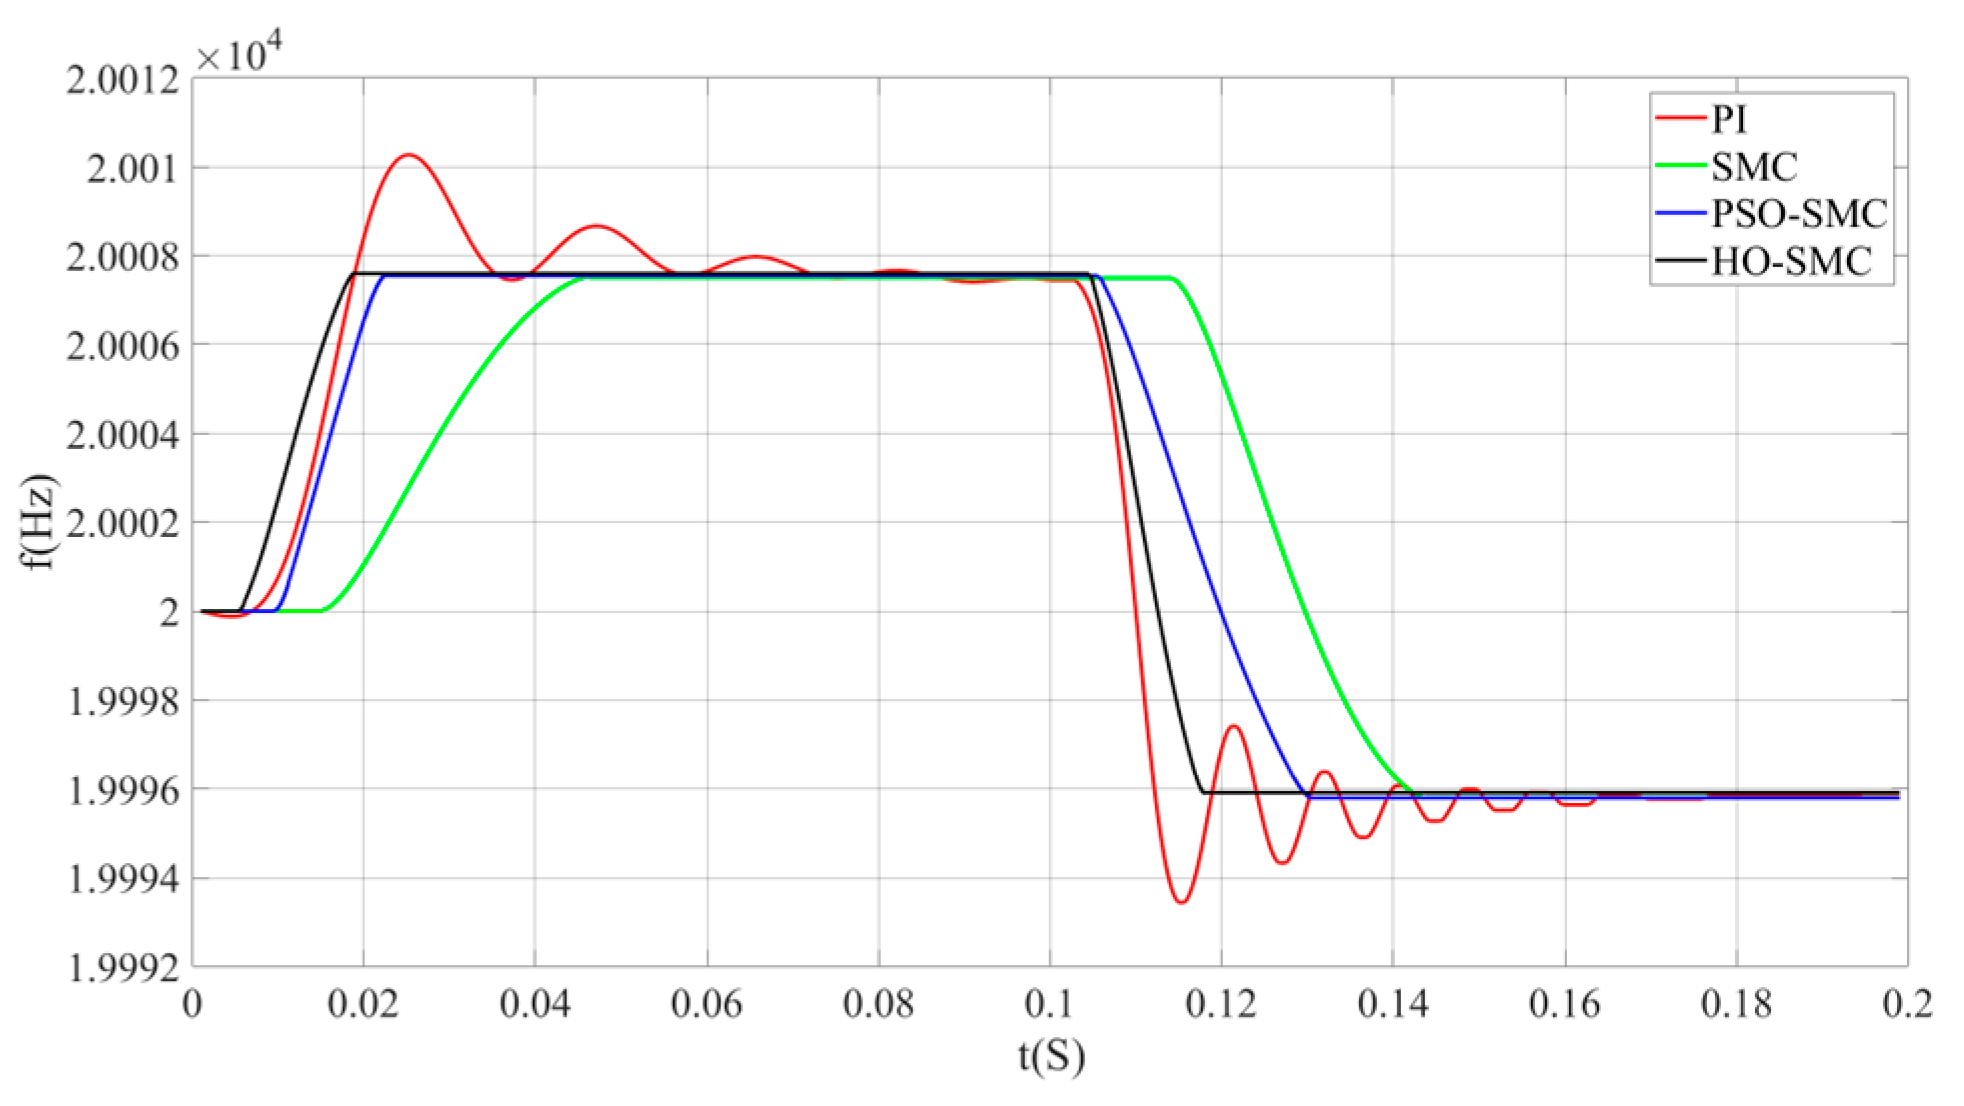
By simulating the group behavior, foraging strategies, and territory protection of hippopotamuses, the position of each individual in the population (the parameter combination [a, β]) is updated, and the fitness value is calculated. The initial operating frequency of the system is set to 20,000 Hz, while, based on the simulation parameters in Table 2, the series resonant frequency of the PT is 20,007 Hz, confirming that the initial operating frequency is set to a non-resonant condition. The frequency output curves under the control algorithms of the traditional PI control model, SMC model, PSO-SMC model, and HO-SMC model are shown in Figure 10. The tracking output curve of the d1 value for the HO-optimized SMC control algorithm is presented in Figure 11. The operating voltage and current waveforms of the PT under non-resonant and resonant states are illustrated in Figure 12 and Figure 13, respectively.
Table 4 quantitatively reveals the differences in dynamic response characteristics and steady-state accuracy among the various control strategies by comparing their regulatory effects on output frequency under dynamic operating conditions.
The simulation results show that the system starts operation in capacitive mode, and driven by the control algorithm, the system can achieve fast and accurate tracking and stable operation of the resonant frequency point. The dynamic error d1 is in a reasonable interval, and the output voltage and current remain in the same phase. Comparative analysis shows that the traditional PI control experiences a significant oscillation phenomenon, with the frequency response showing a trend of decreasing and then increasing, and the overshooting amount reaches 2.85 Hz with continuous fluctuation. It takes about 0.08 s to reach the steady state. On the other hand, the SMC suppresses the overshooting amount to 0.02 Hz, and the system is free of significant oscillation throughout the whole process, which demonstrates the superior dynamic response characteristics. After the optimization of the HO algorithm, the system control time is reduced from 0.046 s to 0.019 s, and the overall control performance is significantly improved.
2.
Simulation analysis under dynamic conditions.
In order to simulate the phenomenon of series resonant frequency drift caused by changes in the dynamic parameters of the PT, this study uses a controllable ideal switch in the simulation process, and it changes the dynamic capacitance value by controlling the access of the switch. Through the ideal switch, the dynamic capacitance is increased by 3 pF at 0.1 s, and at this time, the series resonant frequency of the PT is changed to 19,996 Hz. Its frequency tracking curve is shown in Figure 14. The d1 value tracking output curve is shown in Figure 15. The operating voltage and current waveforms of the PT under non-resonant and resonant states are illustrated in Figure 16 and Figure 17, respectively.
Table 5 quantitatively reveals the differences in dynamic response characteristics and steady-state accuracy among the various control strategies by comparing their regulatory effects on output frequency under dynamic operating conditions.
The simulation results show that when the impedance characteristic of the PT equivalent circuit changes abruptly in 0.1 s, its series resonant frequency is shifted, resulting in the output voltage phase exceeding the current phase, and the dynamic error index d1 rises sharply. Comparative analysis finds that the system shows significant fluctuations when PI control is used, and it takes 0.064 s to achieve frequency stabilization and 2.55 Hz overshooting, whereas the HO-SMC scheme only takes 0.018 s to complete resonant frequency tracking, and the overshooting is suppressed to 0.01 Hz and maintains stable operation.
The experimental data verify the synergistic effect of the SMC and HO algorithms in improving the resonance tracking accuracy and system robustness, which provides a theoretical basis and practical reference for the optimization design of related control systems.

5. Experimental Verification

5.1. Experimental Setups

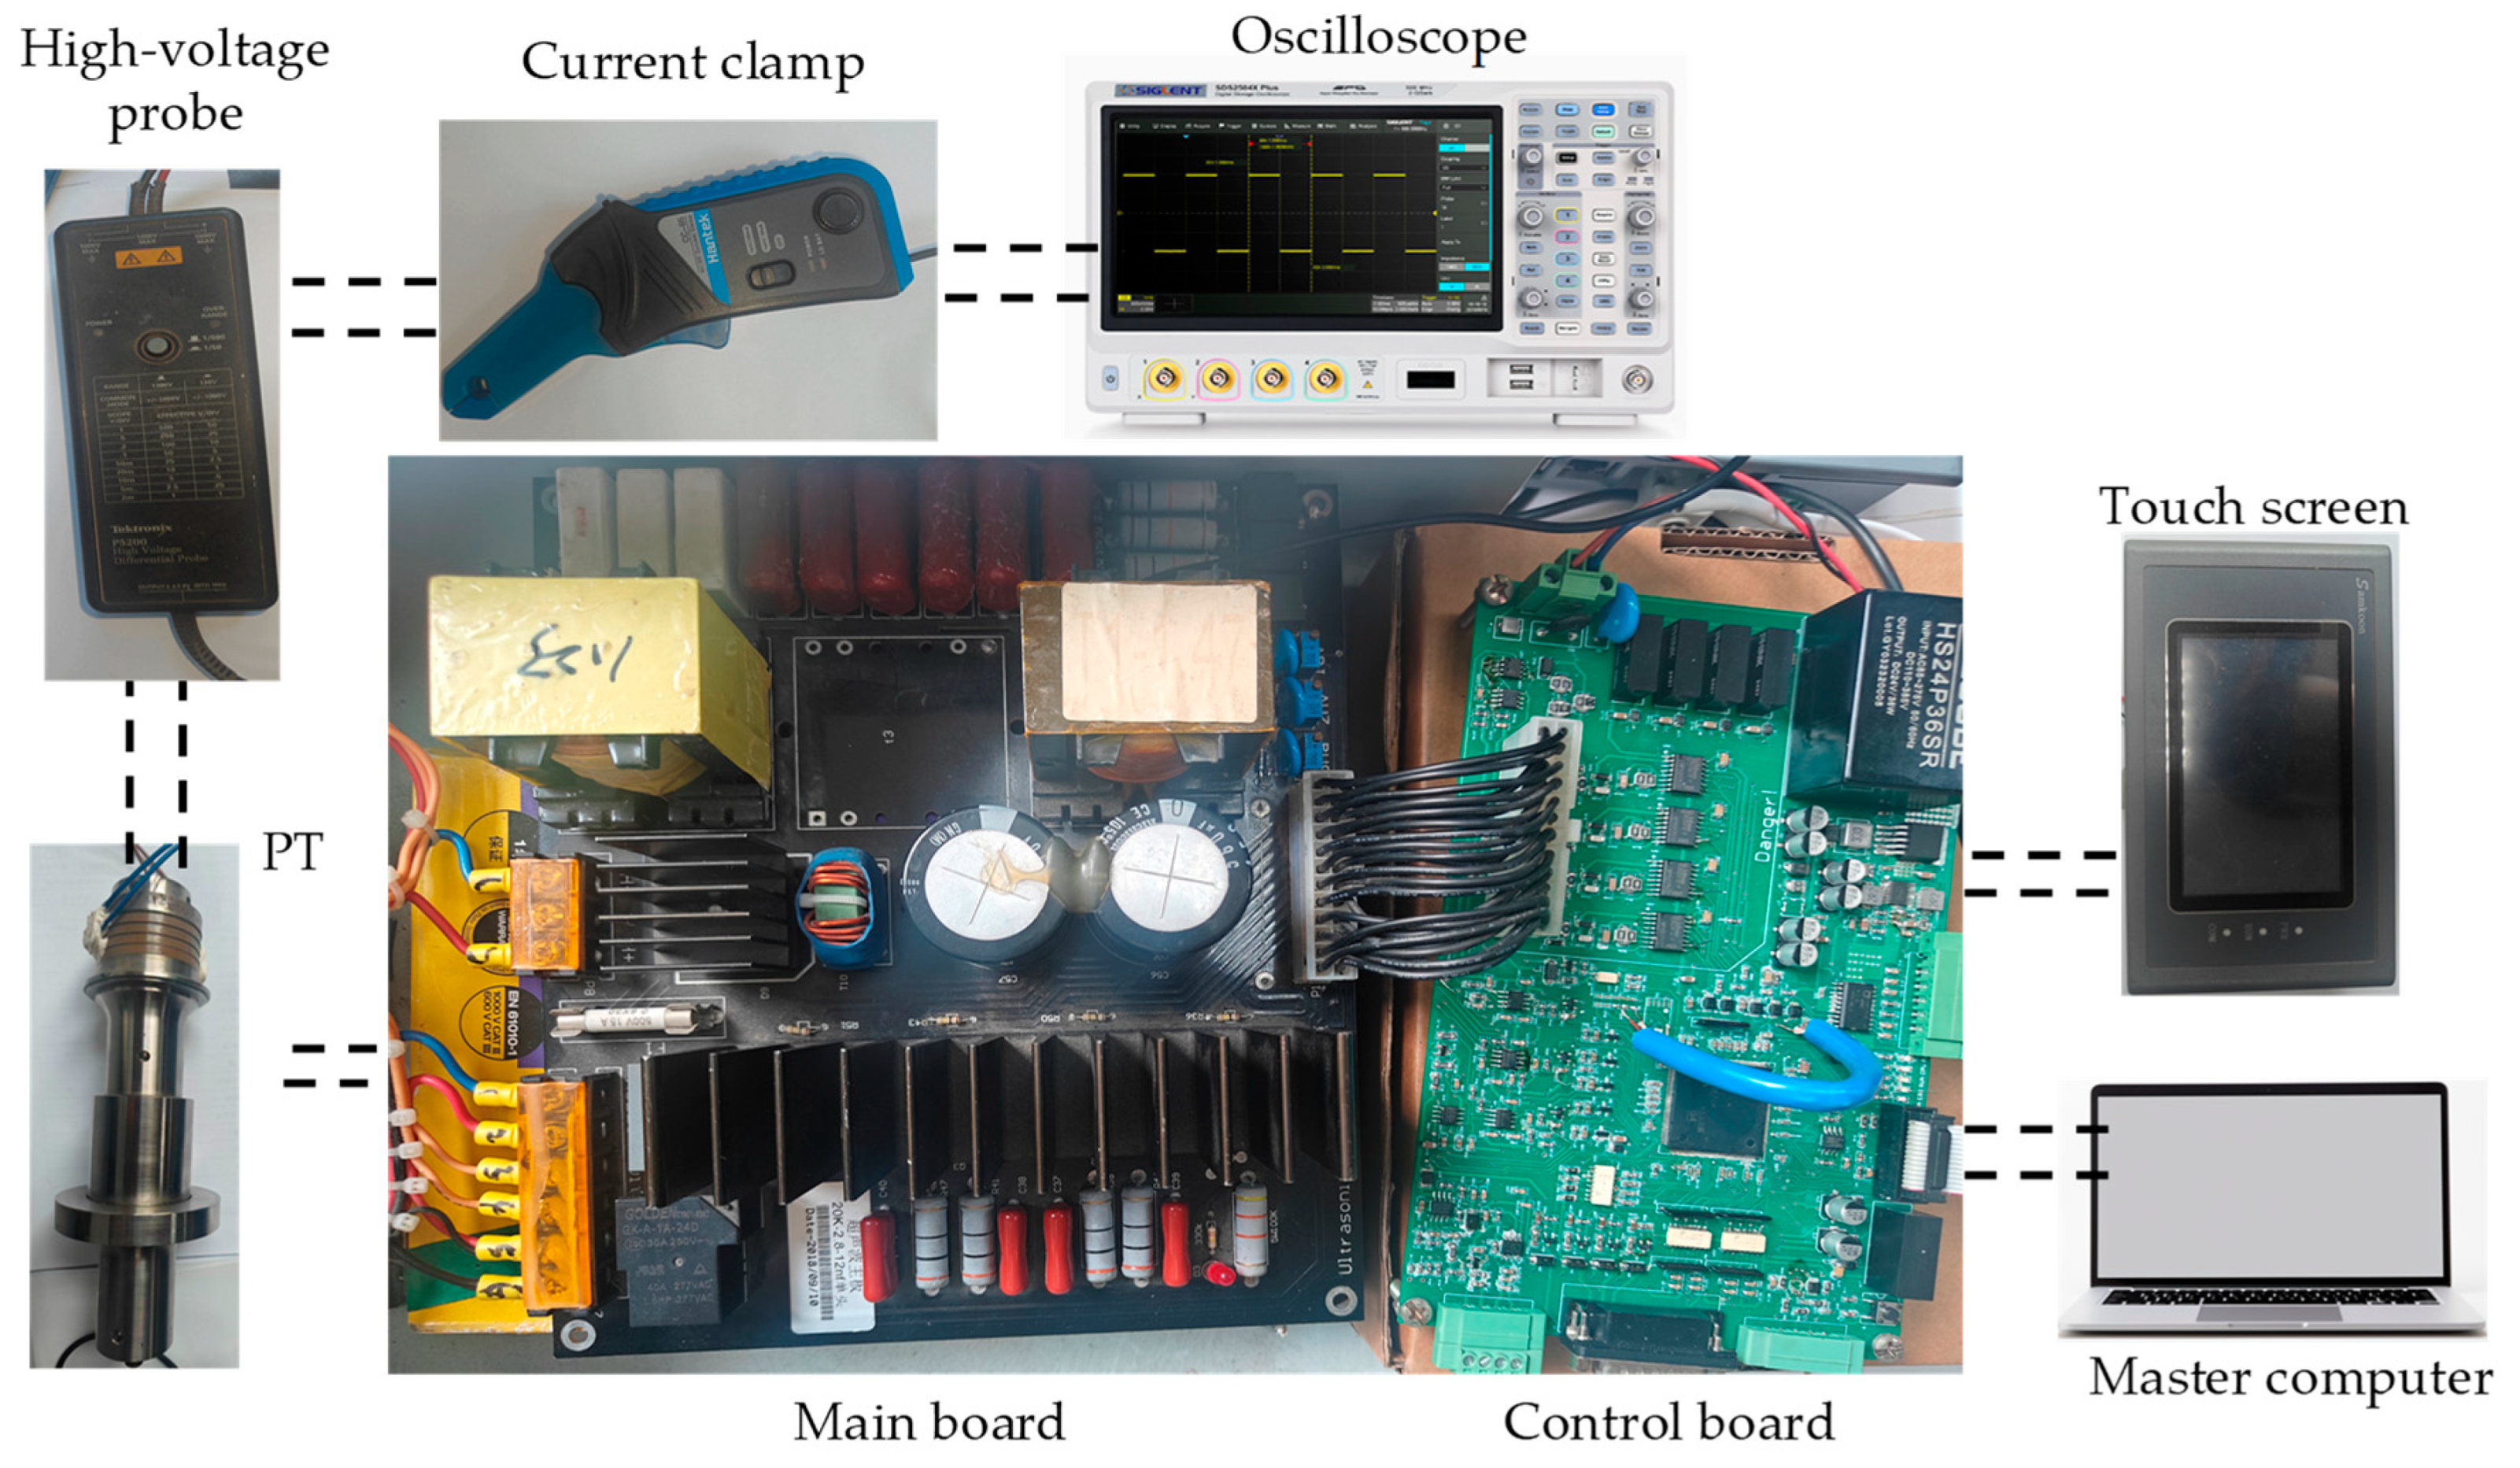
The ultrasonic system experimental platform, as illustrated in Figure 18, integrates three primary subsystems: a main circuit board containing the driving power supply’s power circuitry, an optimized LC matching network, and voltage sampling modules; a control board centered around the TMS320F28384s microcontroller, where the manufacturer of this microcontroller is Texas Instruments, located in Dallas, TX, USA. This control board is responsible for AD conversion, control algorithm execution, and PWM signal generation; in addition, there is an interactive touchscreen interface configured in the system, which is used for real-time parameter monitoring and adjustment.
The experimental test system utilizes a SIGLENT SDS2504X Plus digital oscilloscope manufactured by SIGLENT Technologies in Shenzhen, China, featuring 500 MHz bandwidth and 2 GSa/s sampling rate for signal acquisition. High-voltage measurements are performed using a Tektronix P5200 differential probe manufactured by Tektronix in Beaverton, OR, USA, capable of measuring up to 1000 V for accurate high-voltage signal capture. The current detection employs a CC-65 AC/DC current clamp with a 20 mA to 65 A measurement range and ±1% accuracy, manufactured by Hantek in Qingdao, China. The system incorporates a Samkoon SK-043HS touchscreen panel for human–machine interaction. It is manufactured by Samkoon, located in Shenzhen, China.
The transducer has identical specifications to those presented in Table 1. All experimental validations were conducted under controlled low-voltage conditions to ensure system safety and measurement accuracy.

5.2. Frequency Tracking Verification

The resonant frequency variation caused by impedance fluctuations exhibits a maximum deviation of ±1000 Hz across various operational states. To accommodate this dynamic range, the power supply’s frequency tracking capability was configured to span 19 kHz to 21 kHz. Within the control architecture, the TMS320F28384s microcontroller’s PWM auxiliary clock operates at 198.76 MHz to ensure precise frequency generation.
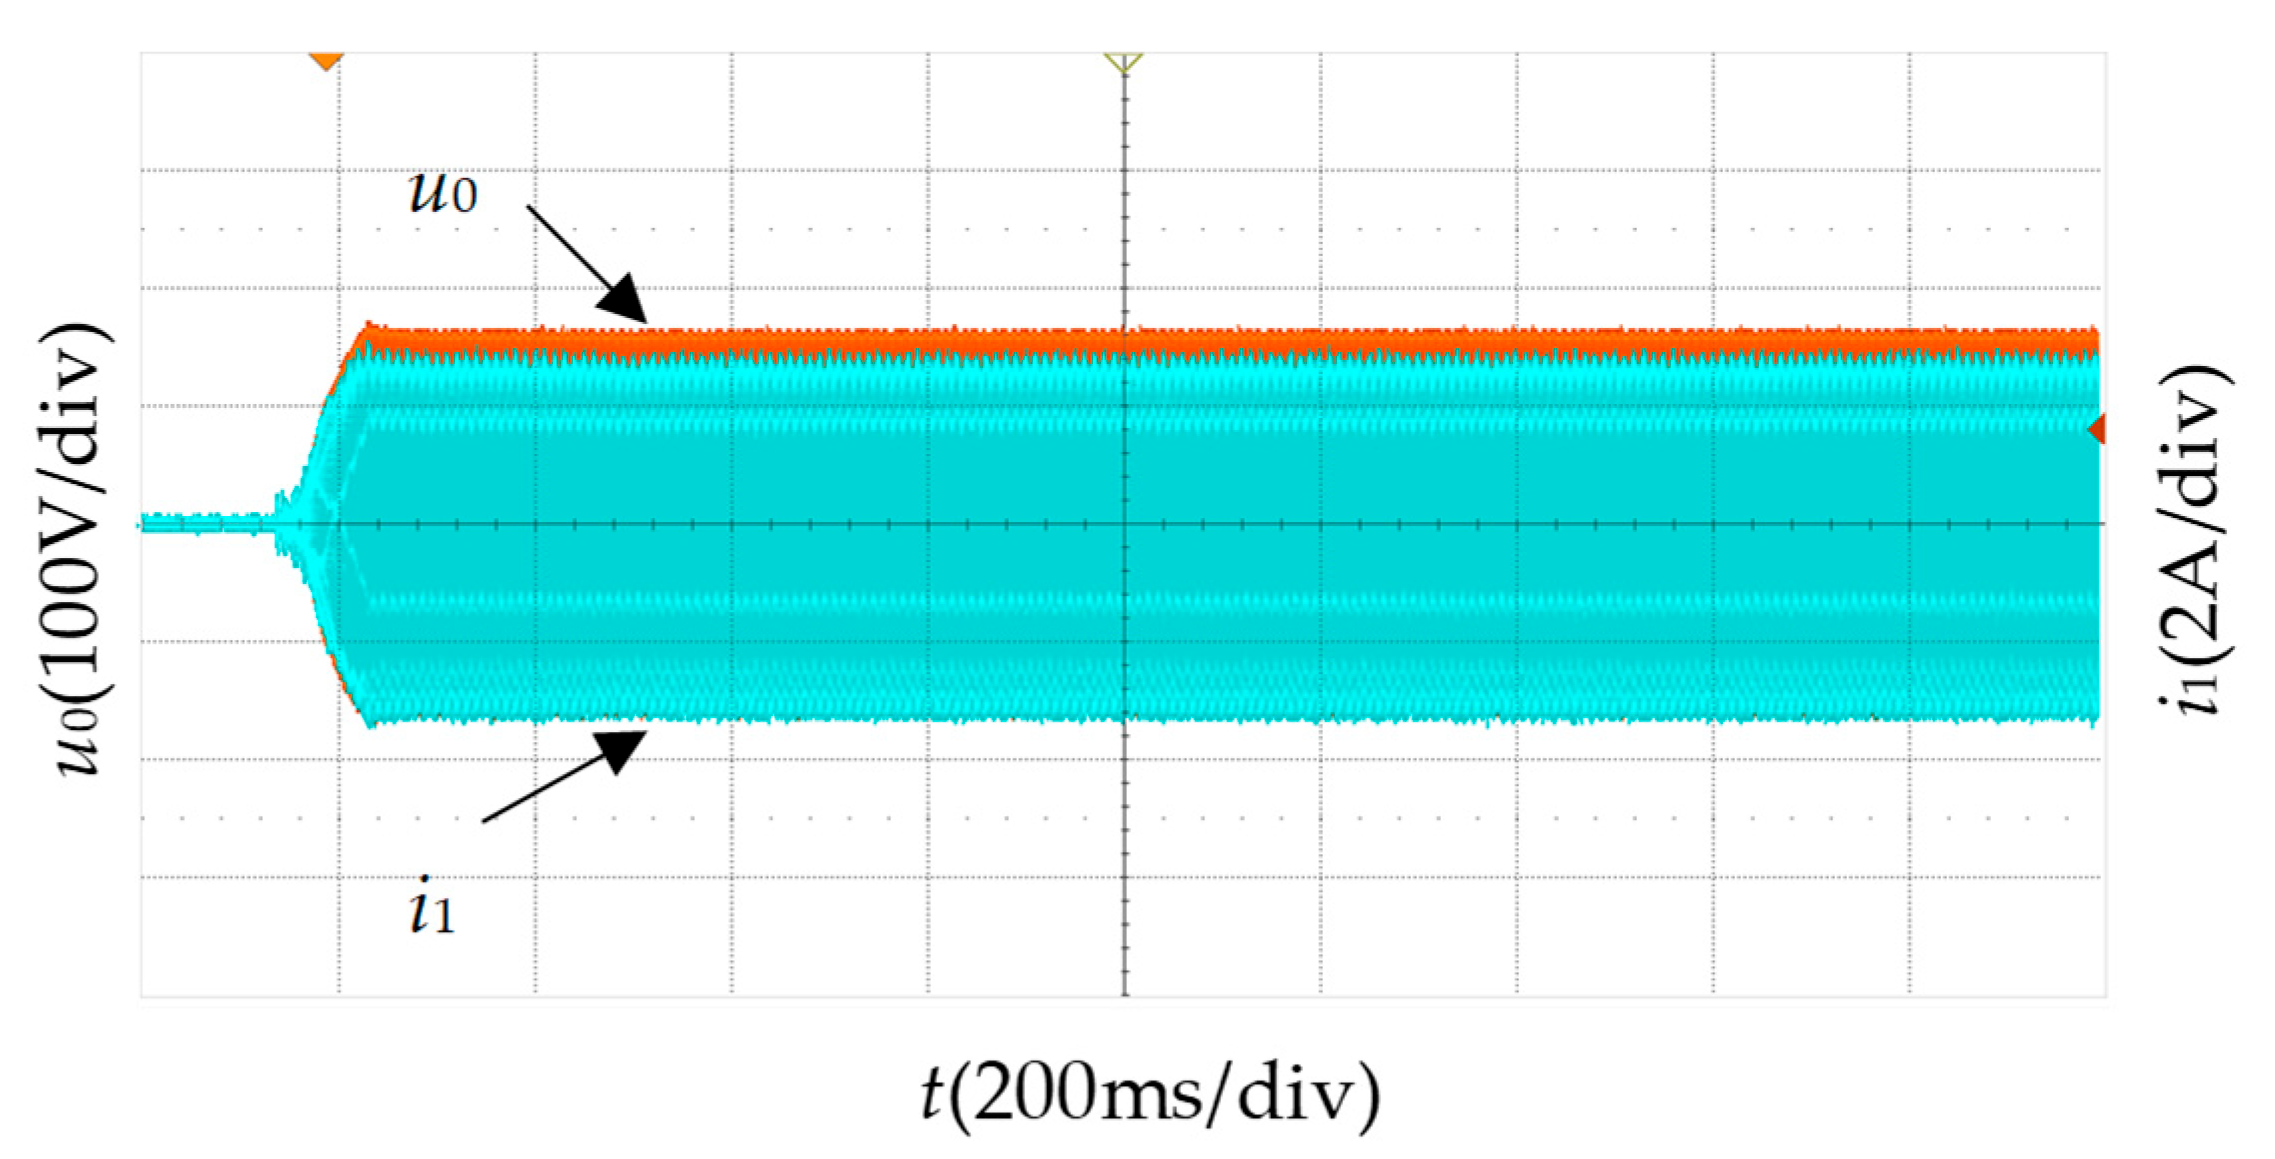
The system was configured to 200 W output via the touchscreen interface with a 2 s test duration. Voltage and current waveforms were monitored using a digital oscilloscope with the power regulation profile illustrated in Figure 19. After 20 repeated runs, the transducer achieved steady-state operation within 100ms without observable voltage/current transients, and the power variation was within 2%.
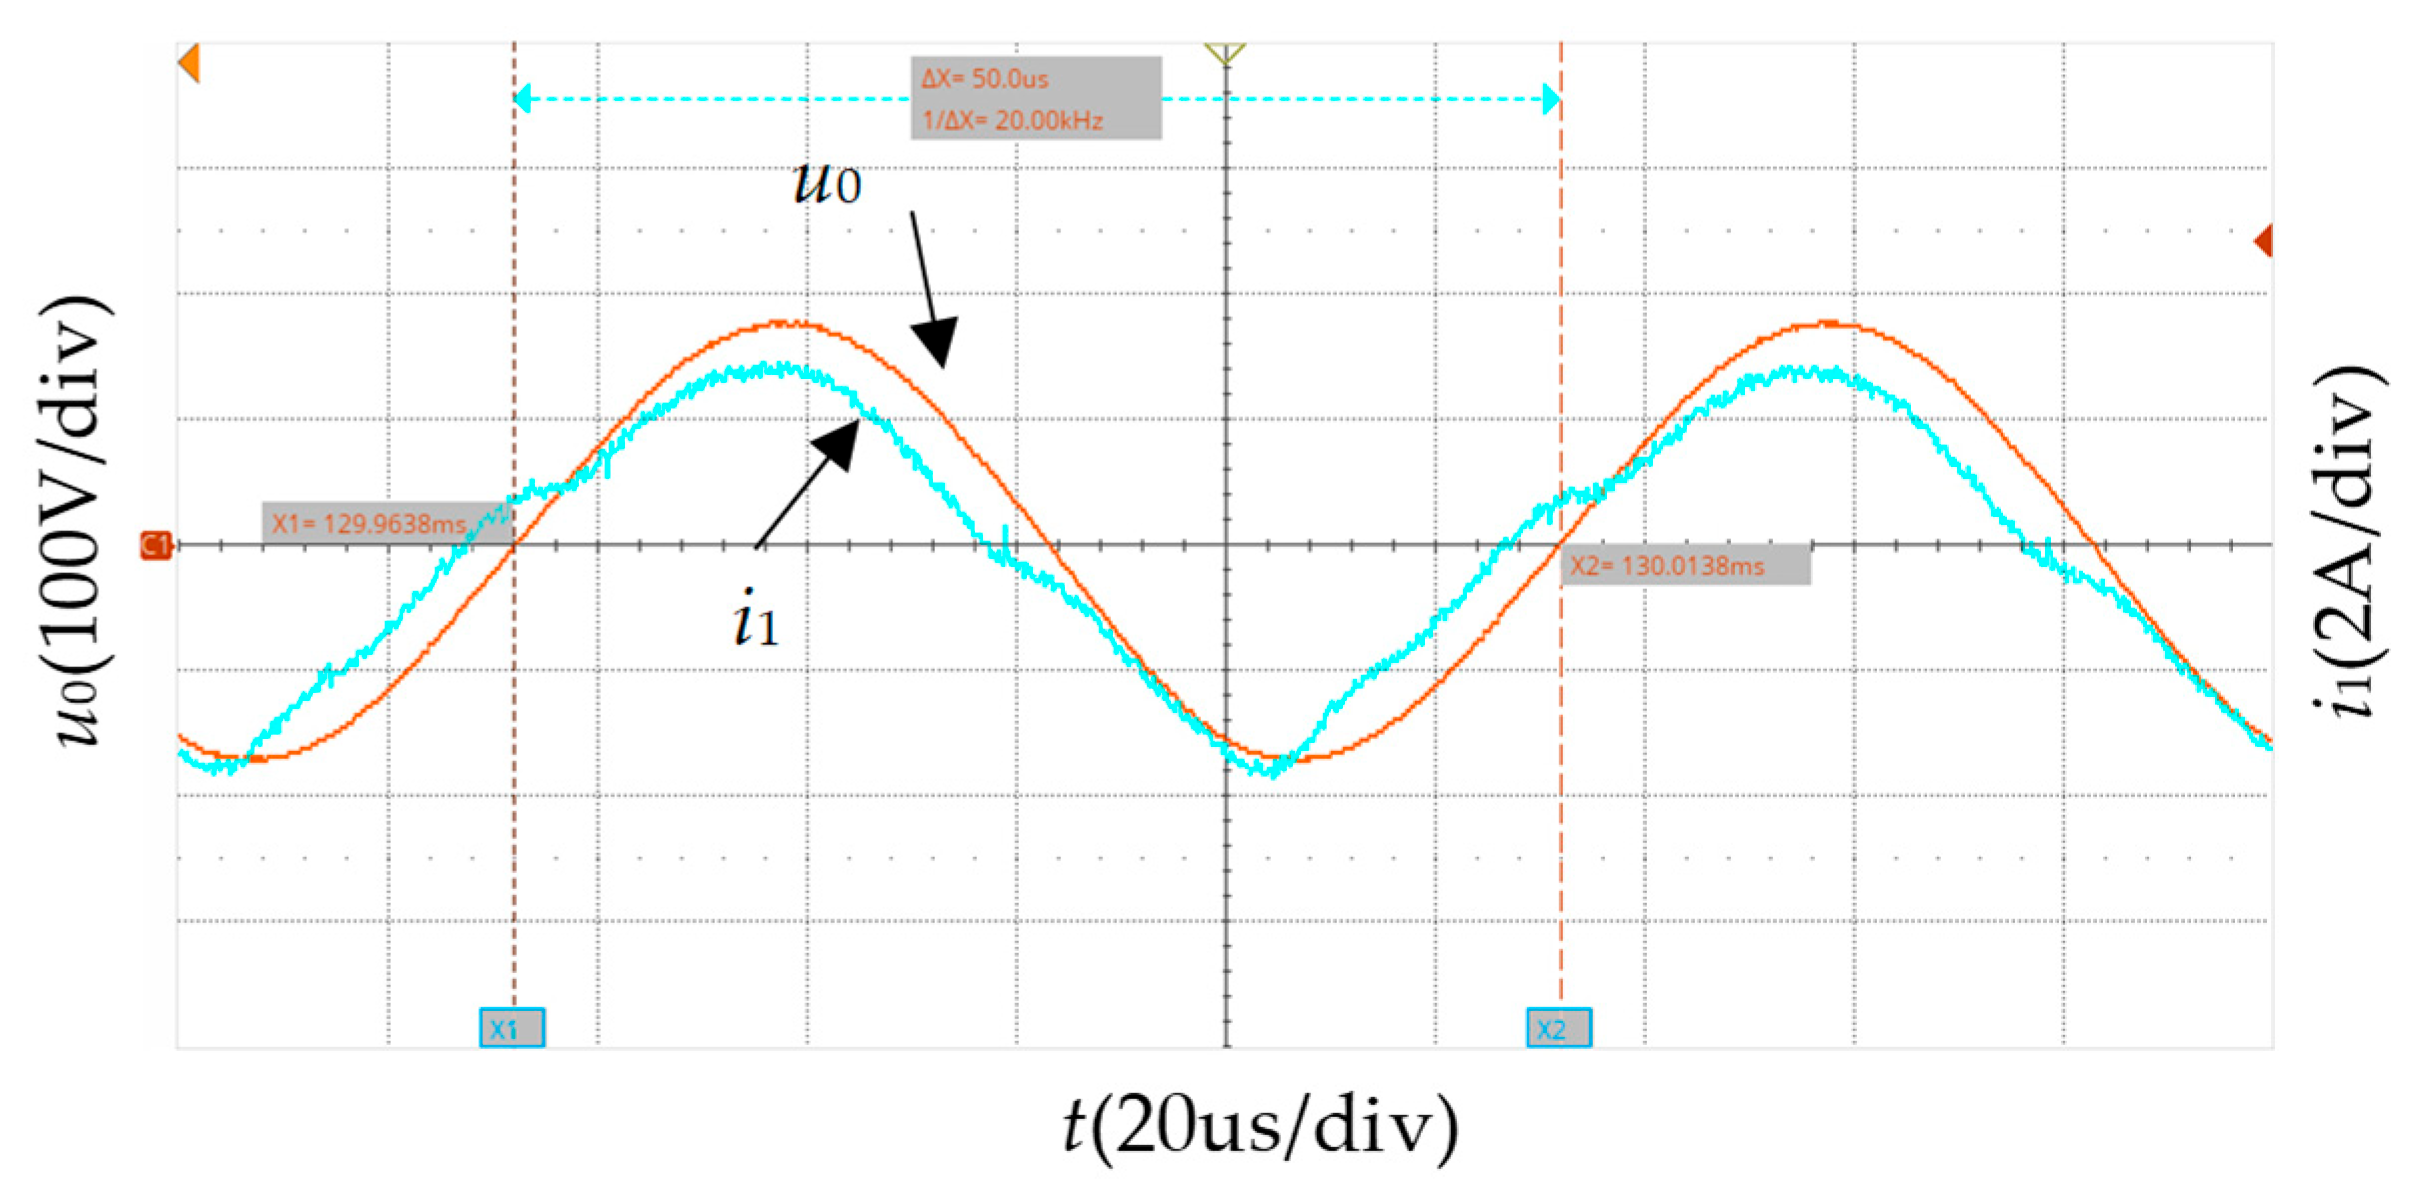
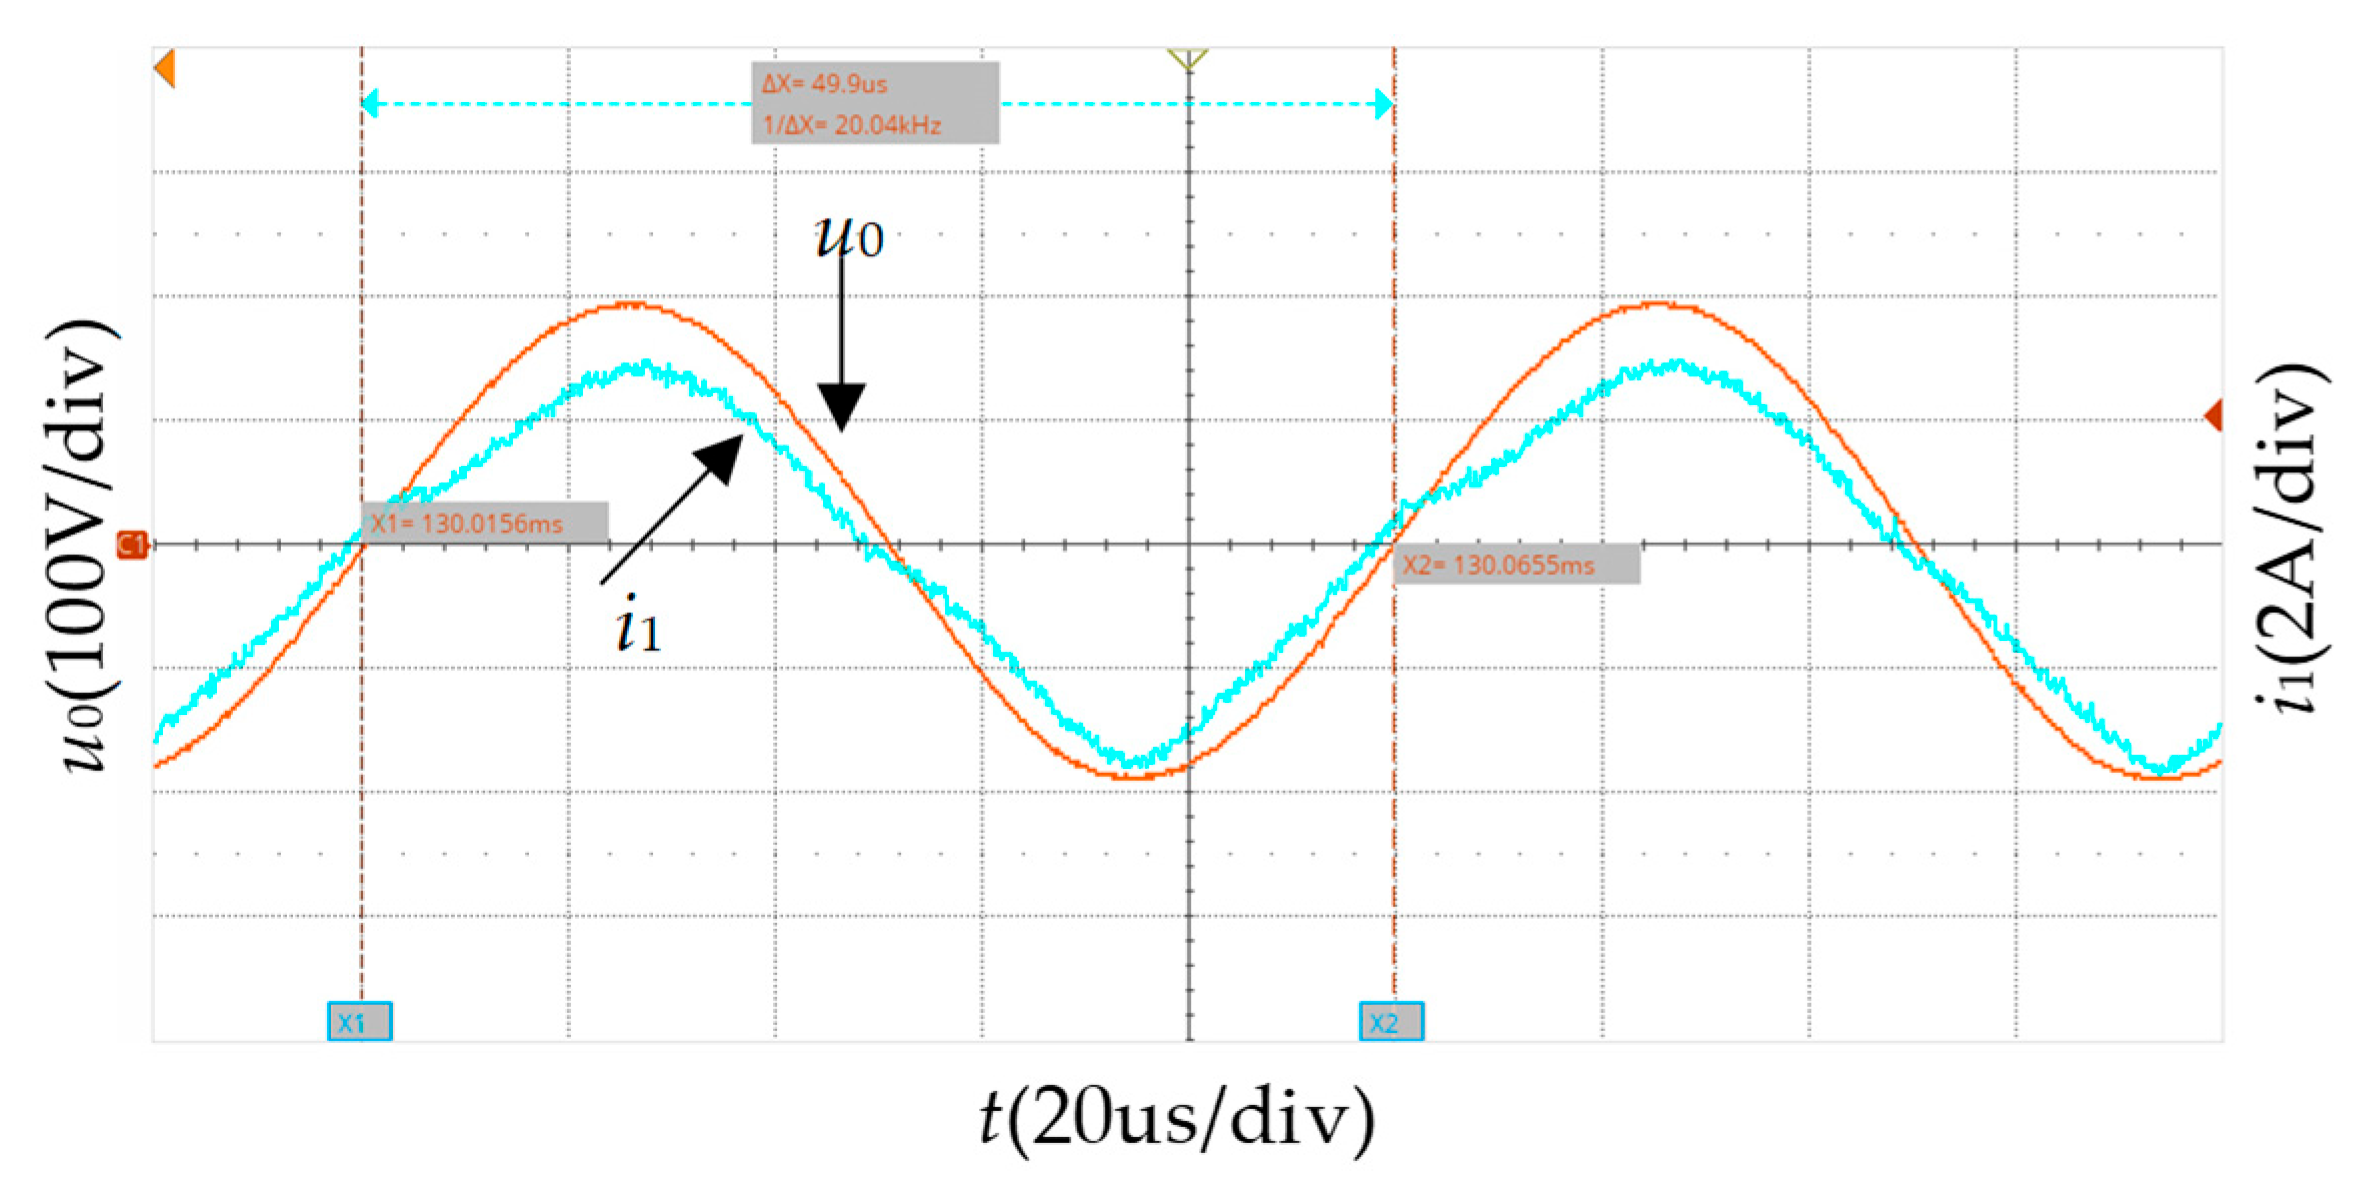
Frequency tracking performance was evaluated by initiating control algorithms at t = 100 ms. The initial operating frequency of the system was set to 19,900 Hz. Figure 20 presents the current and voltage waveforms of the PT in a detuned state, demonstrating a clear phase difference between the two signals. Figure 21 shows the waveform response of the PI control algorithm after 30 ms, when the system has not yet reached full stability and a phase deviation remains between the voltage and current. In contrast, Figure 22 demonstrates that the improved HO-SMC algorithm achieves near-complete phase synchronization within the same 30 ms timeframe.
Ultimately, the PI algorithm requires 115 ms to achieve system stabilization, as shown in Figure 23, whereas the HO-SMC algorithm completes frequency locking in only 53 ms, as shown in Figure 24. The experimental results confirm the superior efficacy of this algorithm in accurately tracking the series resonant frequency.

6. Conclusions

In order to enable the PT to convert power efficiently and stably, this study proposes a novel frequency tracking method based on an improved LC matching network that combines the HO algorithm with SMC, which significantly improves the dynamic performance and frequency tracking speed of the system.
To overcome the difficulty in analyzing the dynamic branching of the PT, this study uses an improved LC matching network. This network indirectly and accurately analyzes the series resonant frequency of the PT through voltage information, which solves the problem of the traditional method being difficult to analyze directly due to the electromechanical characteristics of the PT equivalent circuit. Theoretical analysis and experimental results show that the improved LC matching network can effectively extract the dynamic characteristics of the PT and provide a reliable basis for frequency tracking.
In this study, a frequency tracking method based on HO-SMC is proposed to optimize the parameters of the SMC through the HO algorithm, which significantly accelerates the speed of frequency tracking. Simulation and experimental results show that the method not only responds quickly to frequency changes but also has high tracking accuracy and robustness, which is especially suitable for ultrasonic welding systems with large load variations.
This study employs the proposed algorithm, and while it significantly improves control performance, it also introduces higher computational complexity, resulting in an extended system frequency adjustment cycle of 10 ms. This poses a serious challenge to the real-time performance of embedded systems. Currently, the understanding of the specific mechanisms by which voltage and current harmonics affect welding quality remains insufficient, particularly regarding the relationship between harmonic distortion and the formation of welding defects. Furthermore, the validation of this study is primarily based on a 20 kHz transducer, and systematic tests on different transducer frequencies have not yet been conducted, so its scalability remains to be further verified. Therefore, subsequent research will focus on algorithm simplification and fixed-point optimization to overcome computational bottlenecks and achieve higher-frequency control responses. In addition, further exploration of the mechanisms of harmonic effects will provide a more comprehensive theoretical basis for system optimization, and more transducers with typical frequencies will be selected to test the tracking accuracy and response speed of the algorithm in different frequency bands.

Author Contributions

Writing—original draft, methodology, and formal analysis, L.Y.; investigation, supervision, and writing—review, H.C.; software, data curation, and validation, L.Y.; project administration, funding acquisition, H.C. All authors have read and agreed to the published version of the manuscript.

Funding

This research was funded by the Innovation Fund for Industry-Academia-Research Collaboration of Chinese Higher Education Institutions (2024HY031).

Data Availability Statement

The data presented in this study are available from the corresponding author upon request.

Conflicts of Interest

The authors declare no conflicts of interest.

References

  1. Bhudolia, S.K.; Gohel, G.; Leong, K.F.; Islam, A. Advances in Ultrasonic Welding of Thermoplastic Composites: A Review. Materials 2020, 13, 1284. [Google Scholar] [CrossRef]
  2. Chen, T.-R.; Chen, C.-M.; Chen, P.-H.; Juan, Y.-L.; Lee, Y.-L.; Chang, H.-M. Coreless inductive power supply for ultrasonic transducer on machine tool. IEICE Electron. Express 2018, 15, 20180833. [Google Scholar] [CrossRef]
  3. Zhang, H.-F.; Wang, B.-J.; Zhao, A.-L. Research on power supply for adaptive ultrasonic vibration cutting based on piezoelectric technology. Agro Food Ind. Hi-Tech. 2017, 28, 2661–2665. [Google Scholar]
  4. Milewski, A.; Kluk, P.; Kardyś, W.; Kogut, P. Modeling and designing of ultrasonic welding systems. Arch. Acoust. 2015, 40, 93–99. [Google Scholar] [CrossRef]
  5. Taşlıyol, M.; Öncü, S.; Turan, M.E. An implementation of class D inverter for ultrasonic transducer mixed powder mixture. Ultrason. Sonochemistry 2024, 104, 106838. [Google Scholar] [CrossRef]
  6. Cheng, L.-C.; Kang, Y.-C.; Chen, C.-L. A Resonance-Frequency-Tracing Method for a Current-Fed Piezoelectric Transducer. IEEE Trans. Ind. Electron. 2014, 61, 6031–6040. [Google Scholar] [CrossRef]
  7. Fu, Y.; Wang, A. Dynamic compensation optimization and frequency characteristic analysis for contactless energy transfer under load variations in rotary ultrasonic machining. IEEE Trans. Ind. Electron. 2022, 70, 2948–2958. [Google Scholar] [CrossRef]
  8. Gemmen, R.S. Analysis for the Effect of Inverter Ripple Current on Fuel Cell Operating Condition. J. Fluids Eng. 2003, 125, 576–585. [Google Scholar] [CrossRef]
  9. Kuang, Y.; Jin, Y.; Cochran, S.; Huang, Z. Resonance tracking and vibration stablilization for high power ultrasonic transducers. Ultrasonics 2014, 54, 187–194. [Google Scholar] [CrossRef]
  10. Sonmezoglu, S.; Darvishian, A.; Shen, K.; Bustamante, M.J.; Kandala, A.; Maharbiz, M.M. A Method and Analysis to Enable Efficient Piezoelectric Transducer-Based Ultrasonic Power and Data Links for Miniaturized Implantable Medical Devices. IEEE Trans. Ultrason. Ferroelectr. Freq. Control 2021, 68, 3362–3370. [Google Scholar] [CrossRef]
  11. Mortimer, B.; du Bruyn, T.; Davies, J.; Tapson, J. High power resonant tracking amplifier using admittance locking. Ultrasonics 2001, 39, 257–261. [Google Scholar] [CrossRef]
  12. Zhu, W.; Zhang, J.-M. Frequency searching and tracking for multimodal ultrasonic vibration system. Tech. Acoust. 2008, 3, 361–364. [Google Scholar]
  13. Dong, H.; Zhang, G.; Dong, W.; Cai, H.; Zhang, Q. Current feedback frequency tracking control with matching of piezoelectric. J. Harbin Inst. Technol. 2000, 32, 115–122. [Google Scholar]
  14. Suzuki, T.; Ikeda, H.; Yoshida, H.; Shinohara, S. Megasonic transducer drive utilizing MOSFET DC-to-RF inverter with output power of 600 W at 1 MHz. IEEE Trans. Ind. Electron. 2000, 46, 1159–1173. [Google Scholar] [CrossRef]
  15. Jia, H.; Feng, P.X.L. Design of an automatic impedance matching circuit based on frequency tracking of ultrasonic transducer. In Proceedings of the 2020 IEEE 5th ITME Conference (ITOEC), Chongqing, China, 12–14 June 2020. [Google Scholar] [CrossRef]
  16. Zhang, Z.; Yan, T.H.; Chen, X.D.; He, B.; Xu, X.S. The Design and Dynamic Analysis of High Frequency Ultrasonic Transducer for Wire Bonding Application. Appl. Mech. Mater. 2012, 226–228, 199–202. [Google Scholar] [CrossRef]
  17. Jia, H.; Feng, P.X.L. Fast and Precise Control for the Vibration Amplitude of an Ultrasonic Transducer Based on Fuzzy PID Control. IEEE Trans. Ultrason. Ferroelectr. Freq. Control 2021, 68, 2766–2774. [Google Scholar] [CrossRef]
  18. Chen, X.; Li, X.; Li, R. Ultrasonic Power Load Forecasting Based on BP Neural Network. J. Inst. Eng. India Ser. C 2019, 101, 383–390. [Google Scholar] [CrossRef]
  19. Ding, Y.; Zheng, H.; Xiao, F.; Ma, H. Design of Ultrasonic Power Frequency Tracking System Based on PSO-PID. Chin. J. Electron Devices 2021, 44, 575–578. [Google Scholar]
  20. Jiang, X.; Zhang, X.; Zhu, X.; Sui, H.; Zhang, D. Study of Phase Shift Control in High-Speed Ultrasonic Vibration Cutting. IEEE Trans. Ind. Electron. 2018, 65, 2467–2474. [Google Scholar] [CrossRef]
  21. Hu, Y.; Yang, M.; Zhu, Y.; Wang, S. Push–Pull Inverter Using Amplitude Control and Frequency Tracking for Piezoelectric Transducers. Micromachines 2023, 14, 2147. [Google Scholar] [CrossRef] [PubMed]
  22. Moon, J.; Park, S.; Lim, S. A Novel High-Speed Resonant Frequency Tracking Method Using Transient Characteristics in a Piezoelectric Transducer. Sensors 2022, 22, 6378. [Google Scholar] [CrossRef]
  23. Jiang, K.; Zhang, J.; Chen, Z. A new approach for the sliding mode control based on fuzzy reaching law. In Proceedings of the 4th World Congress on Intelligent Control and Automation, Shanghai, China, 10–14 June 2002. [Google Scholar] [CrossRef]
  24. Feng, Y.; Han, F.; Yu, X. Chattering free full-order sliding-mode control. Automatica 2014, 50, 1310–1314. [Google Scholar] [CrossRef]
  25. Utkin, V. Discussion Aspects of High-Order Sliding Mode Control. IEEE Trans. Autom. Control 2016, 61, 829–833. [Google Scholar] [CrossRef]
  26. Cao, Y.; Kao, Y.; Wang, Z.; Yang, X.; Park, J.H.; Xie, W. Sliding mode control for uncertain fractional-order reaction–diffusion memristor neural networks with time delays. Neural Netw. 2024, 178, 106402. [Google Scholar] [CrossRef]
  27. Li, W.; Wu, C.; Lin, S.; Li, G.; Zhang, P. Active heave compensation of marine winch based on hybrid neural network prediction and sliding mode controller with a high-gain observer. Ocean. Eng. 2025, 322, 120448. [Google Scholar] [CrossRef]
  28. Liang, C.; Ding, Y.; Weng, F.; Chen, W.; Li, J. Dual observers based sliding mode control for QUAVs with unknown disturbances and time varying delays. Sci. Rep. 2025, 15, 5488. [Google Scholar] [CrossRef]
  29. Wang, J. Design of Ultrasonic Power Supply Based on Frequency Automatic Tracking and Power Regulation Technology. Ph.D. Thesis, Nanjing University of Information Science & Technology, Nanjing, China, 2021. [Google Scholar] [CrossRef]
  30. Amiri, M.H.; Hashjin, N.M.; Montazeri, M.; Mirjalili, S.; Khodadadi, N. Hippopotamus optimization algorithm: A novel nature-inspired optimization algorithm. Sci. Rep. 2024, 14, 5032. [Google Scholar] [CrossRef]
  31. Zheng, Y.; Gao, Y.; Gao, J. Energy Saving in Building Air-Conditioning Systems Based on Hippopotamus Optimization Algorithm for Optimizing Cooling Water Temperature. Energies 2025, 18, 2476. [Google Scholar] [CrossRef]
  32. He, X.; Liu, X.; Lin, C.; Fu, M.; Wang, J.; Zhang, J. Early Bearing Fault Diagnosis in PMSMs Based on HO-VMD and Weighted Evidence Fusion of Current–Vibration Signals. Sensors 2025, 25, 4591. [Google Scholar] [CrossRef] [PubMed]
  33. Meng, X.; Lin, S. Analysis of a Cascaded Piezoelectric Ultrasonic Transducer with Three Sets of Piezoelectric Ceramic Stacks. Sensors 2019, 19, 580. [Google Scholar] [CrossRef]
  34. Gan, Y.; Meng, B.; Chen, Y.; Sun, F. An intelligent measurement method of the resonant frequency of ultrasonic scalpel transducers based on PSO-BP neural network. Measurement 2022, 190, 110680. [Google Scholar] [CrossRef]
  35. Wang, J.; Qin, L.; Wei, P.; Tang, L. Modeling and analysis of multilayer piezoelectric-elastic spherical transducers. J. Intell. Mater. Syst. Struct. 2018, 29, 2437–2455. [Google Scholar] [CrossRef]
  36. Wang, J.-D.; Jiang, J.-J.; Duan, F.-J.; Zhang, F.-M.; Liu, W.; Qu, X.-H. A Novel Fast Resonance Frequency Tracking Method Based on the Admittance Circle for Ultrasonic Transducers. IEEE Trans. Ind. Electron. 2019, 67, 6864–6873. [Google Scholar] [CrossRef]
  37. Lee, J.; Kim, J. Theoretical and Empirical Verification of Electrical Impedance Matching Method for High-Power Transducers. Electronics 2022, 11, 194. [Google Scholar] [CrossRef]
  38. Feng, Y.; Zhao, Y.; Yan, H.; Cai, H. A Driving Power Supply for Piezoelectric Transducers Based on an Improved LC Matching Network. Sensors 2023, 23, 5745. [Google Scholar] [CrossRef] [PubMed]
Figure 1. Ultrasonic power supply schematic diagram.
Electronics 14 03358 g001
Figure 2. LC matching network.
Electronics 14 03358 g002
Figure 3. T-type matching network.
Electronics 14 03358 g003
Figure 4. Improved T-type matching network.
Electronics 14 03358 g004
Figure 5. The phase relationships of the variables.
Electronics 14 03358 g005
Figure 6. HO algorithm flowchart.
Electronics 14 03358 g006
Figure 7. Block diagram of HO−SMC.
Electronics 14 03358 g007
Figure 8. Ultrasonic welding power supply system simulation.
Electronics 14 03358 g008
Figure 9. Algorithm iteration comparison.
Electronics 14 03358 g009
Figure 10. Output frequency under various control methods in static conditions.
Electronics 14 03358 g010
Figure 11. The d1 value for the HO−SMC algorithm in static conditions.
Electronics 14 03358 g011
Figure 12. Voltage and current waveforms under non−resonant conditions in static conditions.
Electronics 14 03358 g012
Figure 13. Voltage and current waveforms under resonant conditions in static conditions.
Electronics 14 03358 g013
Figure 14. Output frequency under various control methods in dynamic conditions.
Electronics 14 03358 g014
Figure 15. The d1 value for the HO−SMC algorithm in dynamic conditions.
Electronics 14 03358 g015
Figure 16. Voltage and current waveforms under non−resonant conditions in dynamic conditions.
Electronics 14 03358 g016
Figure 17. Voltage and current waveforms under resonant conditions in dynamic conditions.
Electronics 14 03358 g017
Figure 18. Experimental platform.
Electronics 14 03358 g018
Figure 19. Power regulation experiment waveforms.
Electronics 14 03358 g019
Figure 20. Voltage and current waveforms under non-resonant conditions.
Electronics 14 03358 g020
Figure 21. Voltage and current waveforms under PI control at 130 ms.
Electronics 14 03358 g021
Figure 22. Voltage and current waveforms under HO-SMC at 130 ms.
Electronics 14 03358 g022
Figure 23. Waveforms under PID control.
Electronics 14 03358 g023
Figure 24. Waveforms under HO-SMC.
Electronics 14 03358 g024
Table 1. PT parameters.
ParametersC0 (nF)C1 (nF)L1 (mH)R1 (Ω)fs (Hz)
Value4.50.273231.84220,007
Table 2. Simulation parameters.
ParametersUnitValue
Input Voltage V220
Rated PowerkW2
Input Frequency Hz50
Resonant Frequency Hz20,007
Transformer Ratio 0.96
Matching Inductance Lm mH0.19
Matching Capacitance C4 nF44
Static Capacitance C0 nF4.5
Dynamic Inductance L1 mH231.8
Matching Capacitance C2 nF440
Matching Capacitance Cb nF440
Dynamic Resistance R1 Ω42
Dynamic Capacitance C1 nF0.273
Table 3. Parameter settings of the HO algorithm.
ParameterValue
Hippopotamus Population50
Adult Hippo Ratio0.3
Territory Radius0.5
Maximum Iterations40
Table 4. Simulation conclusions in static conditions.
Control MethodSettling Time (s)Overshoot (Hz)
PI0.082.85
SMC0.0460.03
PSO-SMC0.0230.03
HO-SMC0.0190.02
Table 5. Simulation conclusions in dynamic conditions.
Control MethodSettling Time (s)Overshoot (Hz)
PI0.0642.55
SMC0.0430.03
PSO-SMC0.030.03
HO-SMC0.0180.01
Disclaimer/Publisher’s Note: The statements, opinions and data contained in all publications are solely those of the individual author(s) and contributor(s) and not of MDPI and/or the editor(s). MDPI and/or the editor(s) disclaim responsibility for any injury to people or property resulting from any ideas, methods, instructions or products referred to in the content.