Article

Simulation Study on P-Shaped Process Layout for Automated Container Terminals

1
Shanghai Zhenhua Heavy Industries Co., Ltd., Shanghai 200125, China
2
School of Ocean & Civil Engineering, Shanghai Jiao Tong University, Shanghai 200240, China
3
College of Mechanical Engineering, Donghua University, Shanghai 201620, China
*
Author to whom correspondence should be addressed.
Electronics 2025, 14(17), 3356; https://doi.org/10.3390/electronics14173356 (registering DOI)
Submission received: 13 June 2025 / Revised: 21 August 2025 / Accepted: 22 August 2025 / Published: 23 August 2025

Abstract

Automated container terminals can achieve precise matching of equipment and space, thus forming the foundation for the terminals’ efficient operation. However, the increase in container volume requires the construction of more ACTs. Existing studies lack dynamic assessment of the deep coupling between the P-shaped layout and the terminal’s system performance verification under peak operating conditions. To solve these problems, this paper aims to evaluate the system performance of the process layout in the application of ACTs through simulation methods. We have identified the differences in indicators among various schemes, thereby providing decision support for the construction of the port. In this paper, a simulation method for the configuration based on a P-shaped process layout is proposed at ACTs. The port system is constructed as a discrete event simulation model consisting of five core modules. Then two P-shaped process layout schemes and one mixed process layout scheme are proposed and the terminal models are established, respectively. Finally, by conducting numerous simulation experiments under different layout schemes, the influence of traffic organization on the efficiency of the terminal system was analyzed. The results demonstrate that on the premise of the maturity of the mixed-traffic technology at the terminal, when the proportion of cross-berth operations is low, the system efficiency of the mixed layout scheme is the highest. This article takes a new type of P-shaped process layout as the research object, reveals the correlation between its traffic organization characteristics and system performance through a customized simulation method. It provides a new theoretical perspective and quantitative tool for the optimization of automated terminal layouts.

1. Introduction

1.1. Research Background

With the development of global economy, the volume of the global container transportation system has been expanding continuously. Regarding the volume of container handling per unit of time, the trend toward larger vessels and the increasing density of liner shipping networks have exerted substantial pressure on ports. However, traditional manually operated container terminals are affected by labor shortage and human errors. This phenomenon often leads to congestion during peak hours and fails to meet the strict requirements of modern logistics systems for transportation timeliness. Automated Container Terminals (ACTs) have become the development trend of ports. Since the first ACT was built at ECT-Delta in Rotterdam, the Netherlands in 1993, more than 120 automated terminals have been constructed or are under construction worldwide. With the advancement of automation technology, the layout of terminal processes has also shown diversified development and merits, such as safety, efficiency and environmental friendliness.

1.2. Existing Problems

The layout of ACTs includes the berth line layout, the yard layout, as well as the routes and paths of the AGVs. All these elements have a significant impact on the performance of ACTs [1]. Port operators are generally cautious about new layout schemes, mainly due to the high cost of automation systems, the efficiency limitations caused by technological adaptability, and the uncertainty of their returns. There is an urgent need for a method to assess whether terminal layout schemes can meet expected performance, aiding operators in decision-making. Most existing studies have focused on U-shaped layouts, physically isolated mixed layouts, etc. (such as the human–machine division model in Qinzhou Port) [2]. However, there is still a lack of systematic performance evaluation for P-shaped process layouts. The P-shaped layout achieves physical isolation of traffic flows through P-shaped lanes (for external trucks) and I-shaped lanes (for internal unmanned vehicles), which can theoretically reduce interference. Moreover, in actual operations, its efficiency performance, differences from existing layouts, and applicable scenarios remain unclear. Furthermore, existing simulation studies mostly focus on specific equipment scheduling or single layout optimization. They lack dynamic assessment of the deep coupling between the P-shaped layout and the terminal’s entire system, especially performance verification under peak operating conditions. This makes it difficult to support the actual decision-making of operators. Furthermore, building an ACT typically requires more than 1 billion US dollars and the investment payback period is over 15 years [3]. A variety of factors have led port operators to encounter dual uncertainties in their layout decisions, namely the technological maturity and economic returns.

1.3. Methods and Contributions

To solve the afore-mentioned issues, we focus on the deployment of P-shaped process layout and the evaluation of ACT system performance. The P-shaped process layout serves as the foundation for the operation of the container terminal system. Its performance evaluation needs to be conducted through deep coupling with the terminal’s entire operation system. As a typical large and complex system, there are strong interactions among multiple components within a container terminal. This necessitates that the assessment process fully takes into account the system’s integration. Additionally, port operators are more concerned about the performance of the P-shaped process layout in peak conditions. Therefore, it is urgent to develop a simulation method to systematically analyze the performance of the P-shaped layout, in order to fill the academic gap. Such a method can supply theoretical support for the planning decisions of the port operators.
This research makes significant contributions from the perspectives of the academic and industrial values. Firstly, a discrete event simulation model with dynamic adaptability was constructed. It can precisely depict the entire process of container terminal operations. Such a model covers the arrival of ships, container loading and unloading, as well as the collaborative scheduling mechanism of shore cranes, yard cranes and AGVs. Secondly, this paper designs three schemes in the context of the terminal: the P-shaped process layout with parallel stacking yards, the P-shaped process layout with vertical stacking yards, and the mixed-process layout with parallel stacking yards. These schemes are convenient for implementation in the operation system of the terminal. Thirdly, a large number of simulation experiments were conducted to analyze the performance differences of the proposed layout design. This assists port operators in selecting the optimal layout scheme.
The remainder of this paper is organized as follows. Section 2 conducts literature review. Section 3 describes the simulation model of the ACT. Section 4 introduces the design of different layout schemes for the P-shaped process layout. Section 5 analyzes the simulation results to address the concerns of port operators. Section 6 summarizes the research in this paper and provides some management insights for the application of the P-shaped process layout.

2. Literature Review

2.1. Layout Research of Container Terminals

The system layout planning method is widely used to optimize spatial resource allocation. During the planning process, it accounts for collaborative operations between automated machinery and manual work. This results in layout schemes that align with actual production needs [4]. Considering the safety and operational efficiency of the automated terminal operation process, most of the existing terminals currently adopt the process scheme where the running spaces for unmanned vehicles and trucks are isolated from each other [5]. Li et al. [6] established energy consumption models for yard cranes and container trucks, and investigated the impact of different container transfer ratios on the energy consumption of ACT under vertical and parallel layouts. Liu et al. [7] conducted research on an integrated solution to improve the efficiency of the container operation process in sea-rail intermodal transportation. The research was based on the container yard where AGVs and container trucks are jointly employed for horizontal transportation. Yang et al. [8] studied the layout scheme of the Qingdao Port, which features physical isolation between manned container trucks and AGVs in the transportation area and collaborative operation in the interaction zones between the sea side and the land side. Based on this, a digital twin system was developed. In recent years, a U-shaped process layout scheme has emerged, which separates the manned and unmanned operation areas. Wang & Jin. [9] studied the multi-device scheduling and intersection point allocation collaborative optimization problem considering direct transfer and indirect transfer methods based on the U-shaped layout automated sea-rail intermodal container terminal. Xu et al. [10] proposed a comprehensive scheduling optimization model based on mixed integer programming, which analyzed and characterized the layout and loading/unloading technology of U-shaped automated container terminals, aiming to improve the operational efficiency of AGVs. Li et al. [2] investigated U-shaped layout container terminals and proposed a high-platform operation mode for AGVs and container trucks working on different planes. By constructing the operation time models under the high-platform operation mode and the low-platform operation mode, the changes in the working efficiency of the terminals were studied. In addition, there are also process layout forms such as container storage yards based on overpasses and automated vertical storage yards [11,12,13].

2.2. Simulation Research of Container Terminals

For the new terminal process layout scheme, before its actual application, a simulation method needs to be used to conduct a systematic performance analysis and verification of the scheme [14]. This will help analyze its applicable scenarios and ensure the implementation effect of the automated port. Li et al. [15,16] conducted a detailed simulation study on the U-shaped layout design with dual-cantilever RMG for side-loading operations and vertical layout design with no-cantilever RMG for end-loading operations. They proposed a new simulation model based on intelligent agents and evaluated the performance indicators of the port, such as annual throughput of the port, waiting time of ships, and operational efficiency of the port cranes. Lee et al. [17] constructed a dual-objective optimization model based on queuing theory to solve the optimization problem of block size and facility configuration, and further explored the impact of single-lane and double-lane storage yard layouts on the operational efficiency of the port. Budiyanto et al. [18] conducted a comparative study on carbon emissions of ACTs, analyzed the simulation utility data based on vertical and parallel layouts, and proposed targeted optimization suggestions for layout selection in line with the sustainable development goals. Ma et al. [19] developed a discrete event simulation system that includes a ship generation module, a resource scheduling module, and a traffic network module to evaluate the impact of different charging facility layouts on key operational indicators in terminals. Wan et al. [20] proposed an Agent-based simulation method, which carried out dynamic modeling for the ship berthing and unberthing, QC loading and unloading operations, and truck transportation processes at the Shekou Container Terminal in China. It quantitatively analyzed the marginal impact of different emission reduction strategies on the operating costs and pollutant emissions of the terminal. Cho & Lee [21] established a cloud-based virtual port container terminal simulation model to systematically analyze the port’s productivity and operational efficiency. Kong & Ji [3] studied the layout schemes with vertical configuration of storage yards. They established an operation cycle formula by considering the dependencies and interference issues between the continuous operations of ASC, and optimized the design parameters of yard layouts in combination with simulation analysis methods. Tuncel & Deniz [22] integrated the terminal simulation model with the response surface methodology, and determined the optimal settings of key system equipment with the objectives of minimizing the average operation time and total operating cost. Yang et al. [23] established a simulation model for ACT with a U-shaped layout, and combined it with an improved proximal policy optimization algorithm to investigate a charging strategy that can dynamically adjust the AGV charging threshold to better adapt to terminal conditions. The simulation method can also be applied in various transportation fields [24,25].

2.3. Research Gaps

Previous studies have examined the evolution of container terminal facility planning from multiple perspectives. They have investigated different generations of automated terminal layouts. They have used discrete event simulation and agent-based simulation to assess system performance. These methods have provided insights into operational efficiency, equipment utilization, and traffic flow patterns. Despite these advancements, no systematic research has been carried out on the P-shaped process layout. This layout features a distinctive traffic organization mode. Its operational efficiency in real-world port environments is not yet clear. Its adaptability to varying workload scenarios remains untested. The lack of empirical evaluation creates uncertainty regarding its potential benefits or limitations. Moreover, existing research gap results in insufficient theoretical support for adopting the P-shaped process layout in automated container terminals. Without targeted studies, port planners and operators lack data-driven guidance. Dedicated research is needed to evaluate its performance, adaptability, and practical feasibility under diverse operating conditions.

3. Simulation Design for Container Terminal Operations

3.1. Operational Parameter Design for Container Terminals

Currently, ACTs worldwide are mainly concentrated in the field of seaports. This study takes the Xiaoyangshan North Operating Area of Shanghai Port as the research object. This terminal project is planned to build seven 6000-TEU and fifteen 1500-TEU container berths. Once completed, it will be capable of handling 11.6 million standard containers annually. The feature of this project is that there is a need for intensive container transfer operations between the sea vessel berths and the barge berths. Due to the fact that the road network configurations corresponding to different terminal process layouts vary, the impact of this on the overall performance of the terminal system also shows significant differences.
The terminal layout features double-trolley quay cranes at the quayside for ship-to-shore operations, unmanned horizontal transport vehicles for landside logistics, and dual-cantilever automated rail-mounted gantry cranes (ARMGs) in the yard for container stacking and retrieval. Comparative analysis is performed according to the three terminal process layouts. This article focuses on a portion of the berthing berths in this port project. The length of the terminal’s shoreline within the study area is 1600 m, which is capable of accommodating at least four 8000-TEU vessels. The terminal is equipped with 16 sets of double-trolley quay cranes. The ratio of unmanned vehicles to quay cranes will be experimentally set at 6, 7, and 8 per quay crane, respectively. The number of ARMGs is 40. The quay crane lifting equipment can lift two 20-foot containers at once (referred to as twin-lift operation). The change in the proportion of twin-lift operation containers among the total number of containers will affect the interaction time between unmanned vehicles and the quay crane. During the unloading operation, if the containers on the ship are not unloaded to the designated yard nearby but instead to other yards, this is called cross-berth operation. The higher the proportion of cross-berth operations, the greater the traffic flow at the sea-side access road of the terminal, and the more severe the congestion will be, thereby affecting the system efficiency. Our model sets the initial cross-berth operation ratio at 20%. The initial value for the twin-lift operation ratio is set at 20%. External container trucks arrive at the terminal at a rate of 120 per hour. The fundamental parameters of the terminal are outlined in Table 1.
The horizontal movement of the double-trolley quay crane is controlled by the main trolley and the auxiliary trolley. The main trolley moves along the quay line, while the front auxiliary trolley and the rear auxiliary trolley move in the direction perpendicular to the quay line. Each trolley is equipped with a hoist for vertical movement. The ARMG is also equipped with a main trolley, an auxiliary trolley and a hoist. The model simulates the maximum speed and acceleration of unmanned vehicles under different operating states with both no-load and fully loaded conditions, as well as those of various loading equipment under no-load and fully loaded states. The detailed equipment specifications are provided in Table 2.

3.2. Simulation Modeling

This study utilizes the SmartSimV1.0 software, which is simulation software specifically designed for container terminals. The software incorporates control logic and algorithms derived from real terminal systems, ensuring higher reliability and validity of the simulation results. It can be used during the planning and design phase of a terminal to evaluate and optimize layout schemes. Currently, this software has been applied to assess and validate process planning schemes for over 40 large automated container terminals worldwide, including the Shanghai Port of China, Ningbo Port of China, Mubarak Port of Kuwait. Partial simulation entities in the software are shown in Figure 1.
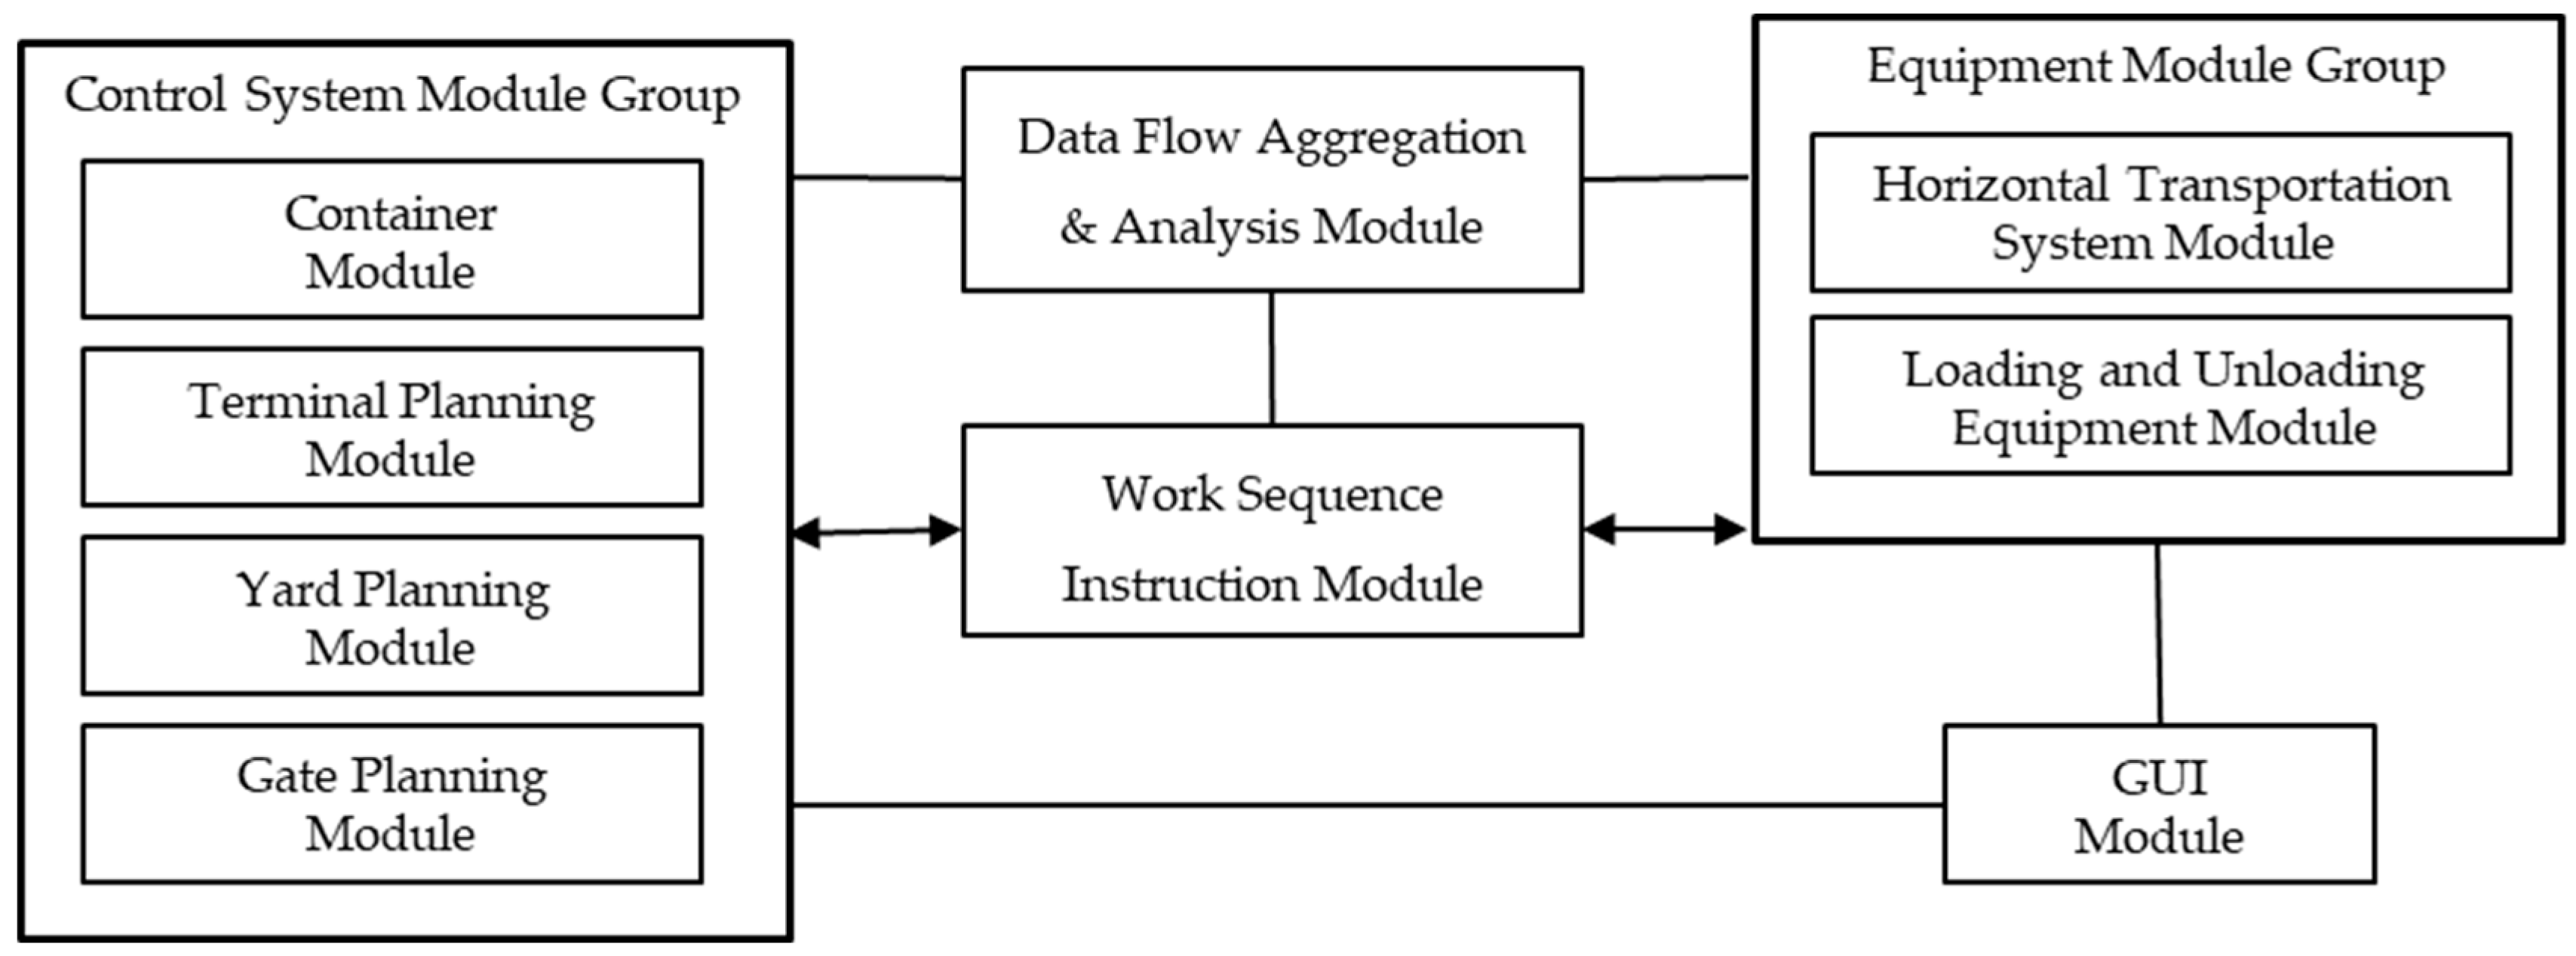
The SmartSim simulation architecture consists of five core components: the equipment module group, the control system module group, the work sequence instruction module, the data flow aggregation and analysis module and the GUI module. The architecture diagram of the SmartSim is shown in Figure 2.
The equipment module group: This part consists of two sub-modules, namely the horizontal transportation system module and the loading/unloading equipment module. The horizontal transportation system module defines the road system of the transportation area and automatically calculates the road network model, including lane line groups, parking spaces, and parking lots, etc. It defines the allocation of the vehicle pool, considering the vehicle quantity limit for serving a certain quay crane, the type of task, and the remaining task quantity of the quay crane under certain conditions, specifying that the vehicles in the pool are used to execute the loading and unloading tasks of the associated quay crane. After the vehicle determines the driving target, this module will plan the movement path between the target parking space and the current parking space. At the designated position of each driving line in the lane line group, a parking line is generated and associated with the traffic control object to simulate the traffic signal control system of a real port. The loading/unloading equipment module contains various equipment models commonly used in container terminals. In this model, the double-trolley quay crane, dual-cantilever ARMG, and unmanned vehicle are used. Based on the mechanical structure and kinematic characteristics of port machinery, a simulation model of the equipment is constructed using the parametric configuration method. Furthermore, the equipment speed is enabled to adapt to load changes by virtue of the constant-power speed variation function.
The control system module group: This part consists of four sub-modules. The container module is responsible for defining the physical and flow attributes of containers (such as size, type, loading and unloading ports, etc.), maintaining changes in attribute values during the simulation, supporting the batch generation of containers that conform to probability distributions and setting the start and end points of the process. The terminal planning module covers functions related to the shore line, including defining the shore line, vessel and anchorage attributes, managing the distribution of quay cranes and berthing plans. The yard planning module is used to define the attributes of container areas, preset the stacking intervals and container positions for containers, delineate the service range of ARMGs, and include functions for trajectory prediction of lifting devices and conflict management of ARMGs. The gate planning module can define the positions and orientations of each gate, set the arrival rules for external container trucks, and schedule the entry and exit of trucks from the yard based on the operating conditions.
The work sequence instruction module: This part is used to describe the operation process of the dock equipment, and it guides the equipment to execute the workflow through C language. It includes the WorkInstruction class, which always executes a specific device. The number of subclasses of the WorkInstruction class exceeds 50, and they are, respectively, used to describe the process timing, decisions, and device execution. The interpreter class InstructionInterpreter has developed corresponding functions for each possible WorkInstruction to predict the execution time of this WorkInstruction and define what behavior the executing process unit of the device will take during this period. After the work sequence starts to execute, the equipment begins to perform the actions specified by the interpreter.
The data flow aggregation and analysis module: This part has functions of data collection, data analysis, and indicator visualization. This module collects the simulation clock time and state change results of each model that have changed, serving as the basis for indicator statistics. For resource-based objects, this function mainly collects the workload. Taking the yard as an example, this function collects data such as the inbound container quantity, outbound container quantity, on-site container quantity, and reversing container quantity. For device-based objects, this function mainly collects the workload and operating status. Based on the collected data, indicator values can be calculated according to the specified method for users to evaluate and make decisions. After the indicator calculation is completed, the analysis results can be quickly imported into the designed chart template for visual display or further processing.
The GUI module: This part is mainly responsible for handling the interaction between SmartSim and users. Users can set object parameters and display object information, and build models by directly interacting with the graphical interface.
The simulation model makes the following assumptions:
  • This study was conducted under ideal conditions, ignoring equipment failures and all kinds of unexpected factors that cause work interruptions;
  • The inbound and outbound containers are evenly distributed in the yard;
  • The storage locations of the containers are selected randomly.
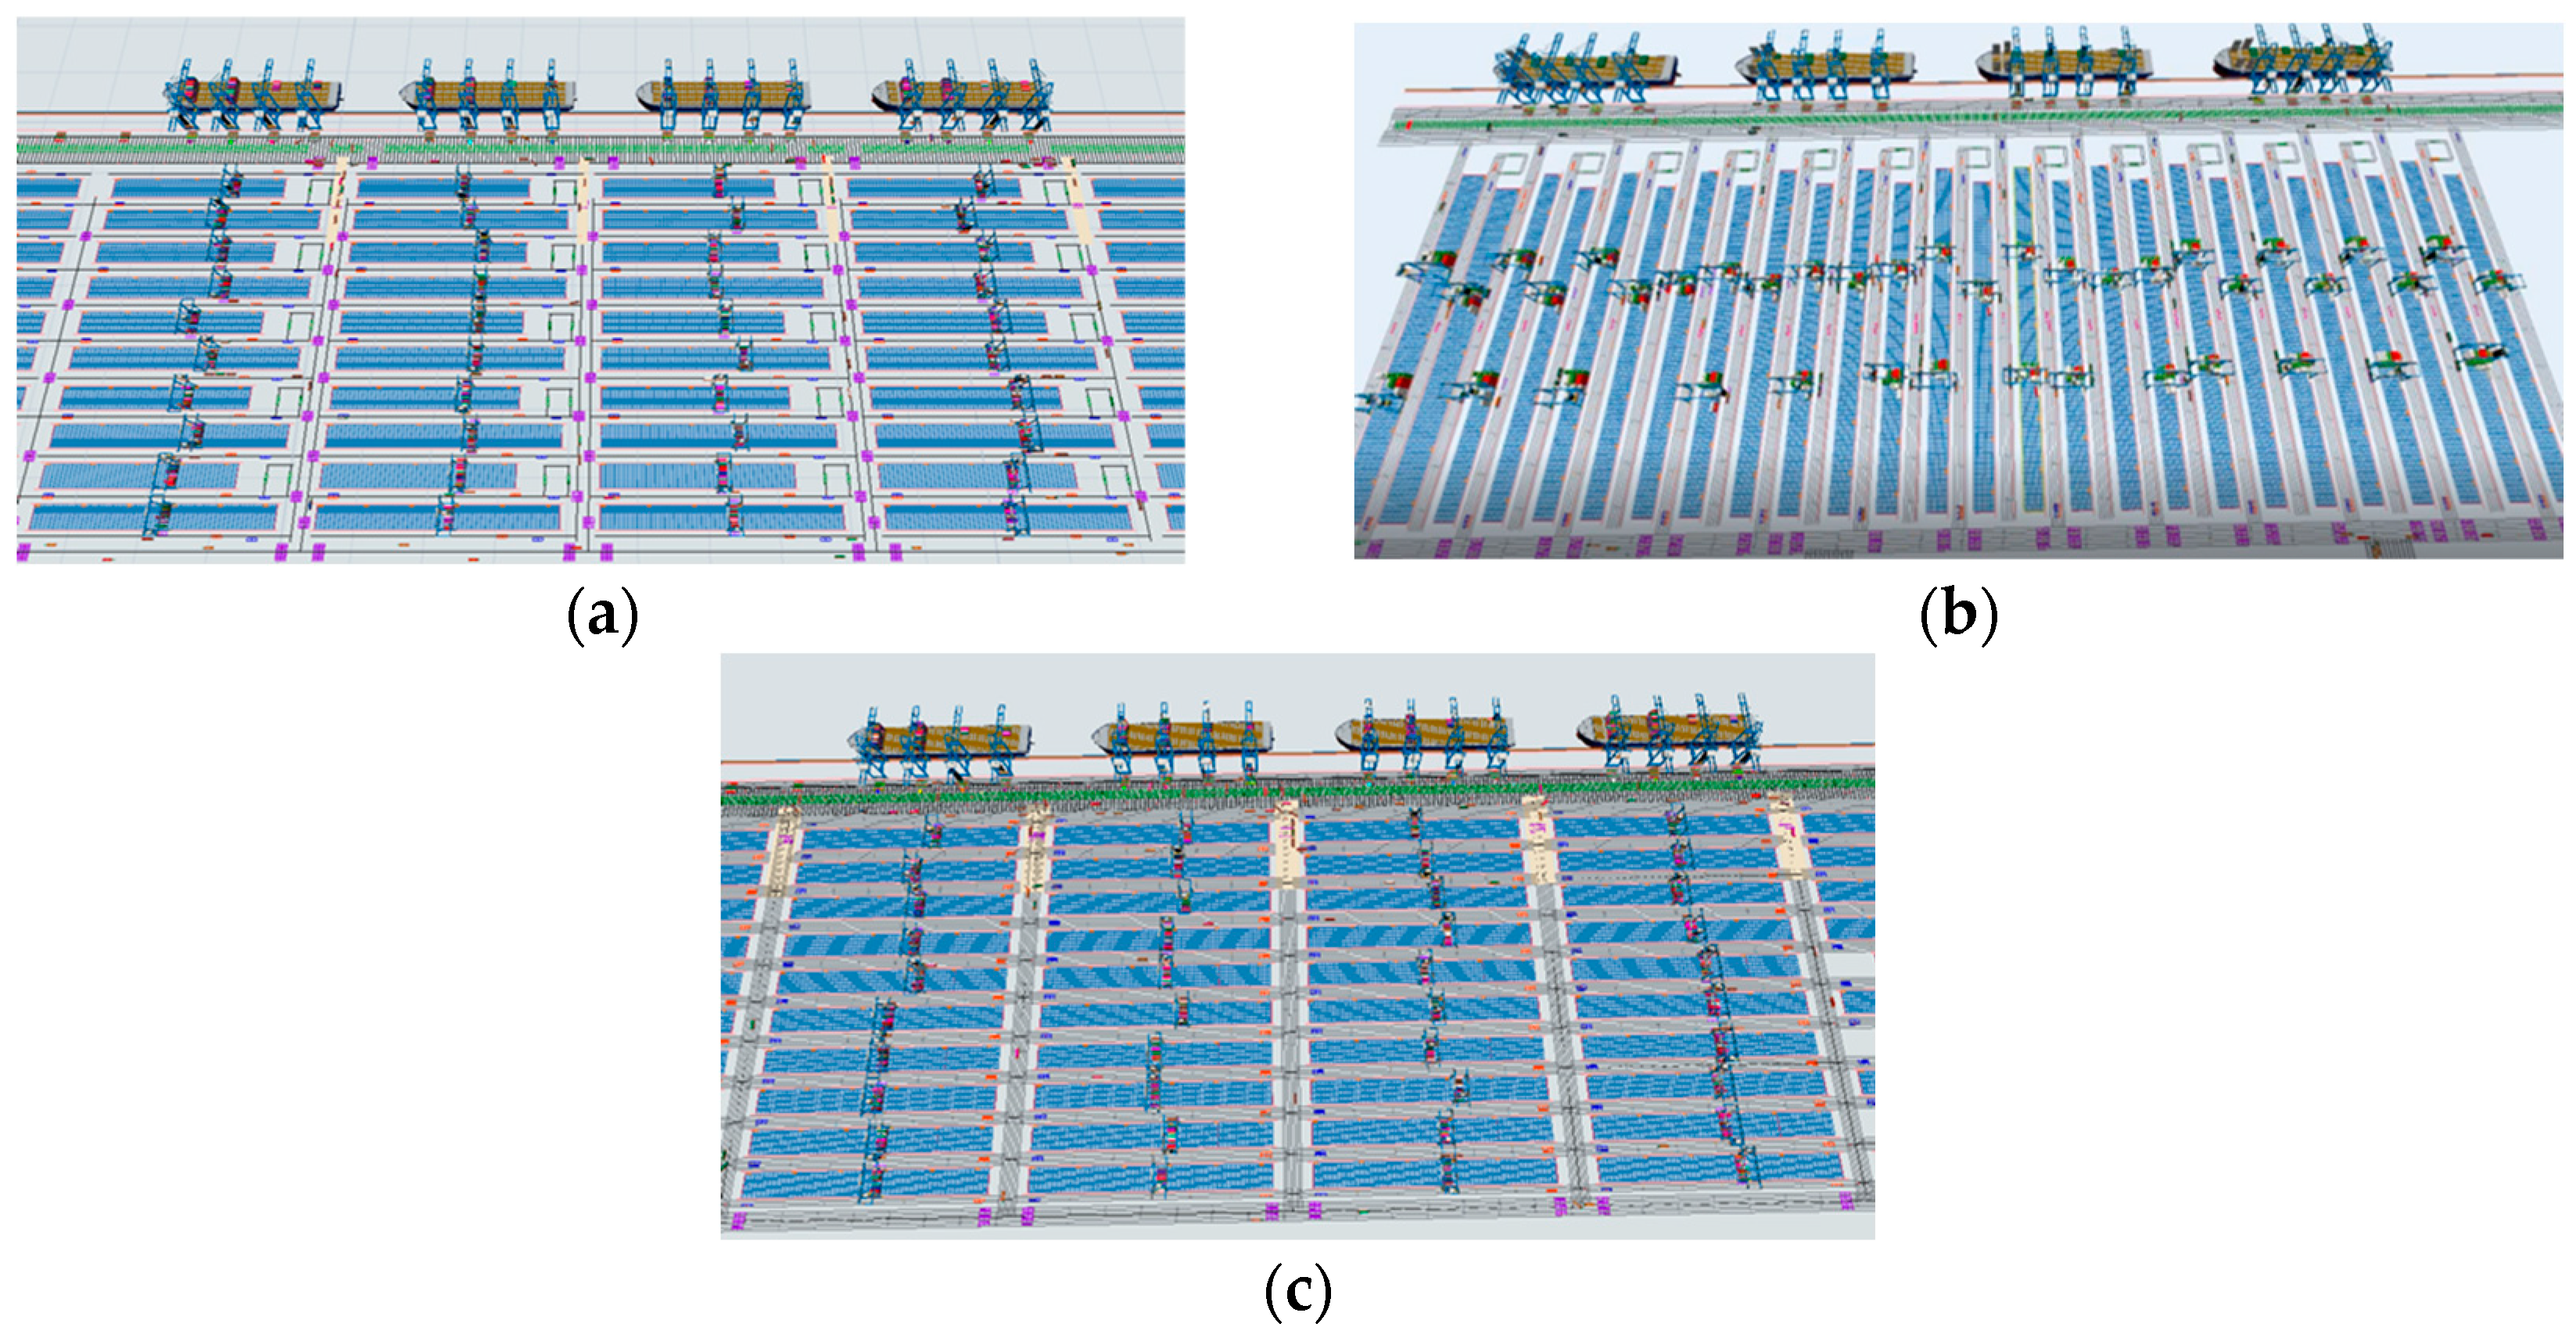
Using this simulation software, models were created for these three terminal process layout schemes. The terminal simulation models are illustrated in Figure 3. The detailed layout scheme is described in Section 4.

3.3. Simulation Experiment Setup

In this study, the simulation considers 8 quay cranes for unloading and 8 quay cranes for loading, with external trucks arriving at the terminal according to a predefined frequency. The inbound and outbound container operations are evenly distributed, each accounting for 50% of the total operations. In the basic analysis, the ratio of unmanned vehicles is varied to compare and analyze the system efficiency and traffic congestion conditions under the three different process layout schemes.
Additionally, the most significant difference among the three process layouts lies in the traffic network configuration. During actual terminal operations, the operation plan also has a substantial impact on traffic organization. Therefore, assuming the ratio of unmanned vehicles is set to 7, a sensitivity analysis of the operation plan for the cross-berth operation ratio and the twin-lift operation ratio is conducted to analyze the impact on system performance. The experimental settings are shown in Table 3.

4. P-Shaped Container Terminal Handling Process Scheme

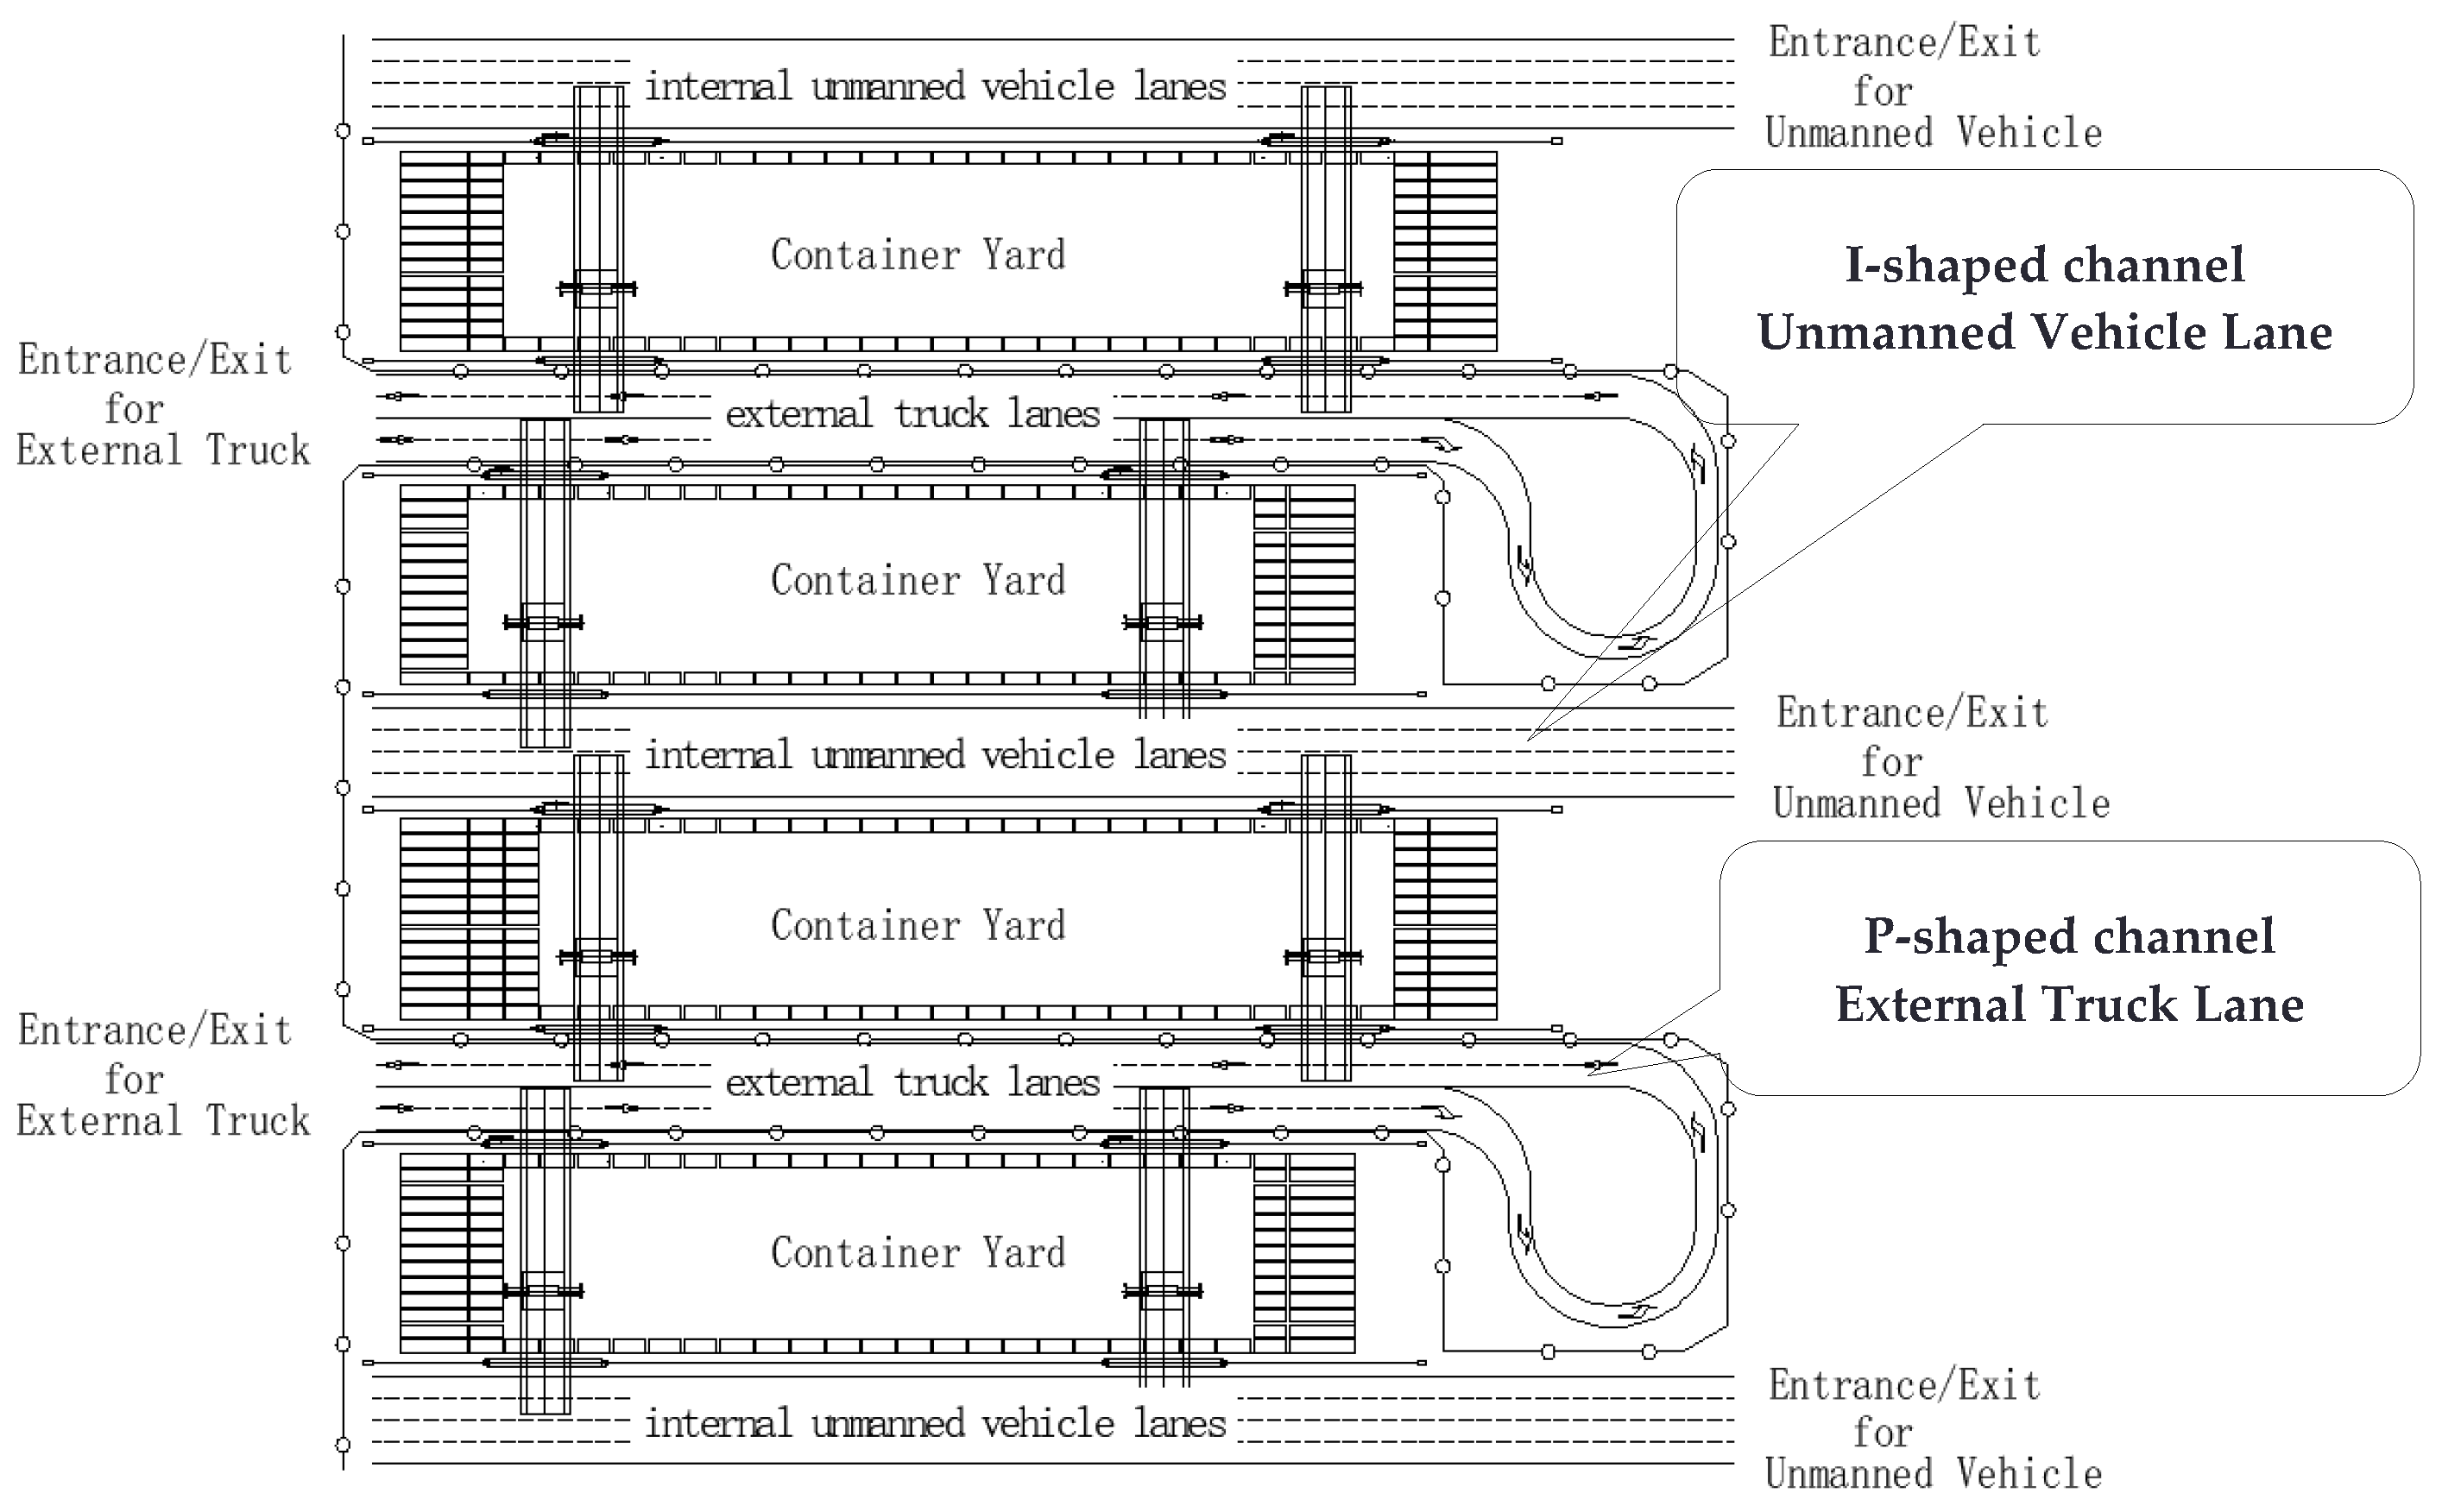
In the P-shaped container terminal handling process layout scheme, the container yard is arranged either parallel or perpendicular to the wharf shoreline. Container handling within the yard utilizes dual-cantilever Automated Rail-Mounted Gantry cranes (ARMG), while intra-port horizontal transportation is performed by unmanned transport systems.
The transport channels for external truck operations within the yard are designed in a P-shaped configuration. External trucks access the yard via this P-shaped loop, enabling them to enter and exit efficiently. In contrast, internal unmanned vehicles operate along an I-shaped channel for their ingress and egress. The external trucks and internal unmanned vehicles conduct container pick-up, delivery, and ship loading/unloading operations under the respective cantilevers of the ARMG.
Through the combination of P-shaped and I-shaped channel layouts, the physical segregation of traffic flows between external trucking operations and internal horizontal transportation systems is fully achieved, minimizing interference and enhancing operational efficiency. A typical yard layout for the P-shaped handling process scheme is illustrated in Figure 4.
To evaluate the system performance of the P-shaped process layout scheme, two variations in the P-shaped layout were designed for a hypothetical container terminal with a shoreline length of 1600 m and a yard depth of 730 m. In Scheme One, the container yard is arranged parallel to the shoreline, while in Scheme Two, the yard is arranged perpendicular to the shoreline. Furthermore, to compare the P-shaped process layout with the mixed-traffic process layout, a reference scheme (Scheme Three) was developed under the same terminal conditions, featuring a container yard arranged parallel to the shoreline and utilizing a mixed-traffic operational mode for horizontal transportation.

4.1. Scheme One: P-Shaped Layout with Yard Parallel to Shoreline

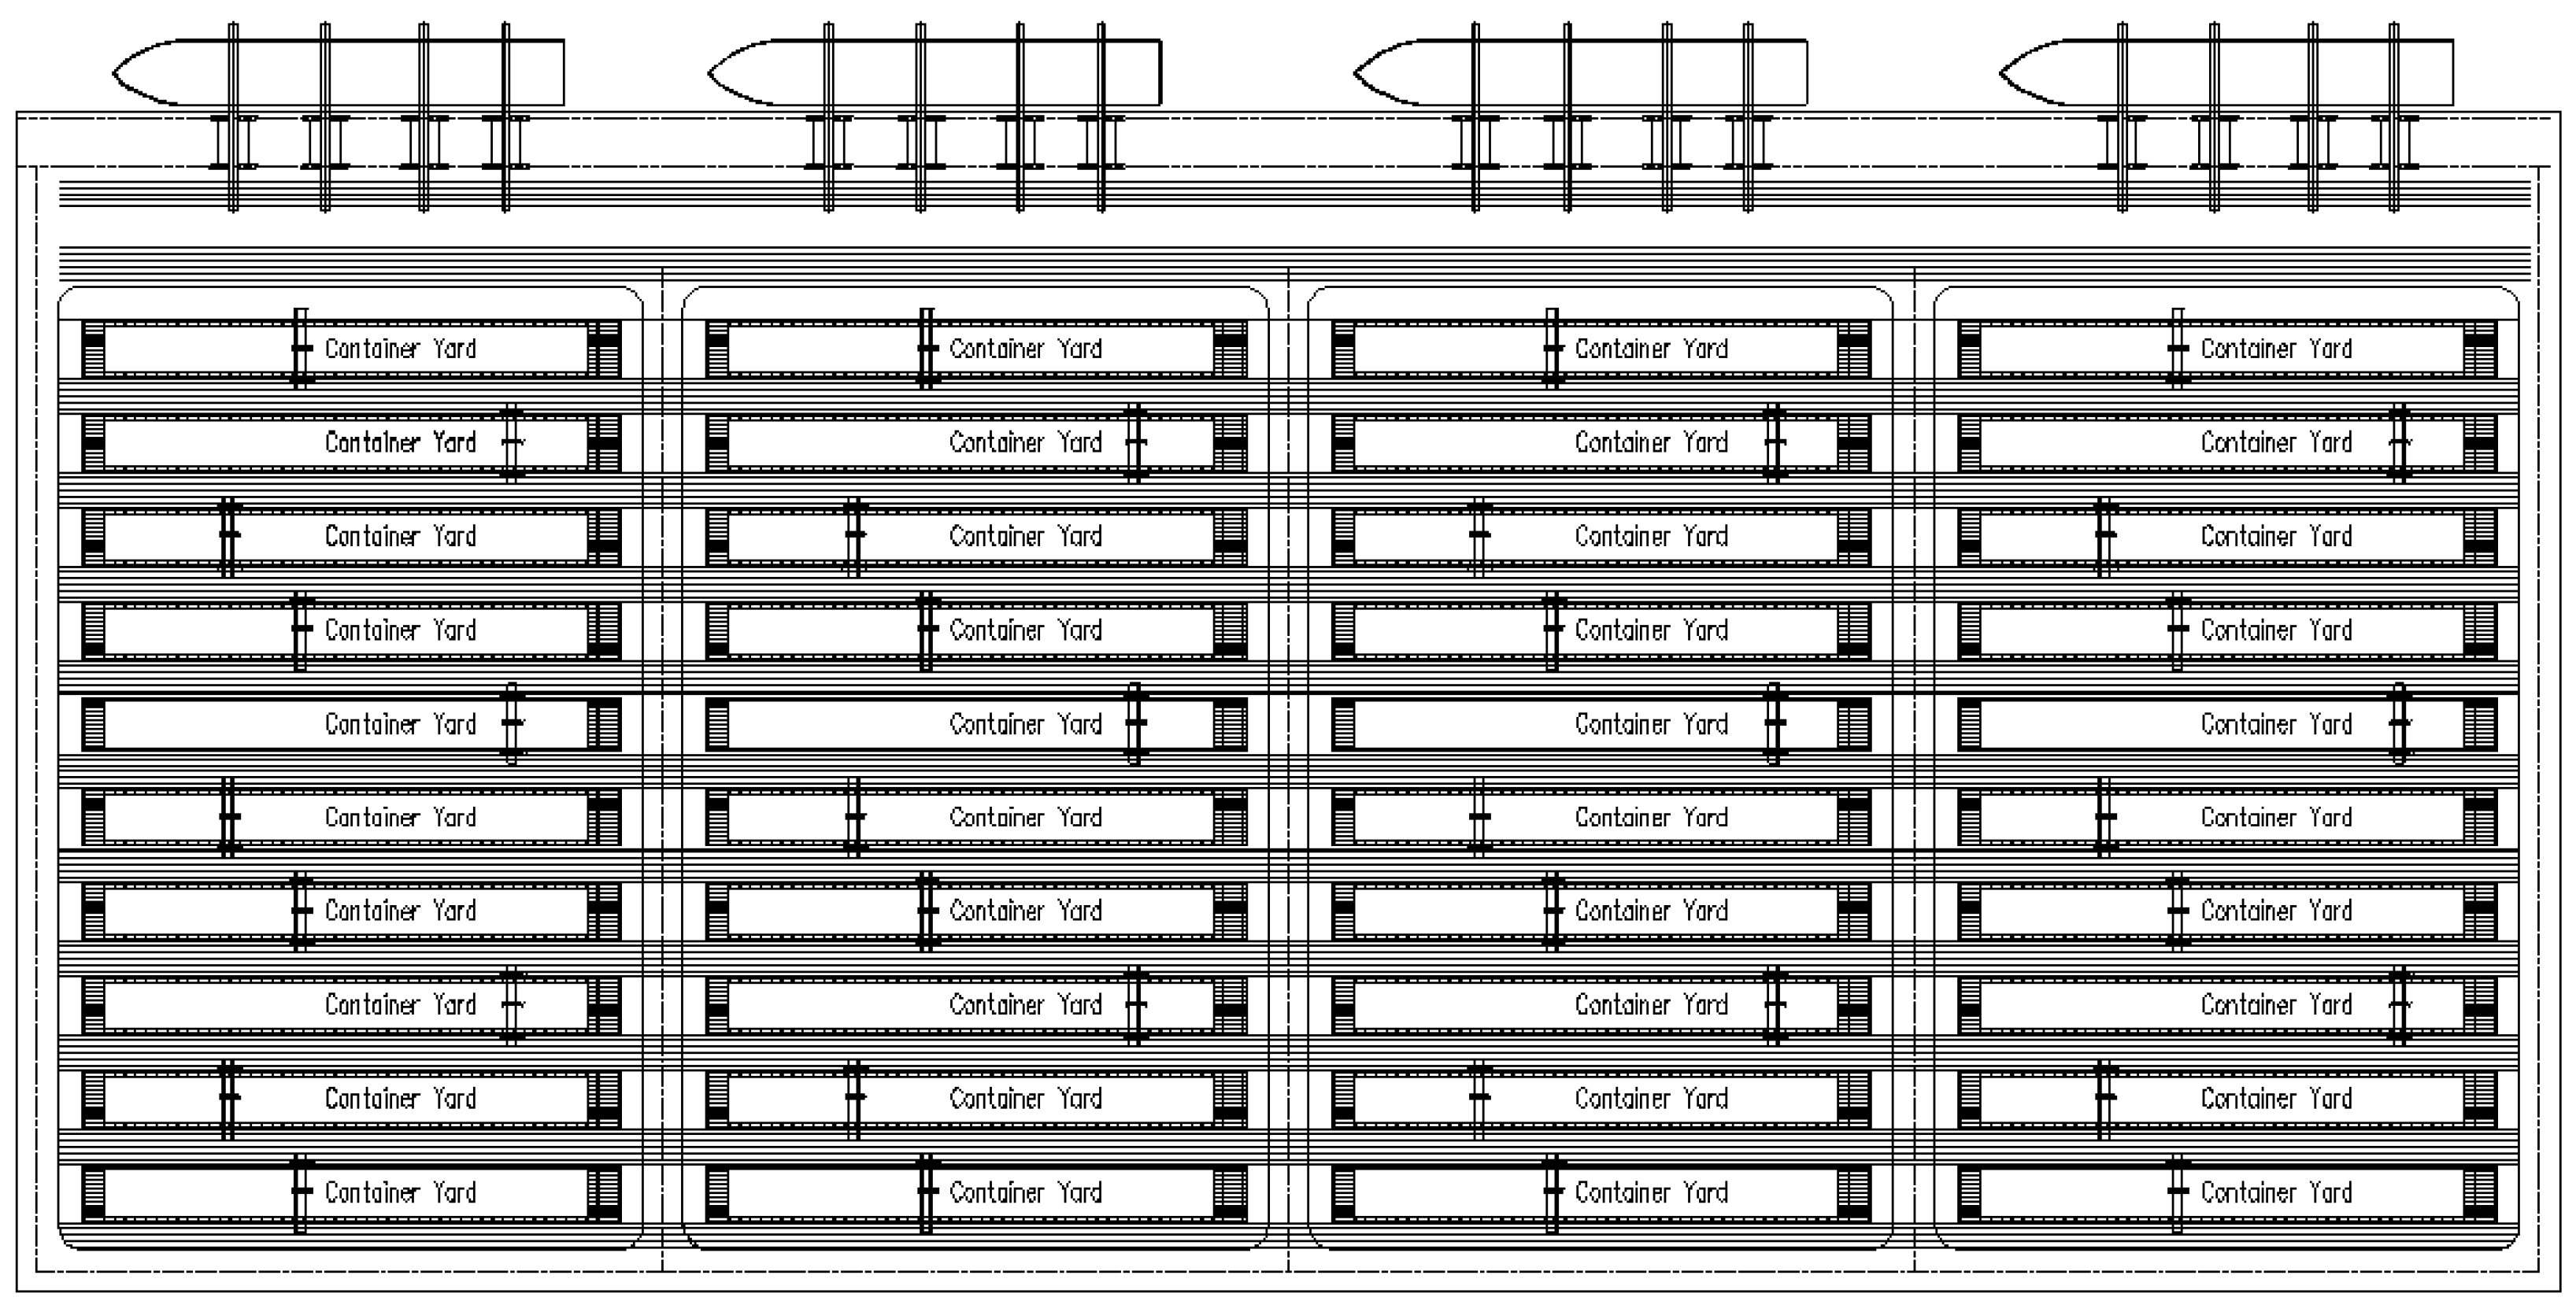
As shown in Figure 5, the P-shaped process layout arranges the container yard parallel to the shoreline. At the quay front, 16 Double-Trolley Quay Cranes (QCs) are deployed for ship-to-shore operations. The yard is divided into 40 storage blocks, each equipped with one dual-cantilever automated rail-mounted gantry crane (ARMG). The total ground slot capacity of the yard is 21,240 TEUs. External trucks access the yard via a P-shaped loop channel, while internal unmanned vehicles (AGVs/IGVs) use an I-shaped channel for ingress and egress. During horizontal transportation, external and internal vehicles operate on segregated lateral and longitudinal road networks, ensuring non-interfering traffic flows.

4.2. Scheme Two: P-Shaped Layout with Yard Perpendicular to Shoreline

Figure 6 illustrates the P-shaped process layout where the container yard is arranged perpendicular to the shoreline. Similarly to Scheme One, 16 Double-Trolley Quay Cranes (QCs) are installed at the quay front. The yard comprises 26 storage blocks, with either one or two dual-cantilever ARMGs allocated per block. The total ground slot capacity is 24,336 TEUs. During horizontal transportation, external and internal vehicles travel on segregated lateral and longitudinal roads through the P-shaped and I-shaped channels, maintaining non-interfering traffic flows.

4.3. Scheme Three: Mixed-Traffic Layout with Yard Parallel to Shoreline

The mixed-traffic process layout, as depicted in Figure 7, arranges the container yard parallel to the shoreline. Like the previous schemes, 16 Double-Trolley Quay Cranes (QCs) are installed at the quay front. The yard consists of 40 storage blocks, each equipped with one dual-cantilever ARMG. The total ground slot capacity is 24,960 TEUs. Unlike Schemes One and Two, this scheme employs a mixed-traffic mode for longitudinal road access, while lateral roads remain segregated. It assumes advanced mixed-traffic technology enables seamless integration of manned and unmanned vehicles without barriers or traffic signals, optimizing shared longitudinal road usage.

4.4. Comparison of Handling Equipment Configuration and Ground Slot Capacity

The handling equipment configuration and ground slot capacity for the three container terminal process layouts discussed above are detailed in Table 4.
Table 4 summarizes the handling equipment configurations and ground slot capacities for the three terminal process layouts discussed above. From the table, it is clear that Scheme One has the lowest ground slot capacity due to the significant space occupied by the P-shaped turning area and the independent longitudinal roads required for segregated internal and external horizontal transportation. In contrast, Scheme Three achieves the highest ground slot capacity by adopting a shared longitudinal road for mixed traffic and eliminating the need for a P-shaped turning area, thus minimizing road-related space consumption within the yard.

5. Simulation Data Analysis

5.1. Evaluation Metrics

The following formulas are used to evaluate the simulation results:
t Q C = t Q C O + t Q C W + t Q C I ,   unit :   h
where
  • t Q C : Quay crane operation time, unit: h
  • t Q C O : Quay crane handling time, unit: h
  • t Q C W : Quay crane waiting time, unit: h
  • t Q C I : Quay crane idle time, unit: h
η Q C = N Q C t Q C ,   unit :   b o x / h ,
where
  • η Q C : Quay crane efficiency, unit: box/h
  • N Q C : Number of containers handled by the quay crane, unit: box
  • t Q C : Quay crane operation time, unit: h
U Q C = t Q C O t Q C × 100 % ,   unit :   % ,
where
  • U Q C : Quay crane utilization rate, unit: %
  • t Q C O : Quay crane handling time, unit: h
  • t Q C : Quay crane operation time, unit: h
L A = L C ,   unit :   m / c y c l e ,
where
  • L A : Average cycle distance of unmanned vehicle, unit: m/cycle
  • L : Total travel distance of unmanned vehicles, unit: m
  • C: Number of operational cycles completed by unmanned vehicles, unit: cycle
V = L t v ,   unit :   m / s ,
where
  • V : Average speed of unmanned vehicles, unit: m/s
  • L : Total travel distance of unmanned vehicles, unit: m
  • t v : Total travel time of unmanned vehicles, unit: s
t V A = t V T + t V Q C + t V B + t V Q C W + t V B W + t V C ,   unit :   h
where
  • t V A : Average cycle time of unmanned vehicles, unit: h
  • t V T : Travel time, unit: h
  • t V Q C : Time spent operatings at the quay crane, unit: h
  • t V B : Time spent operatings in the yard, unit: h
  • t V Q C W : Waiting time at the quay crane, unit: h
  • t V B W : Waiting time in the yard, unit: h
  • t V C : Time spent in traffic congestion within the road system, unit: h
(Note: In the simulation, unmanned vehicles operate in a single-loop mode, meaning half of each cycle involves carrying loaded containers, while the other half involves empty trips between the quay and the yard).
U V = t V C t V A × 100 % ,   unit :   %
where
  • U V : Congestion rate of unmanned vehicles, unit: %
  • t V C : Traffic congestion time per cycle within the road system, unit: h
  • t V A : Total cycle time of unmanned vehicles, unit: h

5.2. Basic Experimental Results

Under the simulation assumptions described above, the efficiency of quay cranes under the three layout schemes with varying ratios of unmanned vehicles was obtained through simulation, as shown in Figure 8. From Figure 8, it can be observed that the quay crane efficiency is highest for the mixed-traffic layout, followed by the perpendicular P-shaped layout, and lowest for the parallel P-shaped layout. Taking a ratio of 7 unmanned vehicles as an example:
  • The quay crane efficiency for the parallel P-shaped layout is 33.15 box/h.
  • The perpendicular P-shaped layout improves quay crane efficiency by approximately 4% compared to the parallel P-shaped layout.
  • The mixed-traffic layout improves quay crane efficiency by approximately 11% compared to the perpendicular P-shaped layout and 15% compared to the parallel P-shaped layout.
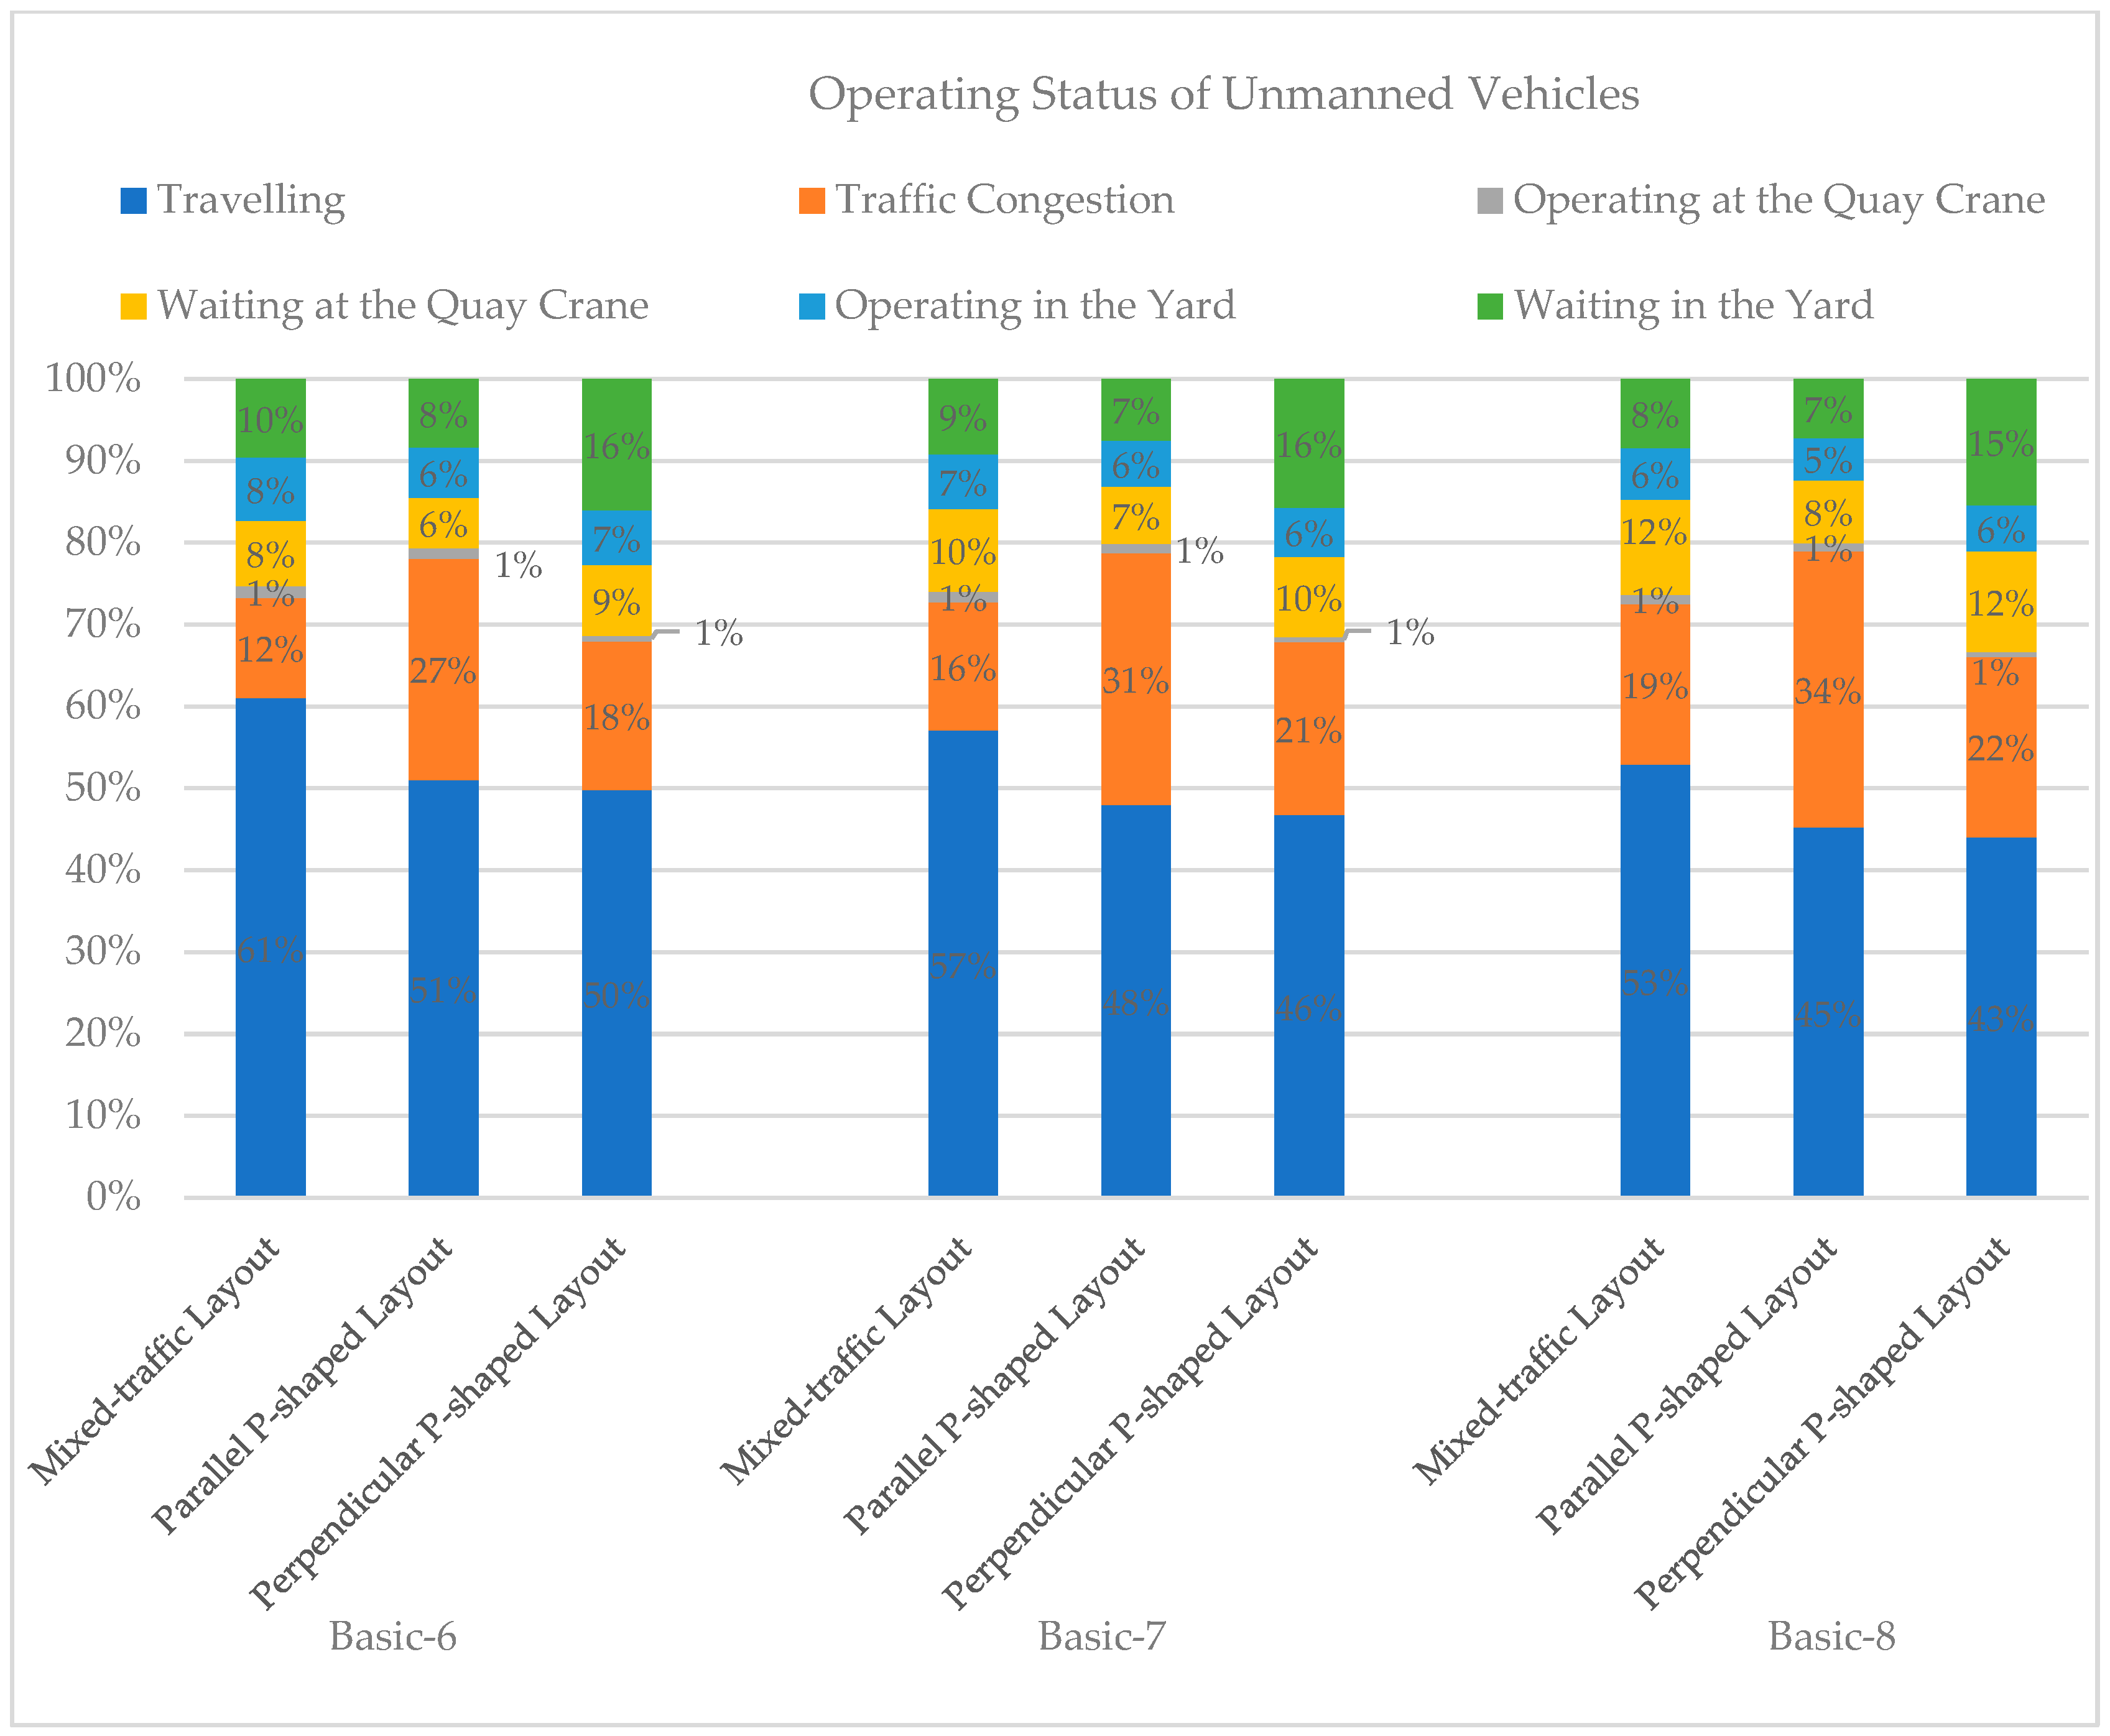
As shown in Figure 9, the unmanned vehicle congestion rate is lowest for the mixed-traffic layout, followed by the perpendicular P-shaped layout, and highest for the parallel P-shaped layout. Taking a ratio of 7 unmanned vehicles as an example:
  • The congestion rate for the mixed-traffic layout is approximately 16%.
  • The congestion rate for the perpendicular P-shaped layout is 21%, and for the parallel P-shaped layout, it is 31%.
The congestion rate increases as the number of unmanned vehicles increases.
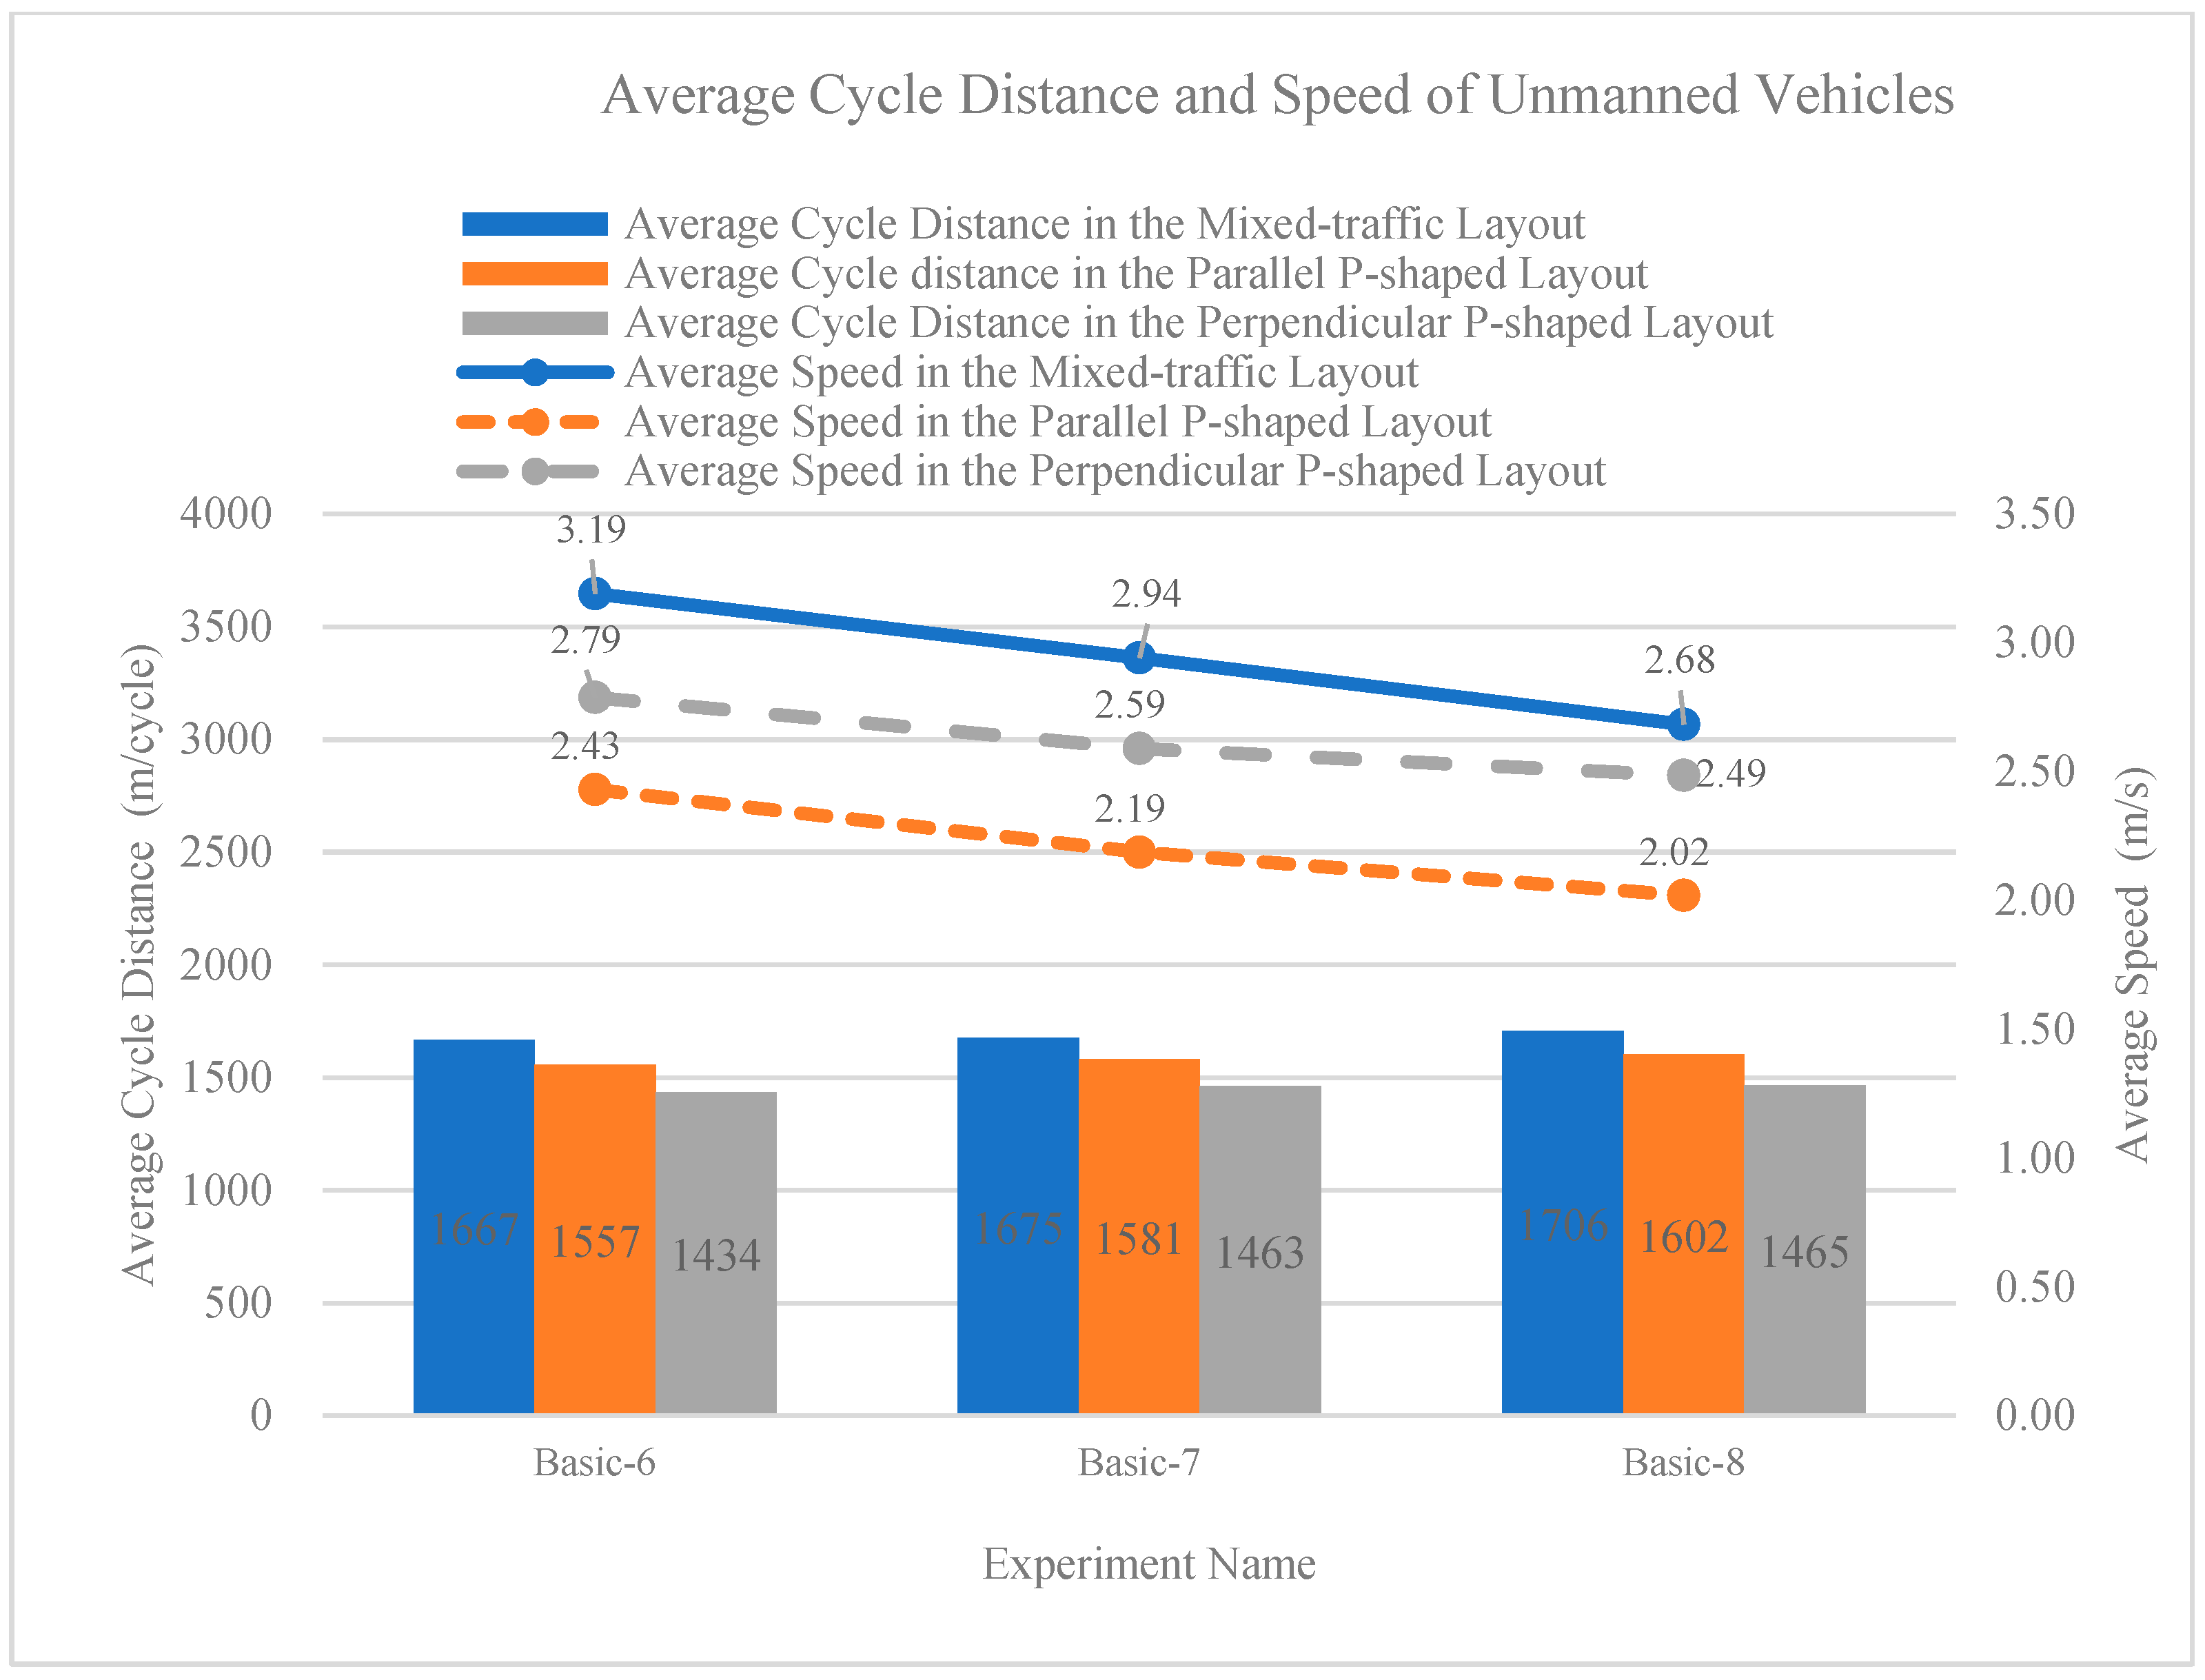
Figure 10 shows the average cycle distance and speed of unmanned vehicles. In the mixed-traffic layout, vehicles travel along a circular path within the yard, resulting in the longest average cycle distance of approximately 1.6 km/cycle. The parallel P-shaped layout has the second-longest distance at about 1.5 km/cycle, while the perpendicular P-shaped layout has the shortest distance at around 1.4 km/cycle. Combining insights from Figure 8 and Figure 9, although the mixed-traffic layout has the longest average cycle distance, its congestion rate is the lowest, leading to the highest average vehicle speed. The perpendicular P-shaped layout ranks second in terms of speed, while the parallel P-shaped layout has the lowest speed. Taking a ratio of 7 unmanned vehicles as an example:
  • The average speed for the parallel P-shaped layout is 2.19 m/s.
  • The average speed for the perpendicular P-shaped layout is 2.59 m/s, representing an increase of approximately 18% compared to the parallel P-shaped layout.
  • The average speed for the mixed-traffic layout is 2.94 m/s, which is approximately 14% higher than the perpendicular P-shaped layout and 34% higher than the parallel P-shaped layout.
The average vehicle speed decreases as the number of unmanned vehicles increases.

5.3. Sensitivity Analysis of Operation Plans

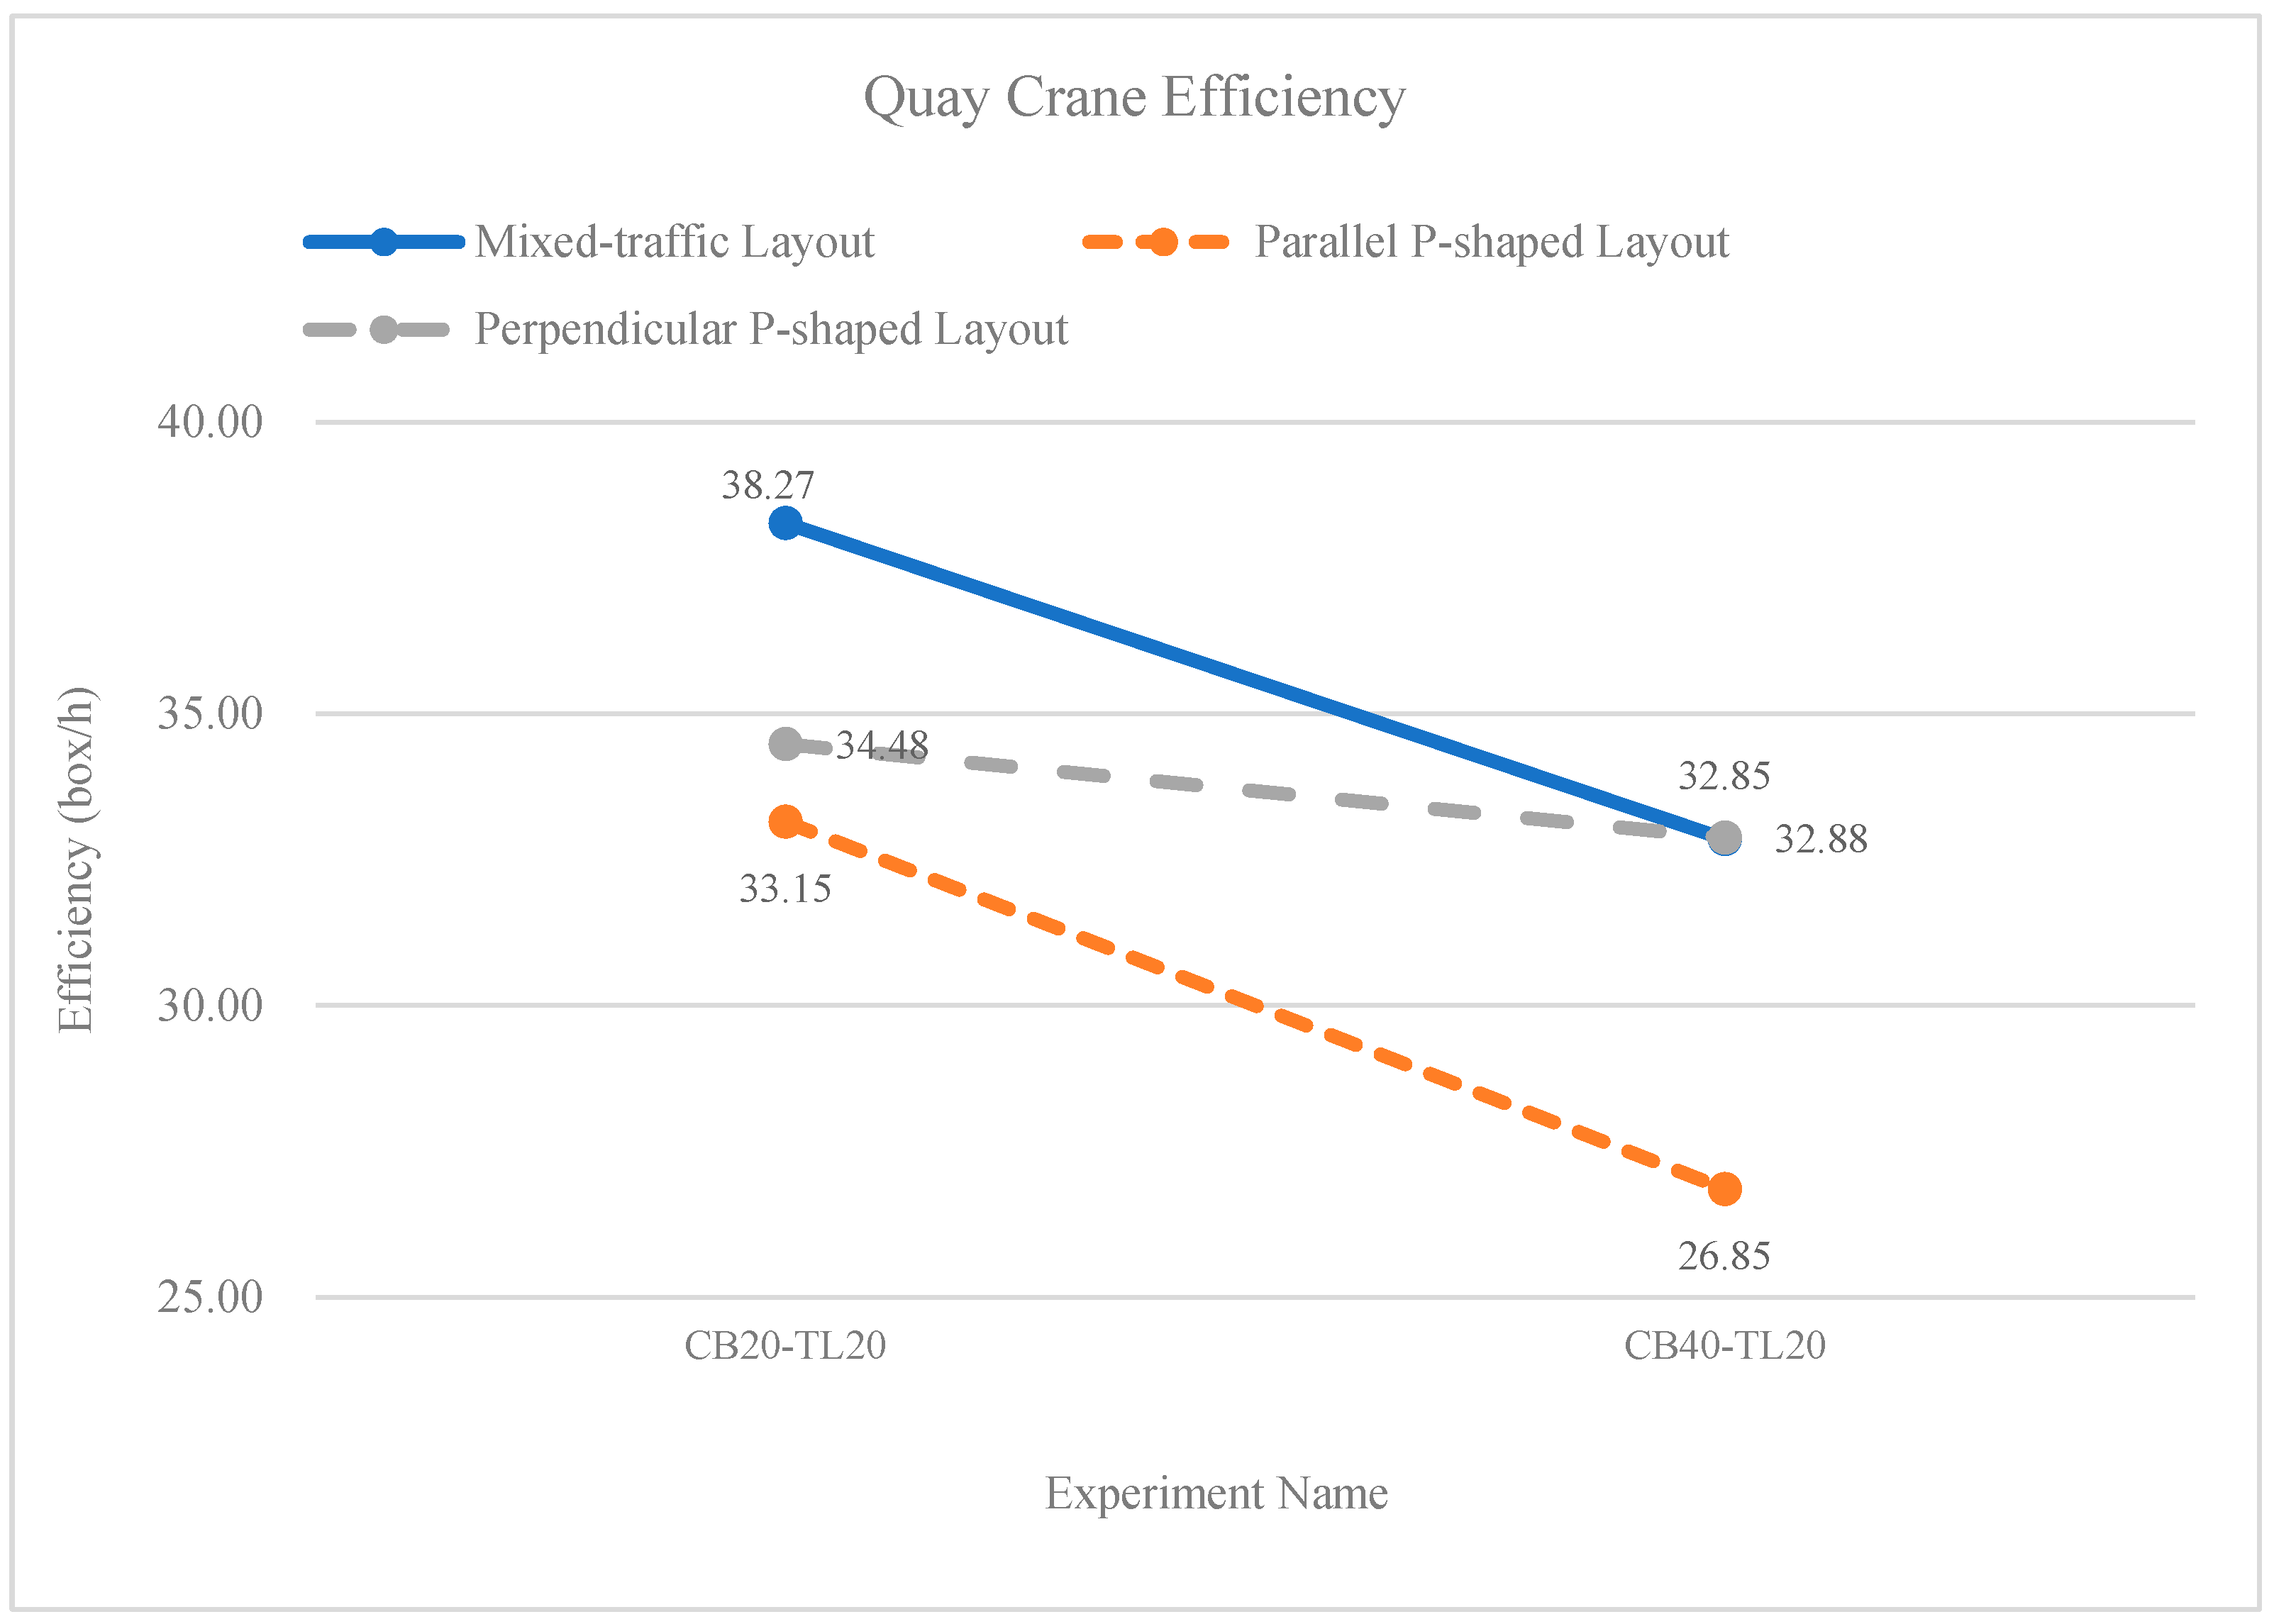
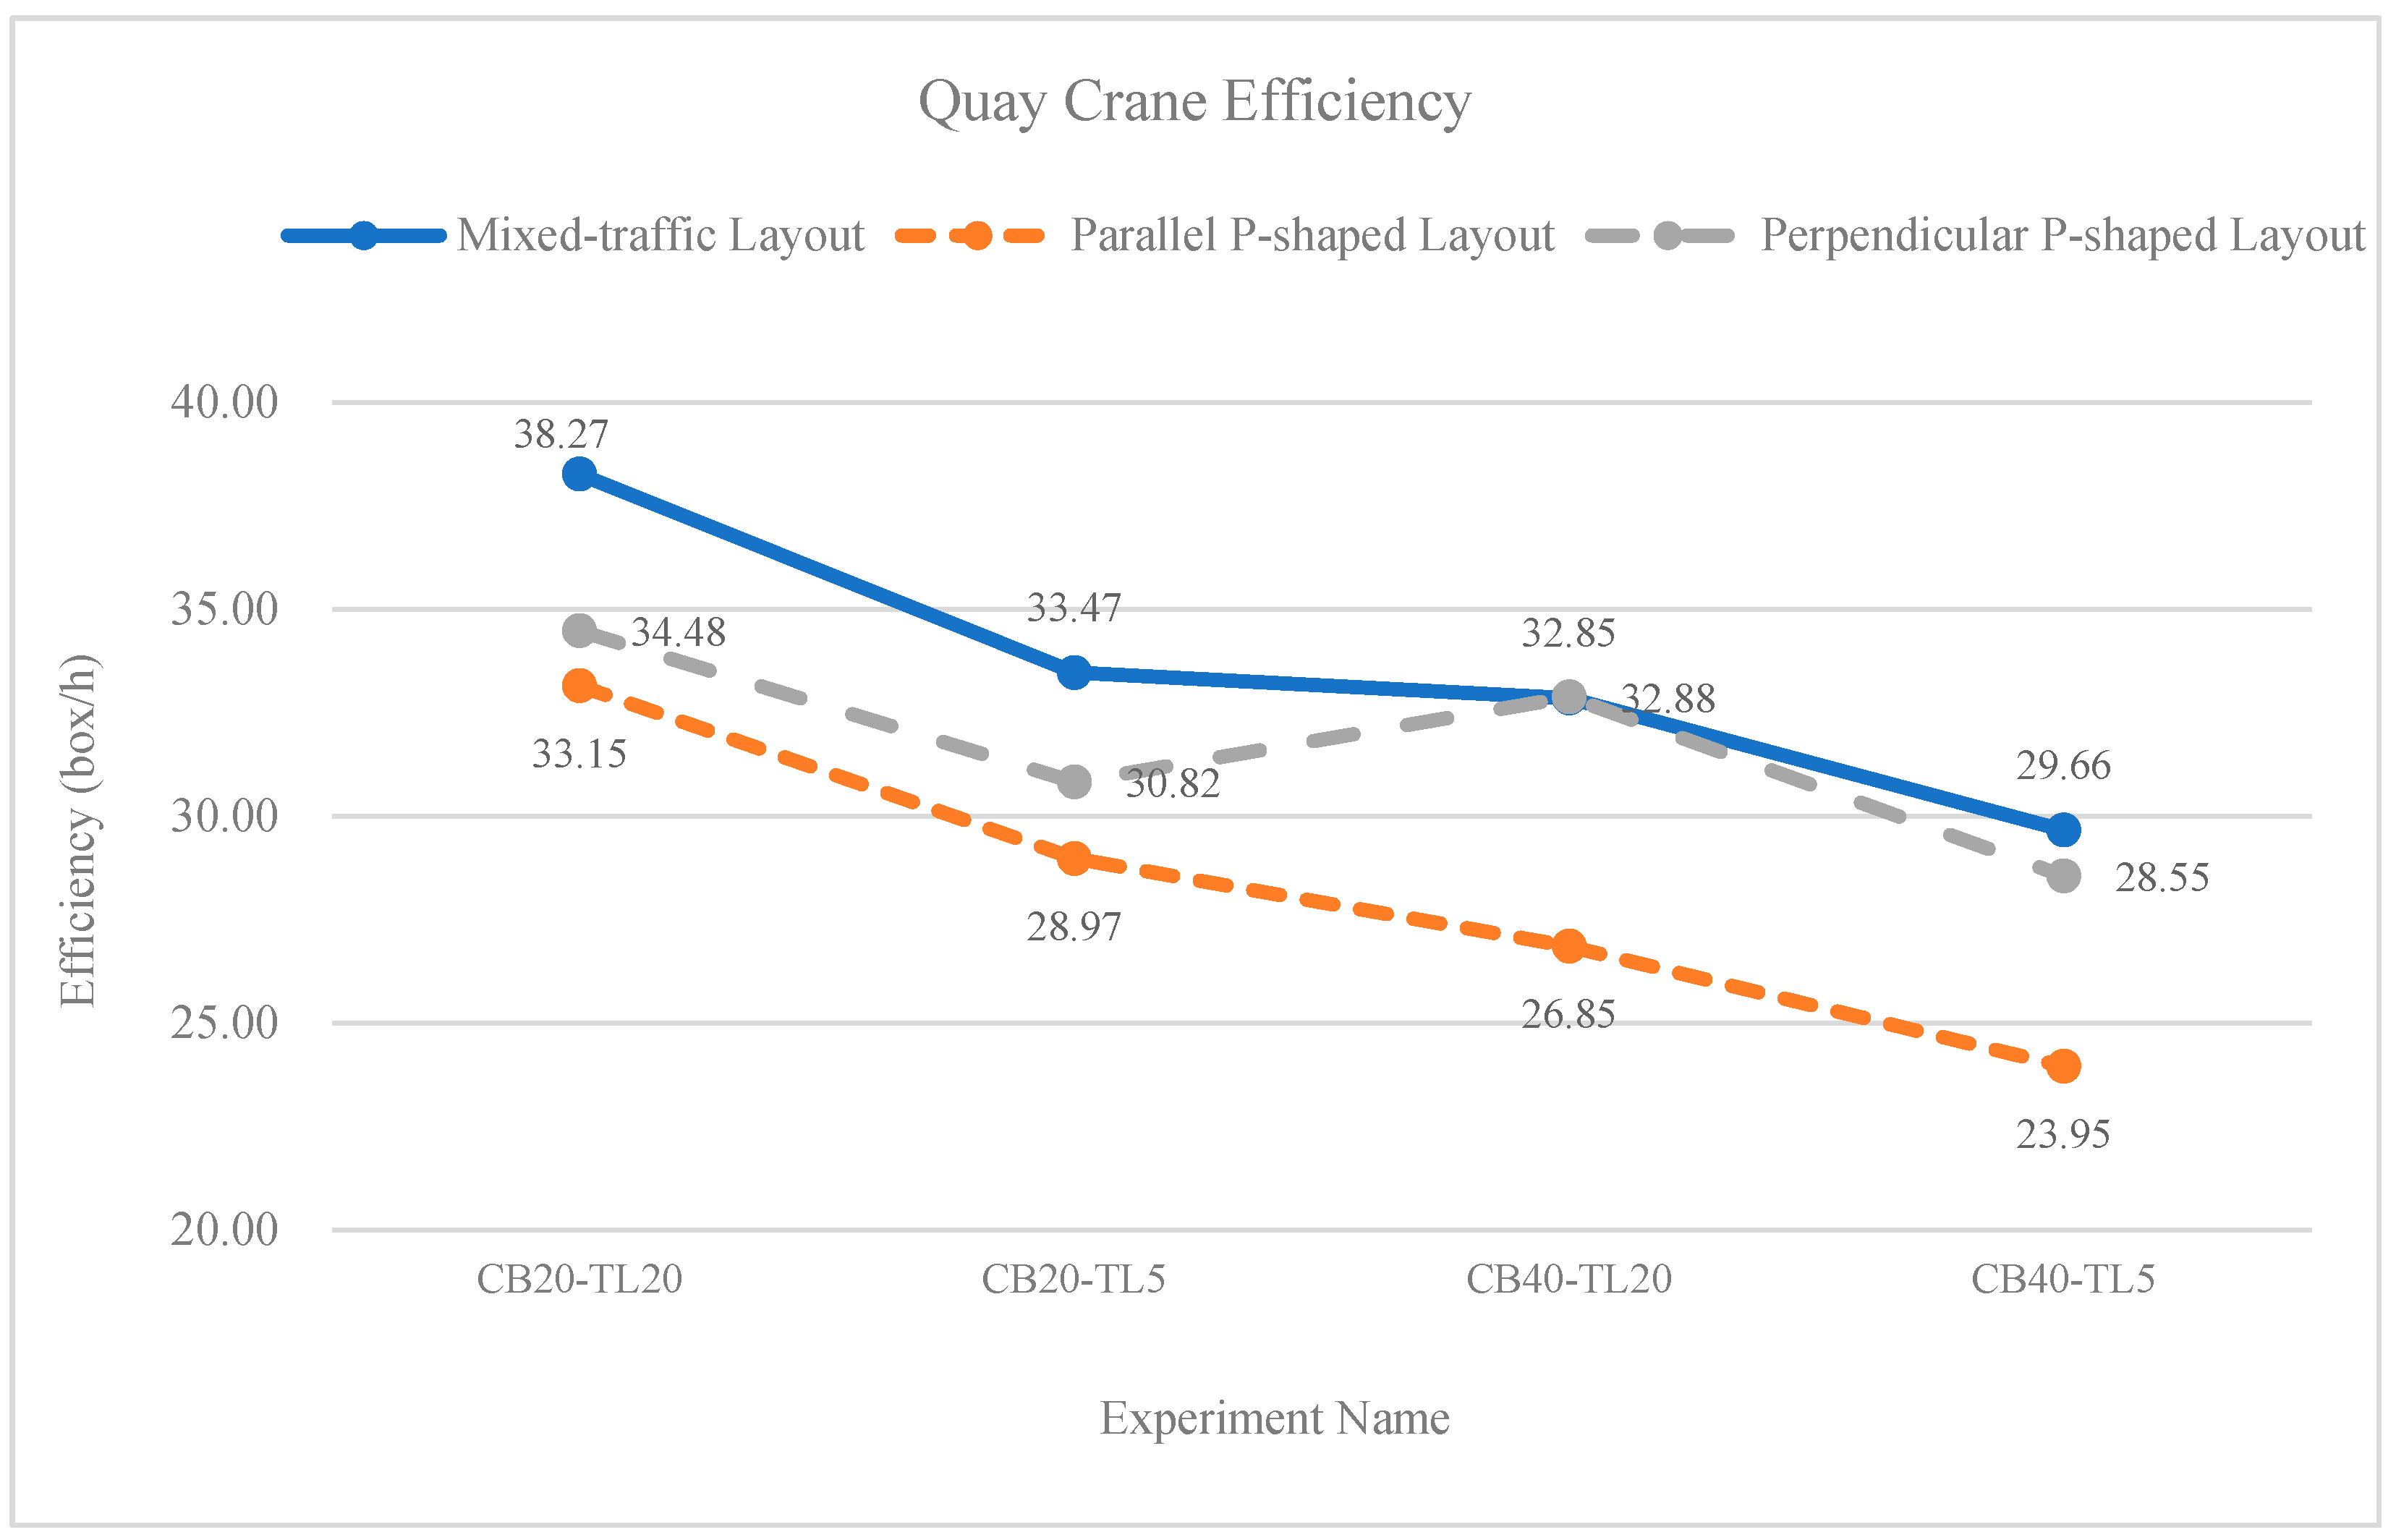
Considering a ratio of 7 unmanned vehicles, the quay crane efficiency for the three layouts is obtained as shown in Figure 11. From Figure 11, it can be observed that as the cross-berth operation ratio increases, its impact on traffic organization becomes more significant, leading to reduced quay crane efficiency.
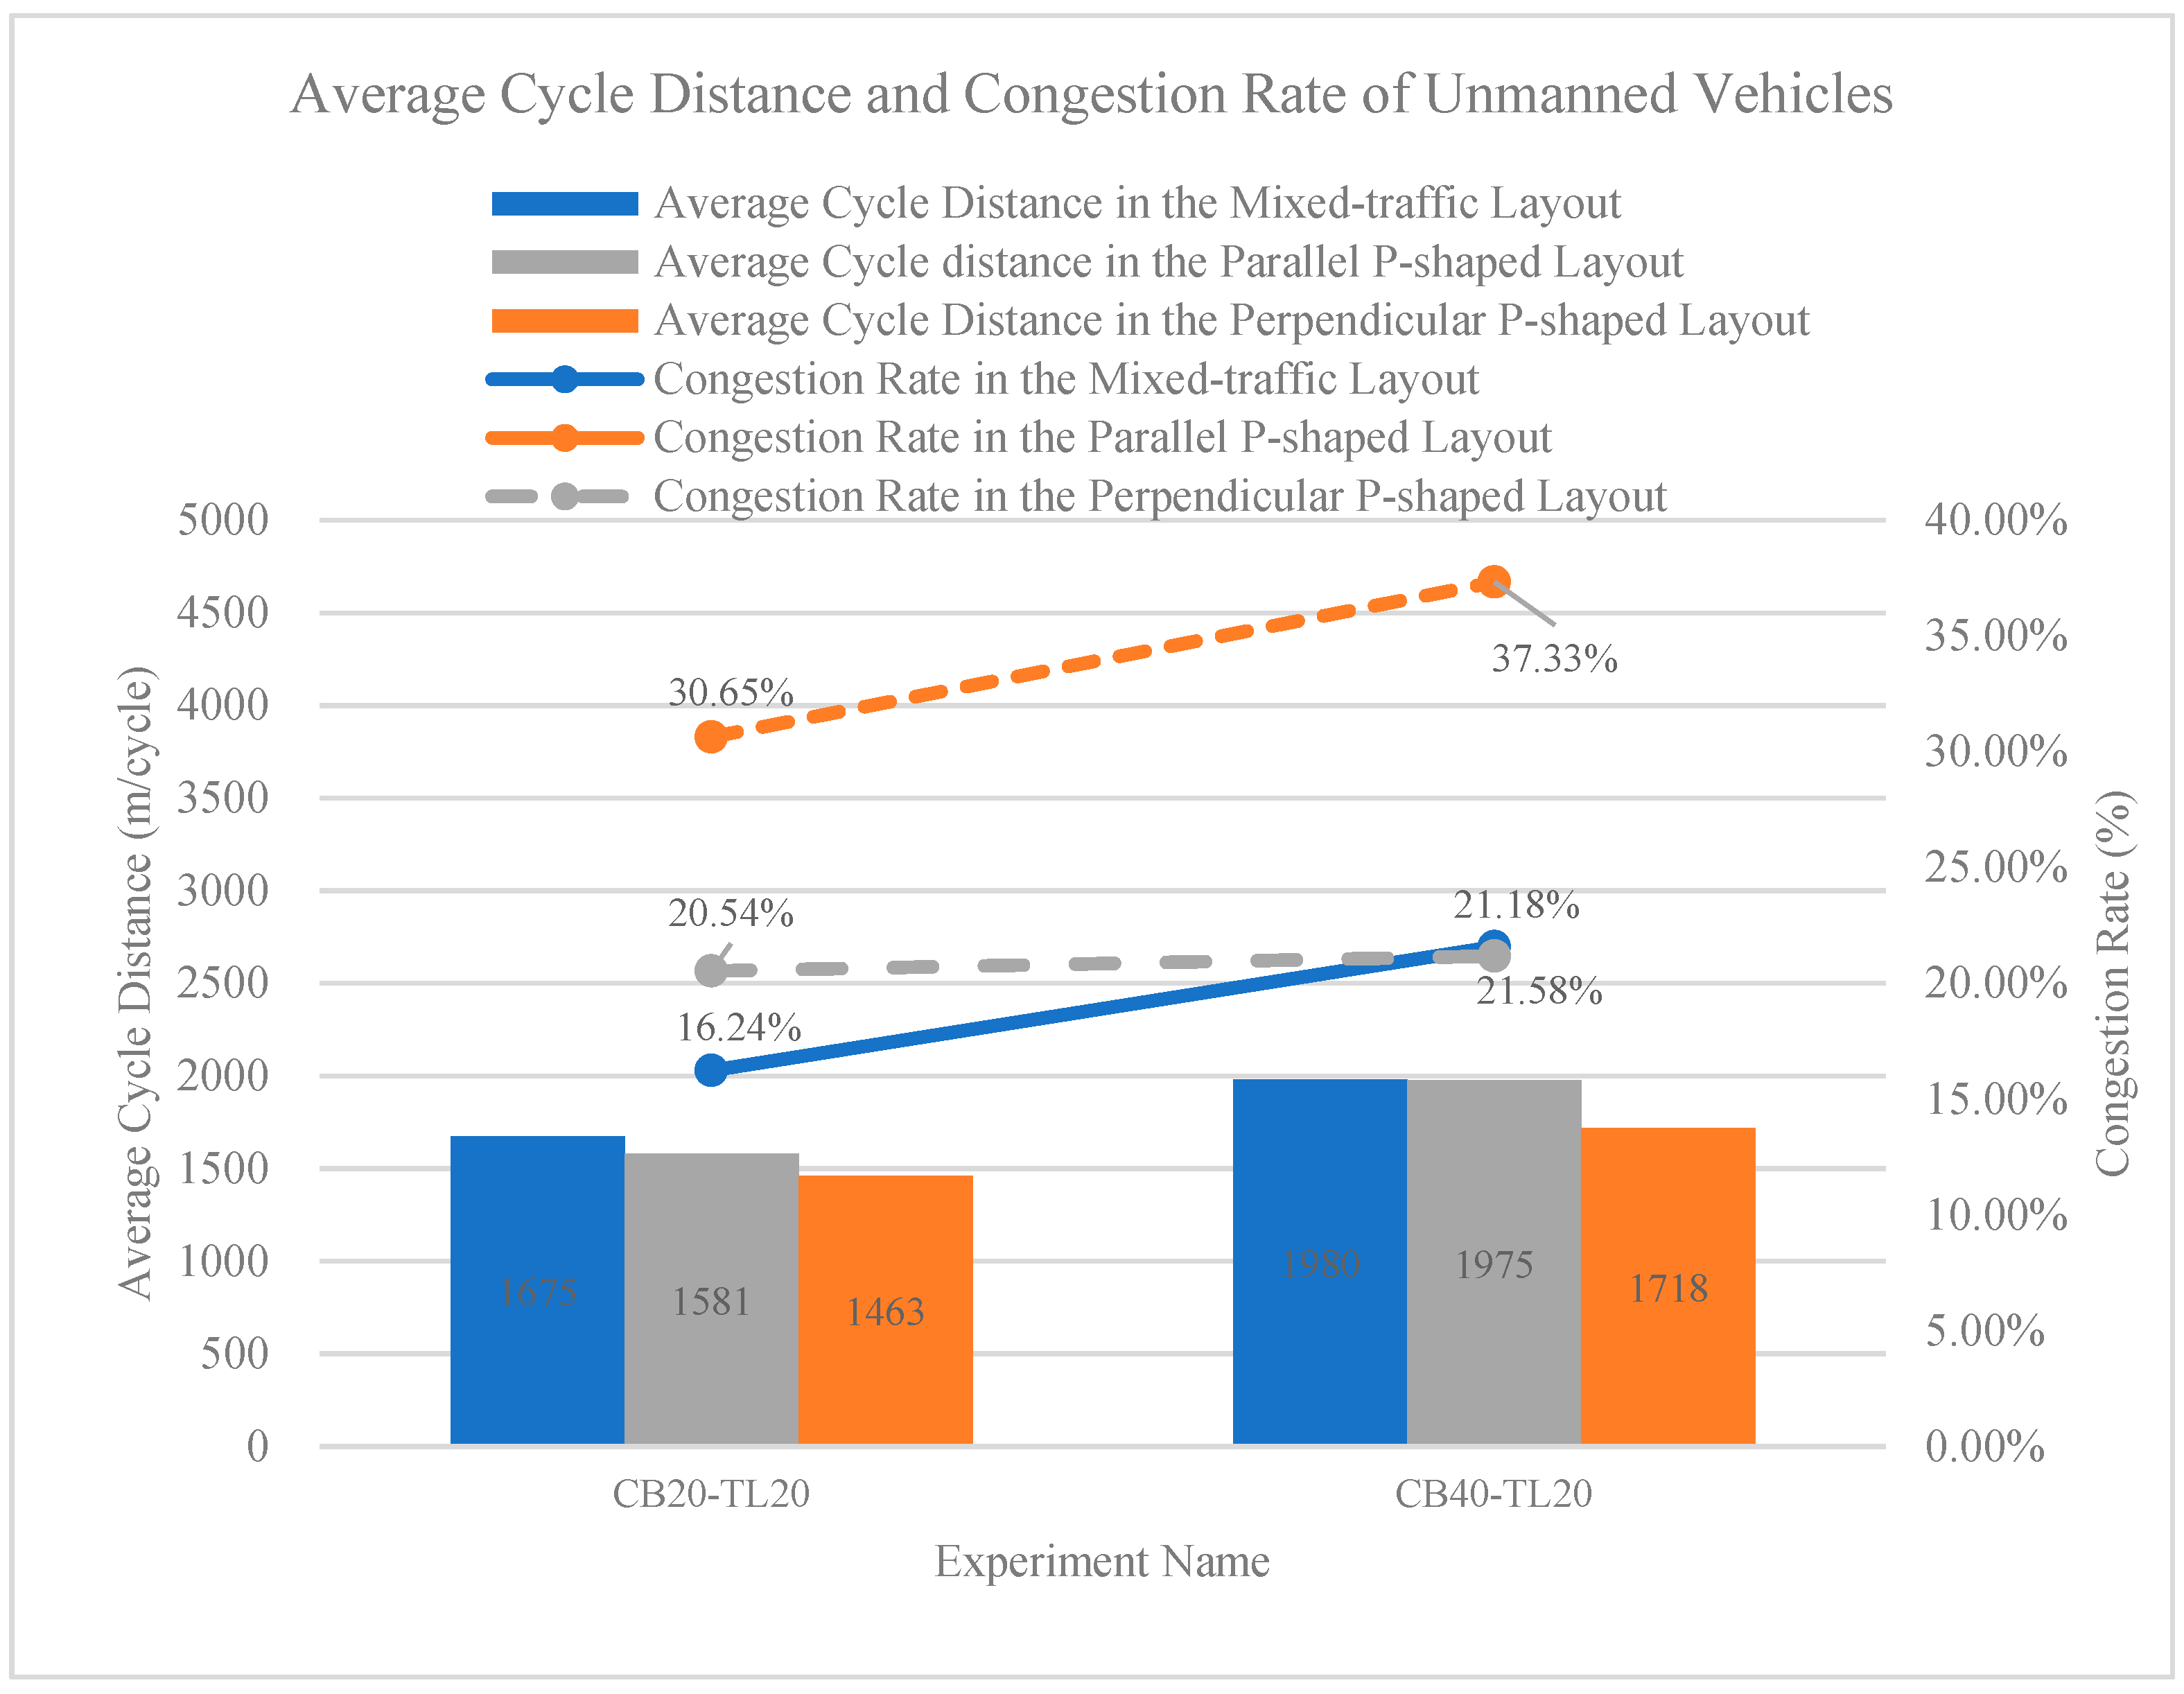
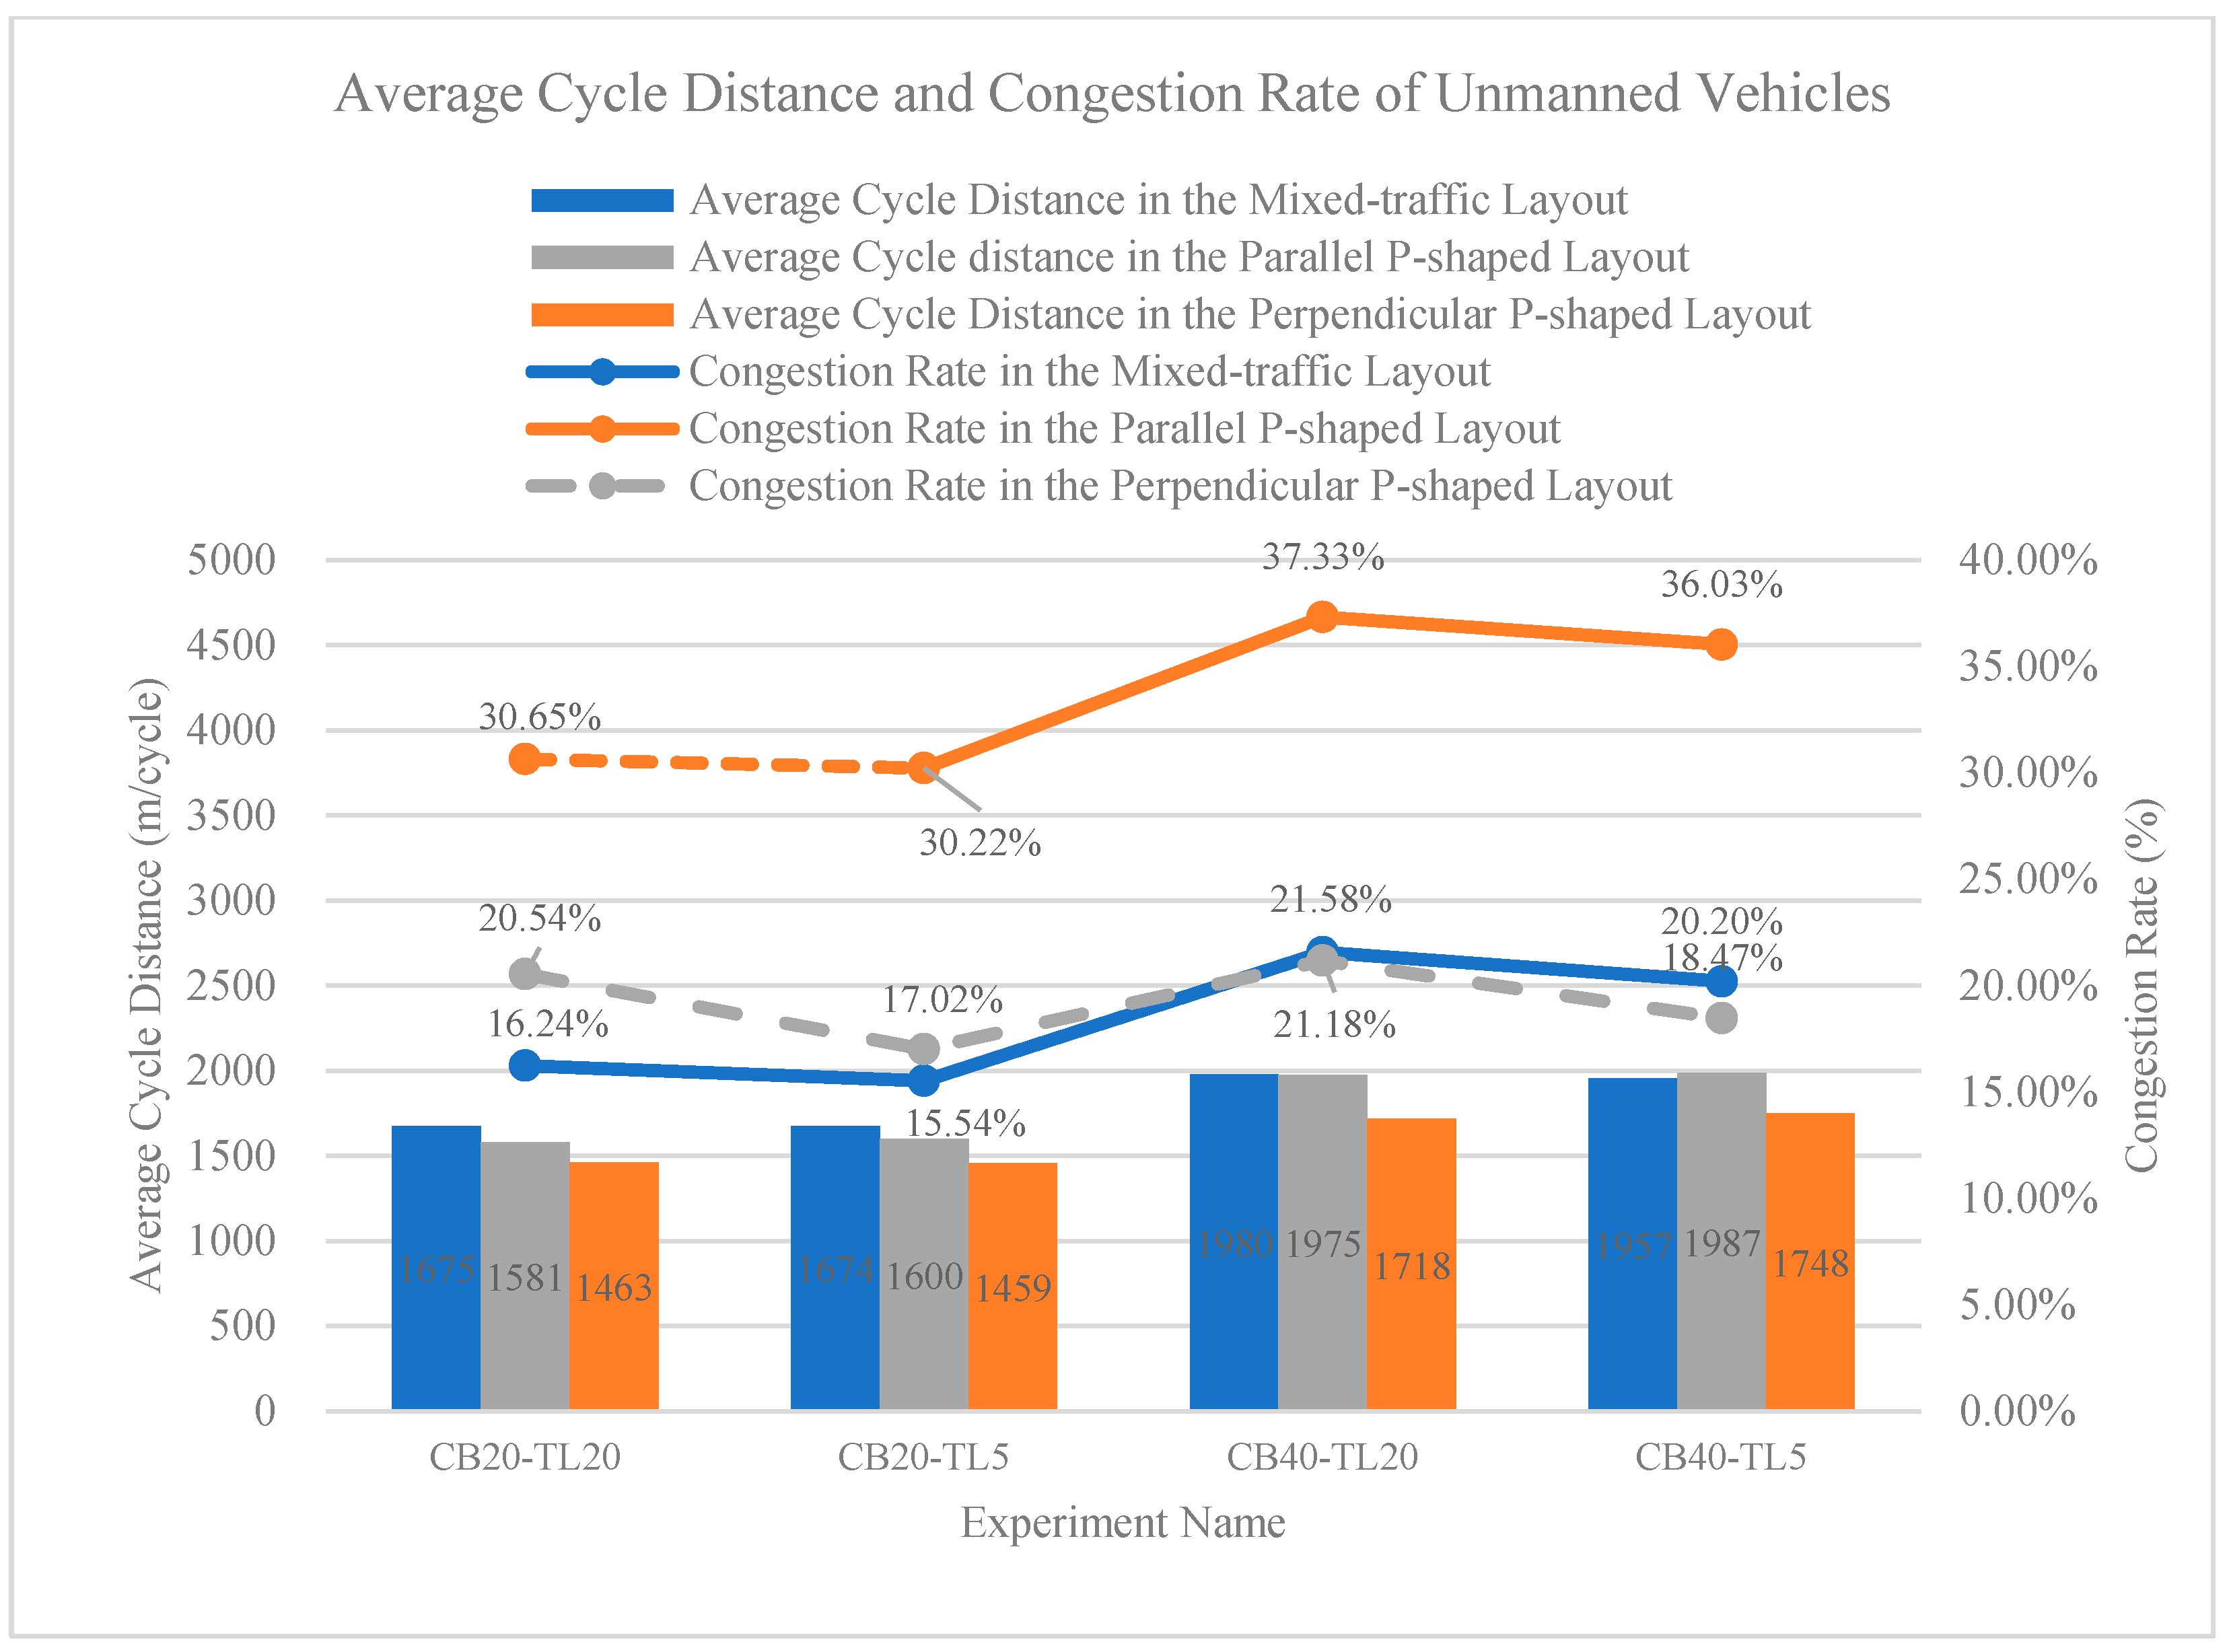
Figure 12 shows the average cycle distance and congestion rate of unmanned vehicles under different simulation experiments for the three layouts. From Figure 12, it is evident that as the cross-berth operation ratio increases, the average cycle distance of unmanned vehicles also increases. When the cross-berth operation ratio increases from 20% to 40%:
  • For the mixed-traffic layout, the average cycle distance of unmanned vehicles increases by approximately 300 m, representing an increase of about 18%.
  • For the perpendicular P-shaped layout, the average cycle distance of unmanned vehicles increases by approximately 250 m, representing an increase of about 17%.
  • For the parallel P-shaped layout, the average cycle distance of unmanned vehicles increases by approximately 400 m, representing an increase of about 25%.
So, the cross-berth operation ratio has the most significant impact on the average cycle distance of unmanned vehicles in the parallel P-shaped layout.
As shown in Figure 12, with the cross-berth operation ratio increases, the congestion rate of unmanned vehicles also rises. When the cross-berth operation ratio increases from 20% to 40%:
  • For the mixed-traffic layout, the congestion rate of unmanned vehicles increases by approximately 33%.
  • For the perpendicular P-shaped layout, the congestion rate of unmanned vehicles increases by approximately 3%.
  • For the parallel P-shaped layout, the congestion rate of unmanned vehicles increases by approximately 22%.
So, the cross-berth operation ratio has the least impact on the congestion rate of unmanned vehicles in the perpendicular P-shaped layout.
Figure 13 shows that under the same cross-berth operation ratio condition, since the unmanned vehicle ratio remains unchanged, the reduction in the twin-lift operation ratio leads to a decrease in the efficiency of the quay crane. When the twin-lift operation ratio decreases from 20% to 5%, the efficiency of the quay crane drops by 10% to 13%.
For the mixed-traffic layout and the parallel P-shaped layout, the increase in the cross-berth ratio from 20% to 40% has a greater impact on the efficiency of the quay crane than the decrease in the twin-lift operation ratio from 20% to 5%. However, for the perpendicular P-shaped layout, the situation is reversed.
For the mixed-traffic layout and parallel P-shaped layout, when the twin-lift operation ratio decreases from 20% to 5% under the same cross-berth ratio, the impact on the unmanned vehicle congestion rate in the road system is minimal. In contrast, the perpendicular P-shaped layout is affected to a slightly greater extent, though both categories of layouts exhibit a downward trend in congestion rate.
The increase in the cross-berth ratio from 20% to 40% has led to an upward trend in the congestion rate of unmanned vehicles in the road system, and the impact is greater than that of the twin-lift operation ratio decreasing from 20% to 5%.
Since the twin-lift operation ratio is determined by the operation conditions at the terminal, referring to Figure 11, Figure 12, Figure 13 and Figure 14, reducing the cross-berth ratio during actual terminal operations can alleviate the congestion rate of unmanned vehicles and effectively enhance the efficiency of the quay cranes.

6. Conclusions

Under the premise of the maturity of full mixed-flow technology, when the terminal area and equipment configuration are the same, different terminal process layouts present different performance manifestations. The parallel P-shaped layout has the fewest ground container slots. Compared to the parallel P-shaped layout, the perpendicular P-shaped layout increases the number of ground container slots by approximately 15%, while the mixed-traffic layout further increases the number of ground container slots by about 3% compared to the perpendicular P-shaped layout. Under the same operational conditions, the efficiency of the parallel P-shaped layout is the lowest. The perpendicular P-shaped layout improves efficiency by approximately 4% compared to the parallel P-shaped layout, and the mixed-traffic layout improves efficiency by about 11% compared to the perpendicular P-shaped layout.
Due to the different traffic organization methods of the three layouts, the performance of the wharf shows different manifestations under the same operating conditions. The parallel P-shaped layout exhibits the highest vehicle congestion rate, resulting in the lowest average vehicle speed. The perpendicular P-shaped layout increases vehicle speed by approximately 18% compared to the parallel P-shaped layout, and the mixed-traffic layout increases vehicle speed by about 14% compared to the perpendicular P-shaped layout. Operation plans also have varying degrees of impact on system traffic organization. When the cross-berth operation ratio increases from 20% to 40%, the congestion rates for the mixed-traffic and parallel P-shaped layouts increase significantly, by approximately 22% to 33%, while the impact on the perpendicular P-shaped layout is relatively small, with a congestion rate increase of about 4%. At this point, the efficiency of the parallel P-shaped layout is the lowest, while the efficiencies of the mixed-traffic and perpendicular P-shaped layouts are comparable, increasing by approximately 22% compared to the parallel P-shaped layout.
Sensitivity analysis of the operation plan reveals that with an increase in the unmanned vehicle ratio, the quay crane operating efficiency of the three layout schemes increases to varying degrees. Similarly, a decrease in twin-lift ratio also leads to a reduction in quay crane efficiency, but has little impact on traffic congestion of unmanned vehicles on the roads. An increase in the cross-berth ratio exhibits diametrically opposite impacts on quay crane efficiency across the three layout schemes, thus requiring differentiated treatment. Changes in the cross-berth ratio have a significant impact on the unmanned vehicle congestion rate. Adjusting this ratio can alter the unmanned vehicle congestion status, thereby affecting quay crane efficiency.
Experimental results indicate that, under the assumption that mixed-traffic technology is mature, the system efficiency of the mixed-traffic scheme is superior to that of the other two schemes. Against the backdrop that the current mixed-traffic technology is not yet mature, many terminals tend to separate unmanned vehicles (AGVs/IGVs) from manned vehicles through spatial isolation to ensure operational safety. It is recommended that a phased implementation strategy be considered during the terminal planning stage. In the initial stage of the terminal, the P-type layout scheme can be adopted, and the scheme should be upgraded to the mixed-traffic one once the mixed-traffic technology matures. The simulation experiments conducted based on this study can offer some inspirations to port managers. Quantitative analysis of different layout schemes can provide key data support for process layout planning during the early planning and construction stage of terminals, and assist in decision-making. Sensitivity analysis of the operation plan can assist managers in optimizing operational management and improving operational efficiency.
However, the research conclusions drawn in this paper based on seaport cases may have limited applicability. For small inland river terminals, as their system efficiency requirements are generally lower, the scope of cross-berth operations is relatively limited, and the impact of seaside traffic organization on their overall operations may be significantly weakened. Further targeted research is needed to verify applicability and adapt strategies for these contexts.

Author Contributions

Conceptualization, Y.L. and J.J.; methodology, Y.L.; software, Z.G. and Y.C.; validation, Y.L., J.J., Z.G. and Y.C.; formal analysis, J.B.; investigation, Z.G.; resources, Z.G.; data curation, Y.C.; writing—original draft preparation, Z.G.; writing—review and editing, Z.G.; visualization, J.B.; supervision, J.J.; project administration, Z.G. and Y.C.; funding acquisition, Y.L. All authors have read and agreed to the published version of the manuscript.

Funding

This research was Sponsored by Shanghai Port Mechanical Engineering Technology Research Center Project (No. 20DZ2281300), ZPMC Research and Development Program (No. 2024-ZPKJ-12).

Data Availability Statement

The original contributions presented in this study are included in the article. Further inquiries can be directed to the corresponding author.

Conflicts of Interest

Author Yan Liang, Jianming Jin, Yang Chen were employed by the company Shanghai Zhenhua Heavy Industries Co., Ltd. The remaining authors declare that the research was conducted in the absence of any commercial or financial relationships that could be construed as a potential conflict of interest.

Abbreviations

The following abbreviations are used in this manuscript:
ACTAutomated Container Terminal
AGVAutomated Guided Vehicle
ARMGAutomated Rail-Mounted Gantry Crane
ASCAutomated Stacking Crane
GUIGraphical User Interface
IGVIntelligent Guided Vehicle
QCQuay Crane
TEUTwenty-feet Equivalent Unit

References

  1. Liu, Q.; Ni, X.; Liu, H.; Wang, J.; Wang, K. Optimization of Reclaiming–Loading Scheduling in Dry Bulk Terminals Based on Knowledge-Driven Memetic Algorithm. Electronics 2024, 13, 4558. [Google Scholar] [CrossRef]
  2. Li, X.-J.; Zhou, R.; Zhu, L.-Q.; Wang, Y.-S. The Influence of High Operation Platform Mode on U-Shaped Automated Container Terminal Efficiency. IEEE Access 2024, 12, 46616–46625. [Google Scholar] [CrossRef]
  3. Kong, L.R.; Ji, M.J. Mathematical modeling and optimizing of yard layout in automated container terminals. Expert Syst. Appl. 2024, 258, 125117. [Google Scholar] [CrossRef]
  4. Rodriguez, L.; Loyo, J.; Silva, U. Layout evaluation with the Industry 4.0 approach for a manufacturing laboratory. Int. J. Simul. Model. 2023, 22, 551–561. [Google Scholar] [CrossRef]
  5. Gharehgozli, A.; Zaerpour, N.; de Koster, R. Container terminal layout design: Transition and future. Marit. Econ. Logist. 2020, 22, 610–639. [Google Scholar] [CrossRef]
  6. Li, X.Y.; Zhou, R.; Zhu, L.Q. Research on energy saving effect of parallel and perpendicular yard layouts under different proportions of transshipment at the automated container terminal. Sustainability 2024, 16, 7387. [Google Scholar] [CrossRef]
  7. Liu, W.; Zhu, X.; Wang, L.; Wang, S. Multiple equipment scheduling and AGV trajectory generation in U-shaped sea-rail intermodal automated container terminal. Measurement 2023, 206, 112262. [Google Scholar] [CrossRef]
  8. Yang, A.; Liu, Y.; Xin, C.; Chen, Q.; Wang, L. Towards intuitive visualisation goals for the operation optimisation of automated container terminal based on digital twin technology. Marit. Policy Manag. 2024, 51, 631–652. [Google Scholar] [CrossRef]
  9. Wang, X.; Jin, Z. Collaborative Optimization of Multi-Equipment Scheduling and Intersection Point Allocation for U-Shaped Automated Sea-Rail Intermodal Container Terminals. IEEE Trans. Autom. Sci. Eng. 2024, 22, 7373–7393. [Google Scholar] [CrossRef]
  10. Xu, B.; Jie, D.; Li, J.; Yang, Y.; Wen, F.; Song, H. Integrated scheduling optimization of U-shaped automated container terminal under loading and unloading mode. Comput. Ind. Eng. 2021, 162, 107695. [Google Scholar] [CrossRef]
  11. Shan, J.; Jin, J.; Zhang, Y. A new container yard handling process based on flyover technology. Port Waterw. Eng. 2023, 617, 64–69. [Google Scholar] [CrossRef]
  12. Ni, M.; Shan, J. Handling technology of automatic tridimensional yard. Port Waterw. Eng. 2020, 574, 82–86. [Google Scholar] [CrossRef]
  13. Ni, M.; Xia, J. General layout and handling technology design of automated container terminal for multimodal transport under multishoreline. Port Waterw. Eng. 2023, 612, 95–100. [Google Scholar] [CrossRef]
  14. Liang, Y.; Chen, Y.; Jin, J. Simulation of layout technology of twist lock station with single trolley quay cranes in automated container terminal. Port Waterw. Eng. 2024, 2024, 175–179+185. [Google Scholar] [CrossRef]
  15. Li, X.; Peng, Y.; Huang, J.; Wang, W.; Song, X. Simulation study on terminal layout in automated container terminals from efficiency, economic and environment perspectives. Ocean Coast. Manag. 2021, 213, 105882. [Google Scholar] [CrossRef]
  16. Li, X.; Peng, Y.; Guo, Y.; Wang, W.; Song, X. An integrated simulation and AHP-entropy-based NR-TOPSIS method for automated container terminal layout planning. Expert Syst. Appl. 2023, 225, 120197. [Google Scholar] [CrossRef]
  17. Lee, B.K.; Lee, L.H.; Chew, E.P. Analysis on high throughput layout of container yards. Int. J. Prod. Res. 2018, 56, 5345–5364. [Google Scholar] [CrossRef]
  18. Budiyanto, M.A.; Huzaifi, M.H.; Sirait, S.J.; Prayoga, P.H.N. Evaluation of CO2 emissions and energy use with different container terminal layouts. Sci. Rep. 2021, 11, 5476. [Google Scholar] [CrossRef]
  19. Ma, N.; Zhou, C.H.; Stephen, A. Simulation model and performance evaluation of battery-powered AGV systems in automated container terminals. Simul. Model. Pract. Theory 2021, 106, 102146. [Google Scholar] [CrossRef]
  20. Wan, Z.; Zhang, T.; Sha, M.; Guo, W.; Jin, Y.; Guo, J.J.; Liu, Y.T. Evaluation of emission reduction strategies for berthing containerships: A case study of the Shekou Container Terminal. J. Clean. Prod. 2021, 299, 126820. [Google Scholar] [CrossRef]
  21. Cho, G.; Lee, S.H. Cloud-Based Virtual Port-Container Terminal Establishment and Operation Analysis. Electronics 2020, 9, 1615. [Google Scholar] [CrossRef]
  22. Tuncel, G.; Deniz, E. Optimization of container terminal operations using Response Surface Methodology. Int. J. Simul. Model. 2024, 23, 563–574. [Google Scholar] [CrossRef]
  23. Yang, Y.S.; Liang, J.Y.; Feng, J.K. Simulation and optimization of automated guided vehicle charging strategy for U-shaped automated container terminal based on improved proximal policy optimization. Systems 2024, 12, 472. [Google Scholar] [CrossRef]
  24. Guo, P.; Chen, Z.; Yang, Y.; Miao, R. A multistage simulation-optimization-integrated methodology framework for user-oriented electric vehicle carsharing reallocation under dynamic price subsidy. Energy 2024, 290, 130207. [Google Scholar] [CrossRef]
  25. Guo, P.; Yang, Y.; Su, Y.; Chen, Z.; Miao, R. Incentive-based customer-oriented rebalancing strategy for one-way shared electric vehicles in sustainable urban governance. J. Clean. Prod. 2024, 469, 143192. [Google Scholar] [CrossRef]
Figure 1. Simulation Entities in SmartSim Software.
Electronics 14 03356 g001
Figure 2. The Architecture Diagram of SmartSim.
Electronics 14 03356 g002
Figure 3. Container Terminal Simulation Models. (a) Simulation Model for P-shaped Layout with Yard Parallel to Shoreline. (b) Simulation Model for P-shaped Layout with Yard Perpendicular to Shoreline. (c) Simulation Model for Mixed-Traffic Layout with Yard Parallel to Shoreline.
Electronics 14 03356 g003
Figure 4. Typical yard layout for the P-shaped handling process scheme.
Electronics 14 03356 g004
Figure 5. P-shaped Layout with Yard Parallel to Shoreline.
Electronics 14 03356 g005
Figure 6. P-shaped Layout with Yard Perpendicular to Shoreline.
Electronics 14 03356 g006
Figure 7. Mixed-Traffic Layout with Yard Parallel to Shoreline.
Electronics 14 03356 g007
Figure 8. Quay Crane Efficiency in Basic Experiments.
Electronics 14 03356 g008
Figure 9. Operating Status of Unmanned Vehicles in Basic Experiments.
Electronics 14 03356 g009
Figure 10. Average Cycle Distance and Speed of Unmanned Vehicles in Basic Experiments.
Electronics 14 03356 g010
Figure 11. Quay Crane Efficiency in Sensitivity Analysis Experiments (Different Cross-Berth Ratios).
Electronics 14 03356 g011
Figure 12. Average Cycle Distance and Congestion Rate of Unmanned Vehicles in Sensitivity Analysis Experiments (Different Cross-Berth Ratios).
Electronics 14 03356 g012
Figure 13. Quay Crane Efficiency in Sensitivity Analysis Experiments (Different Cross-Berth Ratios & Twin-Lift Ratios).
Electronics 14 03356 g013
Figure 14. Average Cycle Distance and Congestion Rate of Unmanned Vehicles in Sensitivity Analysis Experiments (Different Cross-Berth Ratios & Twin-Lift Ratios).
Electronics 14 03356 g014
Table 1. Basic Parameters of the Terminal.
Parameter NameUnitValue
Quay LengthMeters1600
Double-Trollley Quay Cranes (QCs)Units16
Ratio of Unmanned Vehicles to Quay CranesVehicles6/7/8
Dual-Cantilever Automated Rail-Mounted Gantry Cranes (ARMGs)Units40
Twin-Lift Operation Ratio%20
Cross-Berth Operation Ratio%20
External Truck Arrival FrequencyTrucks/Hour120
Table 2. Equipment Speed Parameters.
Equipment NameNo-Load Max Speed (m/s)Full-Load Max Speed (m/s)No-Load Acceleration (m/s2)Full-Load Acceleration (m/s2)
Double-Trolley Quay Crane
 -Gantry0.830.830.10.1
 -Front/Rear Trolley4/24/20.67/0.670.67/0.67
 -Front/Rear Spreader3/21.5/10.6/0.60.6/0.6
Dual-Cantilever ARMG
 -Gantry2.52.50.210.21
 -Trolley220.50.5
 -Spreader1.50.750.380.38
Unmanned Vehicles
 -Straight Movement8.338.330.90.35
 -Turning21.670.90.35
Table 3. Experimental Settings.
Experiment Type Experiment
Name
Unmanned
Vehicle Ratio
Cross-Berth
Operation Ratio
Twin-Lift
Operation Ratio
Basic AnalysisBasic-6620%20%
Basic-7720%20%
Basic-8820%20%
Sensitivity AnalysisCB20-TL20720%20%
CB20-TL5720%5%
CB40-TL20740%20%
CB40-TL5740%5%
Table 4. Comparison of Handling Equipment Configuration and Ground Slot Capacity.
Parameter NameUnitScheme One: Parallel Yard Layout (P-Shaped)Scheme Two: Perpendicular Yard Layout (P-Shaped)Scheme Three: Parallel Yard Layout (Mixed-Traffic)
Double-Trolley Quay CranesUnits161616
Automated Rail-Mounted Gantry Cranes (ARMGs)Units404040
Ground Slot CapacityTGS21,24024,33624,960
Disclaimer/Publisher’s Note: The statements, opinions and data contained in all publications are solely those of the individual author(s) and contributor(s) and not of MDPI and/or the editor(s). MDPI and/or the editor(s) disclaim responsibility for any injury to people or property resulting from any ideas, methods, instructions or products referred to in the content.