Abstract
This paper addresses stability issues in modern power grids arising from extensive integration of power electronic converters, which introduce complex multi-time-scale interactions. A symbolic simplification method is proposed to accurately model grid-connected converter dynamics, significantly reducing computational complexity through transfer function approximations and yielding efficient reduced-order models. An impedance-based approach utilizing impedance ratio (IR) is developed for stability assessment under active-reactive (PQ) and active power-AC voltage (PV) control strategies. The impacts of Phase-Locked Loop (PLL) and proportional-integral (PI) controllers on system stability are analysed, with a particular focus on quantifying remote converter interactions and delineating stability boundaries across varying network strengths and configurations. Furthermore, time-scale separation effectively simplifies Multi-Voltage Source Converter (MVSC) systems by minimizing inner-loop dynamics. Validation is conducted through frequency response evaluations, IR characterizations, and eigenvalue analyses, demonstrating enhanced accuracy, particularly with the application of lead–lag compensators within the critical 50–250 Hz frequency band. Time-domain simulations further illustrate the adaptability of the proposed models and reduction methodology, providing an effective and computationally efficient tool for stability assessment in converter-dominated power networks.
1. Introduction
The rapid expansion of renewable energy sources, energy storage systems, and power-electronic loads has significantly transformed modern power grids, underscoring the critical importance of thoroughly evaluating stability in systems dominated by power converters [1,2,3]. Although power electronic converters effectively integrate renewable energy into grids, interconnected converters generate complex dynamic interactions. These interactions may trigger oscillations and instabilities, even if each converter independently operates stably. Therefore, developing precise and reliable analytical methods to detect and mitigate such interactions is essential.
Existing stability evaluation methods face notable limitations. Time-domain analysis methods accurately capture dynamic behaviours but require extensive computational effort, especially in large-scale networks such as wind farms [4,5,6]. Additionally, variations in grid impedance and dynamics associated with phase-locked loops (PLLs) present further risks, including sub-synchronous oscillations and voltage instabilities, especially within low-inertia grids [5,6]. Hence, there is an urgent requirement for innovative stability evaluation tools.
Currently, two primary methodologies dominate stability analysis: time-domain state-space modelling and frequency-domain impedance-based approaches. Time-domain methods thoroughly capture system dynamics and have a well-established track record [7,8]. However, frequency-domain impedance-based techniques are gaining popularity due to their effectiveness in assessing the interactions between multiple voltage-source converters, particularly in weak-grid scenarios [9,10,11,12,13,14]. Frequency-domain analyses use small-signal disturbances, clearly revealing subsystem interactions and providing valuable insights into networks nearing instability.
Common impedance-based methods, such as global stability metrics, bus impedance analysis, and passivity-based approaches, frequently encounter difficulties. Specifically, these methods may become inaccurate when subsystem instabilities distort impedance measurements, complicating reliable stability predictions. Offshore AC grids, characterised by low inertia and intricate interactions between HVDC and wind turbine converters, clearly illustrate these challenges [13]. Various converter control strategies can induce harmonic instability, voltage oscillations, and protective trips due to excessive current [4,5,15]. Thus, comprehensive analysis of converter interactions, especially under diverse control schemes, becomes critical for ensuring offshore system stability [16,17].
To accurately capture complex converter interactions, integrating impedance-based methods with time-domain simulations is sometimes necessary. This combined approach has effectively analysed interactions in offshore HVDC systems and wind farms [12]. However, most research has concentrated on onshore networks, leaving offshore converter interactions comparatively unexplored [18]. Current frequency-dependent methods such as Grid Strength Impedance Metrics (GSIM), Short Circuit Ratio (SCR), and Interaction Factors (IF) have limitations due to restricted frequency coverage and oversimplified assumptions [4,5,19,20]. Consequently, advanced impedance-based methods specifically designed for multi-converter interactions are urgently needed [21].
To reduce computational complexity in large converter-based networks, researchers have proposed various simplification techniques, including Model Order Reduction (MOR), impedance peak estimation, and time-scale separation [22]. These methods preserve crucial dynamics while significantly lowering computational burdens [23,24]. Nonetheless, certain simplification approaches, such as singular perturbation theory and fast-state truncation, have limited frequency validity and often inadequately represent multi-converter interactions [25]. Furthermore, existing reduced-order inverter models, commonly applied in microgrids, overlook mid-frequency interactions essential for stability evaluation [26]. Additionally, current model-order reduction approaches mainly target slower dynamic responses, thereby introducing significant inaccuracies when approximating complex systems without fully capturing interaction effects [27,28]. Some simplification strategies, though addressing power system integration, frequently neglect detailed error analyses, reducing their reliability for stability assessments in converter-intensive networks [29,30].
In renewable energy installations like photovoltaic systems and wind farms, model-order reduction methods have effectively simplified multiple-unit models, retaining essential dynamics [31]. However, aggregation techniques often sacrifice accuracy due to varying converter parameters and structural differences. For instance, Impedance/Admittance-Based Aggregated Modelling (I/ABAM), although computationally efficient, may inaccurately represent detailed converter–grid interactions [32,33,34]. Recent data-driven aggregation approaches based on the Koopman operator theory have attempted to improve accuracy but face similar limitations [35]. These drawbacks highlight the need for flexible, precise modelling methods capable of accurately capturing complex multi-converter dynamics.
Traditional simplification techniques often inadequately capture critical dynamic interactions in networks dominated by power converters, emphasizing the necessity of more accurate and scalable methods [36]. To address these issues, this paper introduces an innovative index-based simplification method designed explicitly for multi-converter networks. This method significantly enhances modelling accuracy by reducing magnitude and phase errors, effectively resolving existing methodological limitations while maintaining computational efficiency. Therefore, this approach provides engineers with robust analytical tools to accurately assess stability in contemporary converter-dominated power systems, balancing analytical rigor with practical applicability.
Key Contributions:
- Introducing a refined impedance-based model reduction approach that simplifies complex converter models while accurately preserving essential dynamic characteristics necessary for reliable converter–grid interaction analysis.
- Conducting a detailed comparison of impedance reduction techniques to assess the influence of remote converters on local converter behaviours, examining scenarios involving both strong and weak grids. This comparison utilises simplified and detailed models and establishes a practical accuracy index to quantify model discrepancies.
- Establishing a comprehensive framework for comparing impedance reduction methods, clearly quantifying how remote converter interactions impact local converters under varied grid conditions. This evaluation employs both detailed and simplified models, providing robust accuracy metrics.
- The method enables significant improvements in simulation speed, making it possible to efficiently analyse large-scale power systems with many converters using offline tools, overcoming the time and computational barriers of full-scale simulations.
- Achieving significant improvements in simulation speed, thereby facilitating efficient offline analysis of large-scale, converter-rich power systems, overcoming the typical computational limitations of detailed system simulations.
- Developing and rigorously validating advanced error-compensation strategies to effectively minimise magnitude and phase differences between simplified and detailed models. Additionally, quantitative accuracy indices are introduced to systematically evaluate simplified model performance across diverse control strategies and operational scenarios.
The paper structure is as follows: Section 2 discusses simplification methodologies for stability analysis in multi-converter systems. Section 3 investigates impedance variations using both simplified and detailed models. Section 4 provides a comprehensive quantification of impedance errors. Section 5 proposes improved lead–lag compensation to reduce errors in converter stability studies. Section 6 applies impedance-based indices for stability assessment of PV and PQ controlled converters. Section 7 concludes and suggests further research directions.
2. Simplified Analysis of Interactions in a Multi-Converter System
This section investigates the dynamic behaviour of interconnected voltage source converters (VSCs) using an impedance-based approach [21], as shown in Figure 1.
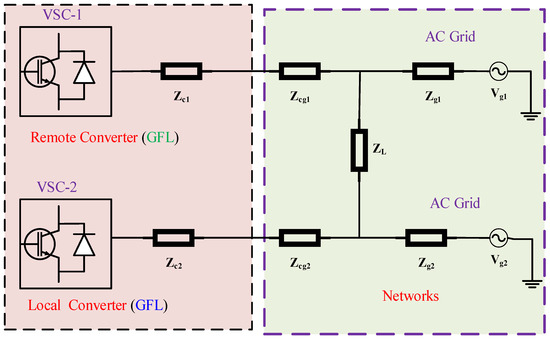
Figure 1.
Topological structure of multi-converter network.
A key parameter in this analysis is the impedance ratio (IR), which quantifies the impact of a remote converter on the electrical environment experienced by a local converter. Specifically, the compares the network impedance at the local converter terminal before and after the integration of the additional converter. It is defined as
where denotes the network impedance at the local converter terminal after the remote converter is added, and represents the original network impedance prior to interconnection.
To capture the complexities of multi-converter systems, this study employs a unified model that incorporates grid-following (GFL), grid-forming (GFM), and hybrid control modes (see Figure 2). In this framework, GFL converters achieve synchronization through a phase-locked loop (PLL), while GFM converters synchronise using power-based methods. Both types use proportional-integral (PI) controllers in the synchronous reference frame for current regulation, enhanced by cross-coupling compensation and voltage feedback to improve dynamic response. The outer control loop maintains system stability by regulating active power (q-axis) and upholding the voltage reference (d-axis) at the point of common coupling (PCC). This coordinated control structure is particularly effective for ensuring reliable operation in converter-dominated systems, especially under weak-grid scenarios.
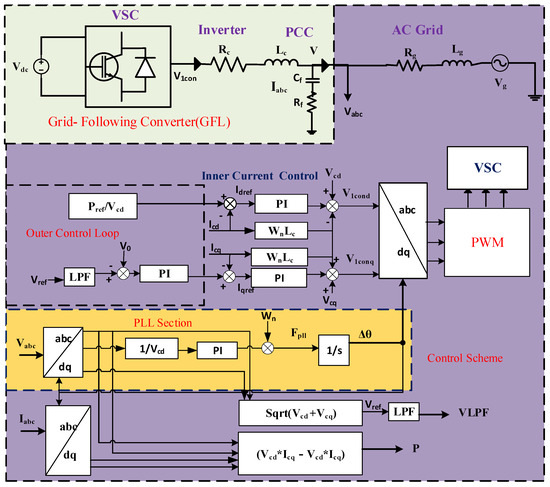
Figure 2.
Comprehensive impedance analysis of grid-following (GFL) converter model.
Although full-order models offer high fidelity, their computational demands are prohibitive for large-scale systems. To mitigate this, a reduced-order model is developed through strategic simplifications (Figure 3). The simplification involves three key steps: (a) linearization of the system along each control axis to make the analysis more manageable; (b) introduction of a controlled time delay to align the outer-loop current reference with the actual converter current, reflecting the inherent control dynamics; and (c) modelling of converter current behaviour using a high-value parallel resistor, and setting the converter voltage equal to the PCC voltage, eliminating the need for intermediate electrical components.
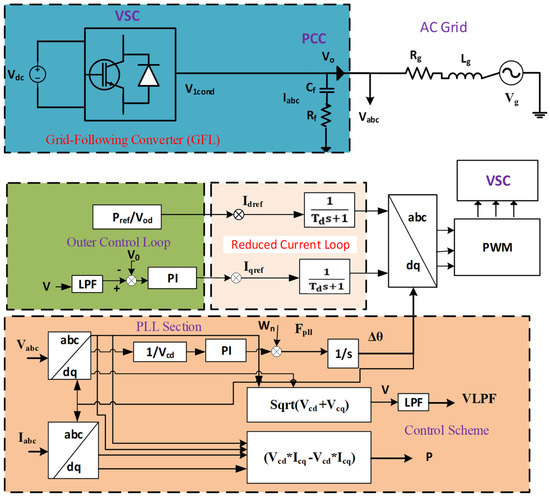
Figure 3.
Impedance characteristics of simplified grid-following (GFL) converter model.
The simplified model intentionally omits passive components such as inductors and resistors, yet preserves the essential dynamic features required for accurate stability evaluation. This streamlined approach supports efficient analyses in both frequency and time domains, while maintaining the core characteristics necessary to understand and predict the interactions between multiple converters.
2.1. Dynamic Modelling of LCL Filters with Robust Current Control Techniques
Accurate stability analysis of grid-connected power electronic systems requires detailed modelling of both the converter and its interaction with the grid. Traditional small-signal models using time-scale separation, although widely adopted [26], often fail to capture frequency-dependent effects, limiting their reliability in practical applications. To overcome this limitation, this work introduces an advanced impedance-based approach for stability assessment, specifically targeting the frequency-domain interactions between the converter and the grid [21]. This method not only clarifies the dynamic behaviour of LCL filters but also evaluates the influence of current control strategies on overall system performance.
Converter–Grid Interface Modelling: The interface between the converter and the grid can be described through precise mathematical relationships. The voltage difference across the grid inductor, determined by the converter output voltage () and the grid (), is given by:
Similarly, the relation between the converter internal voltage () and output voltage () is written as
In these equations, denotes the converter Voltage, represents the grid voltage, and signifies the converter-side current. The Laplace differential operator is denoted by s.
Current controller dynamics: The inner current controller dynamics, critical for system stability, are expressed as:
where is the reference current, and represents the proportional-integral (PI) controller:
Setting , Equation (4) simplifies to:
Focusing on the difference between the control voltage and the grid voltage, the derivation as follow:
Substituting (2) into (3) provides:
Equating Equations (5) and (6) and simplifying eliminates the term, resulting in
Open-Loop and Closed-Loop Analysis: Rearranging (8) defines the open-loop gain:
Applying pole cancellation techniques , the closed-loop transfer function simplifies to
In the given formulation, represents the closed-loop time constant, where and are defined as and , respectively. The optimal time delays are consequently derived as and . Using representative parameters provided in Table 1 and Table 2, and accounting for factors such as current controller bandwidth, switching frequency limits, and the dynamic requirements of multi-terminal VSC systems, the optimal delay values are calculated as and . For simplicity and consistency, is denoted throughout this manuscript, and the specified delay range (0.1–1 ms) is uniformly applied to all network-connected converters as described by Equation (10).

Table 1.
Control parameters for VSCs controller.

Table 2.
The system parameter for weak and strong coupling.
2.2. Inner Current Loop Simplification
The inner current loop simplification process for multiple voltage source converters (M-VSCs), as illustrated in Figure 3, is clearly explained in this section. To manage the complexity of analysing interconnected converters, the original detailed current loop model can be simplified into a more manageable form, specifically represented by a first-order lag characterised by the time constants and .
Simplifying converter models is essential in practical studies, as it lowers the computational burden while maintaining the most significant dynamic characteristics. The approach begins by examining Equations (3) and (4), which describe the behaviour of the inductor current and the current control loop. The key assumption in this method is that the converter’s reference current closely tracks the actual current on the converter side. This allows the converter to be represented as an ideal current source. Mathematically, this simplification is expressed as:
This equation concisely characterises the converter-side current response as a first-order lag, effectively removing unnecessary complexities from the model representation. To improve the accuracy of this simplified model, a deliberate incorporation of a time delay is introduced, capturing the practical dynamics inherent in current control loops. Specifically, Equation (10), previously derived, articulates this concept by establishing a direct linkage between the reference current and the actual converter current response, explicitly accounting for the delay effect.
By adopting this approach, the simplified model achieves an effective compromise between analytical simplicity and dynamic fidelity. It enables efficient system-level analysis while ensuring that the essential interactions and responses of converter-dominated networks are accurately preserved.
3. Impedance Changes in Simplified and Detailed Model Simulations
This section presents a focused comparison of impedance variations between simplified (Simp) and detailed (Det) simulation models, utilizing both the impedance ratio method and eigenvalue analysis. The approach integrates both time-domain and frequency-domain simulations, ensuring robust validation and clear interpretation of results. Time-domain simulations are conducted in MATLAB/Simulink (R2023b), providing direct observation of dynamic interactions between converters and the grid. Simultaneously, frequency-domain simulations are performed using analytically calculated converter impedances. Both simulation types are executed in MATLAB to maintain methodological consistency and enable precise comparison. For clarity, throughout the text and in all figures, the abbreviations Det (Detailed), Simp (Simplified), Imp (Impedance), and Time (Time-domain) are used.
The main electrical and control settings for the multi-converter system simulations are clearly listed in Table 1 and Table 2. These parameters are drawn from well-established references [4,21,36,37]. To offer a comprehensive understanding, we examine two network cases: a strong grid (Coupling One) and a very weak grid (Coupling Two). Comparing the simplified and detailed models under these two distinct conditions effectively reveals how impedance behaviours change across different grid strengths.
Due to manuscript length constraints, detailed results are presented explicitly for only the two extreme network scenarios: a strong and a very weak grid. However, it is important to note that the impedance modelling approach introduced in Equation (1) is versatile. It can be applied to any multi-converter network under various grid conditions. Intermediate scenarios, while not detailed here, produce results that are consistent with the reported range.
The primary objective of this comparative study is to evaluate the accuracy, reliability, and practical applicability of simplified modelling methods. The assessment aims to determine the extent to which simplified models preserve critical dynamic characteristics essential for reliable and effective stability analyses in power systems dominated by converter interactions.
3.1. Impedance Simulation Results Under Coupling One
This section thoroughly examines impedance characteristics of a multi-converter network specifically under the “Coupling One” scenario. Both detailed and simplified models are employed for this evaluation. Figure 2 illustrates the detailed model’s impedance configuration, while Figure 3 shows the simplified model’s setup. Due to space constraints, Figure 4 focuses exclusively on positive-sequence impedance, , derived from both modelling approaches. The impedance measurements were carried out using analytical methods closely following those described in [38].
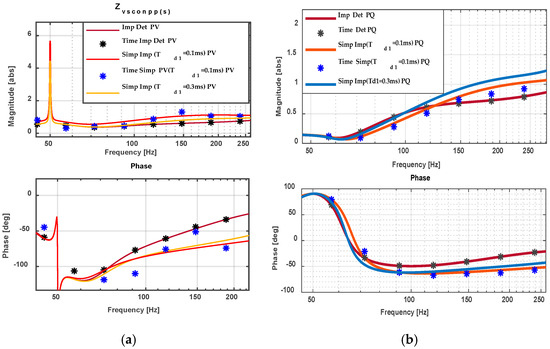
Figure 4.
Impedance of remote converter with (a) PV and (b) PQ Control mode.
The analytical impedance results strongly align with time-domain measurements, confirming the accuracy of the analytical approach. Specifically, the detailed model’s frequency-domain impedance matches its corresponding time-domain impedance (Time Imp Det) closely, and similarly, the simplified model displays strong consistency between frequency and time-domain impedances (Time Imp Simp). This consistency is particularly notable under PV control (Figure 4a) and PQ control (Figure 4b), validating the simplified model’s ability to accurately represent critical impedance dynamics.
Impedance characteristics under both PV (Figure 4a) and PQ (Figure 4b) controls closely coincide above 150 Hz. Below this frequency, variations emerge due to outer-loop dynamics [21]. PQ control notably presents lower impedance magnitudes within the 50–92 Hz range, enhancing stability. Additionally, PQ control maintains a phase angle closer to zero, further emphasizing its superior stability.
Validation of the simplified model at time delays and 0.3 ms under both controls confirms its reliability. Under PV control, the simplified model aligns best at with minimal phase deviation, whereas PQ control achieves optimal alignment at = 0.1 ms, especially below 150 Hz. Optimal time delays showing the least error consistently occur within the frequency range of 50–250 Hz.
Figure 5a compares the combined network-converter impedance with the network impedance alone for both models. Above 150 Hz, shows lower impedance variations, indicating improved stability. At 148 Hz, a notable damping effect occurs with an impedance magnitude of approximately 0.9 and phase angles of 77° for PQ and 79° for PV, suggesting similar stability levels between the two controls. In the simplified model, minimal error relative to the detailed model appears below 150 Hz at but slightly increases at higher frequencies. Stability-wise, the simplified model closely matches network impedance, confirming its reliability compared to detailed models.
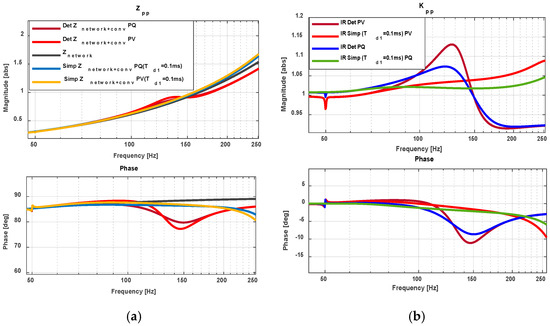
Figure 5.
(a) Impedance of vs. and (b) IR change.
Figure 5b provides impedance ratio (IR) analysis, highlighting strong similarities between PQ and PV models except within the 100–170 Hz frequency range. Under PQ control, IR peaks at 1.1 magnitude (121 Hz) with a phase angle of −8.6°, while PV control reaches 1.16 magnitude (130 Hz) and −11° phase (150 Hz). This slight increase indicates potential stability concerns in the detailed PV model compared to PQ.
For the simplified model at , both PQ and PV models closely match detailed models up to 100 Hz, with increased errors beyond 150 Hz. The detailed model’s higher magnitudes around 150 Hz create slight damping effects, whereas the simplified model maintains nearly ideal conditions (magnitude ≈ 1, phase ≈ 0°).
In Figure 6a (), the detailed model under PV control exhibits higher Eigenvalue IR magnitudes and phases than PQ control, reaching 1.16 at 128 Hz with −11° at 154 Hz, compared to 1.08 at 125 Hz and −8.2° at 162 Hz under PQ control. The simplified models follow the detailed trends well below 100 Hz, but deviations emerge near 150 Hz, where the detailed model predicts higher magnitudes with negative-phase damping. At higher frequencies, simplified models approximate ideal conditions, although they show increased magnitudes at 250 Hz under PV (1.2, −10°) relative to PQ (1.1, −7°), which remain closer to PQ behaviour.
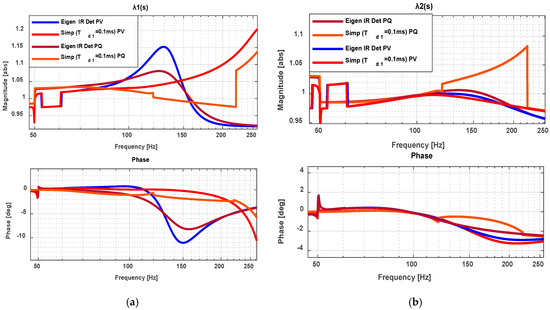
Figure 6.
Eigenvalue analysis of impedance ratio under PV/PQ control for detailed and simplified models (a) ; (b) .
In Figure 6b (), eigenvalue analysis of IR demonstrates strong agreement for PV control due to its stable impedance characteristics. Under PQ control, deviations appear within 120 -220 Hz at ms, reflecting the close interaction of with the negative-sequence impedance . These deviations result from the reactive power regulation inherent to PQ control, which amplifies negative-sequence effects and highlights the need for improved modelling accuracy in such conditions.
Comparing Figure 5b and Figure 6b illustrates similar IR and eigenvalue analysis trends under both controls, closely matching baseline magnitudes and phases within 1–50 Hz. PV control, however, exhibits slightly higher magnitudes between 98–145 Hz, indicating stronger interactions despite PQ’s overall stability advantage. Both models show minimal errors, particularly under PQ control up to 250 Hz, enhancing overall stability.
Figure 7 displays Nyquist plots for remote converters under PQ and PV controls, with the local converter in PV mode under Coupling One conditions. Both detailed and simplified models at closely align under PQ control, whereas simplified PV models exhibit slightly higher responses. Due to PQ control’s inherent stability, simplified models perform best under this scenario. Nyquist analysis provides valuable insights into stability, clearly revealing IR dynamics and overall system interactions.
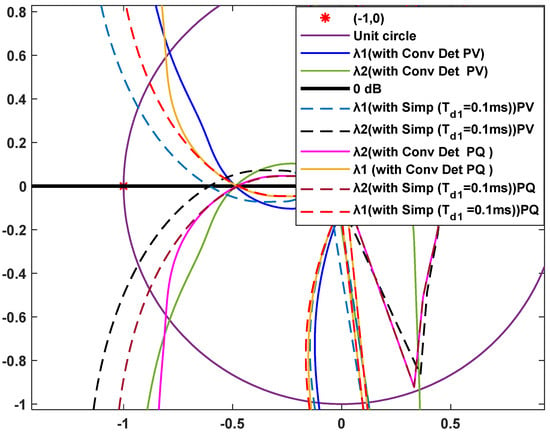
Figure 7.
Nyquist stability comparison of local PV converter with and without remote converters (PV and PQ) under Coupling One parameters.
Overall, this detailed analysis identifies frequency-dependent accuracy patterns, highlighting simplified model optimal performance below 150 Hz. PV control excels at , while PQ achieves optimal accuracy at . Stability evaluations distinctly reveal PQ control’s advantages through reduced impedance magnitudes and favourable phase behaviour, confirming its suitability for robust stability assessment in converter-dominated networks.
3.2. Impedance Simulation Results Under Coupling Two
The impedance characteristics of the Coupling Two configuration (Table 2) exhibit distinct positive-sequence impedance behaviour, as depicted in Figure 8a. Both PQ and PV control schemes in the detailed and simplified models demonstrate the influence of outer-loop control dynamics. In the detailed model, PQ control reduces the magnitude of the combined network-converter impedance, , within the 100–120 Hz range compared to PV control, suggesting enhanced stability. Furthermore, PQ control maintains consistent damping with phase angles below 90°, whereas PV control exhibits oscillatory behaviour, with phase angles ranging from 70° to 112° between 75 and 122 Hz, indicating potential instability, particularly near 114 Hz. Beyond 135 Hz, both impedance and phase stabilise, though PV control retains a pronounced peak at 118 Hz, reflecting strong damping effects.
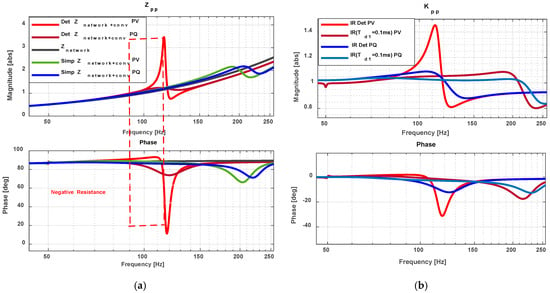
Figure 8.
(a) Impedance comparison between and ; (b) Impedance ratio IR.
In the simplified model, implemented with a time delay of , resonances are absent under both control modes. Under PQ control, the converter-network impedance closely approximates the network impedance, with only minor phase deviations between 170 and 230 Hz. Conversely, PV control leads to significant magnitude and phase discrepancies between 100 and 125 Hz.
Figure 8b compares the impedance ratio (IR), revealing close alignment up to 120 Hz under PQ control, with slight deviations from 122 to 205 Hz. Under PV control, however, the detailed model exhibits intensified interactions and reduced stability [22], diverging significantly from the simplified model with . Figure 9 presents IR eigenvalues in 2 × 2 matrices, demonstrating that PV control amplifies interactions between the remote converter impedance and the network. Under PQ control, IR values remain near unity with phase angles between 0° and −15° within the 80–120 Hz range, whereas PV control results in IR magnitudes reaching 1.5 with phase variations up to −30°. These findings suggest that PQ control minimally impacts local stability in weak networks, while PV control may compromise it.
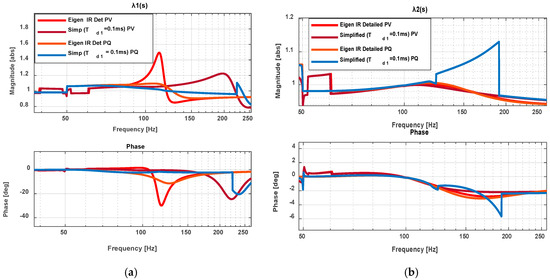
Figure 9.
Eigenvalue of the impedance ratio (IR) change (a) ; (b) .
Nyquist plots in Figure 10 further validate these observations. Under PQ control, both detailed and simplified models satisfy Nyquist stability criteria, even with an additional remote converter, while PV control causes encirclement of the critical point (−1,0), indicating instability likely associated with negative resistance effects observed in Figure 8a. Time-domain simulations (Figure 11a,b) corroborate these theoretical results. The detailed model remains stable at a PLL frequency of 10 Hz; however, increasing the frequency to 30 Hz induces a 64 Hz resonance in the -frame (corresponding to 114 Hz in the AC system), consistent with Nyquist predictions. In contrast, the simplified model with remains stable under identical conditions, reinforcing the superior stability of PQ control in weak network scenarios
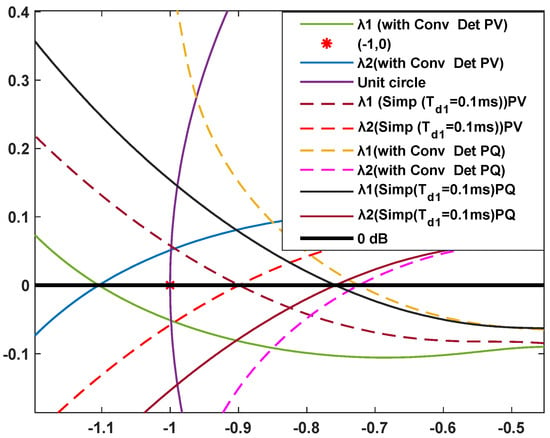
Figure 10.
Nyquist stability comparison of local PV converter with and without remote converters (PV and PQ) under Coupling Two parameters.
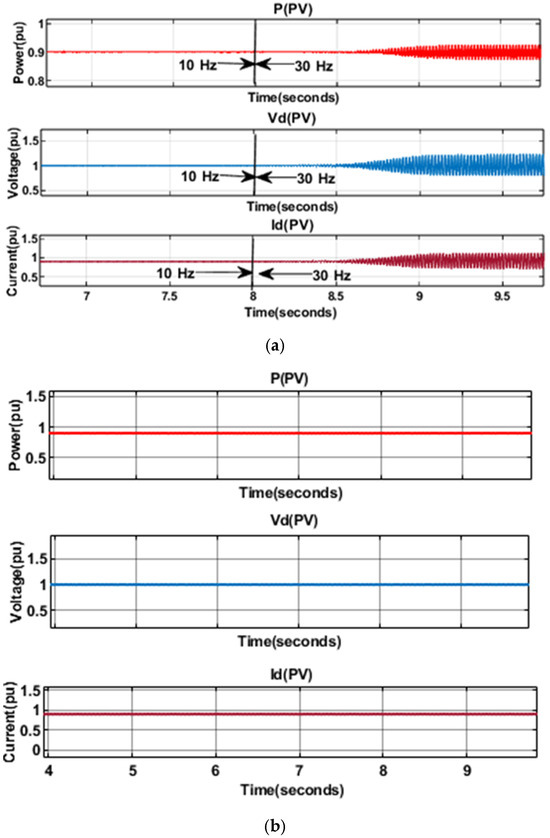
Figure 11.
Time-domain response of local converter under Coupling Condition Two of d-axis voltage, current, and power (a) Detailed model; (b) Simplified model .
Figure 12, Figure 13 and Figure 14 provide a comprehensive evaluation of impedance-based stability characteristics for PV and PQ control schemes, focusing on the impact of proportional-integral (PI) gain variations and phase-locked loop (PLL) frequency settings. The analysis compares both models, emphasizing impedance ratio (IR), eigenvalue trajectories, and Nyquist plots to establish stability margins.
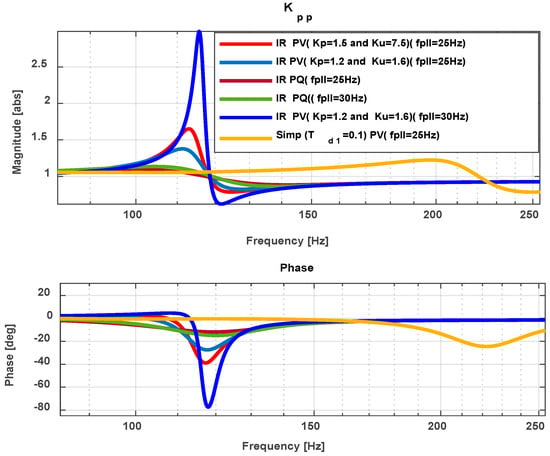
Figure 12.
IR with variations of PLL and AC voltage control parameters.
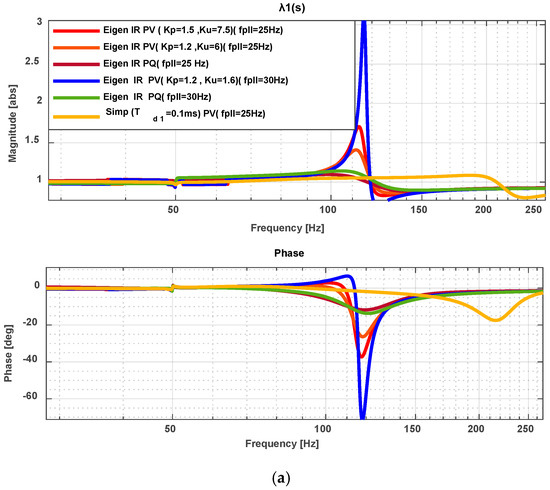
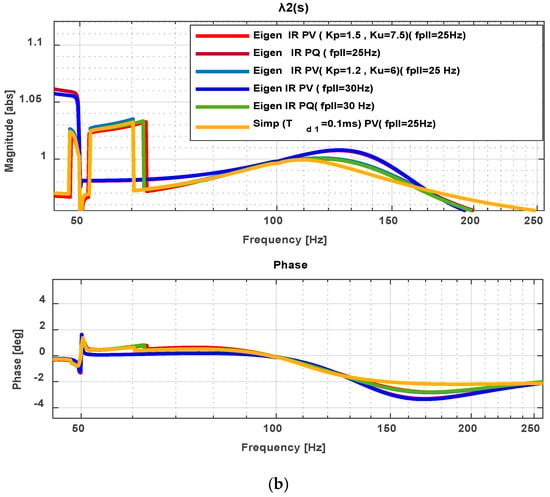
Figure 13.
Eigenvalue one and two IR with variations of PLL and AC voltage control parameters: (a) Eigenvalue 1, (b) Eigenvalue 2.
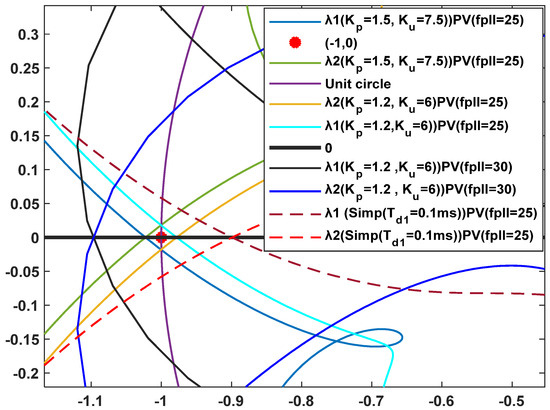
Figure 14.
Nyquist plots with variations of PLL and AC voltage control parameters.
Figure 12 illustrates the magnitude and phase of the impedance ratio (IR) across a frequency sweep, revealing the sensitivity of PV control to PI gain and PLL frequency variations. Specifically, with increased PV control gains (e.g., , ), the system exhibits a pronounced resonance peak near 130 Hz, with the IR magnitude significantly exceeding unity and the phase approaching , indicating potential instability. Reducing the gains to , attenuates this resonance, improving phase margins and system robustness. Conversely, PQ control demonstrates inherent resilience across all tested conditions. Its IR magnitude consistently remains within 0.9–1.1, with phase angles between +0.2° and −11.8°, suggesting strong damping and stable grid interaction. This robustness is particularly evident under weak grid conditions and low PLL frequencies.
Figure 13 further investigates the eigenvalues of the impedance ratio matrix, offering insight into the directional stability of individual modes in a MIMO framework. For PV control with , , and a PLL frequency of 25 Hz, the eigenvalue magnitude reaches approximately 2.8 with a phase of −78°, indicating a potential unstable resonance mode. Increasing the PLL frequency to 30 Hz sharpens this peak, with the phase dropping to −68°, further degrading stability.
The simplified model, however, exhibits reduced sensitivity in this frequency range due to its idealised representation (including a time delay). This model suppresses high-frequency interaction modes, leading to improved phase margins under identical control gains. PQ control again maintains favourable eigenvalue characteristics, with no critical peaks or encirclements, confirming its resistance to destabilizing interactions despite parameter variations.
The Nyquist plots presented in Figure 14 substantiate the frequency-domain observations. For PV control, the Nyquist curves corresponding to , at 30 Hz clearly encircle the critical point (−1,0), thereby confirming instability in the detailed model. A similar encirclement is observed at 25 Hz for the higher gain setting (, ). In contrast, the simplified PV model shows no encirclement under the same conditions, suggesting a more conservative but stable dynamic response. PQ control consistently maintains Nyquist plots at a safe distance from the critical point across all tested gains and PLL frequencies, reaffirming its superior stability, particularly under low PLL bandwidth and moderate PI gains.
This analysis highlights the significant influence of Proportional-Integral (PI) controller gains and Phase-Locked Loop (PLL) frequency on the small-signal stability of systems employing PV control. High values of PI gains or PLL frequencies notably amplify resonances and induce instability, especially within the frequency range of 120–160 Hz. Conversely, systems using PQ control exhibit consistent and reliable performance, remaining stable despite variations in these parameters.
Simulation results for different coupling conditions confirm that interaction factor and model reduction methods maintain accuracy and stability under strong grid scenarios, with negligible errors that do not compromise overall system stability, as shown in Figure 7. Strong grids effectively minimise coupling interactions, ensuring that simplified models closely match detailed simulations. Additionally, PQ control consistently outperforms PV control in terms of stability within networks dominated by converters. The superior stability of PQ control arises from its current-based regulation, which reliably maintains the desired power output and significantly reduces sensitivity to fluctuations in grid impedance and voltage levels. In contrast, PV control directly regulates voltage, increasing susceptibility to variations in grid conditions and consequently raising the risk of resonance and instability.
In weaker grid conditions, particularly when PV control is employed, sensitivity to parameter changes and control delays intensifies, increasing coupling interactions and causing notable inaccuracies in simplified models. Figure 10 clearly demonstrates that simplified models may inaccurately indicate stability, while detailed models correctly reveal instability. This issue highlights the inadequacy of methods that rely primarily on reducing time delays in weak-grid scenarios. Thus, employing advanced error-compensation techniques and comprehensive analysis of time-delay effects discussed in Section 5 based on the error evaluations presented in Section 4 is crucial for accurately assessing stability and effectively reducing modelling errors.
4. Simulation Results for Impedance Error Quantification
This study assesses the accuracy of the simplified converter model by quantifying magnitude and phase errors relative to the detailed model for converter impedance, impedance ratio (IR), and eigenvalue IR. Numerical integration techniques, including trapezoidal and Simpson’s rules, were employed to approximate these errors across the 50–250 Hz frequency range at 2 Hz intervals [39]. The detailed model’s magnitude and phase are denoted as and , while and represent the simplified model’s corresponding values. Error quantification follows these expressions:
Here, and represent the integrated magnitude and phase errors across the examined frequency spectrum. These metrics were evaluated at multiple time delays to validate the simplification approach’s precision.
4.1. Under Coupling One Analysis
Figure 15, Figure 16, Figure 17 and Figure 18 present error comparisons between detailed and simplified MVSC models under PV and PQ control schemes for Coupling One, examining time delays of = 0.10, 0.20, and 0.30 across a frequency range of 50 to 250 Hz. The analysis evaluates the simplified model’s fidelity to the detailed reference.
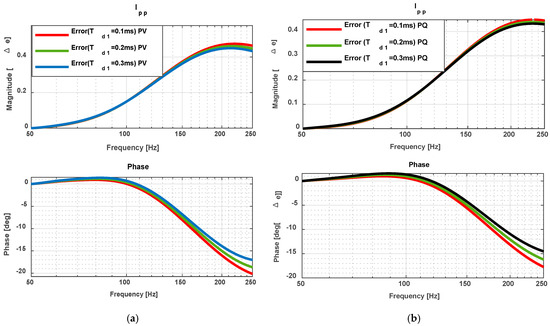
Figure 15.
Percentage error of remote converter impedance under Coupling One. (a) PV control; (b) PQ control.
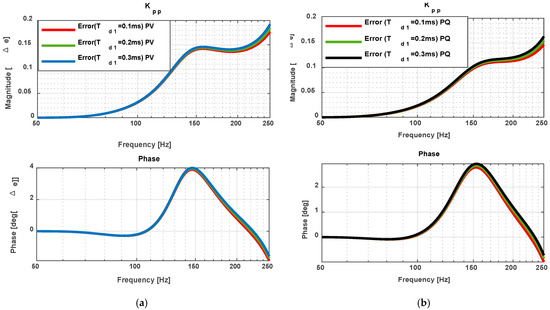
Figure 16.
Impedance ratio (IR) percentage error Under Coupling One (a) PV (b) PQ.
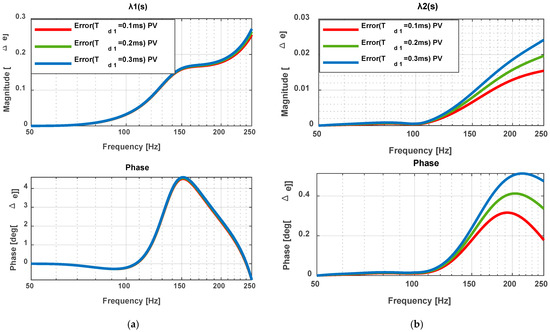
Figure 17.
Eigenvalue of the impedance ratio (IR) change error PV (a) ; (b) .
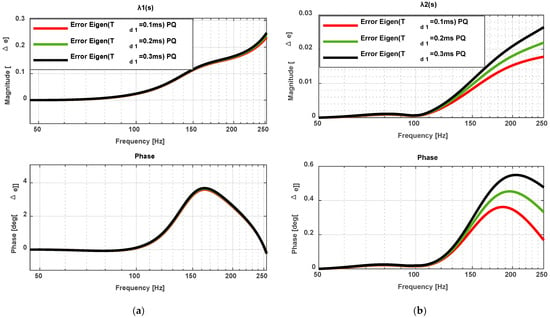
Figure 18.
Eigenvalue error of the impedance ratio (IR) under PQ with Coupling One. (a) ; (b) .
Figure 15a,b displays remote converter impedance results under PV and PQ control respectively. At , both magnitude and phase errors were negligible, with PQ control demonstrating superior accuracy. Figure 16 presents IR comparison results, revealing optimal precision at where maximum errors reached 20% in magnitude and 4° in phase.
Eigenvalue errors of the impedance ratio (IR) under PV and PQ controls are presented in Figure 17 and Figure 18. Figure 17a shows that PV control introduces slightly higher errors compared to PQ control in Figure 18a. In contrast, the second eigenvalue analysis in Figure 17b and Figure 18b demonstrates excellent agreement between detailed and simplified models, with maximum deviations restricted to 2.5% in magnitude and 0.4° in phase.
These results confirm that, under Coupling Condition One, the simplified modelling approach remains highly accurate when the time delay is selected appropriately. Across the 50–250 Hz frequency range, errors are consistently minimal, validating the method for precise stability studies. The quantified comparison shows that the simplified model preserves the essential accuracy of the detailed representation while providing significant computational efficiency.
4.2. Under Coupling Two Analysis
Figure 19, Figure 20, Figure 21 and Figure 22 present a detailed error assessment comparing the detailed and simplified models of the Modular Voltage Source Converter (MVSC) under the Coupling Two configuration. The analysis covers both PV (power-voltage) and PQ (power-reactive power) control modes, considering time delays of 0.10, 0.20, and 0.30 ms. This comparison aims to identify the most suitable time delay value that ensures model simplification without sacrificing accuracy.
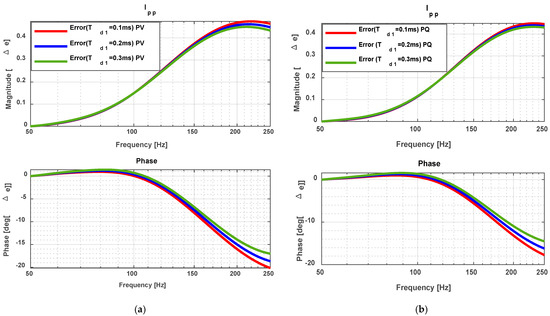
Figure 19.
Percentage error of remote converter impedance under Coupling Two. (a) PV control; (b) PQ control.
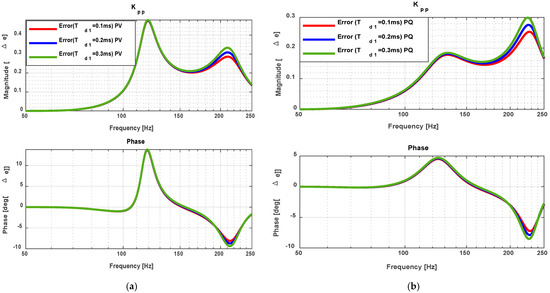
Figure 20.
Impedance ratio (IR) percentage error Under Coupling Two (a) PV (b) PQ.
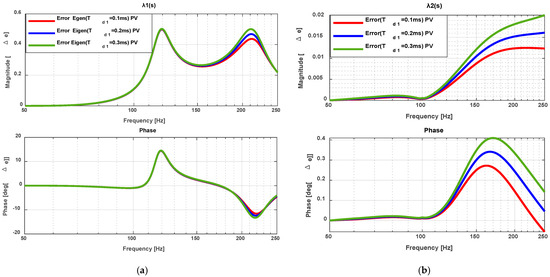
Figure 21.
Eigenvalue of the impedance ratio (IR) change error PV. (a) ; (b) .
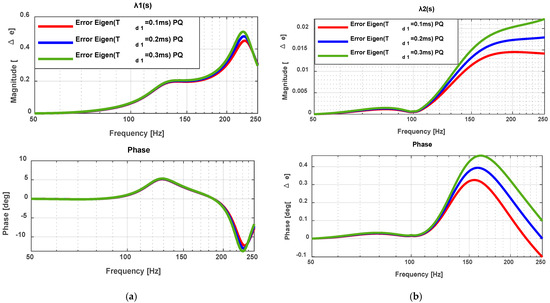
Figure 22.
Eigenvalue error of the impedance ratio (IR) under PQ with Coupling Two. (a) ; (b) .
Figure 19 shows the percentage error in the impedance of the remote converter when using the reference. The results indicate that the PV control mode (Figure 19a) produces higher errors than the PQ control mode. Specifically, the PV control reaches up to 4.5% error in magnitude and 20° in phase. Both control strategies achieve their lowest errors when ms, where the difference between detailed and simplified models is minimised.
Figure 20 explores the error in impedance ratio (IR) for both control strategies. The PV mode (Figure 20a) presents its highest errors within the 100–150 Hz frequency range, whereas the PQ mode (Figure 20b) shows increased deviations between 200–250 Hz. The analysis demonstrates that the smallest errors for both modes are observed at .
Figure 21 and Figure 22 present the eigenvalue errors of the impedance ratio (IR) under PV and PQ controls. In Figure 21a, representing PV control exhibits larger deviations between detailed and simplified models, reflecting its higher sensitivity to simplification and time-delay representation. In contrast, Figure 22a, corresponding to under PQ control, shows much smaller discrepancies across the same frequency range. The results for the second eigenvalue () in Figure 21b and Figure 22b demonstrate very close agreement between detailed and simplified models in both control modes. The maximum error observed is limited to 2% in magnitude and 0.4° in phase, verifying that the choice of provides the most accurate representation.
Overall, the Coupling Two analysis indicates that PQ control enables highly accurate model simplification, whereas PV control shows consistently greater deviations. These results indicate required refinement in simplification approaches for PV systems. The comprehensive error assessment provides essential empirical data for optimizing parameters and pinpoints specific stability evaluation components needing improvement to boost precision. The performance differences demonstrated offer valuable guidance for both model development and practical system implementation.
5. Error-Minimised Lead—Lag Compensation for High-Fidelity Converter Stability Analysis
The conventional simplified modelling techniques for remote converters operating under PV control, particularly within Coupling Two scenarios, often demonstrate significant inaccuracies. While detailed models indicate clear instability under certain conditions, simplified approaches frequently and incorrectly predict stable system behaviour. To address this critical issue, a lead–lag compensator has been integrated into the digital control architecture [40,41]. The implementation of this compensator successfully reduces errors across diverse coupling parameters and control methodologies.
The lead–lag compensator is formally represented by Equation (13), providing a clear definition of the input–output relationship while capturing essential dynamic properties:
In Equation (13), the compensator’s dynamic response is tuned using the time constant = , where is strategically chosen as 250 Hz. This frequency selection aligns precisely with the critical frequency domain relevant to converter–grid interactions. Importantly, the ratio of lead–lag coefficients (0.1:0.02) was carefully selected through rigorous numerical optimization aimed explicitly at enhancing the phase margin and achieving robust closed loop stability. The optimization targeted minimal magnitude and phase discrepancies between detailed and simplified models within the frequency band of 50–250 Hz.
For superior precision, Equation (14) introduces an advanced multi-stage compensator design, significantly reducing impedance modelling inaccuracies by approximately 1% across the critical frequency range:
Here, denotes the dimensionless compensator gain, and are the lead/lag ratios and , with and define the transition boundaries for lead and lag compensation. The exponential term , with , models the inherent digital control delay.
Optimization of compensator parameters is governed by the impedance error integral outlined in Equation (15):
The analytical methodology, implemented in MATLAB/Simulink, rigorously evaluates the impedance differentials between detailed and reduced-order system representations within the critical frequency range of 50–250 rad/s. This targeted approach enables effective identification and correction of significant modelling errors, ensuring enhanced accuracy during compensator tuning. Validation, as illustrated in Figure 23 and reinforced by complementary simulation and experimental findings, clearly indicates that the designed compensator achieves significant improvements in phase consistency and fortifies the reliability of stability diagnostics, particularly under weak-grid conditions. Consequently, this method achieves a beneficial balance between computational simplicity and precise modelling, effectively capturing essential dynamic interactions. Thus, it provides a robust, practical solution for accurately evaluating converter–network interactions, supporting reliable real-time stability analysis in complex converter-dominated power systems.
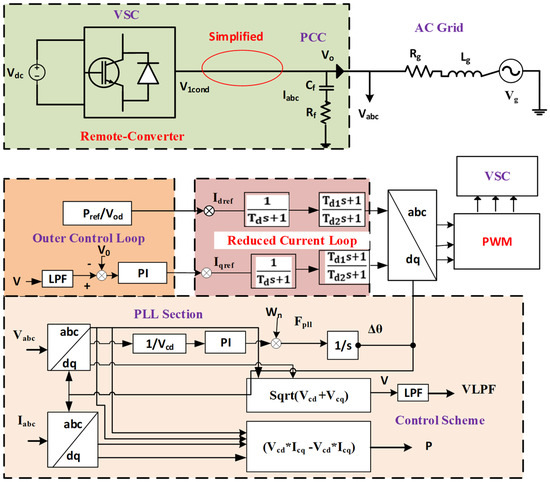
Figure 23.
Simplified model with lead–Lag compensation for optimal phase error reduction.
The lead–lag compensator effectively minimises modelling errors within the 0–250 Hz frequency band, substantially reducing both magnitude and phase discrepancies. This improvement is illustrated in Figure 24a,b for remote converters under PV and PQ control modes, respectively. Figure 25 further validates model consistency via Nyquist stability criteria.
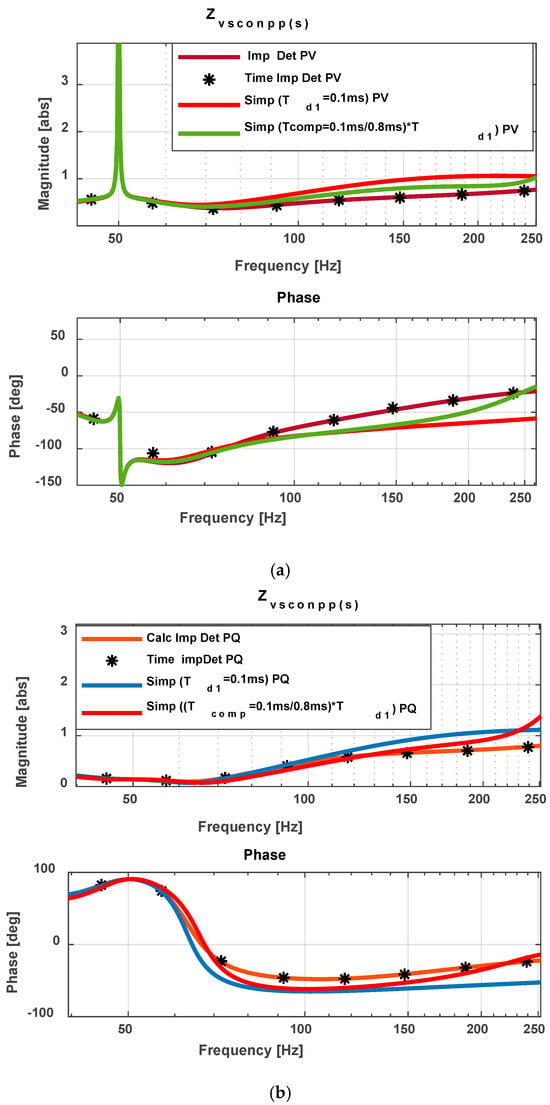
Figure 24.
Impedance of remote converter comparison between detailed and simplified with lead lag (a) PV and (b) PQ Control mode.
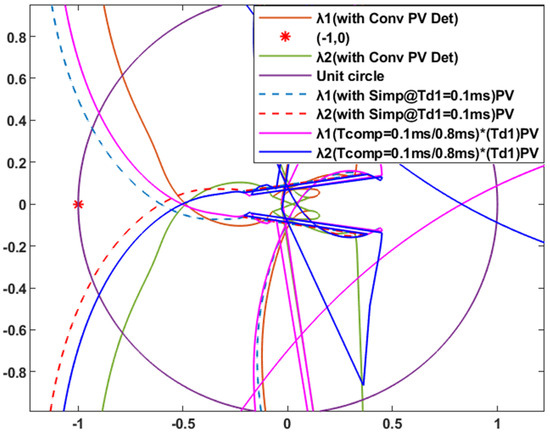
Figure 25.
Nyquist plots with lead–lag compensation under Coupling One PV control.
The proposed compensation method effectively achieves precise phase alignment between detailed and simplified models by systematically minimizing the error defined in Equation (16). This error quantifies the normalised difference between the frequency responses of the detailed and simplified models, serving as a critical performance measure as follows:
To further enhance this compensation, Equation (17) introduces a lead–lag transfer function that dynamically adjusts model responses based on the quantified error as follows:
The chosen coefficient ratio ensures optimal phase correction within the targeted frequency range, while the time constant provides adaptive flexibility across diverse operating conditions.
6. Stability Assessment of PV/PQ-Controlled Converters Using Impedance-Based Indices
Accurate stability analysis of converters employing PV and PQ control requires detailed modelling of frequency-dependent behaviours, particularly considering delays introduced by control strategies. This section introduces two improved impedance-based indices designed to quantitatively evaluate differences between detailed and simplified converter models across specific frequency ranges.
The Enhanced Magnitude Error Index () is defined as:
This index measures the relative magnitude difference between the detailed impedance model () and its simplified counterpart () within frequencies from 50 Hz to 250 Hz. The weighting factor emphasises lower frequencies, critical for stability due to their significant influence on converter control dynamics and oscillatory behaviour [42].
The Enhanced Phase Error Index is defined as:
This index quantifies phase-angle discrepancies between detailed and simplified impedance representations. By evaluating phase deviations at each frequency, the index effectively captures potential impacts on resonances and stability margins.
Together, and comprehensively assess the accuracy of simplified impedance models, ensuring precise and frequency-sensitive validation. The indices, formulated as matrix-based measures, allow efficient and detailed comparative analysis across diverse operating conditions.
The proposed methodology demonstrates particular effectiveness in weak-grid conditions, where converter behavior is highly sensitive to variations in network impedance. By ensuring accurate impedance representation across the critical frequency range, the approach improves controller reliability, enhances stability margins, and enables the consistent integration of simplified models into converter-based systems. In addition, the green-highlighted values corresponding to Coupling One and Two in the time-delay results of Table 3, Table 4, Table 5 and Table 6 indicate the optimal selection of the simplified model.

Table 3.
Coupling One Index results under PV control model.

Table 4.
Coupling One Index results under PQ control model.

Table 5.
Coupling Two index results under PV control model.

Table 6.
Coupling Two Index results under PQ control model.
6.1. Analysis of Coupling One
This section systematically investigates the performance of a simplified impedance model for Coupling One by directly comparing it to detailed reference results under both PV and PQ control modes. The evaluation utilises data from Table 3 and Table 4, supported by computational results from Equations (17)–(19). The analysis focuses on three primary indicators: converter impedance, impedance ratio (IR), and the eigenvalue of the IR, each serving as a distinct measure of modelling fidelity.
For PV control, as detailed in Table 3, the highest model accuracy occurs when the time delay parameter is set to 0.3 ms. At this delay, the Impedance Error Index is minimised, with a magnitude of 0.17 and a phase error of 1.83 degrees. Correspondingly, the Impedance Ratio Error Index achieves its lowest magnitude error of 0.003 and phase error of 1.532 degrees. The Eigenvalue IR Error Index further supports this result, registering a magnitude error of only 0.113 and phase errors of 1.520, 0.010, and 0.255 degrees. These values indicate a highly accurate representation of the system’s impedance characteristics under PV control.
In contrast, under PQ control conditions (Table 4), the optimal accuracy is realised at a shorter delay, specifically = 0.1 ms. Here, the Impedance Error Index records a magnitude of 0.13 and a phase error of 2.02 degrees. The Impedance Ratio Error Index reaches its minimum at a magnitude error of 0.006 and phase error of 1.606 degrees. The Eigenvalue IR Error Index at this setting demonstrates a magnitude error of 0.101 and extremely low phase errors (1.532, 0.009, and 0.179 degrees). These outcomes confirm the model’s precise depiction of converter-to-network interactions under PQ control.
These results demonstrate that the simplified model effectively captures the complex interactions between converters and networks across a wide range of control strategies and parameter variations. The observed close agreement with the detailed model, especially under Coupling One scenarios, underscores its value for precise stability assessments and accurate coupling analysis in extensive converter-based systems. This evidence confirms the model’s dependability for thorough stability studies, supporting its application in large-scale, modern power systems where power electronics play a central role.
6.2. Analysis of Coupling Two
Table 5 and Table 6 provide a comprehensive assessment of the modelling accuracy for Coupling Two under both PV and PQ control schemes. The results distinctly identify the delay parameters that yield the most accurate representation of system dynamics. For PV control, as shown in Table 5, a time delay of 0.3 ms produces the smallest observed errors. Specifically, the Impedance Error Index reaches its lowest value, with a magnitude error of 0.37 and a phase error of 2.10 degrees. At this delay, the Impedance Ratio Error Index also achieves minimal errors: the magnitude error is reduced to 0.007, and the phase error is 3.707 degrees. Furthermore, the eigenvalue impedance ratio (IR) at this optimal delay presents a magnitude error of just 0.091, and the phase errors are extremely low (1.882, 0.284, and 0.514 degrees).
For PQ control, Table 6 reveals that the highest accuracy is obtained at a shorter delay, = 0.1 ms. At this setting, the Impedance Error Index records the minimum errors, with a magnitude of 0.52 and a phase of 2.02 degrees. The Impedance Ratio Error Index at this optimal delay shows a magnitude error of 0.009 and a phase error of 2.525 degrees. Additionally, the eigenvalue IR achieves a magnitude error of 0.597, while the phase errors remain exceptionally low (3.703, 0.510, and 0.116 degrees).
The delay values identified in both cases directly satisfy the criteria established in Equations (15)–(17). This finding verifies that the simplified model accurately captures the interaction mechanisms specific to Coupling Two. The results emphasise that precise selection of delay parameters is crucial for achieving reliable and high-fidelity modelling, regardless of the applied control strategy. Such accuracy is vital for robust stability analysis in converter-dominated power systems, where detailed representation of dynamic interactions is essential.
Figure 26 offers a clear, informative 3D visualization, depicting magnitude (panel a) and phase (panel b) error metrics across various control approaches, including One PQ Control, One PV Control, and Two PQ Control Targets, evaluated at distinct delay intervals (0.1 ms, 0.3 ms, and 1.0 ms). The presented error indices include the Impedance Error Index (blue), Impedance Ratio Error Index (green), and Eigenvalue Error Index (red). The Magnitude Error Index () and Phase Error Index (), defined by Equations (18) and (19), quantify differences between detailed and simplified impedance models using frequency-weighted and time-delay compensation functions. These graphical results emphasise the substantial influence of control strategies and delay settings on system stability, validating the simplified model’s capability for precise stability assessments and effective control design in complex converter–grid interactions.
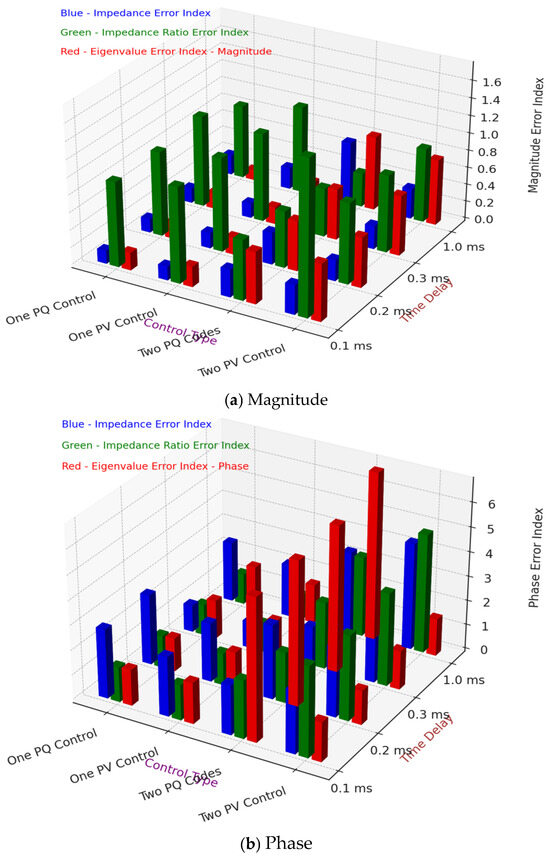
Figure 26.
3D chart of error metric indices for different coupling configurations.
Overall, from the quantification of these indices, the effectiveness of the proposed simplification methods is closely linked to both the number of converters and the specific control strategies implemented. The present study applies these techniques within MATLAB/Simulink for systems containing several converters, carefully analysing their performance in realistic multi-converter scenarios. All simulations confirm that the simplified models accurately represent key impedance characteristics for the configurations tested.
Looking forward, future research will extend this work by incorporating laboratory-based experiments and expanding the analysis to systems with any number of buses. Preliminary tests with multiple converters have already demonstrated the method’s reliability. These upcoming studies will further validate the approach and increase its practical value for large-scale power systems.
7. Conclusions
This study presents an accurate and practical impedance-based method for assessing stability in converter-dominated power systems. The proposed approach integrates impedance ratio and eigenvalue analyses, effectively linking reduced-order models with their detailed equivalents. This connection ensures key dynamic characteristics are preserved, significantly reducing computational demands. Consequently, this method proves particularly beneficial for stability evaluation in networks comprising multiple interconnected converters, where computational efficiency is essential.
A critical finding from this study is the identification of the 50–250 Hz frequency band as vital for precise stability analysis. Within this frequency range, control strategies and converter interactions substantially influence system dynamics. Comprehensive analysis indicates that simplified models employing PV control often lose accuracy due to strong parameter coupling among closely interconnected converters. To correct these inaccuracies, careful integration of lead–lag compensators and precise tuning of time delays become necessary. This result underscores the heightened sensitivity of PV-controlled systems to dynamic network changes and emphasises the need for careful model adjustments.
Conversely, PQ control demonstrates significant robustness against parameter variations and coupling effects within the same frequency range. Its lower sensitivity substantially decreases modelling errors and computational complexity. Consequently, PQ control supports more accurate and reliable stability assessments, which is particularly beneficial when simplified models are implemented. At frequencies below 50 Hz, reduced-order models accurately represent the dynamics captured by detailed simulations without requiring additional compensation. This finding confirms the effectiveness of simplified approaches for reliably capturing primary low-frequency interactions between converters and the grid.
In conclusion, the developed impedance-based model reduction technique offers a reliable and efficient tool for analysing stability in complex multi-converter networks. Comparative results clearly illustrate the advantages of PQ control enhanced robustness, higher accuracy, and reduced complexity making it preferable for stability evaluations in modern power systems. Future research will extend this methodology to more advanced grid configurations and diverse operating conditions, ensuring its ongoing applicability as power system technologies continue to advance.
Funding
This research received no external funding.
Data Availability Statement
The original contributions presented in this study are included in the article. Further inquiries can be directed to the corresponding author.
Conflicts of Interest
The author declares no conflict of interest.
References
- Zhang, Y.; Tian, M.; Zhang, H.; Song, J.; Zhang, W. Admittance Modeling and Stability Enhancement of Grid-connected Inverter Considering Frequency Coupling in Weak Grids. Electr. Power Syst. Res. 2022, 209, 108034. [Google Scholar] [CrossRef]
- Vemula, N.K.; Parida, S.K. Enhancement of small signal stability in inverter-dominated microgrid with optimal internal model controller. Int. Trans. Electr. Energy Syst. 2020, 30, 12471. [Google Scholar] [CrossRef]
- Tielens, P.; van Hertem, D. The relevance of inertia in power systems. Renew. Sustain. Energy Rev. 2016, 55, 999–1009. [Google Scholar] [CrossRef]
- Henderson, C.; Egea-Alvarez, A.; Kneuppel, T.; Yang, G.; Xu, L. Grid Strength Impedance Metric: An Alternative to SCR for Evaluating System Strength in Converter Dominated Systems. IEEE Trans. Power Deliv. 2022, 39, 386–396. [Google Scholar] [CrossRef]
- Chen, Y.; Xu, L.; Egea-Alvarez, A.; Marshall, B.; Rahman, M.H.; Oluwole, A.D. MMC Impedance Modeling and Interaction of Converters in Close Proximity. IEEE J. Emerg. Sel. Top. Power Electron. 2021, 9, 7223–7236. [Google Scholar] [CrossRef]
- Sun, J.; Mihret, M.; Cespedes, M.; Wong, D.; Kauffman, M. Data Center Power System Stability-Part II: System Modeling and Analysis. CSEE J. Power Energy Syst. 2022, 8, 420–438. [Google Scholar] [CrossRef]
- Xiong, L.; Liu, X.; Liu, Y.; Zhuo, F. Modeling and Stability Issues of Voltage-source Converter-dominated Power Systems: A Review. CSEE J. Power Energy Syst. 2022, 8, 1530–1549. [Google Scholar] [CrossRef]
- Eskandari, M.; Savkin, A.V.; Alhelou, H.H.; Blaabjerg, F. Explicit Impedance Modeling and Shaping of Grid-Connected Converters via an Enhanced PLL for Stabilizing the Weak Grid Connection. IEEE Access 2022, 10, 128874–128889. [Google Scholar] [CrossRef]
- Jiang, S.; Zhu, Y.; Konstantinou, G. Settling-Angle-Based Stability Analysis for Multiple Current-Controlled Converters. IEEE Trans. Power Electron. 2022, 37, 12992–12997. [Google Scholar] [CrossRef]
- He, B.; Chen, W.; Li, X.; Shu, L.; Zou, Z.; Liu, F. Unified Frequency-Domain Small-Signal Stability Analysis for Interconnected Converter Systems. IEEE J. Emerg. Sel. Top. Power Electron. 2023, 11, 532–544. [Google Scholar] [CrossRef]
- Dheer, D.K.; Doolla, S.; Bandyopadhyay, S.; Guerrero, J.M. Effect of placement of droop-based generators in distribution network on small signal stability margin and network loss. Int. J. Electr. Power Energy Syst. 2017, 88, 108–118. [Google Scholar] [CrossRef]
- Amin, M. Small-Signal Stability Characterization of Interaction Phenomena Between hvdc System and Wind Farms. Ph.D. Thesis, Norwegian University of Science and Technology, Trondheim, Norway, 2017. [Google Scholar]
- Aljarrah, R.; Fawaz, B.B.; Salem, Q.; Karimi, M.; Marzooghi, H.; Azizipanah-Abarghooee, R. Issues and Challenges of Grid-Following Converters Interfacing Renewable Energy Sources in Low Inertia Systems: A Review. IEEE Access 2024, 12, 5534–5561. [Google Scholar] [CrossRef]
- Yuan, H.; Hao, Y.; Xin, H.; Huang, L.; Zhou, Y.; Wang, X.; Chen, C.; Lu, G.; Qu, L.; Wu, D. Placing Storage Energies for Enhancing Small-Signal Stability of Converter-Based-Renewable Systems. IEEE Trans. Ind. Appl. 2025, 61, 5684–5698. [Google Scholar] [CrossRef]
- Wang, X.; Blaabjerg, F.; Loh, P.C. An impedance-based stability analysis method for paralleled voltage source converters. In Proceedings of the 2014 International Power Electronics Conference, IPEC-Hiroshima-ECCE Asia, Hiroshima, Japan, 18–21 May 2014; pp. 1529–1535. [Google Scholar] [CrossRef]
- Liao, Y.; Wang, X. Impedance-Based Stability Analysis for Interconnected Converter Systems with Open-Loop RHP Poles. IEEE Trans. Power Electron. 2020, 35, 4388–4397. [Google Scholar] [CrossRef]
- Li, S.; Wang, H.; Huang, Y.; He, G.; Liu, C.; Wang, W. Dynamic Interaction and Stability Analysis of Grid-following Converter Integrated Into Weak Grid. CSEE J. Power Energy Syst. 2025, 11, 552–566. [Google Scholar] [CrossRef]
- Cao, W.; Liu, K.; Wang, S.; Kang, H.; Fan, D.; Zhao, J. Harmonic stability analysis for multi-parallel inverter-based grid-connected renewable power system using global admittance. Energies 2019, 12, 2687. [Google Scholar] [CrossRef]
- Mugambi, G.R.; Darii, N.; Khazraj, H.; Romano, O.S.; Raducu, A.G.; Sharma, R.; Cutululis, N.A. Methodologies for offshore wind power plants stability analysis. arXiv 2024, 10, 13521. [Google Scholar] [CrossRef]
- MartÃ, J.; Aã, S.; Chaques-Herraiz, G.; Bernal-Perez, S.; Blasco-Gimenez, R. Model Aggregation Of Large Wind Farms For Dynamic Studies. In Proceedings of the IECON 2017-43rd Annual Conference of the IEEE Industrial Electronics Society, Beijing, China, 29 October–1 November 2017; pp. 316–321. [Google Scholar]
- Gebremedhin, T.; Xu, L.; Chen, Y.; Chen, D. Assessment of Interactions of Multiple Converters and Network Considering Impedance Change. In Proceedings of the 2024 IEEE PES Innovative Smart Grid Technologies Europe (ISGT EUROPE), Dubrovnik, Croatia, 14–17 October 2024; pp. 1–5. [Google Scholar] [CrossRef]
- Xu, L.; Xin, H.; Huang, L.; Yuan, H.; Ju, P.; Wu, D. Symmetric Admittance Modeling for Stability Analysis of Grid-Connected Converters. IEEE Trans. Energy Convers. 2020, 35, 434–444. [Google Scholar] [CrossRef]
- Lin, G.; Liu, J.; Rehtanz, C.; Li, Y.; Wang, P.; Zuo, W. A Comprehensive Stability Assessment System for EV DC Charging Station Based on Multitimescale Impedance Model. IEEE Trans. Transp. Electrif. 2024, 10, 938–961. [Google Scholar] [CrossRef]
- Cao, W.; Ma, Y.; Wang, F. Sequence-Impedance-Based Harmonic Stability Analysis and Controller Parameter Design of Three-Phase Inverter-Based Multibus AC Power Systems. IEEE Trans. Power Electron. 2017, 32, 7674–7693. [Google Scholar] [CrossRef]
- Grdenic, G.; Garcia, F.J.C.; Campos, N.D.M.D.; Villella, F.; Beerten, J. Model Order Reduction of Voltage Source Converters Based on the Ac Side Admittance Assessment: From EMT to RMS. IEEE Trans. Power Deliv. 2023, 38, 56–67. [Google Scholar] [CrossRef]
- Nikolakakos, I.P.; Zeineldin, H.H.; El-Moursi, M.S.; Kirtley, J.L. Reduced-Order model for Inter-Inverter oscillations in islanded Droop-Controlled microgrids. IEEE Trans. Smart Grid 2018, 9, 4953–4963. [Google Scholar] [CrossRef]
- Vorobev, P.; Huang, P.H.; Hosani, M.A.; Kirtley, J.L.; Turitsyn, K. High-fidelity model order reduction for microgrids stability assessment. IEEE Trans. Power Syst. 2018, 33, 874–887. [Google Scholar] [CrossRef]
- Yu, H.; Su, J.; Wang, H.; Wang, Y.; Shi, Y. Modelling method and applicability analysis of a reduced-order inverter model for microgrid applications. IET Power Electron. 2020, 13, 2481–2491. [Google Scholar] [CrossRef]
- Gu, Y.; Bottrell, N.; Green, T.C. Reduced-Order Models for Representing Converters in Power System Studies. IEEE Trans. Power Electron. 2018, 33, 3644–3654. [Google Scholar] [CrossRef]
- Manrique MacHado, S.D.J.M.; da Silva, S.A.O.; Monteiro, J.R.B.D.A.; de Oliveira, A.A. Network Modeling Influence on Small-Signal Reduced-Order Models of Inverter-Based AC Microgrids Considering Virtual Impedance. IEEE Trans. Smart Grid 2021, 12, 79–92. [Google Scholar] [CrossRef]
- Taul, M.G.; Wang, X.; Davari, P.; Blaabjerg, F. Influence of phase-locked loop aggregation on the dynamic aggregation of wind farm strings with heterogeneous parameters. IET Energy Syst. Integr. 2021, 3, 99–108. [Google Scholar] [CrossRef]
- Zou, Z.; Xu, R.; Tang, J.; Chen, W.; Wang, Z. Reduced-Order Symbolic Admittance Model and Stability Analysis of Grid-Connected Converters. IEEE Trans. Power Deliv. 2024, 39, 1271–1282. [Google Scholar] [CrossRef]
- Taul, M.G.; Wang, X.; Davari, P.; Blaabjerg, F. Reduced-order and aggregated modeling of large-signal synchronization stability for multiconverter systems. IEEE J. Emerg. Sel. Top. Power Electron 2021, 9, 3150–3165. [Google Scholar] [CrossRef]
- Safavizadeh, A.; Vahabzadeh, T.; Ebrahimi, S.; Jatskevich, J. Admittance-Based Aggregated Modeling of ConverterInterfaced Resources with Heterogeneous Parameters for Transient Analysis of Multi-Converter Systems. IEEE J. Emerg. Sel. Top. Ind. Electron. 2024, 6, 295–307. [Google Scholar] [CrossRef]
- Niemann, J.H.; Klus, S.; Schutte, C. Data-driven model reduction of agent-based systems using the Koopman generator. PLoS ONE 2021, 16, 7718. [Google Scholar] [CrossRef]
- Gebremedhin, T.; Chen, Y.; Xu, L.; Chen, D. Interactions and stability analysis of grid-forming and grid-following converters in close proximity: An impedance-based approach. In Proceedings of the IET Conference Proceedings CP902, Stevenage, UK, 3–6 December 2024; Volume 2024, pp. 263–269. [Google Scholar] [CrossRef]
- Chen, Y. Small Signal Impedance Modelling and Stability Assessment of HVDC Systems. Doctoral Thesis, University of Strathclyde, Glasgow, UK, 2020. [Google Scholar] [CrossRef]
- Rong, Q.; Hu, P.; Wang, L.; Li, Y.; Yu, Y.; Wang, D.; Cao, Y. Asymmetric Sampling Disturbance-Based Universal Impedance Measurement Method for Converters. IEEE Trans. Power Electron. 2024, 39, 15457–15461. [Google Scholar] [CrossRef]
- Smyth Gordon, K. Numerical integration. In Encyclopedia of Biostatistics; John Wiley & Sons: Hoboken, NJ, USA, 1998; pp. 3088–3095. [Google Scholar]
- Pena-Alzola, R.; Liserre, M.; Blaabjerg, F.; Sebastian, R.; Dannehl, J.; Fuchs, F.W. Systematic design of the lead-lag network method for active damping in lcl-filter based three phase converterss. IEEE Trans. Ind. Inform. 2014, 10, 43–52. [Google Scholar] [CrossRef]
- Aurela, A.W. The Charge Excess and Momentum Spectrum of Cosmic Ray Muons in the Vertical Direction. Doctoral Dissertation, Durham University, Durham, UK, 1965. Available online: http://etheses.dur.ac.uk/10511/ (accessed on 16 August 2025).
- Chen, S.; Wang, Y.; Tian, Z.; Xiao, X.; Xie, X.; Gomis-Bellmunt, O. Understanding a Type of Forced Oscillation in Grid-Forming and Grid-Following Inverter Connected Systems. IEEE Trans. Power Electron. 2025, 40, 11628–11640. [Google Scholar] [CrossRef]
Disclaimer/Publisher’s Note: The statements, opinions and data contained in all publications are solely those of the individual author(s) and contributor(s) and not of MDPI and/or the editor(s). MDPI and/or the editor(s) disclaim responsibility for any injury to people or property resulting from any ideas, methods, instructions or products referred to in the content. |
© 2025 by the author. Licensee MDPI, Basel, Switzerland. This article is an open access article distributed under the terms and conditions of the Creative Commons Attribution (CC BY) license (https://creativecommons.org/licenses/by/4.0/).