Article

SN-YOLO: A Rotation Detection Method for Tomato Harvest in Greenhouses

1
School of Computer Science and Information Security, Guilin University of Electronic Technology, Guilin 541004, China
2
Research Center for Brain-Inspired Intelligence (BII), Institute of Automation, Chinese Academy of Sciences (CASIA), Beijing 100190, China
3
Guilin Ruiwei Saide Technology Co., Ltd., Guilin 541004, China
*
Author to whom correspondence should be addressed.
These authors contributed equally to this work.
Electronics 2025, 14(16), 3243; https://doi.org/10.3390/electronics14163243
Submission received: 8 July 2025 / Revised: 9 August 2025 / Accepted: 13 August 2025 / Published: 15 August 2025

Abstract

Accurate detection of tomato fruits is a critical component in vision-guided robotic harvesting systems, which play an increasingly important role in automated agriculture. However, this task is challenged by variable lighting conditions and background clutter in natural environments. In addition, the arbitrary orientations of fruits reduce the effectiveness of traditional horizontal bounding boxes. To address these challenges, we propose a novel object detection framework named SN-YOLO. First, we introduce the StarNet’ backbone to enhance the extraction of fine-grained features, thereby improving the detection performance in cluttered backgrounds. Second, we design a Color-Prior Spatial-Channel Attention (CPSCA) module that incorporates red-channel priors to strengthen the model’s focus on salient fruit regions. Third, we implement a multi-level attention fusion strategy to promote effective feature integration across different layers, enhancing background suppression and object discrimination. Furthermore, oriented bounding boxes improve localization precision by better aligning with the actual fruit shapes and poses. Experiments conducted on a custom tomato dataset demonstrate that SN-YOLO outperforms the baseline YOLOv8 OBB, achieving a 1.0% improvement in precision and a 0.8% increase in mAP@0.5. These results confirm the robustness and accuracy of the proposed method under complex field conditions. Overall, SN-YOLO provides a practical and efficient solution for fruit detection in automated harvesting systems, contributing to the deployment of computer vision techniques in smart agriculture.

1. Introduction

Tomatoes, consumed raw and cooked, rank among the most widely favored foods worldwide. With the continuous expansion of cultivation areas, tomato production has shown a steady upward trajectory. However, as a crop characterized by a short growth cycle, large-scale tomato farming frequently faces the challenge of timely harvesting. Delays in harvesting can lead to overripening or fruit decay, ultimately causing substantial yield losses. Traditional harvesting practices remain highly dependent on manual labor, necessitating large workforces while being labor-intensive and inefficient. As such, these methods are increasingly ill-suited for the demands of modern large-scale agricultural operations [1,2,3,4]. With the rapid advancement of smart agriculture technologies, object detection has emerged as a critical component in fruit recognition systems. At its core, it focuses on accurately identifying and localizing fruits through computer vision algorithms. By integrating object detection with robotic systems, it becomes feasible to develop fully automated fruit detection and harvesting platforms driven by computer vision. Such integration can substantially enhance agricultural productivity, reduce reliance on manual labor, and accelerate the modernization and intelligent transformation of agricultural practices [5].
The application of robotic technology to fruit and vegetable harvesting was first introduced by American researchers Schertz and Brown in the 1960s, marking the beginning of a research trajectory that has evolved through three distinct stages [6]. In the first stage, traditional algorithms based on hand-crafted characteristics, such as color, shape, and texture, were used for fruit detection. While these methods demonstrated reasonable performance in controlled or simplified environments, their generalization ability was limited [7,8]. In the second stage, machine learning-based approaches emerged, combining manually extracted features with automatically learned ones. These methods offered improvements in both detection speed and accuracy yet still struggled in complex natural environments characterized by variable lighting, occlusion, and background clutter [9]. In the third stage, deep learning-based object detection techniques emerged, integrating feature extraction, selection, and classification into a unified model. These approaches significantly reduced the reliance on manual feature engineering and led to notable advancements in fruit recognition tasks [10,11]. Despite these developments, deep learning-based fruit detection continues to face challenges in real-world applications. Environmental factors such as illumination changes, occlusion from foliage, and overlapping fruits can adversely affect detection accuracy. Moreover, the use of horizontal bounding boxes (HBBs) often results in excessive inclusion of irrelevant background when applied to tilted, densely packed, or elongated objects, leading to imprecise localization. This, in turn, undermines the performance of robotic grasping and pose estimation during harvesting operations [12].
In greenhouse environments, tomato fruits often grow in clusters with irregular poses, resulting in dense and overlapping instances with diverse orientations. Conventional HBBs tend to include excessive background and fail to align with tilted tomatoes, leading to inaccurate localization.
To address the aforementioned challenges, we adopt oriented bounding boxes (OBBs), which better align with the geometry of fruits and capture their orientations [13,14,15]. This design enables a more accurate and compact localization, particularly in cluttered scenes with varied illumination, occlusion, and dense arrangements. Building upon this insight, this article proposes SN-YOLO, a novel object detection framework adapted for precise localization of tomato fruits in complex greenhouse environments. The model integrates architectural improvements into both the backbone and neck of YOLOv8 OBB, incorporating orientation-sensitive detection and color-guided attention to enhance feature discrimination. The key contributions of this work are summarized as follows:
(1)
We redesign the StarNet backbone as StarNet’ to improve feature representation under complex backgrounds. StarNet’ enhances robustness through dual-branch expansion, weighted fusion, and DropPath regularization.
(2)
We develop a Color-Prior Spatial-Channel Attention (CPSCA) module. By introducing red-channel priors, CPSCA improves robustness against color interference and lighting variation.
(3)
We design a multi-level attention fusion strategy. CPSCA is embedded at shallow and deep layers to suppress background noise and enhance semantic consistency.
(4)
We introduce OBBs into the detection framework. OBBs improve localization accuracy under arbitrary tomato orientations and dense greenhouse layouts.
The remainder of this paper is organized as follows: Section 2 introduces the research progress in tomato detection and compares the advantages and disadvantages of different detection methods; Section 3 describes the proposed SN-YOLO network in detail, including its backbone, attention module, and multi-level fusion strategy; Section 4 introduces the dataset used, the evaluation indicators of the experiment, and shows the experimental results, followed by verification and analysis; Section 5 discusses the limitations of this study and future research directions; Section 6 concludes this study.

2. Related Work

This section reviews existing studies on object detection networks, attention mechanisms, and oriented object detection methods relevant to our research. Early fruit recognition algorithms primarily achieved object detection and classification through the extraction of handcrafted features such as color, shape, and texture. Whittaker et al. [16] used an improved D-Hough transform for shape-based detection, which showed robustness to partial occlusion. Zheng et al. [17] applied color thresholding to segment ripe tomatoes but performance degraded under varying illumination. Xiang et al. [18] introduced a contour-based curvature sorting method combined with circular regression to improve recognition of overlapping fruits. Feng et al. [19] proposed a color difference model to extract red features and segment overlapped tomatoes, though real-time applicability was hindered by a high computational cost. Ma et al. [20] integrated saliency detection with the Hough transform for immature fruit localization yet struggled under occlusion and lighting variation. Liu et al. [21] utilized depth images and morphological features to improve detection in visually complex environments, demonstrating enhanced robustness to lighting and background interference.
Machine learning-based object recognition algorithms extend traditional methods by incorporating automatic feature learning, enabling improved adaptability to moderately complex environments. Chen et al. [22] segmented the region of interest (ROI) of ripe tomatoes in the YUV color space and used a constrained curvature edge detector to perform geometric analysis for depth ordering of overlapping tomatoes, thereby enabling effective recognition of occluded ripe tomatoes. However, the recognition effect of this method was unstable and easily affected by image quality. Zhao et al. [23] used Haar-like features combined with the AdaBoost algorithm to recognize tomatoes in unstructured environments. This method showed strong adaptability to lighting variations and occlusions. Li et al. [24] applied a fast normalized cross-correlation function along with a Bayesian classifier to detect green tomatoes under varying lighting conditions and occlusion from stems and leaves. However, Bayesian networks under certain conditions could result in high computational overhead. Moallem et al. [25] used a multilayer perceptron (MLP) to detect and segment defects by identifying background, stem, and calyx regions, subsequently removing the stem and calyx. Statistical, textural, and geometric features were extracted from the optimized defect regions and classified for apple grading, with support vector machines (SVMs) showing the best performance.
Deep learning-based object detection algorithms adopt an end-to-end learning approach, reducing reliance on manual feature extractors. This not only enhances the model’s generalization capability but also enables high-precision detection in more complex environments. Yue et al. [26] improved Cascade R-CNN with Soft-NMS and customized anchor boxes, achieving better performance in overlapping scenarios. Zhao et al. [27] proposed a lightweight Transformer-based model using EfficientViT and adaptive fusion modules, improving mAP by 1.24% over the baseline. Another work by Zhao et al. [28] enhanced YOLOv5s by integrating MobileNetV3, the Ghost module, CBAM attention, and SIoU loss, reaching 94.4% detection accuracy. Miao et al. [29] introduced an improved YOLOv7 with MobileNetV3 and a global attention mechanism (GAM) to address occlusion, resulting in a slight mAP gain over standard YOLOv7 and a significant improvement over Faster R-CNN.
Table 1 summarizes the advantages and disadvantages of the above methods. Although the incorporation of attention mechanisms and lightweight network designs has notably improved both detection accuracy and computational efficiency as research has progressed, existing approaches still face limitations, including elevated false positive rates and inadequate robustness under conditions of complex backgrounds, occlusions, and interference from similarly colored objects. Furthermore, most current models lack effective modeling of color features specific to fruit targets, hindering their ability to fully exploit color information for precise regional attention and discrimination. To this end, this paper proposes a new SN-YOLO model that integrates the optimized StarNet [30] backbone structure, CPSCA, and a multi-level attention fusion strategy to improve the accuracy and stability of tomato fruit detection in complex environments.

3. Methods

This section presents the architecture of the proposed SN-YOLO network, including its backbone design, the Color-Prior Spatial-Channel Attention module, and the multi-level attention fusion strategy.

3.1. SN-YOLO Network Structure

The SN-YOLO proposed in this study is an improved network based on the YOLOv8 OBB architecture. The backbone is replaced with a customized network, StarNet’, for overcoming the limitations of the original YOLOv8 OBB backbone, such as limited receptive field and suboptimal feature interaction. The overall inference process of SN-YOLO is summarized in Algorithm 1, covering the backbone feature extraction, attention-based enhancement, and final detection via rotated bounding boxes.
The overall structure is shown in Figure 1, which consists of three parts: backbone, neck, and head. CPSCA (purple) is embedded in the backbone (red) to introduce color perception to reduce the interference of background redundant features on subsequent feature fusion, extract multi-scale feature maps, and pass them to the neck network. In the neck, CPSCA (purple) is applied to the P4 feature map to improve semantic alignment and color perception. Finally, the detection layer outputs the prediction of the tomato.
Algorithm 1: Feature Extraction and Fusion Pipeline of SN-YOLO
Input: Input image x
Output: Feature maps [ P 3 , P 4 , P 5 ]
x Stem ( x )                 // Initial feature extraction
[ P 1 , P 2 , P 3 , P 4 ] StarNet’              // Backbone feature maps
P 4 CPSCA ( P 4 )                   // Attention enhancement
P 5 SPPF ( P 4 )                    // Deep semantic feature
P 4 Upsample ( P 5 ) + Concat ( P 4 ) → C2f         // Top-down fusion
P 3 Upsample ( P 4 ) + Concat ( P 3 ) → C2f         // Top-down fusion
P 4 Downsample ( P 3 ) + Concat ( P 4 ) → C2f + CPSCA     // Bottom-up fusion
P 5 Downsample ( P 4 ) + Concat ( P 5 ) → C2f       // Bottom-up fusion
return OBB_Detector ( [ P 3 , P 4 , P 5 ] )          // Rotated object detection

3.2. Backbone Network: StarNet’

In the original YOLOv8 framework, the backbone was designed using the C2f-based architecture to balance detection performance and inference speed. However, in complex agricultural environments characterized by dense foliage, overlapping instances, and varying lighting conditions, we observed that the original backbone exhibited limited capacity in capturing discriminative features, leading to missed detections and reduced accuracy. To address this limitation, this study explored alternative backbone designs with stronger feature extraction capabilities and better spatial sensitivity. We designed StarNet’, which integrates targeted enhancements to better handle the geometric complexity and scale variation of tomato fruits in real-world scenarios. In particular, StarNet’ is optimized for robust performance in cluttered backgrounds and across a wide range of object sizes, both of which are commonly encountered in natural growing environments.

3.2.1. Overall Architecture

In the overall architectural design, the StarNet’ backbone is organized into multiple sequential stages, each consisting of several fundamental computational units (Blocks). This hierarchical design allows the network to progressively extract features from shallow to deep levels, capturing both local and global patterns that are critical for identifying small and irregular objects like tomato fruits. Within each stage, the spatial resolution of the feature maps is gradually reduced, while the number of channels is increased through a combination of standard and depthwise convolutions. This progression enhances the network’s ability to represent abstract semantics across varying scales. These capabilities allow the model to better adapt to objects with significant size variation, thereby improving detection robustness in natural agricultural environments.
Regarding module composition, ConvBN serves as the fundamental building block within each stage, integrating a convolutional layer with batch normalization. This module is responsible for initial spatial feature extraction and resolution modulation, configured through appropriate kernel sizes, strides, and padding. ConvBN is utilized not only for downsampling the feature maps but also for ensuring consistent feature representation across channels. This helps suppress irrelevant background noise while enhancing key feature channels, making the network more robust to background clutter such as leaves and branches.
As the core feature extraction unit within the backbone, each block module in StarNet’ is designed to improve the model’s capacity to represent diverse object appearances under complex conditions. Unlike the original StarNet, which uses sequential depthwise and pointwise convolutions, StarNet’ introduces a dual-branch channel expansion structure with learnable weighted fusion. This design enables more refined feature representation across multiple levels of abstraction. The network structure is shown in Figure 2.
Specifically, the input feature map is first processed by a depthwise convolution, which captures essential spatial information with minimal computational cost. The output is then split into two parallel branches, each performing a pointwise convolution (1 × 1) to expand the channel dimension. These two branches are subsequently merged using a learnable weighted-fusion mechanism, which dynamically balances contributions from different feature paths. This fused feature map then passes through batch normalization and a nonlinear activation function (SiLU) to enhance the network’s representational capacity. Following activation, a pointwise convolution is applied to compress the channel dimension to its original size, allowing the network to retain essential information while controlling model complexity. To ensure stable training in deeper networks, the module integrates DropPath regularization and residual connections, which together facilitate efficient gradient flow and improve generalization. This architecture enables each block to extract abstract semantic features while preserving local details, thereby enhancing the backbone’s robustness to scale variation, background complexity, and occlusion.
In summary, the StarNet’ backbone incrementally extracts rich spatial and semantic features through the coordinated design of stages and blocks. Each stage constructs multi-scale feature representations via downsampling and channel expansion, while each block facilitates effective integration of local and global information. As a result, the network produces high-quality feature maps that support accurate object detection, particularly in complex environments with occlusions, cluttered backgrounds, and illumination variations.

3.2.2. Comparison with Original StarNet

In contrast to the original StarNet architecture, which utilizes a relatively simple arrangement of depthwise separable convolutions and standard residual connections, the proposed StarNet’ introduces several key enhancements to better accommodate complex backgrounds, object scale variation, and occlusions encountered in real-world agricultural environments. The key architectural differences between the original StarNet and the proposed StarNet’ are summarized in Table 2. A detailed explanation of each improvement is provided in the following paragraphs.
First, StarNet’ integrates a dual-branch expansion structure within each block. Specifically, the intermediate features are split into two parallel branches, each performing 1 × 1 convolutions for channel expansion. This dual-path design improves the network’s ability to extract diverse semantic representations across multiple scales. The outputs of these two branches are then combined using a learnable weighted-fusion mechanism, which adaptively balances the contributions of each branch rather than applying simple addition or concatenation.
Second, DropPath regularization is introduced to improve generalization and prevent overfitting, particularly under limited training data conditions. Combined with enhanced residual connections, this allows the backbone to maintain stable information flow and gradient propagation even in deep network stages.
These structural improvements significantly enhance the expressiveness and robustness of the backbone, especially in dense detection tasks involving overlapping fruits, foliage occlusion, and varying illumination.

3.3. Attention Modules and Multi-Level Fusion

3.3.1. Color-Prior Spatial-Channel Attention (CPSCA) Module

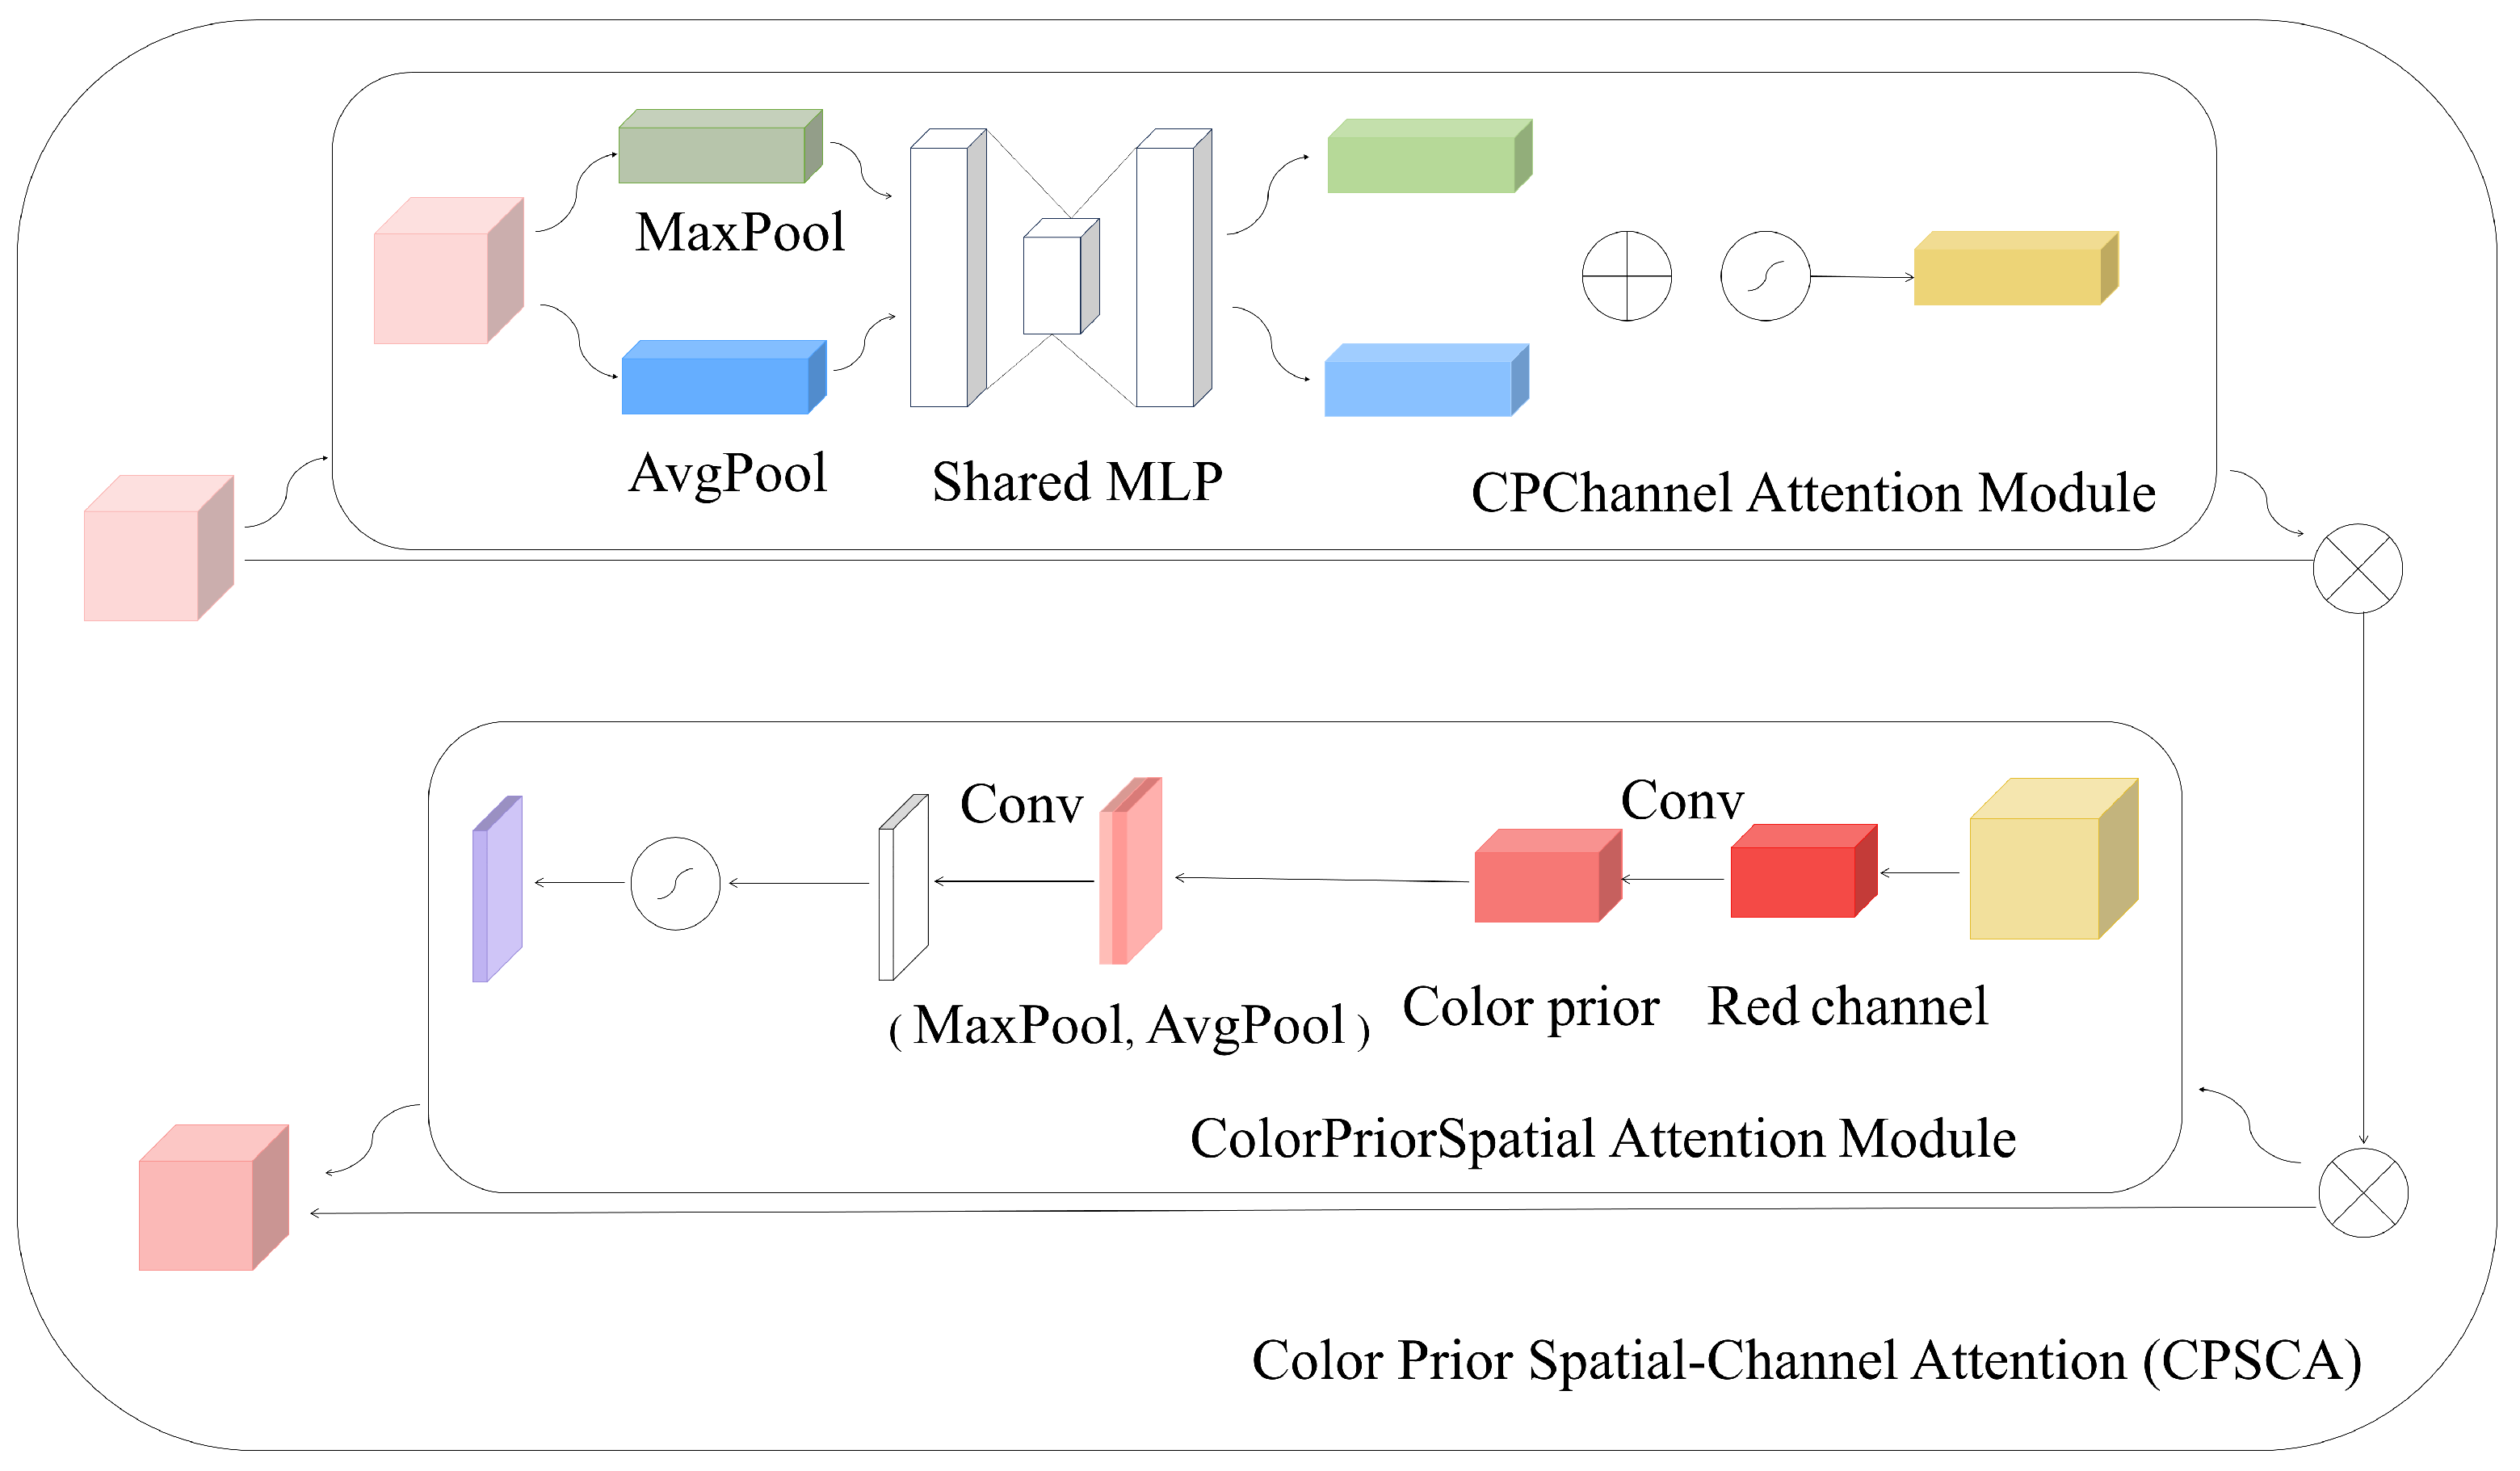
Although conventional channel and spatial attention mechanisms effectively enhance feature representation, color information remains a crucial cue in certain tasks, particularly in object detection scenarios where color serves as a primary discriminative attribute, such as tomato detection. Given that tomatoes typically exhibit a distinctive bright red coloration, this study proposes an attention module incorporating the CPSCA. This module integrates prior knowledge of the red channel within the spatial attention component, aiming to further strengthen the model’s capacity to accurately identify and focus on the target regions. The overall structure of the CPSCA module is shown in Figure 3.
In the CPSCA module, although the red channel prior is emphasized to improve detection of ripe tomatoes, the overall spatial-channel attention framework remains sensitive to various color features, including those related to green tomatoes. The channel attention branch generates weights for all feature channels through global average and max pooling, enhancing semantically important features beyond the red channel. Meanwhile, the spatial attention branch fuses the weighted red channel with spatially pooled features, balancing focus on color-salient regions and local spatial structures. This design ensures the module’s adaptability to tomatoes exhibiting diverse coloration, thus improving robustness in complex lighting and occlusion scenarios.
The module integrates both channel and spatial attention mechanisms through two dedicated branches. Within the channel attention branch, global average pooling and global max pooling are first applied independently to the input feature map to generate statistical descriptors. These descriptors are then fused via a shared MLP network to produce attention weights along the channel dimension. The resulting weights are subsequently applied to the original feature map through channel-wise multiplication, thereby enhancing channels with strong semantic relevance while suppressing invalid or redundant information.
In the spatial attention branch, the CPSCA module incorporates prior color information, with a particular emphasis on the red channel during the attention map generation. Specifically, the red channel undergoes a weighted operation and is combined with the fused outputs of average and max pooling to jointly contribute to the spatial attention map. This approach effectively enhances the model’s sensitivity to color-salient regions. Simultaneously, the spatial branch preserves responsiveness to local spatial structures, thereby improving target area perception and increasing localization accuracy during the detection process.
(1)
Calculation process of channel attention stage
o u t p u t c h a n n e l = x · C P C h a n n e l A t t e n t i o n ( x ) ,
In Equation (1), x is the input feature map, the dimension is [B, C, H, W]; C P C h a n n e l A t t e n t i o n ( x ) is the channel attention weight generated by the channel attention module.
o u t p u t = a v g o u t + m a x o u t ,
o u t p u t = σ ( o u t ) ,
The weighted-fusion part is the core step of the channel attention mechanism, which reflects how the channel information is weighted. The specific performance of the model is closely related to the weighting strategy. The activation function operation limits the output to [0, 1], which determines the weighted strength of each channel.
(2)
Colorprior spatial attention calculation
The color-prior spatial attention combines color information (red channel) to enhance the model’s attention to the target area. The total calculation formula is as follows:
o u t p u t C P S A = x · C o l o r P r i o r S p a t i a l A t t e n t i o n ( x ) ,
In Equation (4), x is the input feature map; C o l o r P r i o r S p a t i a l A t t e n t i o n ( x ) is the spatial attention weight generated by the color-prior spatial attention module.
Color-prior convolution:
c o l o r _ p r i o r = c o l o r _ c o n v ( r e d _ c h a n n e l ) ,
Spatial information calculation:
a v g _ o u t = 1 H · W i = 1 H j = 1 W x i , j ,
m a x _ o u t = max i , j ( x i , j ) ,
In Equations (6) and (7), i and j denote the spatial coordinate indices, corresponding to the row and column positions of the feature map, respectively. The index ranges are i = 1 , , H and j = 1 , , W .
The concatenation of color prior and spatial information is as follows:
x c a t = [ a v g _ o u t , m a x _ o u t , c o l o r _ p r i o r ] ,
(3)
The CPSCA module combines channel attention and spatial color-prior attention
o u t p u t C P S S A = x C P C h a n n e l A t t e n t i o n ( x ) · C o l o r P r i o r S p a t i a l A t t e n t i o n ( x ) ,
The CPSCA module effectively enhances the network’s ability to perceive critical color features by integrating prior knowledge of color distribution with a spatial-channel attention mechanism, thereby addressing the limitations of conventional attention mechanisms in modeling color information. Concurrently, the module preserves the spatial attention’s sensitivity to local regions, ensuring precise localization while strengthening color feature representation. With its streamlined architecture and manageable computational overhead, the CPSCA module can be seamlessly incorporated into existing detection frameworks. It substantially improves feature representation and detection performance without imposing significant increases in model complexity.

3.3.2. Low-Level Feature Filtering Based on Color-Prior Attention

The CPSCA module is embedded in the backbone before the SPFF module. Its main function is to introduce color perception before the low-level features are fused, so as to filter them in the early stage. Structurally, the input is a low-level feature map F l o w of size B × C × H × W . CPSCA first compresses and reconstructs the global average pooling and maximum pooling results through the CPChannelAttention submodule, obtains the weighted response M c R B × C × 1 × 1 of the channel dimension, and enhances the original feature map channel by channel. Subsequently, the ColorPriorSpatialAttention submodule extracts the color prior from the red channel R R B × 1 × H × W , transforms it through a 1 × 1 convolution, and as a component of the spatial attention branch, fuses it with the spatial map based on avg and max, generates a spatial attention map M s R B × 1 × H × W through a 7 × 7 convolution, and weights the previously enhanced features pixel by pixel.
F l o w = F l o w · M C · M S ,
The incorporation of this module facilitates the preliminary filtering of color-salient regions prior to the SPFF fusion process, effectively mitigating the impact of redundant background features on subsequent feature integration. The CPSCA module significantly enhances the network’s ability to detect color-sensitive targets with improved precision. As a lightweight component, its integration imposes minimal overhead on model parameters and inference speed. Nonetheless, it significantly improves the discriminative power and robustness of low-level feature representations.

3.3.3. Cross-Scale Attention-Driven High-Level Semantic Alignment

The CPSCA module is embedded into the feature map of the middle layer P4 of the detection neck to enhance the color sensitivity and regional expression ability of the key middle layer feature. Since P4 is in the middle of the multi-scale feature fusion, it not only inherits the detailed features of the low layer but also connects the semantic information of the high layer. Therefore, enhancing the P4 layer can improve the overall detection effect. The input feature map P4 R B × C × H × W is first input to the CPSCA module and then goes through the two stages of channel attention and color-prior spatial attention to obtain the enhanced output P4’, which is expressed as follows:
F f u s e d = C P S C A ( F h i g h ) + U p s a m p l e ( C P S C A ( F l o w ) ) ,
This design selectively enhances only the P4 feature map, aiming firstly to minimize the introduction of redundant computations, and secondly to specifically augment the semantic alignment and color sensitivity of mid-level features. Given that P4 typically serves to localize medium-sized objects within the YOLO detection framework and acts as a critical information conduit, the quality of its feature representation directly influences the effectiveness of multi-scale feature fusion and ultimately impacts the performance of the detection head. The enhancement of the P4 layer not only benefits localized detection but also plays a central role in our proposed attention-guided multi-level fusion strategy, which is detailed in the next section.

3.3.4. Attention-Guided Multi-Level Fusion Strategy

To improve detection under complex backgrounds and scale variation, we propose an attention-guided multi-level fusion strategy. This design embeds the CPSCA module at selected positions to guide cross-scale feature alignment. Specifically, we first apply CPSCA immediately after the backbone to enhance high-level semantic features before they enter the SPPF module. Additionally, we enhance the intermediate feature map P4 in the neck, which bridges high-level semantics (P5) and low-level textures (P3), improving both upward and downward information propagation.
Instead of uniformly applying attention to all layers, we insert CPSCA at key fusion points to reduce redundancy and maintain real-time performance. Unlike standard YOLO fusion based on naive concatenation, our method introduces semantic priors and adaptively reweights spatial and channel-wise features. This improves the model’s sensitivity to small and overlapping tomatoes, particularly under varying lighting conditions.
Overall, the proposed strategy strengthens cross-scale consistency while maintaining a balance between accuracy and efficiency, enabling deployment in resource-constrained agricultural scenarios.
In summary, this section detailed the structure and components of the proposed SN-YOLO framework, including the StarNet’ backbone, the CPSCA module, and the integration strategy for multi-level attention. Additionally, the dataset construction, training configuration, and ablation study were presented to lay the foundation for performance evaluation. The subsequent section analyzes the experimental results and demonstrates the effectiveness of our method in challenging scenarios.

4. Results and Analysis

In this section, we evaluate the performance of SN-YOLO on the tomato dataset under various challenging conditions, including illumination variation, and complex backgrounds. The proposed method is compared with several state-of-the-art detection algorithms to highlight its advantages in precision, robustness, and adaptability. Quantitative and qualitative analyses are conducted to validate the effectiveness of each module and the overall detection framework.

4.1. Environmental Settings

All model training and evaluation experiments were performed on a single workstation running Windows 10 (64-bit), equipped with an NVIDIA GeForce RTX 4060 GPU (Nvidia Corporation, Santa Clara, CA, USA) and a 12th Gen Intel Core i5-12490F CPU (Intel Corporation, Santa Clara, CA, USA). The software environment included Python 3.8.20, PyTorch 1.13.0, and CUDA 12.8.
The model was trained for up to 300 epochs with a batch size of eight, using an input resolution of 640 × 640. This standard resolution, commonly adopted in lightweight object detection frameworks, ensured a balance between detection accuracy and computational efficiency. It provided sufficient detail for recognizing tomato fruits of varying sizes, including dense or overlapping instances. Future work may explore higher-resolution inputs to further improve detection performance, especially for small or partially occluded targets. The initial training parameters are detailed in Table 3. Except for the learning rate, which was adjusted to 0.002 based on empirical tuning, all training hyperparameters are aligned with the default configuration of the YOLOv8 OBB baseline. This slight increase in learning rate was found to accelerate convergence without compromising model stability or performance.

4.2. Experimental Dataset

4.2.1. Dataset Source

The experimental data used in this study were collected at the Cuihu Smart Agriculture Innovation Facility Tomato Research Site, Beijing, China (40° N, 116° E). Image acquisition was conducted from 24 December 2024, to 10 March 2025, utilizing an Intel RealSense D435i RGB-D camera (Intel Corporation, Santa Clara, CA, USA) under natural lighting conditions. The data collection environment represented a typical greenhouse cultivation scenario. Image annotation was performed using the roLabelImg tool, with annotations represented as oriented bounding boxes. The sole annotation category was “tomato”. Each annotation file was saved in txt format, containing the class label along with the coordinates of the four bounding-box corners.

4.2.2. Dataset Sample Description

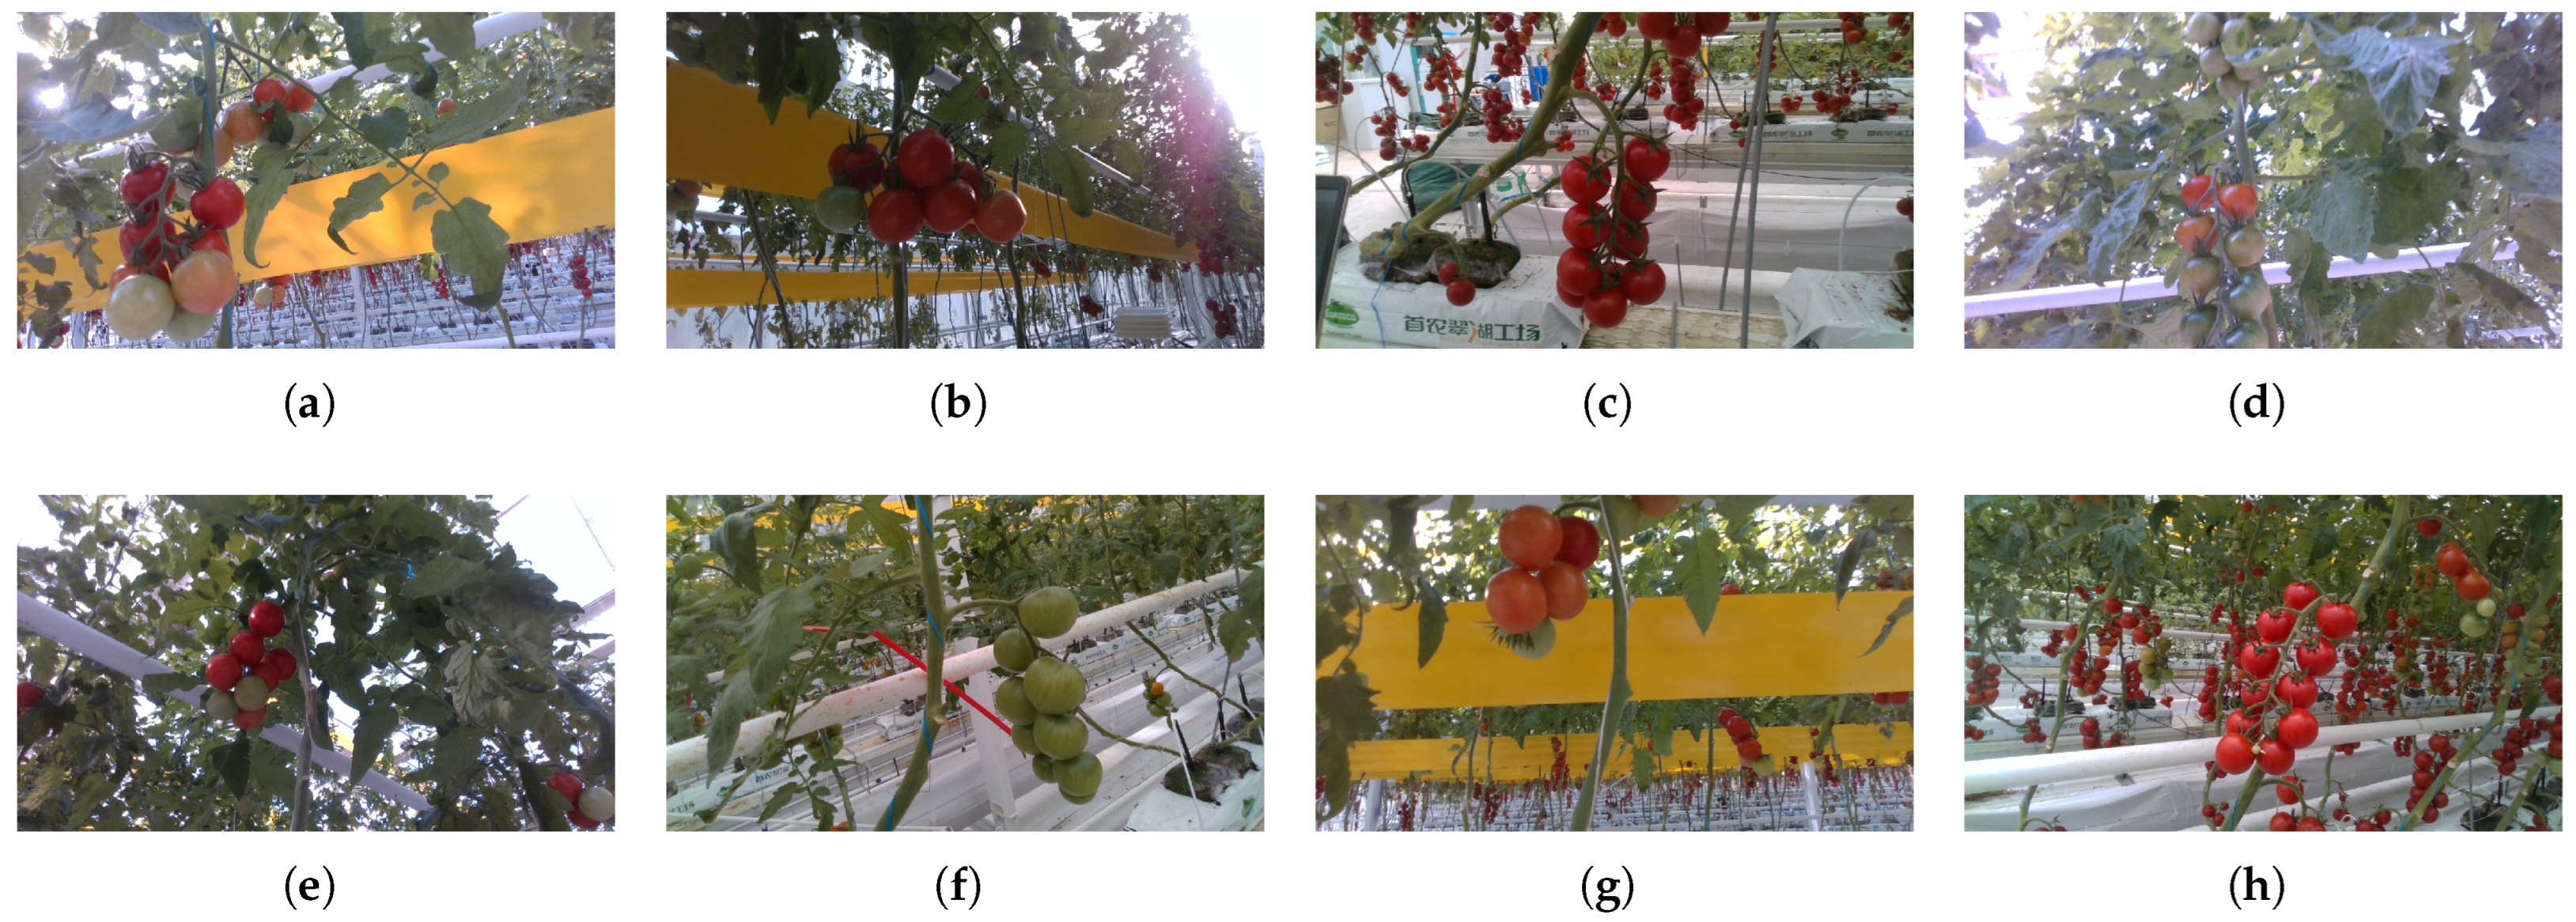
The dataset was collected in a research greenhouse and contained cherry tomato fruits with varying shapes and ripeness stages. The detection task focused on identifying tomatoes across different maturity levels and environmental conditions, without considering specific genetic or varietal distinctions. The collected images captured a range of challenging environmental conditions, such as variable lighting, time, background clutter and maturity conditions, providing a diverse set of scenarios to evaluate model robustness. Figure 4 presents sample tomato images collected in greenhouses under natural environmental conditions. All images had a resolution of 1280 × 720 and were saved in PNG format.

4.2.3. Dataset Splitting

A total of 1508 image samples, a total of approximately 2.3 GB of data, were obtained after pre-processing and filtering. The dataset was partitioned into training, validation, and test subsets in a ratio of 7:2:1 to facilitate model training and evaluation.

4.3. Model Evaluation Metrics

To comprehensively assess the performance of the proposed SN-YOLO model in tomato fruit detection, five widely adopted evaluation metrics were employed: precision, recall, mAP@0.5, mAP@0.5:0.95, F1-score, parameter, inference speed, and FLOPs.
Precision quantifies the proportion of correctly identified positive samples among all samples predicted as positive by the model, thereby reflecting the model’s accuracy in positive detections. A higher precision value indicates fewer false positives and stronger discriminative capability. It is calculated as Equation (12):
P r e c i s i o n = T P T P + F P ,
Recall measures the proportion of all actual positive samples that are correctly detected by the model, serving as an indicator of the model’s completeness in target detection. A higher recall value corresponds to fewer missed detections and enhanced detection coverage. It is calculated as Equation (13):
R e c a l l = T P T P + F N ,
The mean average precision (mAP) is a fundamental metric widely employed to evaluate the overall performance of object detection algorithms across multiple categories. It is calculated as the arithmetic mean of the average precision (AP) values corresponding to each individual class. It is calculated as Equation (14):
m A P = i = 1 n A P i n ,
where A P i denotes the average precision for the ith class, and n represents the total number of object categories considered in the evaluation.
mAP@0.5 represents the average precision calculated at an intersection over Union (IoU) threshold of 0.5, and is commonly used to evaluate the combined performance of detection box localization and classification accuracy. In contrast, mAP@0.5:0.95 calculates the average precision over multiple IoU thresholds ranging from 0.5 to 0.95 with increments of 0.05, providing a more comprehensive assessment of the model’s performance across varying degrees of localization strictness.
The F1-score, defined as the harmonic mean of precision and recall, serves to balance these two metrics. It attains a high value only when both precision and recall are high, making it a robust indicator of the model’s overall detection performance. It is calculated as Equation (15):
F 1 - s c o r e = 2 × P r e c i s i o n × R e c a l l P r e c i s i o n + R e c a l l ,
The parameter count serves as an important indicator reflecting the total number of trainable weights in a model, typically measured in millions (M). It represents the structural complexity of the network. A larger number of parameters generally enhances the model’s representation capacity but may also lead to higher computational costs and a greater risk of overfitting.
Inference speed refers to the time required for a model to perform a forward pass and generate output during the testing phase. It is commonly expressed in frames per second (FPS) or milliseconds per image. This metric plays a crucial role in assessing a model’s suitability for real-time applications.
FLOPs indicate the total number of floating-point operations required during a single forward pass of the network and serve as an important metric for assessing the computational cost of a model.

4.4. Training and Testing Results

Figure 5a shows the validation loss curves for SN-YOLO. The total loss of SN-YOLO comprises three components: “box_loss”, “cls_loss”, and “dfl_loss”. Specifically, “box_loss” represents the bounding-box regression loss, quantifying the localization error between the predicted and ground-truth boxes. “cls_loss” denotes the classification loss, which evaluates the model’s confidence in predicting the categories of objects. “dfl_loss” refers to the distribution focal loss, which models the regression of bounding-box coordinates as discrete probability distributions to enhance localization precision. As shown in the figure, all three validation loss components exhibited a sharp decline in the early stages of training, indicating that the model rapidly learned and adjusted its parameters. Between approximately epochs 50 and 100, the descent rate gradually decreased and eventually stabilized, suggesting that the validation losses converged to relatively low levels. This reflects the strong stability and generalizability of the model.
Figure 5b shows the precision–recall (P-R) curve of SN-YOLO, where the total mAP@0.5 reaches 87.9%. This result underscores the stable performance and high detection accuracy of the model, demonstrating its effectiveness in the precise location of objects for tomato detection tasks.
Figure 5c shows the confusion matrix, where the horizontal axis represents the ground-truth labels and the vertical axis denotes the predicted labels; the proposed method demonstrates a strong detection performance for the single class “tomato.” Specifically, among all actual tomato instances, 91.4% were correctly predicted as “tomato”, while only 8.6% were misclassified as background. For the background class, 89.3% were correctly identified as background, and 10.7% were mistakenly predicted as “tomato”. These results indicate that the model not only achieves high recall for tomato detection but also maintains good precision by minimizing false alarms on background regions.

4.5. Comparison Experiment of Different Color Priors

In addition, to verify the effectiveness of the CPSCA module, we designed a series of experiments, adding no color prior in spatial attention, adding green, blue, RGB average priors, and a red contrast color prior as the control group, respectively, as shown in Table 4. The green prior was used to verify whether it misled the detection, the blue prior was used to test whether non-fruit colors had a negative impact on the attention mechanism, and the RGB average prior only affected the overall brightness.
From the experimental data, the red prior performed significantly better than both the green and blue priors in terms of precision, with improvements of 0.7% and 0.9%. This demonstrates that emphasizing the red channel effectively leverages the distinctive color characteristics of ripe tomatoes, which were the dominant targets in our dataset. In contrast, the green prior resulted in relatively lower precision, which may be attributed to the higher variability in the appearance and coloration of unripe tomatoes, as well as the often closer color similarity of unripe tomatoes to surrounding foliage and background. These factors make it more challenging for a single green channel prior to effectively highlight relevant features for detection. The blue prior performed the worst among the three, which was expected since blue is not a characteristic color of tomatoes and thus provides limited useful information for detection. Although there is almost no difference between “RGB mean prior” and “no prior” in terms of mAP@0.5, it shows that the original spatial-channel attention mechanism has good robustness to a certain extent.

4.6. Comparison of Different Models

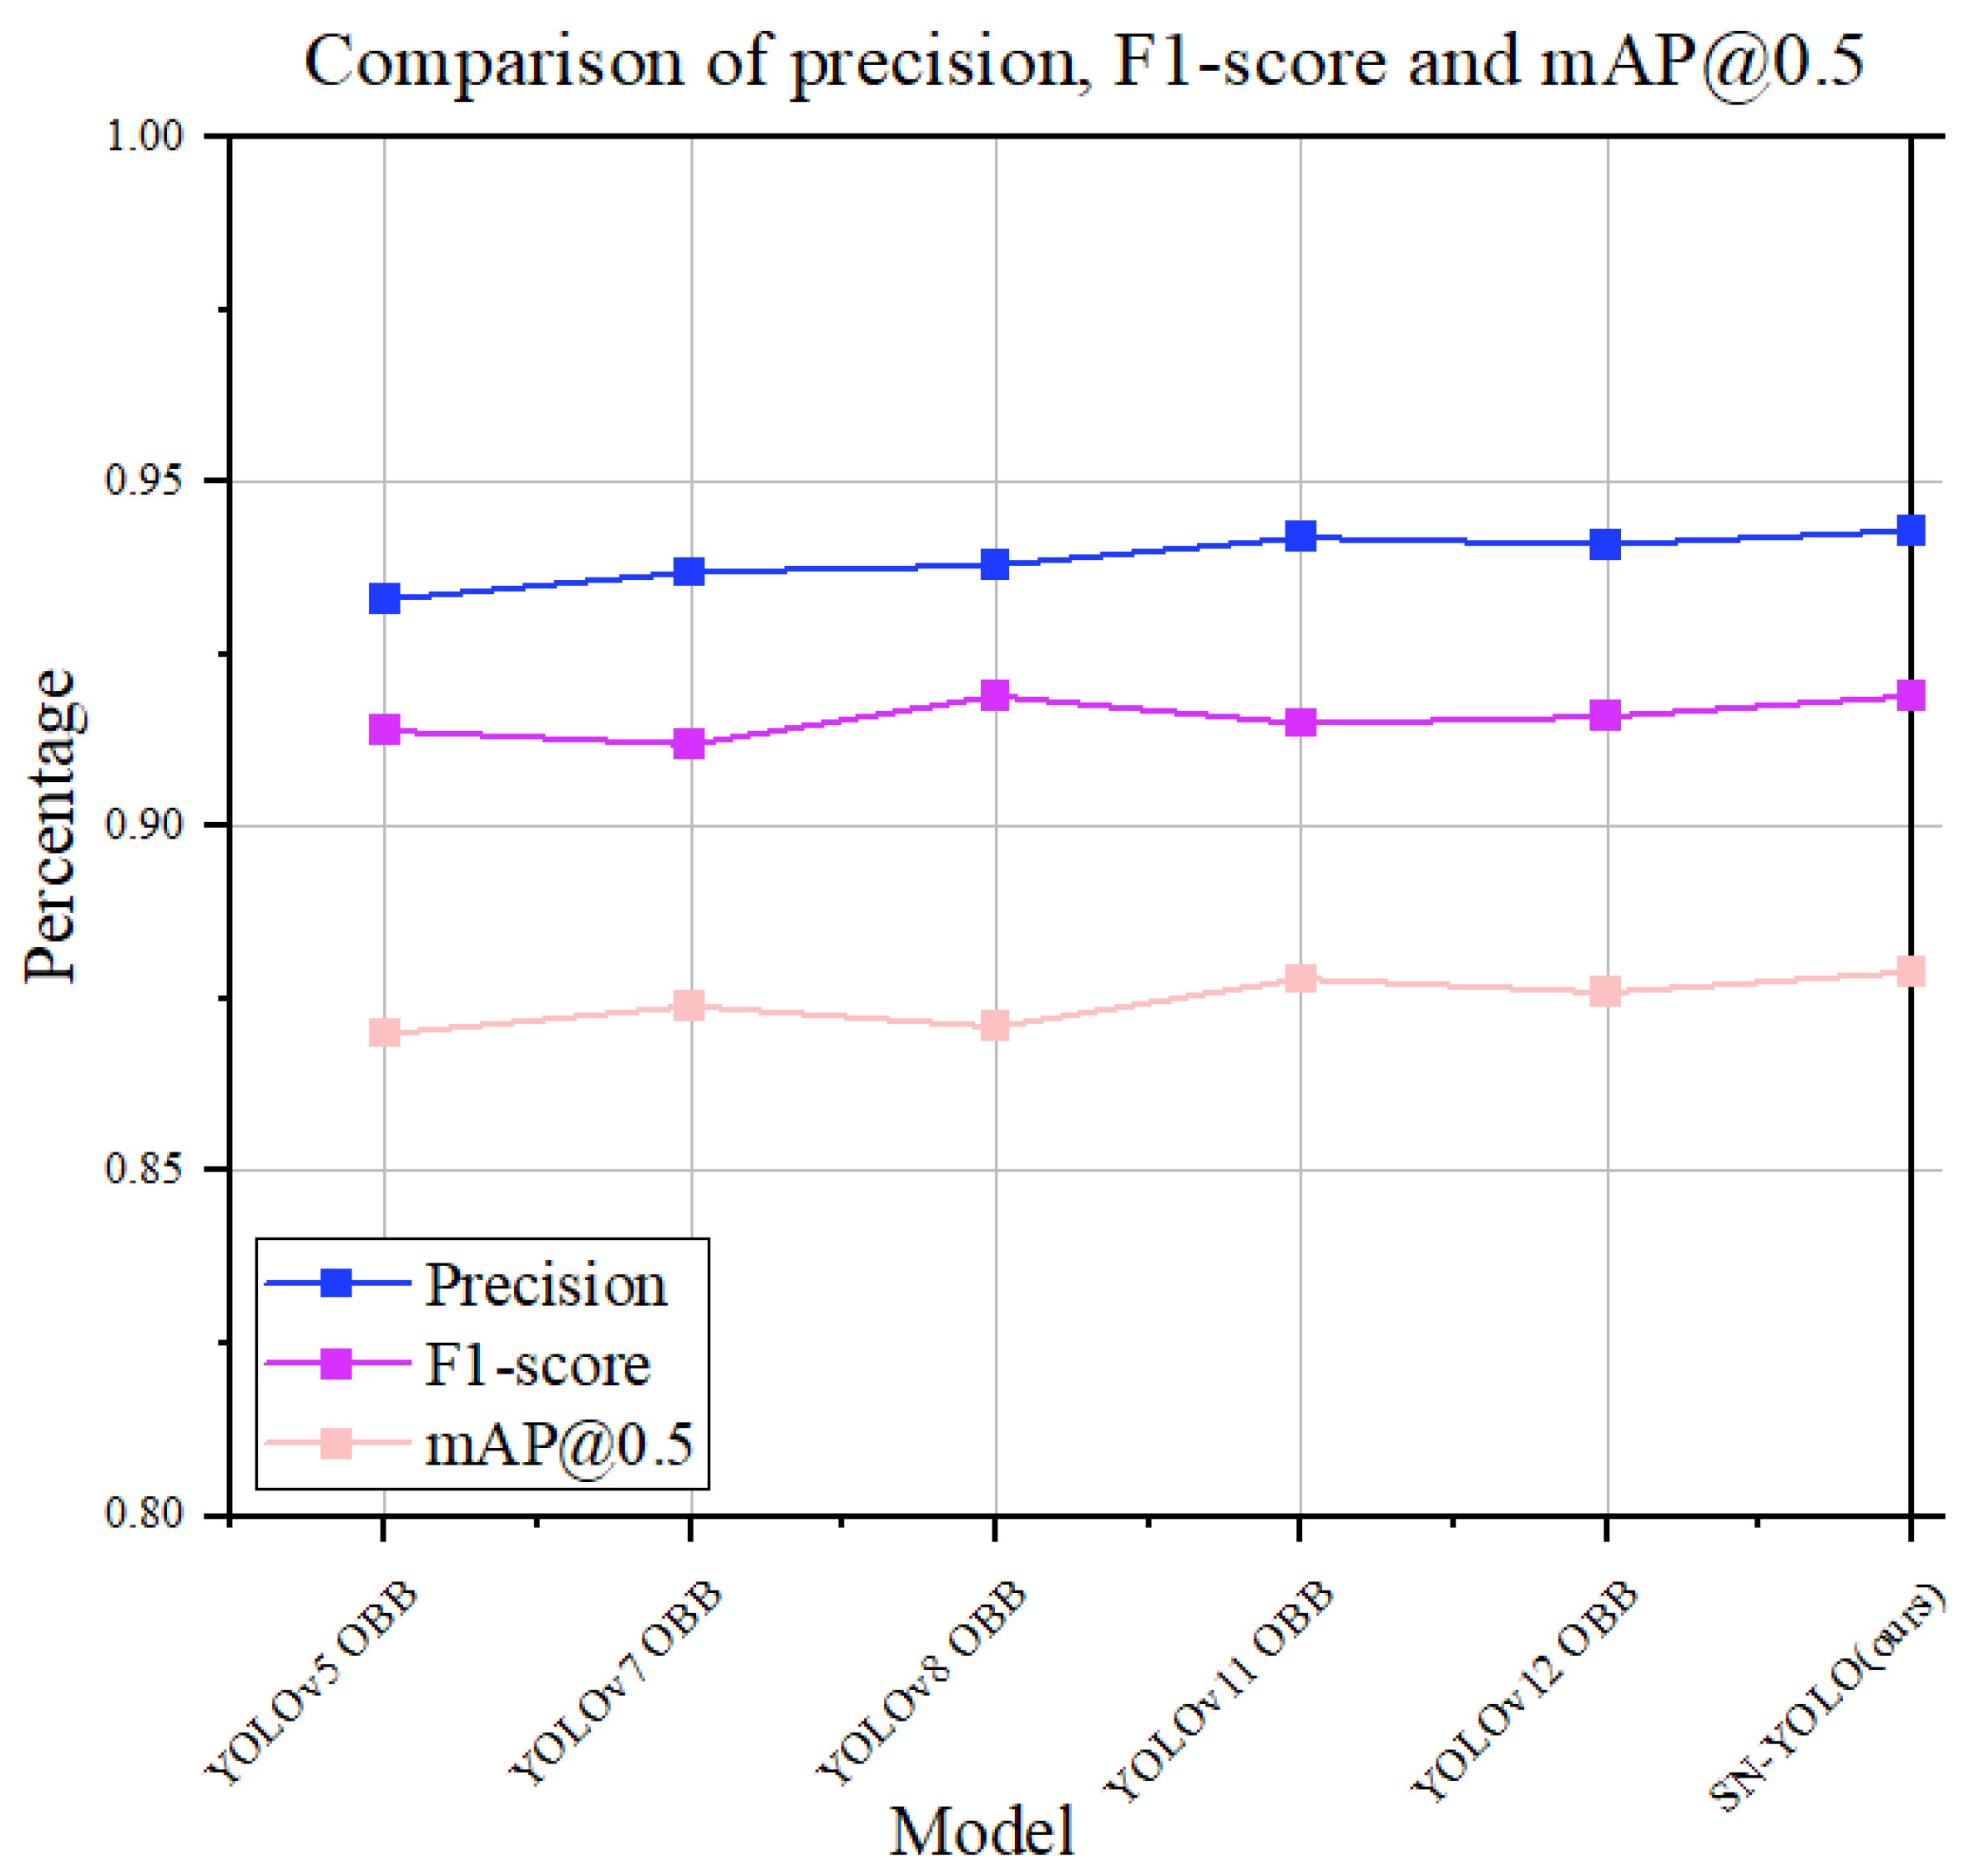
To further verify the performance of SN-YOLO, we compared it with current advanced object detection algorithms that support rotated-box detection, including YOLOv5 OBB, YOLOv7 OBB, YOLOv8 OBB, YOLOv11 OBB, and YOLOv12 OBB as shown in Table 5. The comparison of precision, F1-score, and mAP@0.5 of different algorithms is shown in Figure 6.
The results are shown in the table; SN-YOLO achieved the best detection performance on all metrics evaluated. Compared to other variants based on YOLOv8 OBB, SN-YOLO maintained competitive model complexity and acceptable inference speed, while offering improved robustness and accuracy. YOLOv12 OBB achieved the fastest inference at 5.7 ms, making it more suitable for real-time applications, albeit with slightly lower accuracy. These results validate the effectiveness of the proposed backbone and attention design in enhancing object detection performance under complex scenes.

4.7. Comparison of Different Backbones

To evaluate the impact of different backbone networks on detection performance, several variants of the YOLOv8 OBB architecture were constructed by replacing its original backbone with commonly used lightweight networks, includingRes2Net, HRNet, FPN-ResNet50, and RepVGG. These models were trained and tested under identical conditions to ensure a fair comparison. Table 6 presents the quantitative results in terms of precision, F1-score, mAP, inference speed, and floating-point operations, which collectively reflect the trade-offs between accuracy and efficiency across different backbone designs.
The results show that SN-YOLO achieved the best performance in terms of precision, F1-score, and mAP@0.5, demonstrating strong adaptability to complex backgrounds and multi-scale targets. Res2Net and HRNet also performed well in terms of accuracy, particularly in detecting small and occluded objects, but they had higher inference latency and computational cost. FPN-ResNet50 stroke a good balance between accuracy and efficiency, while RepVGG offered extremely fast inference and low computational overhead, making it suitable for real-time deployment scenarios, albeit with slightly lower detection accuracy.

4.8. Display of Visual Results

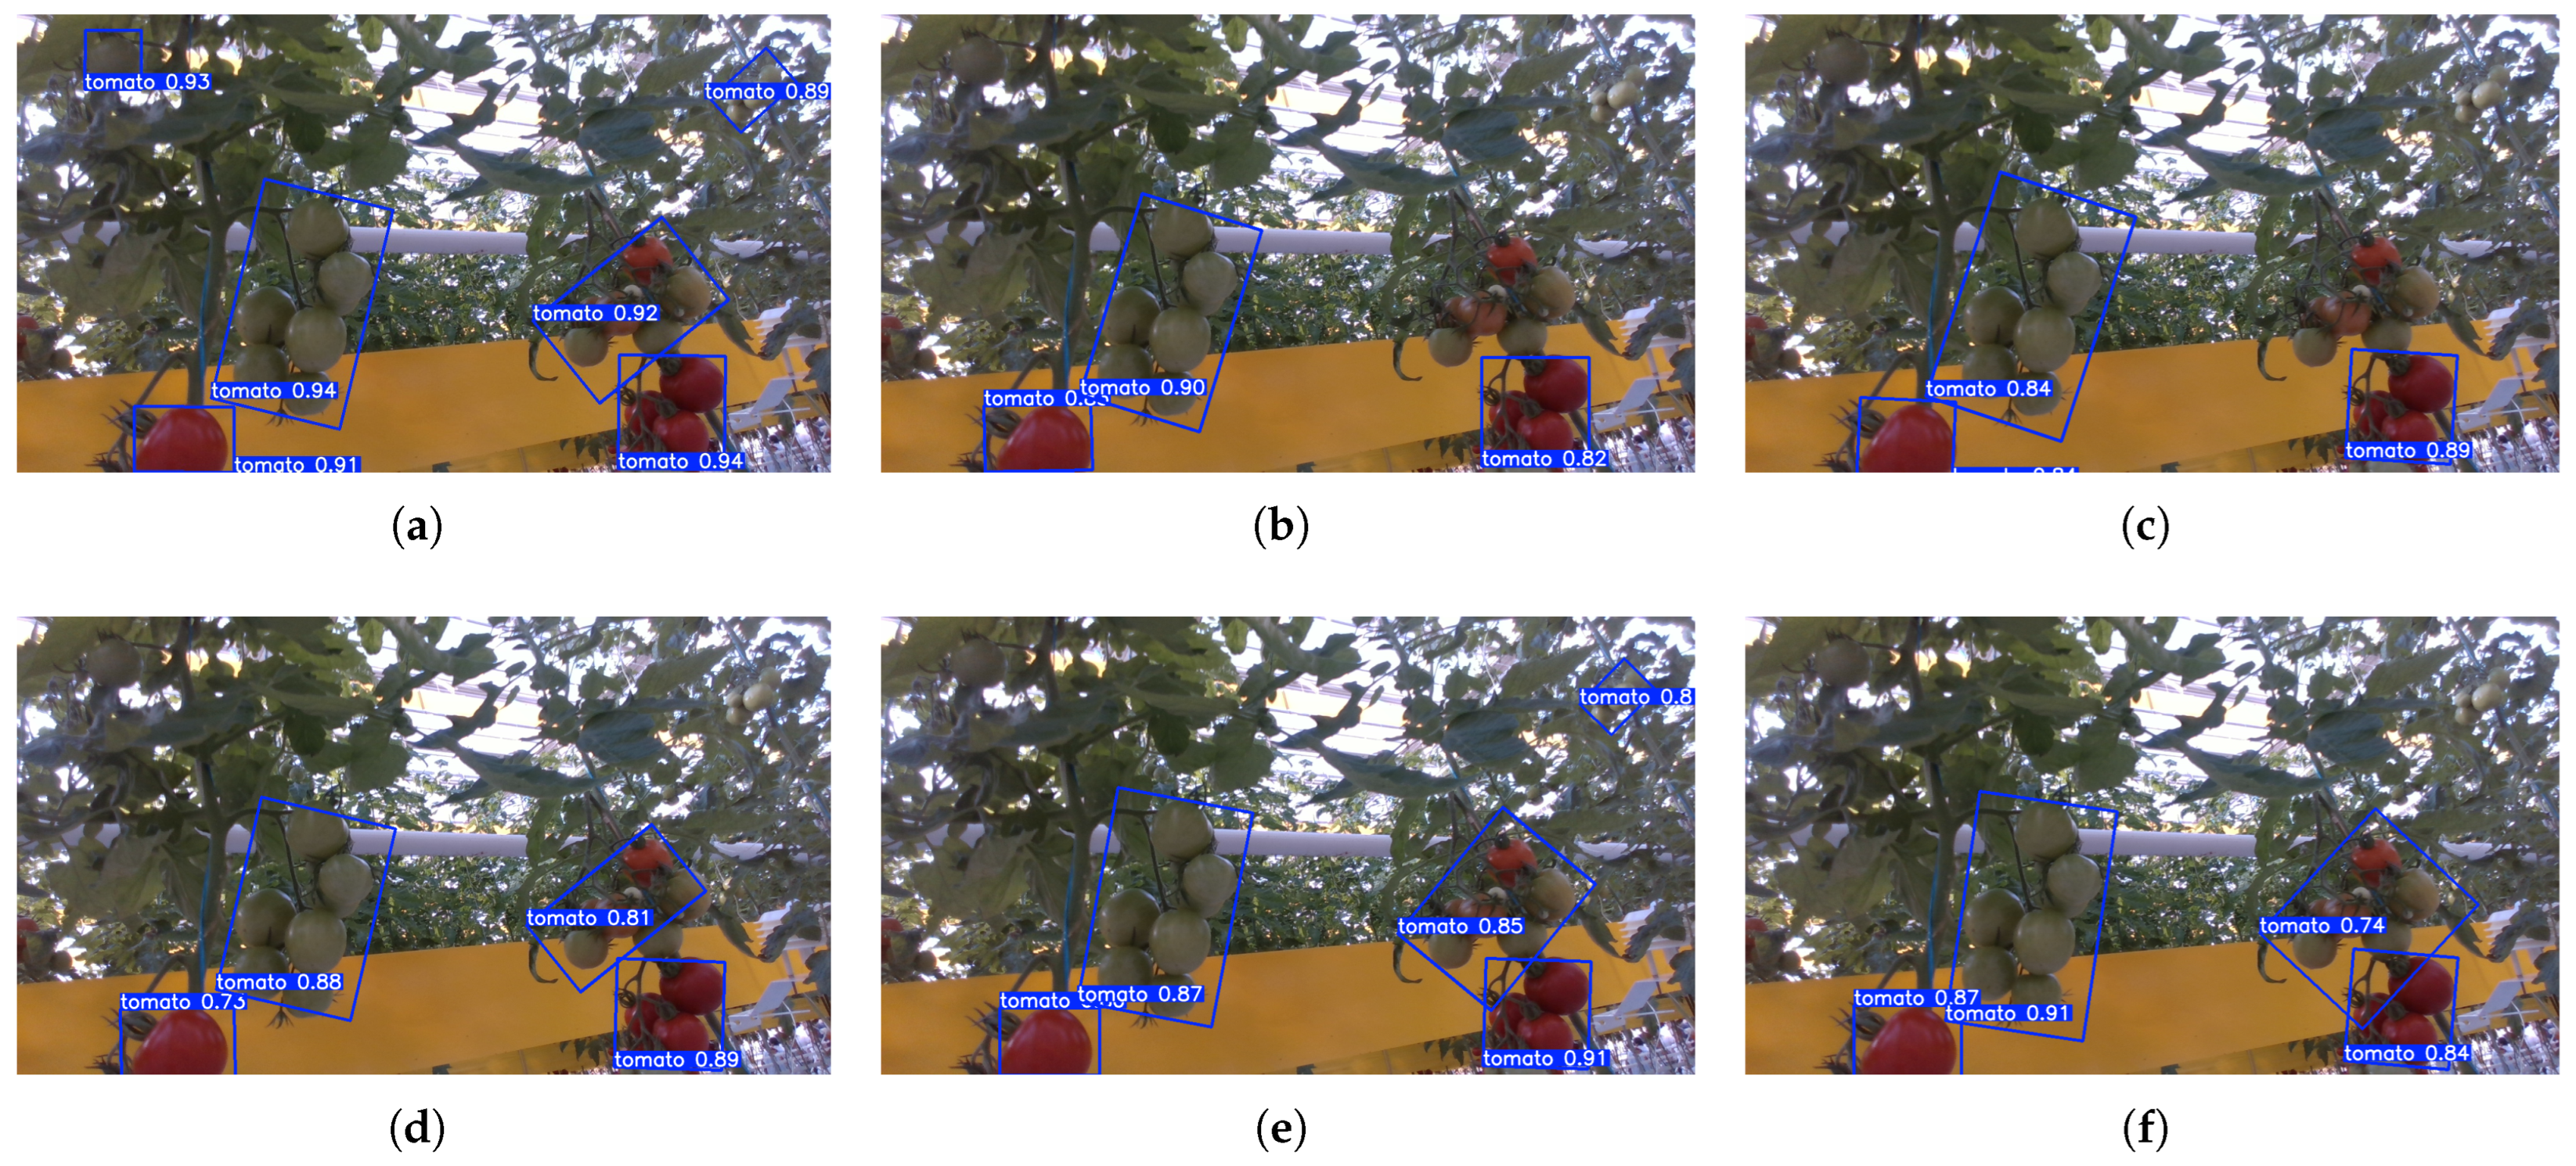
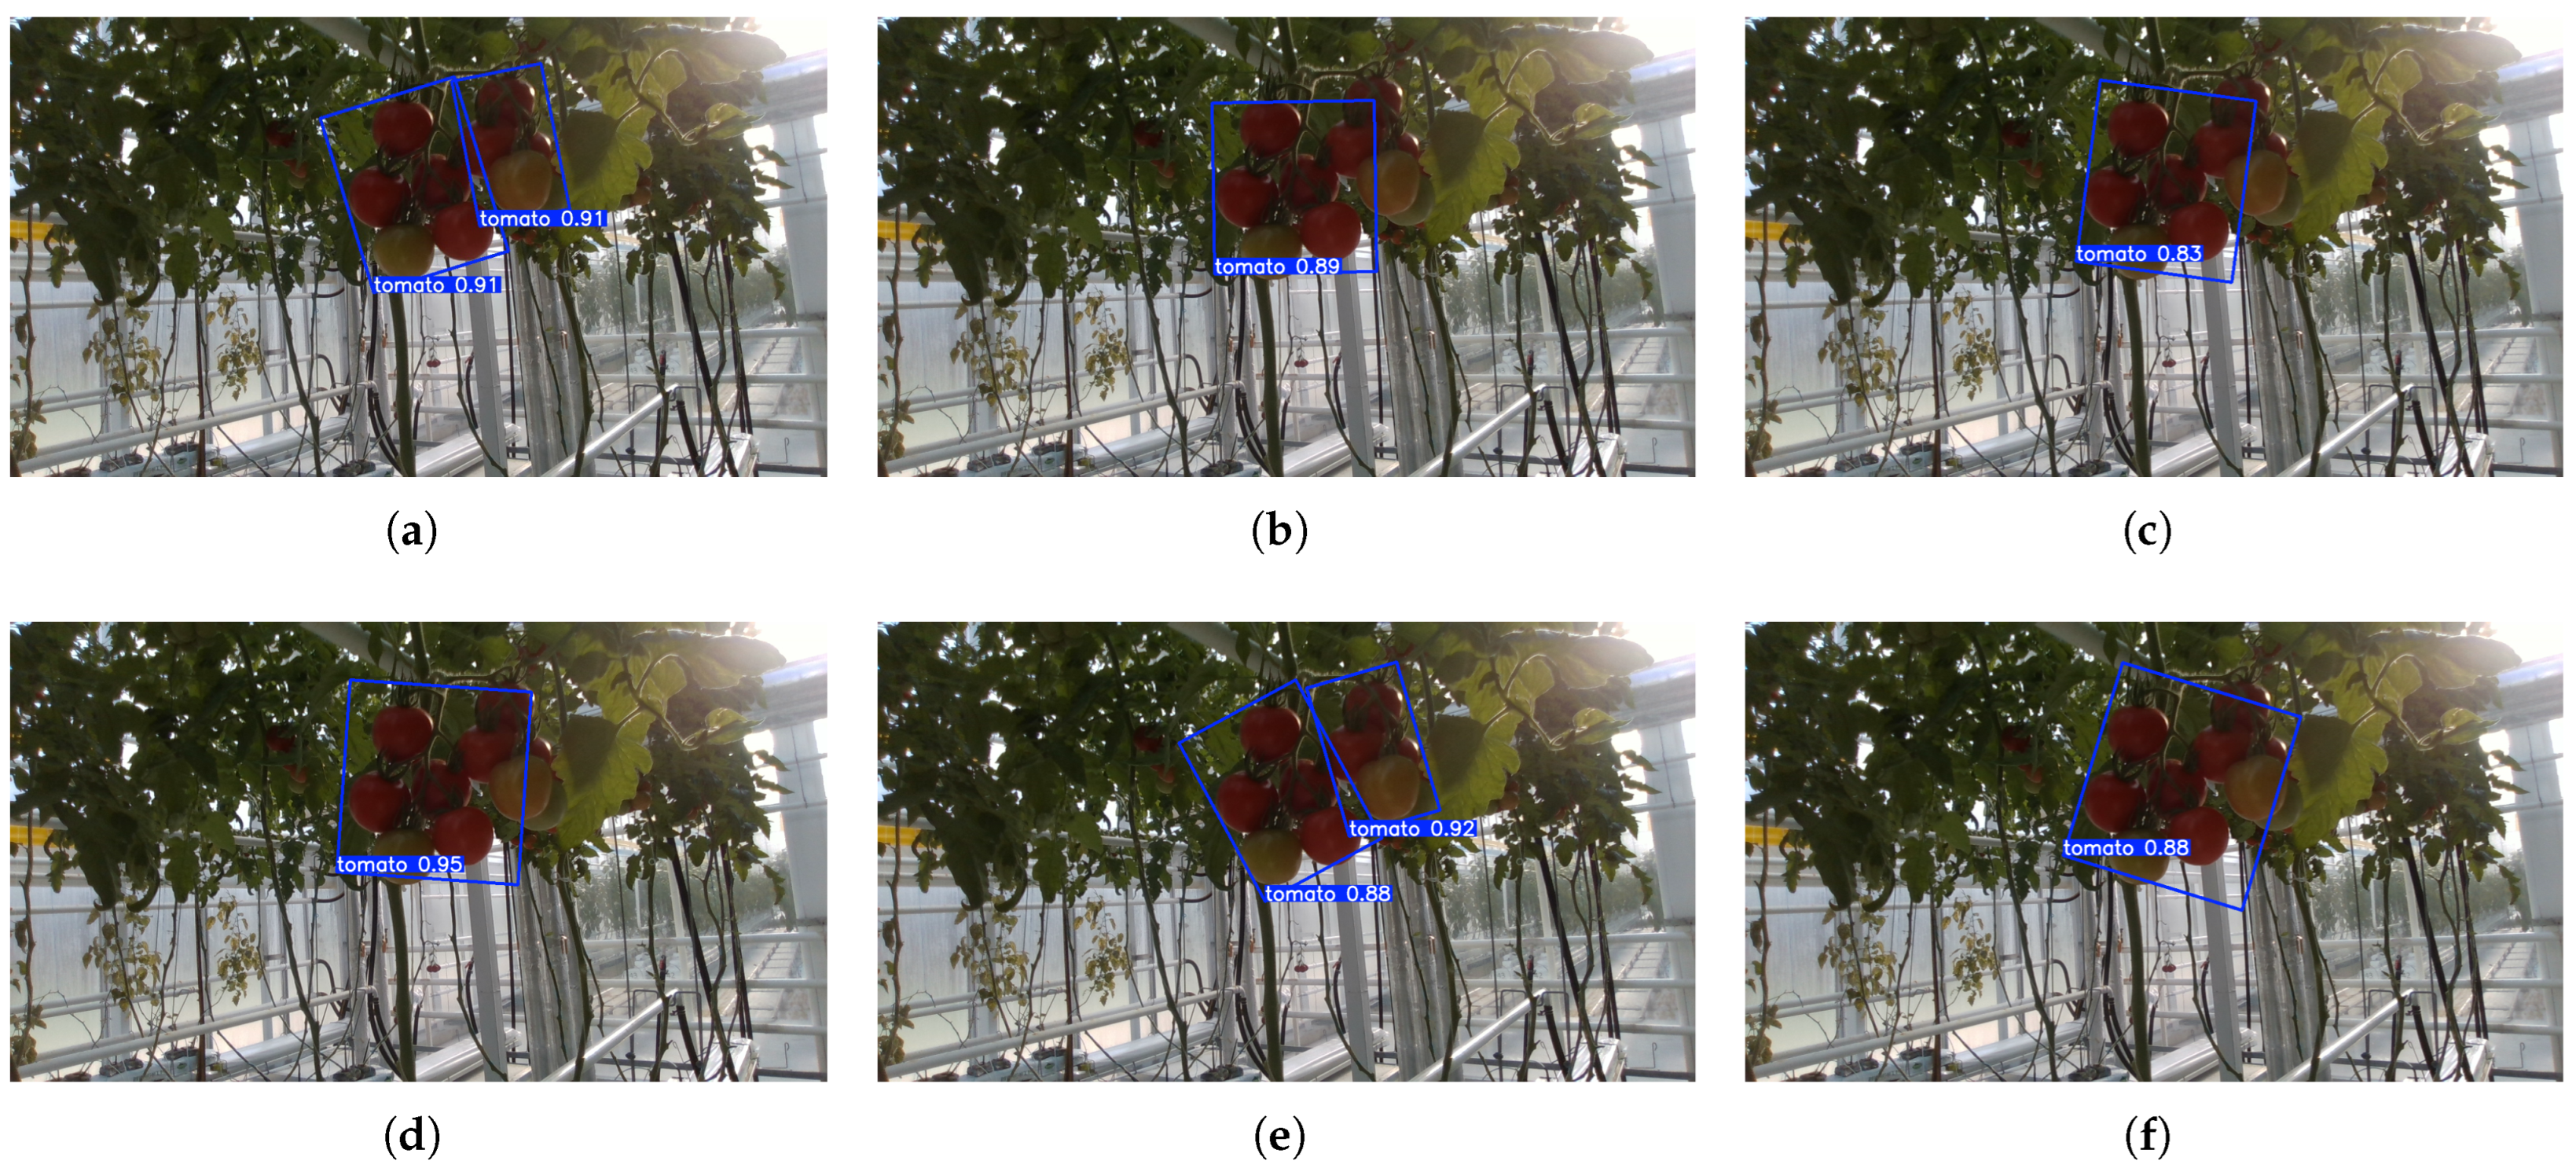
To verify the detection performance of the SN-YOLO model in natural scenes, a visualization analysis of the images of the test set was performed. As shown in Figure 7, SN-YOLO demonstrates superior detection performance under complex background conditions, achieving the most accurate results among all models. Additionally, Figure 8 illustrates the models’ responses to lighting variations, revealing that SN-YOLO, enhanced by color-prior attention, is more sensitive and adaptive to changes in illumination. In summary, SN-YOLO provides accurate detection under both complex backgrounds and varying lighting conditions, making it well suited for real-world tomato picking tasks performed by agricultural robots.

4.9. Ablation Experiment

As shown in Table 7, the ablation study evaluated the contribution of each component in the proposed SN-YOLO architecture. Replacing the YOLOv8 OBB backbone with StarNet’ alone slightly reduced precision and mAP@0.5 but significantly improved inference speed and reduced FLOPs. Introducing the CPSCA module into the backbone improved mAP@0.5 to 87.3%, albeit with increased computational cost. When CPSCA was embedded in the neck, it further enhanced detection performance, achieving 87.4% mAP@0.5 and the highest precision but resulted in slower inference speed. The full model, SN-YOLO, which integrates both StarNet’ and CPSCA modules, achieved the best overall performance with the highest mAP@0.5, precision, and recall, while maintaining a balanced inference speed and acceptable computational load. These results demonstrate that each proposed module contributes positively to detection accuracy, and their combination provides an effective trade-off between performance and efficiency.

5. Discussion

The proposed SN-YOLO model demonstrates strong performance in tomato fruit detection under complex backgrounds; however, several aspects warrant further investigation and refinement. Firstly, while the CPSCA module effectively enhances detection by leveraging color priors, its generalization may be limited in challenging lighting conditions such as glare or shadow occlusion, which can adversely affect model stability and accuracy. Improving robustness under varying illumination remains a critical research direction. Secondly, the integration of attention mechanisms within the backbone and neck improves feature representation but introduces additional computational overhead and parameter increase, particularly impacting inference efficiency.
Future work should focus on optimizing attention modules to achieve a better trade-off between accuracy and computational cost. Potential future directions include: (1) incorporating multimodal perception by fusing RGB and depth data to enrich feature representation of fruit contours and shapes; (2) combining lightweight attention modules with model pruning techniques to reduce complexity and meet real-time requirements; (3) integrating segmentation or keypoint detection tasks for more comprehensive understanding of fruit position, morphology, and grasping points.
In summary, compared with other models, SN-YOLO offers a more compact architecture with lower inference latency. From a theoretical standpoint, this study demonstrates the effectiveness of integrating color priors into lightweight attention mechanisms, offering insights into hierarchical attention design for complex agricultural scenes. Practically, SN-YOLO provides an efficient and scalable solution for automated tomato harvesting, showing strong adaptability to varied lighting and background conditions.

6. Conclusions

This paper presented SN-YOLO, an enhanced object detection framework based on the YOLOv8 OBB architecture, aimed at improving tomato detection under complex greenhouse conditions. The integration of oriented bounding boxes enabled more accurate localization of arbitrarily oriented tomato fruits, effectively suppressing background interference in complex greenhouse environments. The enhanced StarNet’ backbone improved the extraction of local features, while the CPSCA module, guided by color priors, effectively directed the network’s attention to semantically important regions. Moreover, the multi-level attention fusion strategy facilitated robust cross-scale feature integration, resulting in consistent gains in both detection precision and overall model robustness, as evidenced by the experimental results. Comprehensive experiments on a custom tomato dataset demonstrated that SN-YOLO outperformed the baseline by achieving a 1.0% increase in precision and 0.8% in mAP@0.5. The ablation studies validated the individual contributions of both the CPSCA module and the multi-level fusion strategy, each showing measurable improvements when added to the baseline. The proposed framework offers a practical and robust solution for intelligent fruit detection in precision agriculture applications. Future research will focus on optimizing the proposed SN-YOLO framework for real-time deployment in field robotics and extending the model’s generalization ability to a wider variety of crop types and agricultural environments.

Author Contributions

Conceptualization, R.Y.; methodology, R.Y.; validation, R.Y. and Y.N.; formal analysis, R.Y., M.Y. and J.C.; investigation, R.Y.; resources, R.Y. and M.Y.; data curation, R.Y.; writing—original draft preparation, R.Y.; writing—review and editing, R.Y. and M.Y.; visualization, R.Y. and Y.N.; supervision, J.C. and M.Y.; project administration, M.Y., W.C. and Y.Z.; funding acquisition: J.C. and M.Y. All authors have read and agreed to the published version of the manuscript.

Funding

This research was funded by Guangxi Science and Technology Development Project (Guike AB23026135, Guike AB24010164), Guilin Science and Technology Plan Project (20230112-1, 20230104-6), the Beijing Natural Science Foundation (F2024205028), Hebei Natural Science Foundation (F2024205028).

Data Availability Statement

A subset of the dataset used in this study, consisting of 128 representative RGB images, is publicly available at the following GitHub repository: https://github.com/lu09-lu/v8obb_tomato.git accessed on 9 August 2025.

Acknowledgments

We gratefully acknowledge the team led by Cao Xu at the Institute of Genetics and Developmental Biology, Chinese Academy of Sciences, for providing experimental facilities and valuable suggestions during the course of this research. Meanwhile, we also thank the Cuihu Smart Agriculture Innovation Facility Tomato Research Site for providing field support.

Conflicts of Interest

The author Wujun Che was employed by the company Guilin Ruiwei Saide Technology Co., Ltd. The remaining authors declare that the research was conducted in the absence of any commercial or financial relationships that could be construed as a potential conflict of interest.

References

  1. Sa, I.; Ge, Z.; Dayoub, F.; Upcroft, B.; Perez, T.; McCool, C. DeepFruits: A fruit detection system using deep neural networks. Sensors 2016, 16, 1222. [Google Scholar] [CrossRef]
  2. Bac, C.; Hemming, J.; van Henten, E. Harvesting robots for high-value crops: State-of-the-art review and challenges ahead. J. Field Robot. 2014, 31, 888–911. [Google Scholar] [CrossRef]
  3. Lin, T.; Li, J.; Xie, Q.; Wang, B.; Zhang, Y. Fruit detection and localization for robotic harvesting in orchards: A review. Comput. Electron. Agric. 2020, 176, 105634. [Google Scholar] [CrossRef]
  4. Koirala, A.; Walsh, K.B.; Wang, Z.; McCarthy, C. Deep learning for real-time fruit detection and orchard mapping on an autonomous robot platform. ISPRS J. Photogramm. Remote Sens. 2019, 146, 24–35. [Google Scholar] [CrossRef]
  5. Liu, J.; Liu, Z. The vision-based target recognition, localization, and control for harvesting robots: A review. Int. J. Precis. Eng. Manuf. 2024, 25, 409–428. [Google Scholar] [CrossRef]
  6. Schertz, C.; Brown, G. Basic considerations in mechanizing fruit harvests. Trans. ASAE 1968, 11, 343–345. [Google Scholar]
  7. Xiao, F.; Wang, H.; Li, Y.; Cao, Y.; Lv, X.; Xu, G. A novel shape analysis method for citrus recognition under natural scenes. Agronomy 2023, 13, 639. [Google Scholar] [CrossRef]
  8. Hannan, M.; Burks, T.; Bulanon, D. A machine vision algorithm for fruit shape analysis using curvature and edge detection techniques. Trans. ASABE 2009, 52, 1747–1756. [Google Scholar]
  9. Arefi, A.; Motlagh, A.; Mollazade, K.; Teimourlou, R. Recognition and localization of ripen tomato based on machine vision. Aust. J. Crop Sci. 2011, 5, 1144–1149. [Google Scholar]
  10. Bargoti, S.; Underwood, J. Deep fruit detection in orchards. In Proceedings of the IEEE International Conference on Robotics and Automation (ICRA), Singapore, 29 May–3 June 2017; pp. 3626–3633. [Google Scholar] [CrossRef]
  11. Chu, P.; Liu, J.; Liu, Z.; Liu, J. O2RNet: A Novel Fruit Detection Network Based on Occluded-to-Robust Reasoning. arXiv 2023, arXiv:2303.04884. [Google Scholar]
  12. Nejati, M.; Seyednasrollah, B.; Lee, R.; McCool, C.; Lehnert, C.; Perez, T.; Tow, P. Semantic segmentation of kiwifruit for yield estimation. arXiv 2020, arXiv:2006.11729. [Google Scholar]
  13. Wang, K.; Li, Z.; Su, A.; Wang, Z. Oriented object detection in optical remote sensing images: A survey. arXiv 2023, arXiv:2302.10473. [Google Scholar]
  14. Wen, L.; Cheng, Y.; Fang, Y.; Li, X. A comprehensive survey of oriented object detection in remote sensing images. Expert Syst. Appl. 2023, 224, 119960. [Google Scholar] [CrossRef]
  15. Fu, Y.; Wang, Z.; Zheng, H.; Yin, X.; Fu, W.; Gu, Y. Integrated detection of coconut clusters and oriented leaves using improved YOLOv8n-obb for robotic harvesting. Comput. Electron. Agric. 2025, 231, 109979. [Google Scholar] [CrossRef]
  16. Whittaker, D.; Miles, G.; Mitchell, O.; Gaultney, L. Fruit location in a partially occluded image. Trans. ASAE 1987, 30, 591–596. [Google Scholar] [CrossRef]
  17. Zheng, X.; Zhao, J.; Liu, M. Tomato Recognition and Localization Technology Based on Binocular Stereo Vision. Comput. Eng. 2004, 171, 155–156. [Google Scholar]
  18. Xiang, R.; Ying, Y.; Jiang, H.; Rao, X.; Peng, Y. Recognition of Overlapping Tomatoes Based on Edge Curvature Analysis. Trans. Chin. Soc. Agric. Mach. 2012, 43, 157–162. [Google Scholar]
  19. Feng, Q.; Cheng, W.; Yang, Q.; Xun, Y.; Wang, X. Recognition and Localization Method for Overlapping Tomato Fruits Based on Line-Structured Light Vision. J. China Agric. Univ. 2015, 20, 100–106. [Google Scholar]
  20. Ma, C.; Zhang, X.; Li, Y.; Lin, S.; Xiao, D.; Zhang, L. Recognition of Immature Tomatoes Based on Saliency Detection and Improved Hough Transform Method. Trans. Chin. Soc. Agric. Eng. 2016, 32, 219–226. [Google Scholar]
  21. Liu, C.; Lai, N.; Bi, X. Spherical Fruit Recognition and Localization Algorithm Based on Depth Images. Trans. Chin. Soc. Agric. Mach. 2022, 53, 228–235. [Google Scholar]
  22. Chen, X.; Yang, S.X. A practical solution for ripe tomato recognition and localisation. J. Real-Time Image Process. 2013, 8, 35–51. [Google Scholar] [CrossRef]
  23. Zhao, Y.; Gong, L.; Zhou, B.; Huang, Y.; Niu, Q.; Liu, C. Research on Non-color-coded Target Recognition Algorithm for Tomato Picking Robot. Trans. Chin. Soc. Agric. Mach. 2016, 47, 1–7. [Google Scholar]
  24. Li, H.; Zhang, M.; Gao, Y.; Li, M.; Ji, Y. Machine Vision Detection Method for Green-Mature Tomatoes in Greenhouses. Trans. Chin. Soc. Agric. Eng. 2017, 33. [Google Scholar]
  25. Moallem, P.; Serajoddin, A.; Pourghassem, H. Computer vision-based apple grading for golden delicious apples based on surface features. Inf. Process. Agric. 2017, 4, 33–40. [Google Scholar] [CrossRef]
  26. Yue, Y.; Sun, B.; Wang, H.; Zhao, H. Tomato Fruit Detection Based on Cascaded Convolutional Neural Network. Sci. Technol. Eng. 2021, 21, 2387–2391. [Google Scholar]
  27. Zhao, B.; Liu, S.; Zhang, W.; Zhu, L.; Han, Z.; Feng, X.; Wang, R. Lightweight Transformer Architecture Optimization for Cherry Tomato Harvesting Recognition. Trans. Chin. Soc. Agric. Mach. 2024, 55, 62–71, 105. [Google Scholar]
  28. Zhao, F.; Zuo, G.; Gu, S.; Ren, X.; Tao, X. Lightweight Detection Model for Greenhouse Tomatoes Based on Improved YOLO v5s. Jiangsu Agric. Sci. 2024, 52, 200–209. [Google Scholar] [CrossRef]
  29. Miao, R.; Li, Z.; Wu, J. Lightweight Cherry Tomato Ripeness Detection Method Based on Improved YOLO v7. Trans. Chin. Soc. Agric. Mach. 2023, 54, 225–233. [Google Scholar]
  30. Guo, K.; Yang, J.; Shen, C.; Wang, L.; Chen, Z. StarNet: Exploiting Star-Convex Polygons for Object Detection. In Proceedings of the IEEE/CVF International Conference on Computer Vision (ICCV), Montreal, QC, Canada, 11–17 October 2021; pp. 13014–13023. [Google Scholar]
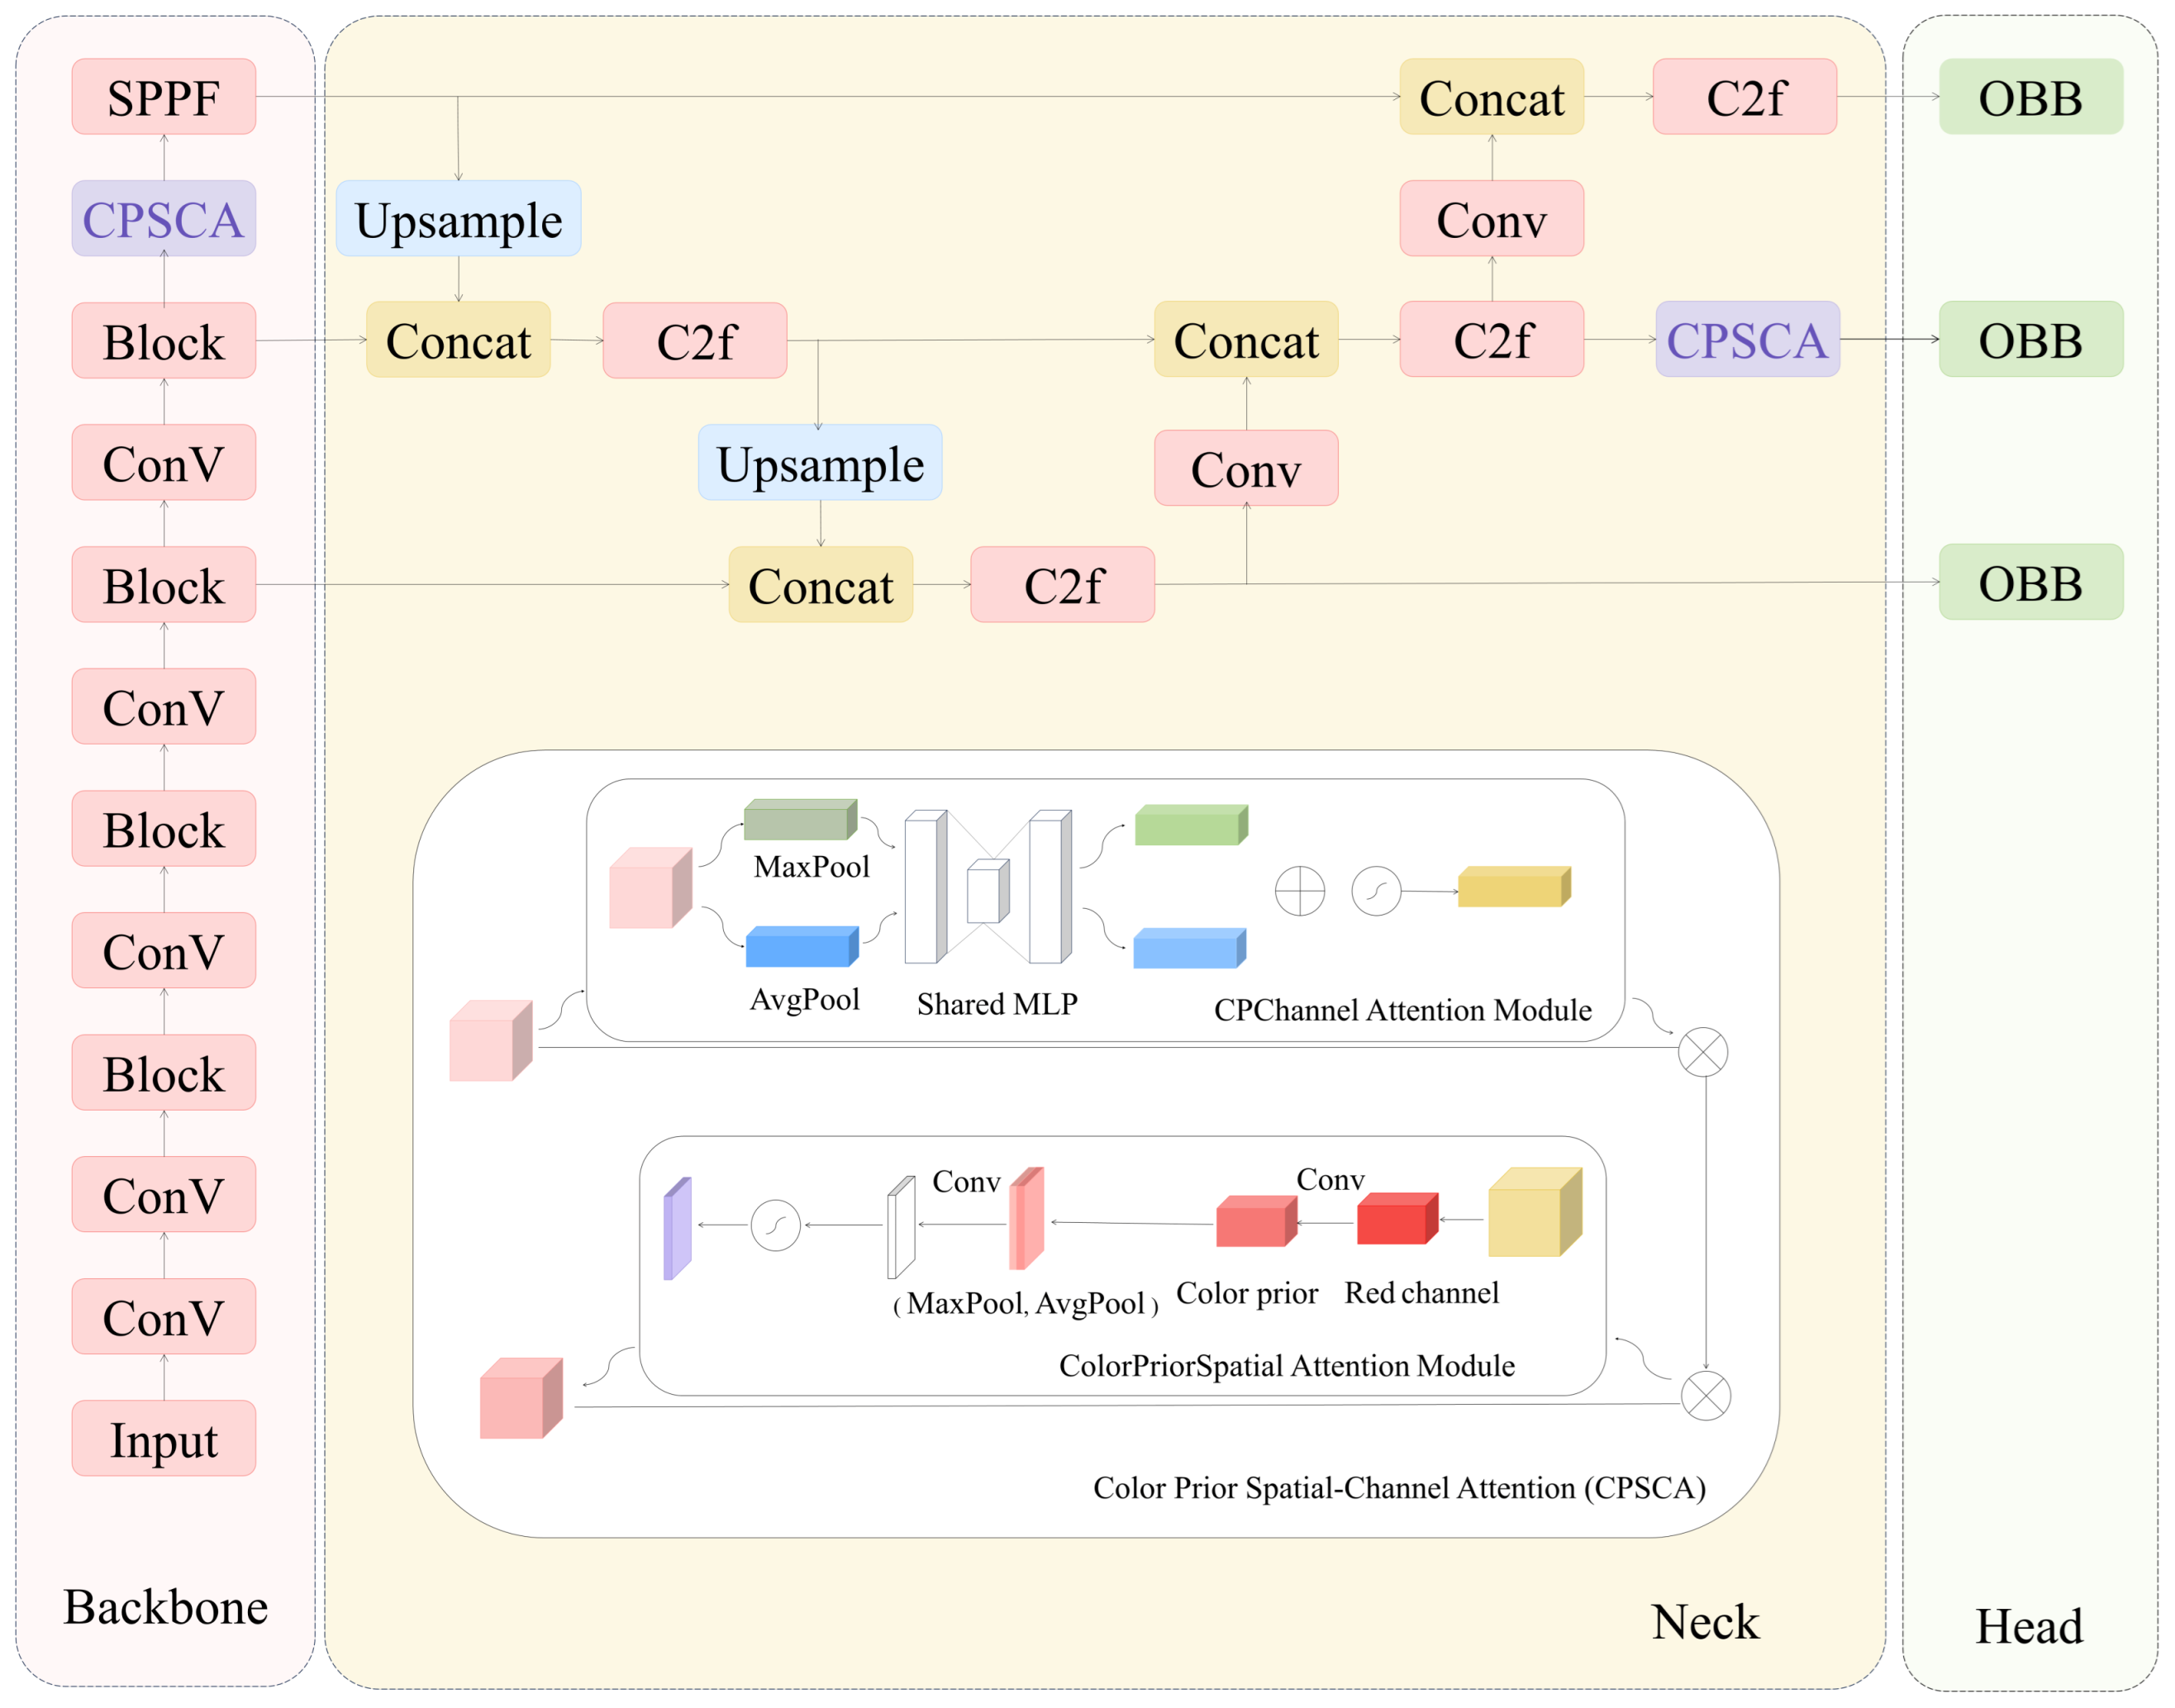
Figure 1. Diagram of NS-YOLO network architecture.
Electronics 14 03243 g001
Figure 2. Diagram of block architecture.
Electronics 14 03243 g002
Figure 3. Diagram of CPSCA architecture. The module integrates a color prior and spatial-channel attention mechanism, first performs channel attention-weighted enhancement on key semantic channels, then extracts the red channel as color prior, and fuses it with average pooling and maximum pooling features to generate a spatial attention map, finally focusing on salient areas and outputting an enhanced feature map.
Electronics 14 03243 g003
Figure 4. The images of tomato fruits captured at different times of the day, under varying lighting conditions, time, complex background, and maturity stages in greenhouses with natural environments. (a) Front light, (b) Back light, (c) Morning, (d) Afternoon, (e) Complex background, (f) Immature, (g) Semi-mature, (h) Mature.
Electronics 14 03243 g004
Figure 5. Model training results. (a) Validation loss curve during SN-YOLO training, (b) precision–recall curve, (c) normalized confusion matrix.
Electronics 14 03243 g005
Figure 6. Comparison of precision, F1-score, and mAP@0.5 of different algorithms.
Electronics 14 03243 g006
Figure 7. Detection results of different models in complex backgrounds. (a) SN-YOLO, (b) YOLOv5 OBB, (c) YOLOv7 OBB, (d) YOLOv8 OBB, (e) YOLOv11 OBB, (f) YOLOv12 OBB.
Electronics 14 03243 g007
Figure 8. Detection results of different models under backlight environments. (a) SN-YOLO, (b) YOLOv5 OBB, (c) YOLOv7 OBB, (d) YOLOv8 OBB, (e) YOLOv11 OBB, (f) YOLOv12 OBB.
Electronics 14 03243 g008
Table 1. Summary of tomato recognition methods.
AuthorMethodAdvantagesLimitations
Whittaker et al. [16]
Zheng et al. [17]
Xiang et al. [18]
Feng et al. [19]
Ma et al. [20]
Liu et al. [21]
D-Hough transform
Color thresholding
Curvature regression
Color difference model
Saliency and Hough
Morphological features
Simple implementation; effective in controlled environmentsPoor robustness under lighting variation, occlusion, and cluttered background
Chen et al. [22]
Zhao et al. [23]
Li et al. [24]
Moallem et al. [25]
ROI and edge detector
AdaBoost
Bayesian classifier
SVM
Better generalization; flexible feature learningHigh computational cost; unstable in complex scenes
Yue et al. [26]
Zhao et al. [27]
Zhao et al. [28]
Miao et al. [29]
Cascade R-CNN
EfficientViT
YOLOv5
YOLOv7
Strong feature learning; robust to occlusion and lighting changesStill challenged by extreme occlusion, clutter, and robustness
Table 2. Structural differences between the original StarNet and the proposed StarNet’.
AspectOriginal StarNetProposed StarNet’
Network structureDepthwise separable conv + standard residualsDual-branch expansion + enhanced residuals
Feature extractionSingle pathDual 1 × 1 conv paths with weighted fusion
Fusion strategyAddition or concatenationLearnable weight-based fusion
Regularization strategyNoneDropPath regularization
Gradient flowBasic residual connectionsMore stable via enhanced residuals
Table 3. Initial training parameters.
Parameter LabelSelected Configuration
Number of epochs300
Image dimensions640 × 640
Batch size64
OptimizerAdamW
Learning rate0.002
Momentum0.9
Weight decay0.0005
Warmup epochs3.0
Warmup momentum0.8
Table 4. Comparison of detection performance with different color priors.
ColorPrecisionF1-ScoremAP@0.5mAP@0.5:0.95Parameters
None91.7%90.5%86.1%68.6%3.92M
Green92.1%91.1%86.6%68.9%4.21M
Blue91.9%90.9%86.3%68.3%4.05M
RGB mean prior89.9%90.6%86.2%68.7%4.37M
Red92.8%91.3%86.8%69.2%4.3M
Table 5. Comparison of detection performance between different detection models.
ModelPrecisionF1-ScoremAP@0.5mAP@0.5:0.95ParametersInference Speed
YOLOv5 OBB93.5%91.4%87.0%69.5%3.51M5.8 ms
YOLOv7 OBB93.7%91.2%87.4%69.4%3.97M7.5 ms
YOLOv8 OBB93.3%91.5%87.1%69.6%3.91M9.3 ms
YOLOv11 OBB94.2%91.5%87.8%69.7%3.58M6.2 ms
YOLOv12 OBB94.1%91.6%87.6%69.7%3.73M5.7 ms
SN-YOLO (ours)94.3%91.9%87.9%69.9%3.63M7.5 ms
Table 6. Comparison of detection performance between different detection backbones.
ModelPrecisionF1-ScoremAP@0.5Inference SpeedFLOPs
YOLOv8 OBB-Res2Net93.7%91.6%87.2%8.3 ms17.2G
YOLOv8 OBB-HRNet94.0%91.3%87.5%9.2 ms18.5G
YOLOv8 OBB-FPN-ResNet5093.7%90.9%87.0%7.4 ms15.8G
YOLOv8 OBB-RepVGG93.6%91.0%87.3%7.1 ms15.3G
SN-YOLO (ours)94.3%91.9%87.9%7.5 ms16.4G
Table 7. Comparison of ablation experiment results.
ModelPrecisionRecallmAP@0.5Inference SpeedFLOPs
YOLOv8 OBB93.3%90.5%87.1%9.3 ms14.3G
StarNet’ in backbone93.1%90.6%87.0%6.4 ms12.7G
CPSCA in backbone92.8%89.8%87.3%7.1 ms20.3G
CPSCA in neck93.6%90.3%87.4%9.9 ms14.5G
SN-YOLO (ours)94.3%91.4%87.9%7.5 ms16.4G
Disclaimer/Publisher’s Note: The statements, opinions and data contained in all publications are solely those of the individual author(s) and contributor(s) and not of MDPI and/or the editor(s). MDPI and/or the editor(s) disclaim responsibility for any injury to people or property resulting from any ideas, methods, instructions or products referred to in the content.