Article

Substation Inspection Image Dehazing Method Based on Decomposed Convolution and Adaptive Fusion

1
State Grid Henan Electric Power Company, Zhengzhou 450000, China
2
College of Artificial Intelligence, Anhui University, Hefei 230601, China
*
Author to whom correspondence should be addressed.
Electronics 2025, 14(16), 3245; https://doi.org/10.3390/electronics14163245
Submission received: 24 April 2025 / Revised: 27 July 2025 / Accepted: 4 August 2025 / Published: 15 August 2025

Abstract

To combat the decline in substation image clarity resulting from adverse weather phenomena like haze, which often leads to poor illumination and altered color perception, a compact image dehazing model called the Substation Image Enhancement Network with Decomposition Convolution and Adaptive Fusion (SDCNet) is introduced. In contrast to traditional dehazing methods that expand the convolutional kernel to widen the receptive field and improve feature acquisition, commonly at the cost of increased parameters and computational load, SDCNet employs a decomposition-based convolutional enhancement module. This component efficiently extracts spatial features while keeping computation lightweight. Moreover, an adaptive fusion mechanism is incorporated to better align and merge features from both encoder and decoder stages, aiding in the retention of essential image information. To further enhance model learning, a contrastive regularization strategy is applied, leveraging both hazy and clear substation images during training. Empirical evaluations show that SDCNet substantially enhances visual brightness and restores accurate structural and color details. On the MIIS dataset of substation haze images, it delivers gains of 4.053 dB in PSNR and 0.006 in SSIM compared to current state-of-the-art approaches. Additional assessment on the SSDF dataset further confirms its reliability in detecting substation defects under unfavorable weather conditions.

1. Introduction

Traditional power grid inspections mainly rely on manual labor. While simple and straightforward, this method has drawbacks such as high costs, low efficiency, long cycles, and the presence of blind spots, resulting in low accuracy of inspection data. In recent years, with the advancement of robotic technology and its introduction into the intelligent grid inspection applications, the automation level of grid operation and maintenance has been significantly promoted and enhanced. The flexibility, intelligence, and autonomy of robots provide significant advantages in grid inspection tasks with minimal or no human supervision, leading to widespread application and providing crucial safeguards for accident prevention and safe equipment operation [1]. However, in substation inspection applications, complex weather conditions such as foggy days cause insufficient lighting and unclear targets in the images of substation equipment captured by robots, severely affecting the inspection results and easily leading to missed equipment failures. With the development and application of machine learning technology, existing visual tasks have been improved through enhancement methods in machine learning algorithms, yielding significant results. Therefore, in response to the challenges of substation equipment inspection, researchers have introduced existing image enhancement techniques and conducted extensive studies, including both traditional methods and deep learning-based approaches.
Traditional techniques typically enhance images by modeling the statistical patterns, structures, and inherent properties within the images. Dai Hao et al. [2] developed a multi-channel MSRCR enhancement algorithm that transforms the image color space from RGB to HSI, utilizing MSRCR and histogram equalization to improve substation images. In [3], a combination of Retinex and grayscale dynamic adjustment was employed to process images of pointer-type instruments in rainy and foggy conditions, effectively removing rain and fog while preserving instrument details. Reference [4] proposed a contrast-adaptive enhancement method for low-quality infrared images degraded by adverse weather conditions such as fog and heavy rain, significantly improving substation defect detection. Traditional methods, though easy to deploy, often struggle to adapt to dynamic substation environments and commonly suffer from blurred edges and color distortion.
In recent years, deep learning techniques have found extensive use in substation image enhancement. These methods learn to map blurred images to clear ones by training on large datasets, enabling the direct generation of high-quality restored images. Bai Wanrong et al. [5] introduced the edge-aware feedback convolutional neural network (E-FCNN) to tackle the blur problem in substation inspection images, leading to a substantial improvement in image quality. Chen et al. [6] improved the CSD network and the self-attention mechanism ACmix module based on CycleGAN, incorporating Patch-GAN ideas and optimizing feature mapping, effectively reducing the impact of lighting on instrument recognition. Reference [7] proposed a dehazing method for inspection images using a diffusion model integrated with multi-head external attention, which significantly reduced computational costs and improved dehazing effects for transmission line inspection images. In addition, reference [8] designed dense connection residual blocks and detail restoration modules and improved the CBAM attention module, demonstrating excellent performance in restoring image details. Although these methods show significant improvements over traditional methods, they still face three major challenges: First, current deep learning-based substation image enhancement methods typically use only clear images as positive samples for training and fail to fully utilize negative sample information. Second, current image enhancement methods generally use addition or concatenated fusion of encoder and decoder features, which may lead to feature redundancy. Third, to achieve excellent enhancement results, these methods often come with complex model structures and large numbers of parameters, leading to high computational resource consumption. On the other hand, simplifying the model to reduce the number of parameters makes it difficult to ensure that the image enhancement effect meets the expected level.
To address the issues with current substation image enhancement methods, a Substation Image Enhancement Network based on Decomposition Convolution and Adaptive Fusion (SDCNet) is proposed. To balance the number of parameters and enhancement performance, a Decomposing Convolutional Enhancement Module (DCEM) is introduced. By decomposing large kernel convolutions, the module significantly reduces the number of parameters while maintaining the performance of the substation image enhancement network. To solve the problem of feature redundancy caused by addition or concatenated fusion, an Adaptive Fusion Module (AFM) is designed. Using feature-guided channel attention and spatial attention, this module automatically learns the weights or interrelationships between different features, effectively integrating the interdependent features from the encoder and decoder while retaining key feature information. Finally, to fully exploit negative sample information, a Contrastive Regularization Module (CRM) is proposed. By using both blurred and clear substation images to guide the training of SDCNet, the contrastive regularization ensures that the restored image information moves towards the direction of clear images, distancing itself from the blurred image direction. The main contributions of this paper are as follows:
  • A new substation image dehazing method, SDCNet, is proposed, which is an efficient end-to-end architecture. SDCNet outperforms existing methods by using fewer parameters and lower computational overhead.
  • A Decomposition Convolution Enhancement Module is designed to effectively extract rich spatial features while avoiding additional parameters and computational costs. This module can serve as a plug-in to enhance the performance of both CNN and Transformer architectures.
  • An Adaptive Fusion Module is designed to effectively integrate features from the encoder and decoder, preserving key feature information.
  • A large-scale substation hazy image dataset is constructed, providing strong data support for future research.

2. Related Work

Single image dehazing methods can be classified as priorbased, CNNs-based, and Transformer-based methods.

2.1. Prior-Based Image Dehazing Methods

Many of these methods are fundamentally based on the atmospheric scattering model and incorporate handcrafted prior knowledge. The Dark Channel Prior (DCP) introduced by [9] estimates the medium transmission map by exploiting the statistics of haze-free outdoor images. In the work by [10], a color attenuation prior was employed, utilizing a linear model to deduce scene depth from hazy images. Meanwhile, ref. [11] proposed a dehazing strategy grounded in a Non-Local prior, which models clear image distributions using a large set of color clusters to approximate RGB values. However, such approaches that heavily depend on predefined priors often exhibit limited adaptability, making them less effective under varying environmental scenarios.

2.2. CNNs-Based Image Dehazing Methods

Owing to the impressive semantic representation capabilities of convolutional neural networks (CNNs) [12], numerous dehazing models based on CNN architectures have been developed. For instance, DehazeNet [13] applies CNNs to predict the transmission map and reconstruct clear images using the atmospheric scattering principle. FFA-Net [14] incorporates a feature fusion attention mechanism that dynamically merges spatial and channel-level features. AECR-Net [15] builds upon FFA-Net by adding downsampling operations and utilizing contrastive learning techniques to further enhance performance. MixDehazeNet [16] introduces a multi-scale framework with large-kernel convolutions and a parallel attention mechanism, enabling it to better represent fine textures and effectively tackle spatially varying haze. DEA-Net [17], on the other hand, adopts content-aware attention and detail-preserving convolution operations to enhance feature expressiveness and boost restoration quality. While these CNN-driven methods have achieved substantial progress, most prioritize increasing the depth and width of the network over expanding convolutional kernel sizes. This is primarily because enlarging kernels leads to a quadratic rise in both computation and parameter load, which severely impacts efficiency. In a related contribution, Bai Wanrong et al. [5] proposed the edge-aware feedback CNN (E-FCNN). However, their method falls short in handling the complex visual environments of substations due to its lack of multi-scale information processing. Additionally, the model described in [8] incorporates residual blocks with dense connections, detail refinement modules, and an enhanced CBAM attention mechanism. Although it delivers strong results in detail restoration, its high parameter count and limited effectiveness under low-light conditions remain notable drawbacks.

2.3. Transformer-Based Image Dehazing Methods

Since their introduction to the field of computer vision by [18], Transformer-based architectures—particularly Vision Transformers (ViTs)—have consistently outperformed traditional CNN-based methods in various tasks, including single image restoration. A notable example is Dehazeformer [19], which is constructed upon the Swin Transformer backbone and achieves markedly better results than earlier convolutional models on the SOTS benchmark [20]. Another model, DeHamer [21], introduces an innovative mechanism based on transmission-aware 3D positional encoding and integrates haze-density priors, enabling it to simultaneously model spatial arrangement and haze distribution. MB-TaylorFormer [22] improves long-range feature interaction by leveraging the MSAR module, which mitigates approximation issues in softmax-attention through Taylor series expansion. This network further benefits from a multi-scale, multi-branch framework designed to generate tokens with varying receptive fields and layered semantic understanding. In parallel, other studies such as [23,24] adapt CNNs into Transformer-like forms, showing comparable performance. Nevertheless, these methods frequently invest significant computational effort into token-level operations, while failing to sufficiently consider the varied significance of channel-wise features during feature normalization (FN), thus hindering overall learning and inference efficiency.

3. Materials and Methods

The overall architecture of the proposed SDCNet is illustrated in Figure 1. The network follows an encoder–decoder design, aiming to learn a mapping function f that transforms a blurred substation image I R H × W × 3 into its restored version J ^ R H × W × 3 , where J ^ = f ( I ) . Initially, the input image I is processed through a 3 × 3 convolution layer to extract shallow feature maps F l R H × W × C , with H, W, and C representing the height, width, and channel dimension, respectively. These features are then fed into a symmetric three-stage encoder–decoder structure to progressively capture deeper semantic information, resulting in the final feature representation F 5 R H × W × C . In this architecture, depthwise separable convolutions are utilized in both downsampling and upsampling layers to efficiently manage channel transformations. Additionally, the conventional residual connections are replaced by the AFM module to improve feature interaction and reconstruction performance. By utilizing feature-guided channel attention and spatial attention, it effectively integrates the interdependent features of the encoder and decoder, reduces feature redundancy, and enhances the image enhancement effect in complex scenes. A 3 × 3 convolution operation is applied to the obtained F 5 , and finally, soft reconstruction [19] is used instead of global residuals to provide stronger image enhancement constraints than global residuals, thereby optimizing network performance. After obtaining the restored image J ^ , the CRM module defines the restored image J ^ , the clear substation image J, and the blurred substation image I as anchor, positive anchor, and negative anchor; computes the contrastive loss; and integrates it into the overall loss, utilizing the blurred substation image to assist model training.

3.1. Decomposed Convolution Enhancement Module

To address the issues of excessive parameters and computational complexity in existing substation image enhancement networks, inspired by the study [25], we designed a Decomposed Convolution Enhancement Module (DCEM). As shown in Figure 2, it primarily consists of a Decomposed Convolution Module (DCM) and an Enhanced Mix Attention Module (EMAM). Specifically, the input features F i first undergo normalization and a pointwise convolution to generate shallow-level features. Subsequently, depthwise separable convolutions with kernel sizes of 3 × 3 and 5 × 5 are applied to extract multi-scale feature maps, which are then aggregated through summation. The combined features are further processed by a depthwise separable dilated convolution with a dilation rate of 3 and kernel size of 5 × 5 to capture global deep-level representations. Finally, the output features F D C M are obtained through a pointwise convolution combined with residual connection.
The calculation formula for the convolution parameter quantity P ( K , d ) and the computational quantity FLOPs F ( K , d ) is as follows:
P ( K , d ) = C K d 2 × C + ( 2 d 1 ) 2 ,
F ( K , d ) = P ( K , d ) × H × W .
In the formulas, K denotes the convolution kernel size, and d represents the dilation rate. As the kernel size increases, the parameter discrepancy becomes more pronounced, with the parameter count of 13 × 13 standard convolution significantly exceeding that of 5 × 5 depthwise separable convolution. To address this, the 13 × 13 standard convolution is decomposed into a depthwise separable convolution with kernel sizes of 5 × 5 and a depthwise separable dilated convolution with a dilation rate of 3 and kernel size of 5 × 5 , thereby reducing parameter complexity, as illustrated in Figure 3. Consequently, the Decomposed Convolution Module (DCM) achieves comparable receptive fields to standard convolution with fewer parameters. Simultaneously, the two depthwise separable convolutions with different kernel sizes in DCM capture multi-scale features, effectively enhancing detail textures and color restoration in images. To improve the effective utilization of critical channels, the Enhanced Mix Attention Module (EMAM) is introduced after DCM. EMAM processes the output features F D C M from DCM through parallel pixel attention and channel attention mechanisms to generate the final output features F E M A M . The pixel attention mechanism efficiently extracts position-dependent informative features, while the channel attention mechanism extracts global information and ensures the network focuses on channels containing more critical information.

3.2. Adaptive Fusion Module

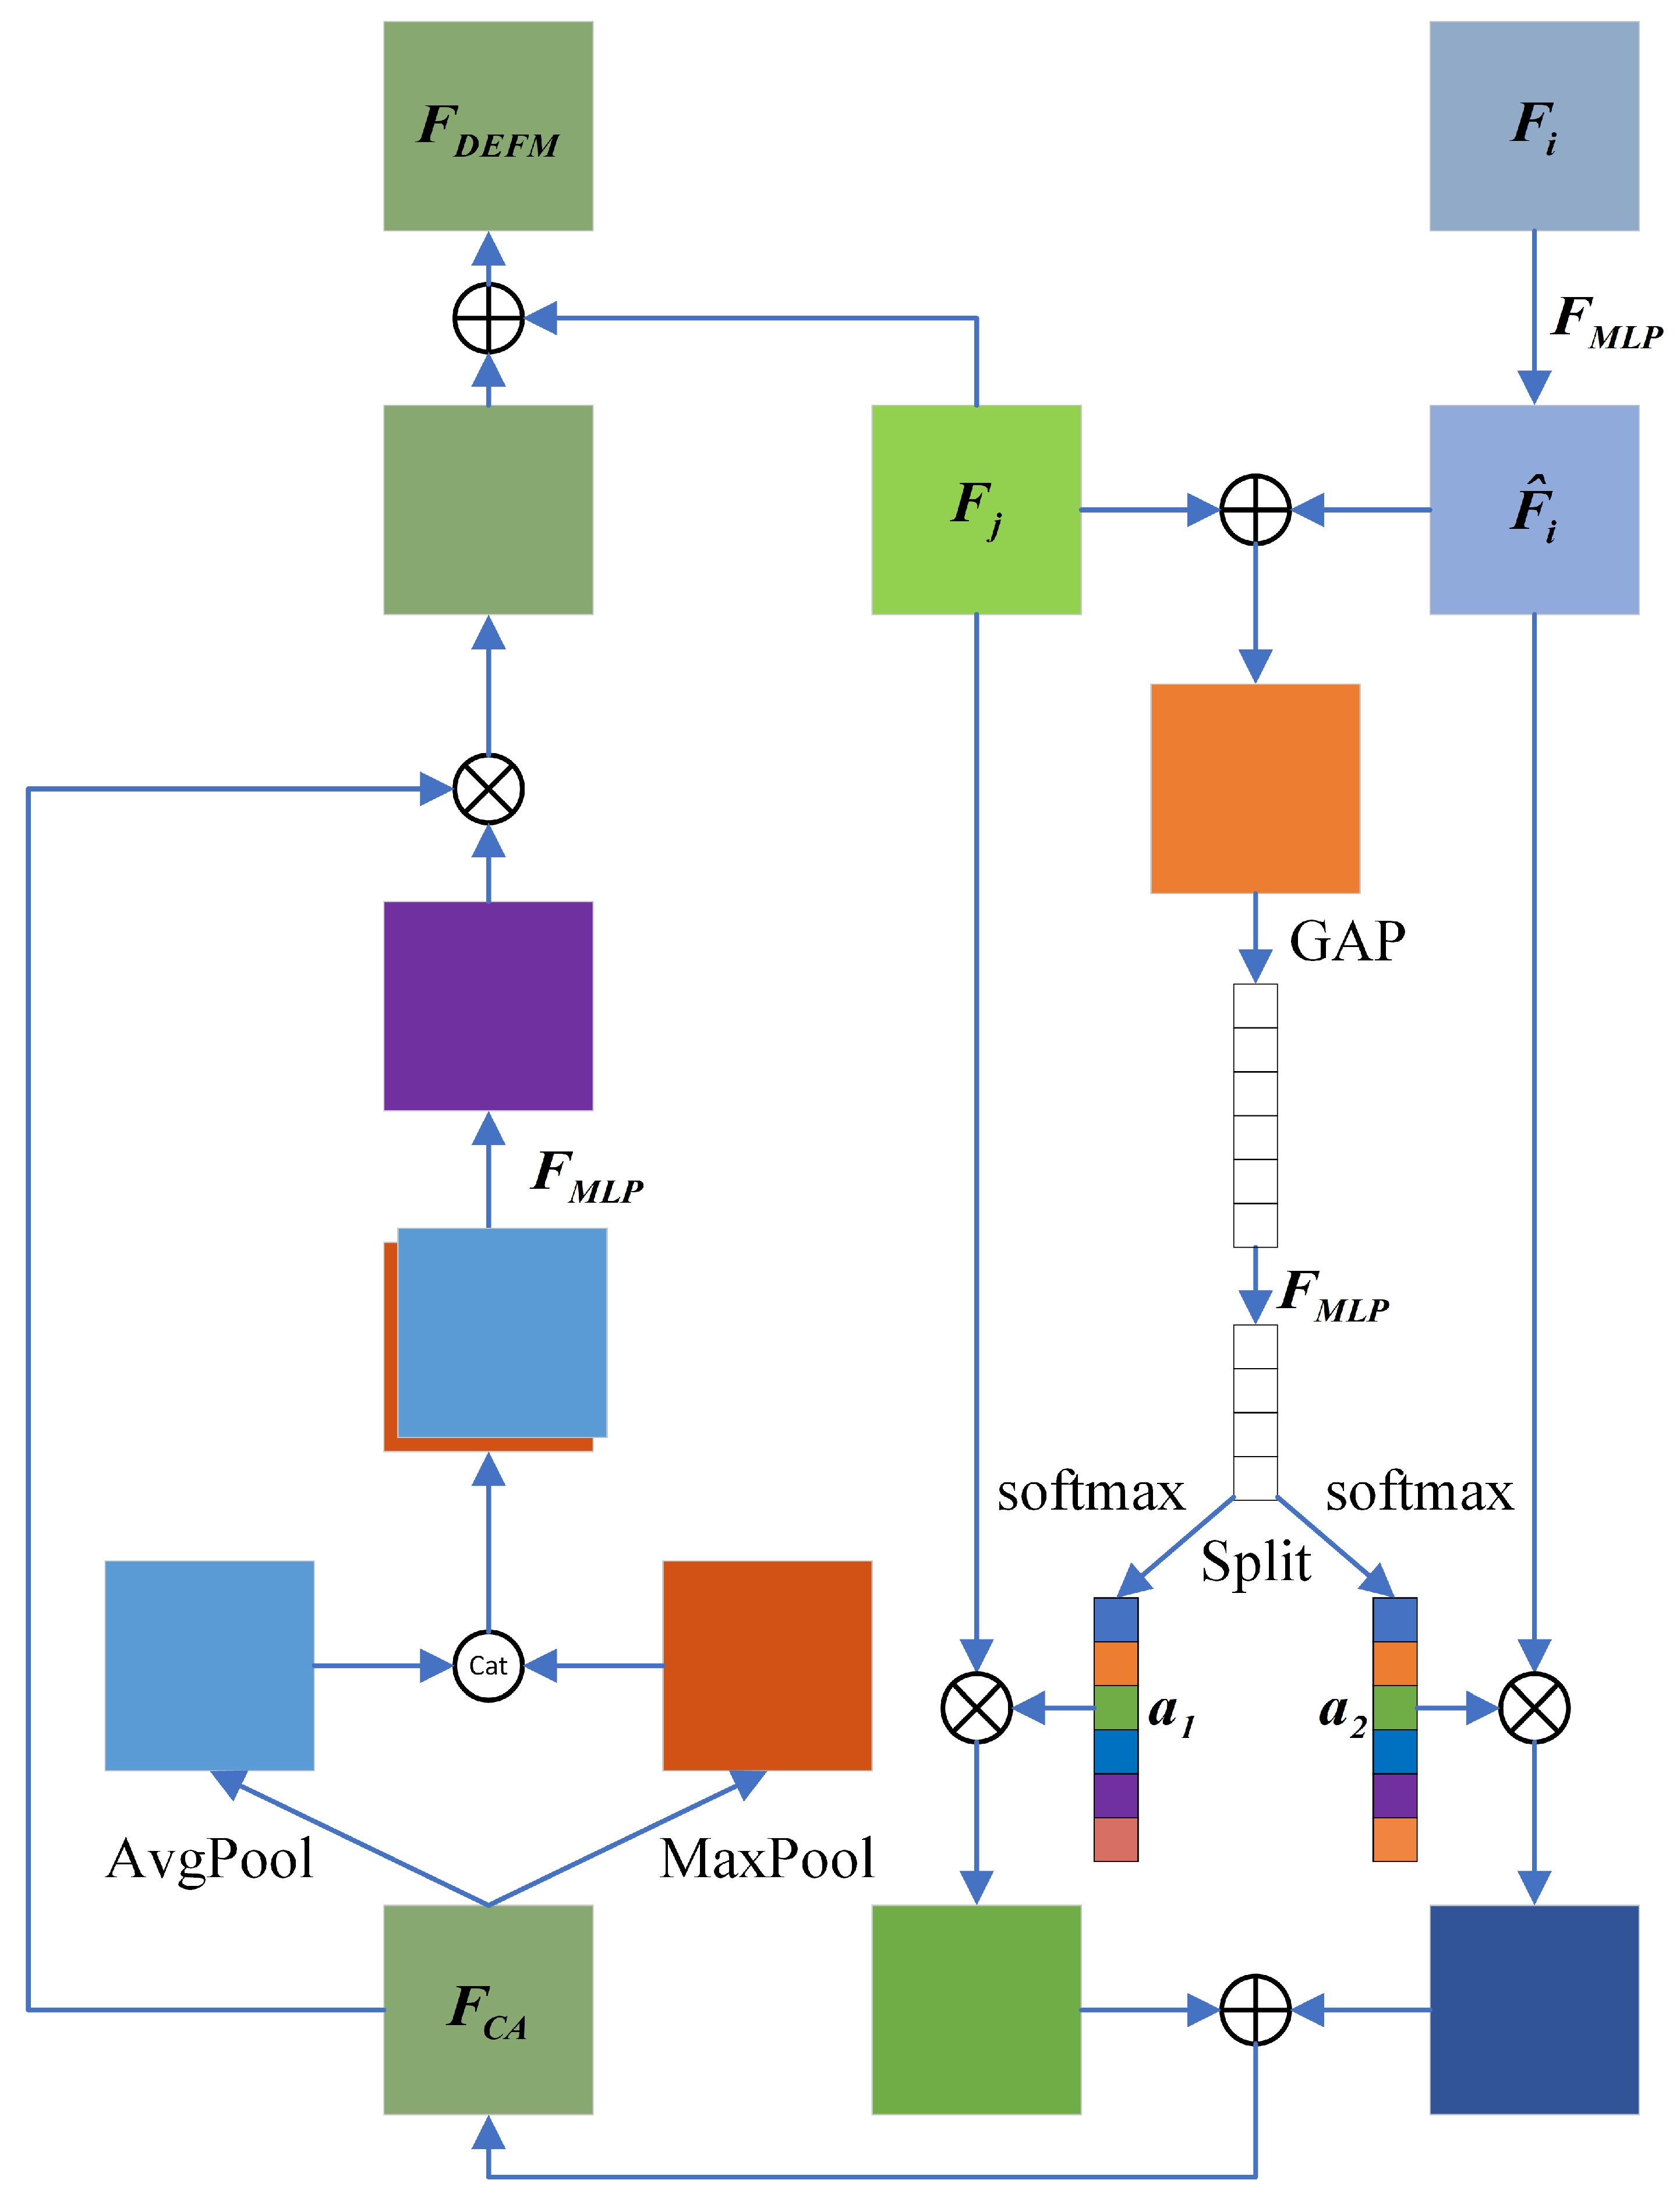
Existing image enhancement networks typically fuse encoder and decoder features via addition or concatenation to improve network performance. While such fusion strategies preserve color and detail information from shallow encoders and semantic information from deep decoders, thereby reducing information loss, they may still suffer from feature redundancy and inefficient information utilization. Feature redundancy occurs when the model learns or processes the same or very similar information multiple times, leading to unnecessary duplication. This wastes computational resources. Inefficient information utilization refers to the model’s failure to effectively use the features it has learned, not fully exploiting the value of the available data. This limitation becomes particularly evident in complex substation environments, where over-reliance on addition or concatenation can lead to background blurring and color distortion. Inspired by the study [19], we introduce an Adaptive Fusion Module (AFM). This module adaptively learns the weights or interdependencies between features to effectively integrate mutually dependent encoder–decoder features, producing more expressive and discriminative representations while mitigating redundant features. The AFM is specifically designed to address the challenges of dynamically varying substation environments. As shown in Figure 4, the AFM architecture processes multi-level features through learnable attention weights and cross-scale interactions, optimizing feature compatibility and enhancing robustness.
Let F i and F j represent the encoder and decoder features, respectively. Initially, a linear layer projects F i to F ^ i . Subsequently, global average pooling (GAP), followed by an MLP layer, softmax activation, and a split operation, are applied to compute the fusion weights.
{ a 1 , a 2 } = Split ( Softmax ( F M L P ( GAP ( F ^ i + F j ) ) ) .
Next, the encoder and decoder features are fused using the weights { a 1 , a 2 } :
F C A = a 1 F ^ i + a 2 F j .
Finally, spatial attention is applied, and a short residual connection is added to obtain the final fused features:
F A F M = F j + F C A × ( F M L P ( Cat ( MaxPool ( F C A ) , AvgPool ( F C A ) ) ) .
Here, × denotes element-wise multiplication, Cat(·) represents concatenation along the channel dimension, and F M L P refers to a linear layer.

3.3. Loss Function

Motivated by [15], we propose a Contrastive Regularization Module (CRM) that leverages both blurred and sharp substation images to guide the training process of the image enhancement network. For effective contrastive regularization, two key elements are needed: creating positive/negative pairs and establishing an appropriate latent feature space for comparison. In our approach, the clear and restored images form a positive pair, while the blurred and restored images constitute a negative pair. As depicted in Figure 1, the restored image acts as the anchor, with the clear and blurred images representing the positive and negative samples, respectively. To define the latent space, we use a fixed ResNet-152 model [26] to extract intermediate features, facilitating the computation of contrastive loss between the anchor, positive, and negative samples. The loss function is expressed as follows:
min | | J J ^ | | + β · ρ ( R ( I ) , R ( J ) , R ( J ^ ) ) .
In Equation (6), J ^ denotes the restored substation image, J represents the clear substation image, and I signifies the blurred substation image. The first term corresponds to the reconstruction loss, calculated using L1 loss. The second term, ρ , in Equation (6), reflects the contrastive regularization applied to I, J, and J ^ within a shared latent space. This term pulls the restored image J ^ closer to the clear image J, while pushing it farther from the blurred image I. R stands for the ResNet-152 model, and β is a hyperparameter that controls the trade-off between the reconstruction loss and contrastive regularization terms. To enhance the contrastive capability, latent features are extracted from multiple layers of a pre-trained fixed model.
Therefore, the loss function in Equation (6) can be further formulated as follows:
min | | J J ^ | | + β i = 1 n w i · D ( R i ( J ) , R i ( J ^ ) ) D ( R i ( I ) , R i ( J ^ ) ) .
Among them, R i = 1 , 2 , , n represents the i-th hidden feature extracted from a fixed pre trained model, D (x, y) represents the L1 distance between x and y, and w is the weight coefficient. Equation (7) can be trained end-to-end through an optimizer.

4. Experimental Results and Analysis

4.1. Dataset and Pre-Processing

To evaluate the effectiveness of the proposed approach, a synthetic generation algorithm was utilized to create the MIIS substation blur dataset based on an existing image repository. This dataset consists of 7000 image pairs, each comprising a blurred substation photo and its corresponding sharp reference. Example visuals are presented in Figure 5, showcasing various substation components—such as transformer housings, switches, and insulators—captured under adverse conditions like poor lighting and color aberrations. In order to enhance the model’s resilience, data augmentation strategies—including image scaling, rotation, and spatial translation—were implemented, effectively doubling the dataset to 14,000 image pairs. All samples were consistently resized to dimensions of 620 × 460 pixels. The expanded dataset was partitioned into training, validation, and testing subsets using a 12:1:1 split, yielding 12,000 pairs for training and 1000 each for validation and testing. To further examine the method’s adaptability across domains, additional tests were performed using the RESIDE benchmark dataset [20]. Specifically, the Indoor Training Set (ITS) and Outdoor Training Set (OTS) served as domain-adapted training sets, while the Synthetic Objective Testing Set (SOTS) was employed to assess dehazing accuracy on artificially hazy imagery.

4.2. Experimental Settings and Training Details

All experiments were conducted on an Ubuntu 18.04 LTS system, utilizing the PyTorch 1.13.1 deep learning framework for training, validation, and evaluation. The hardware configuration consisted of an Intel Xeon Silver 4114 CPU and an NVIDIA Tesla V100 GPU (with 16 GB of memory), while the software environment included CUDA 11.1 and Python 3.7.
The optimization of the SDCNet model was carried out using the ADAMW optimizer [27], with exponential decay values set to β 1 = 0.9 and β 2 = 0.999 . The initial learning rate was set at 0.0002 and was progressively decreased according to a cosine annealing schedule. The model was trained for 100 epochs, with a batch size of 10.

4.3. Evaluation Metrics

To evaluate the effectiveness of image enhancement, a variety of commonly used metrics are employed, such as Peak Signal-to-Noise Ratio (PSNR), Structural Similarity Index Measure (SSIM), Feature Similarity Index Measure (FSIM), Entropy, and the Perception-based Image Quality Evaluator (PIQE). Of these, SSIM measures the structural similarity between two images, with higher values indicating a closer match to the reference image in terms of luminance, contrast, and structural elements. For two images, x and y, the SSIM is calculated according to the formula presented in Equation (8):
SSIM ( x , y ) = ( 2 u x u y + c 1 ) ( 2 σ x y + c 2 ) ( u x 2 + u y 2 + c 1 ) ( σ x 2 + σ y 2 + c 2 ) .
In the equation, u x and u y denote the means of x and y, respectively; σ x 2 and σ y 2 represent the variances of x and y; σ x y is the covariance between x and y; and c 1 and c 2 are constants introduced to ensure numerical stability.
PSNR quantifies the ratio between the peak signal power and the average noise power in an image, serving as an indicator of distortion in the enhanced image. A higher PSNR value suggests greater similarity between the two images. Its formula is given in Equation (9):
P S N R = 10 × log 10 ( 2 n 1 ) 2 L 2 .
The FSIM value is higher, indicating that the enhanced image is closer to the normal lit image in terms of image features.
Entropy is an indicator for evaluating the amount of information contained in an image, represented as follows:
Entropy = i = 1 n [ p ( x i ) log p ( x i ) ] .
In the formula, p ( x i ) denotes the probability of selecting x i ; greater entropy reflects a higher amount of information in the image.
PIQE is an image quality evaluation metric that does not require a reference, used to assess the perceptual quality of images.
PIQE = ( k = 1 N S A S k ) + C N S A + C ,
S k = 1 , V b l k , 1 V b l k .
In the equation, C represents a constant with a fixed value, V b l k denotes the distortion parameter, and N S A is the total count of spatially active blocks. A lower PIQE score indicates better image quality.

4.4. Experimental Results

To evaluate the effectiveness of SDCNet, a series of tests were conducted on the MIIS and RESIDE datasets. The performance of SDCNet was compared with six other state-of-the-art methods: DCP [9], CLAHE [28], AOD-Net [29], FFA-Net [14], GridDehazeNet [30], and DEA-Net [17]. These tests were performed using the standard configurations provided by each of the methods.

4.4.1. Test Results on MIIS

The performance evaluation of SDCNet and its counterparts on the MIIS test set is shown in Table 1, where the highest values are marked in bold. As illustrated in Table 1, SDCNet outperforms all other methods across various metrics, including Peak Signal-to-Noise Ratio (PSNR), Structural Similarity Index (SSIM), Feature Similarity Index (FSIM), and Information Entropy (IE), highlighting its superior performance. For instance, when compared to DEA-Net, SDCNet achieves a PSNR improvement of 4.053, SSIM by 0.006, and Entropy by 0.156, indicating enhanced haze removal and more detailed information in the processed images. The most substantial enhancement is observed in FSIM, with a 0.048 gain, and SDCNet also shows the highest PSNR increase, reaching 24.514. Furthermore, the images processed by SDCNet demonstrate lighting that aligns more closely with real-world conditions.
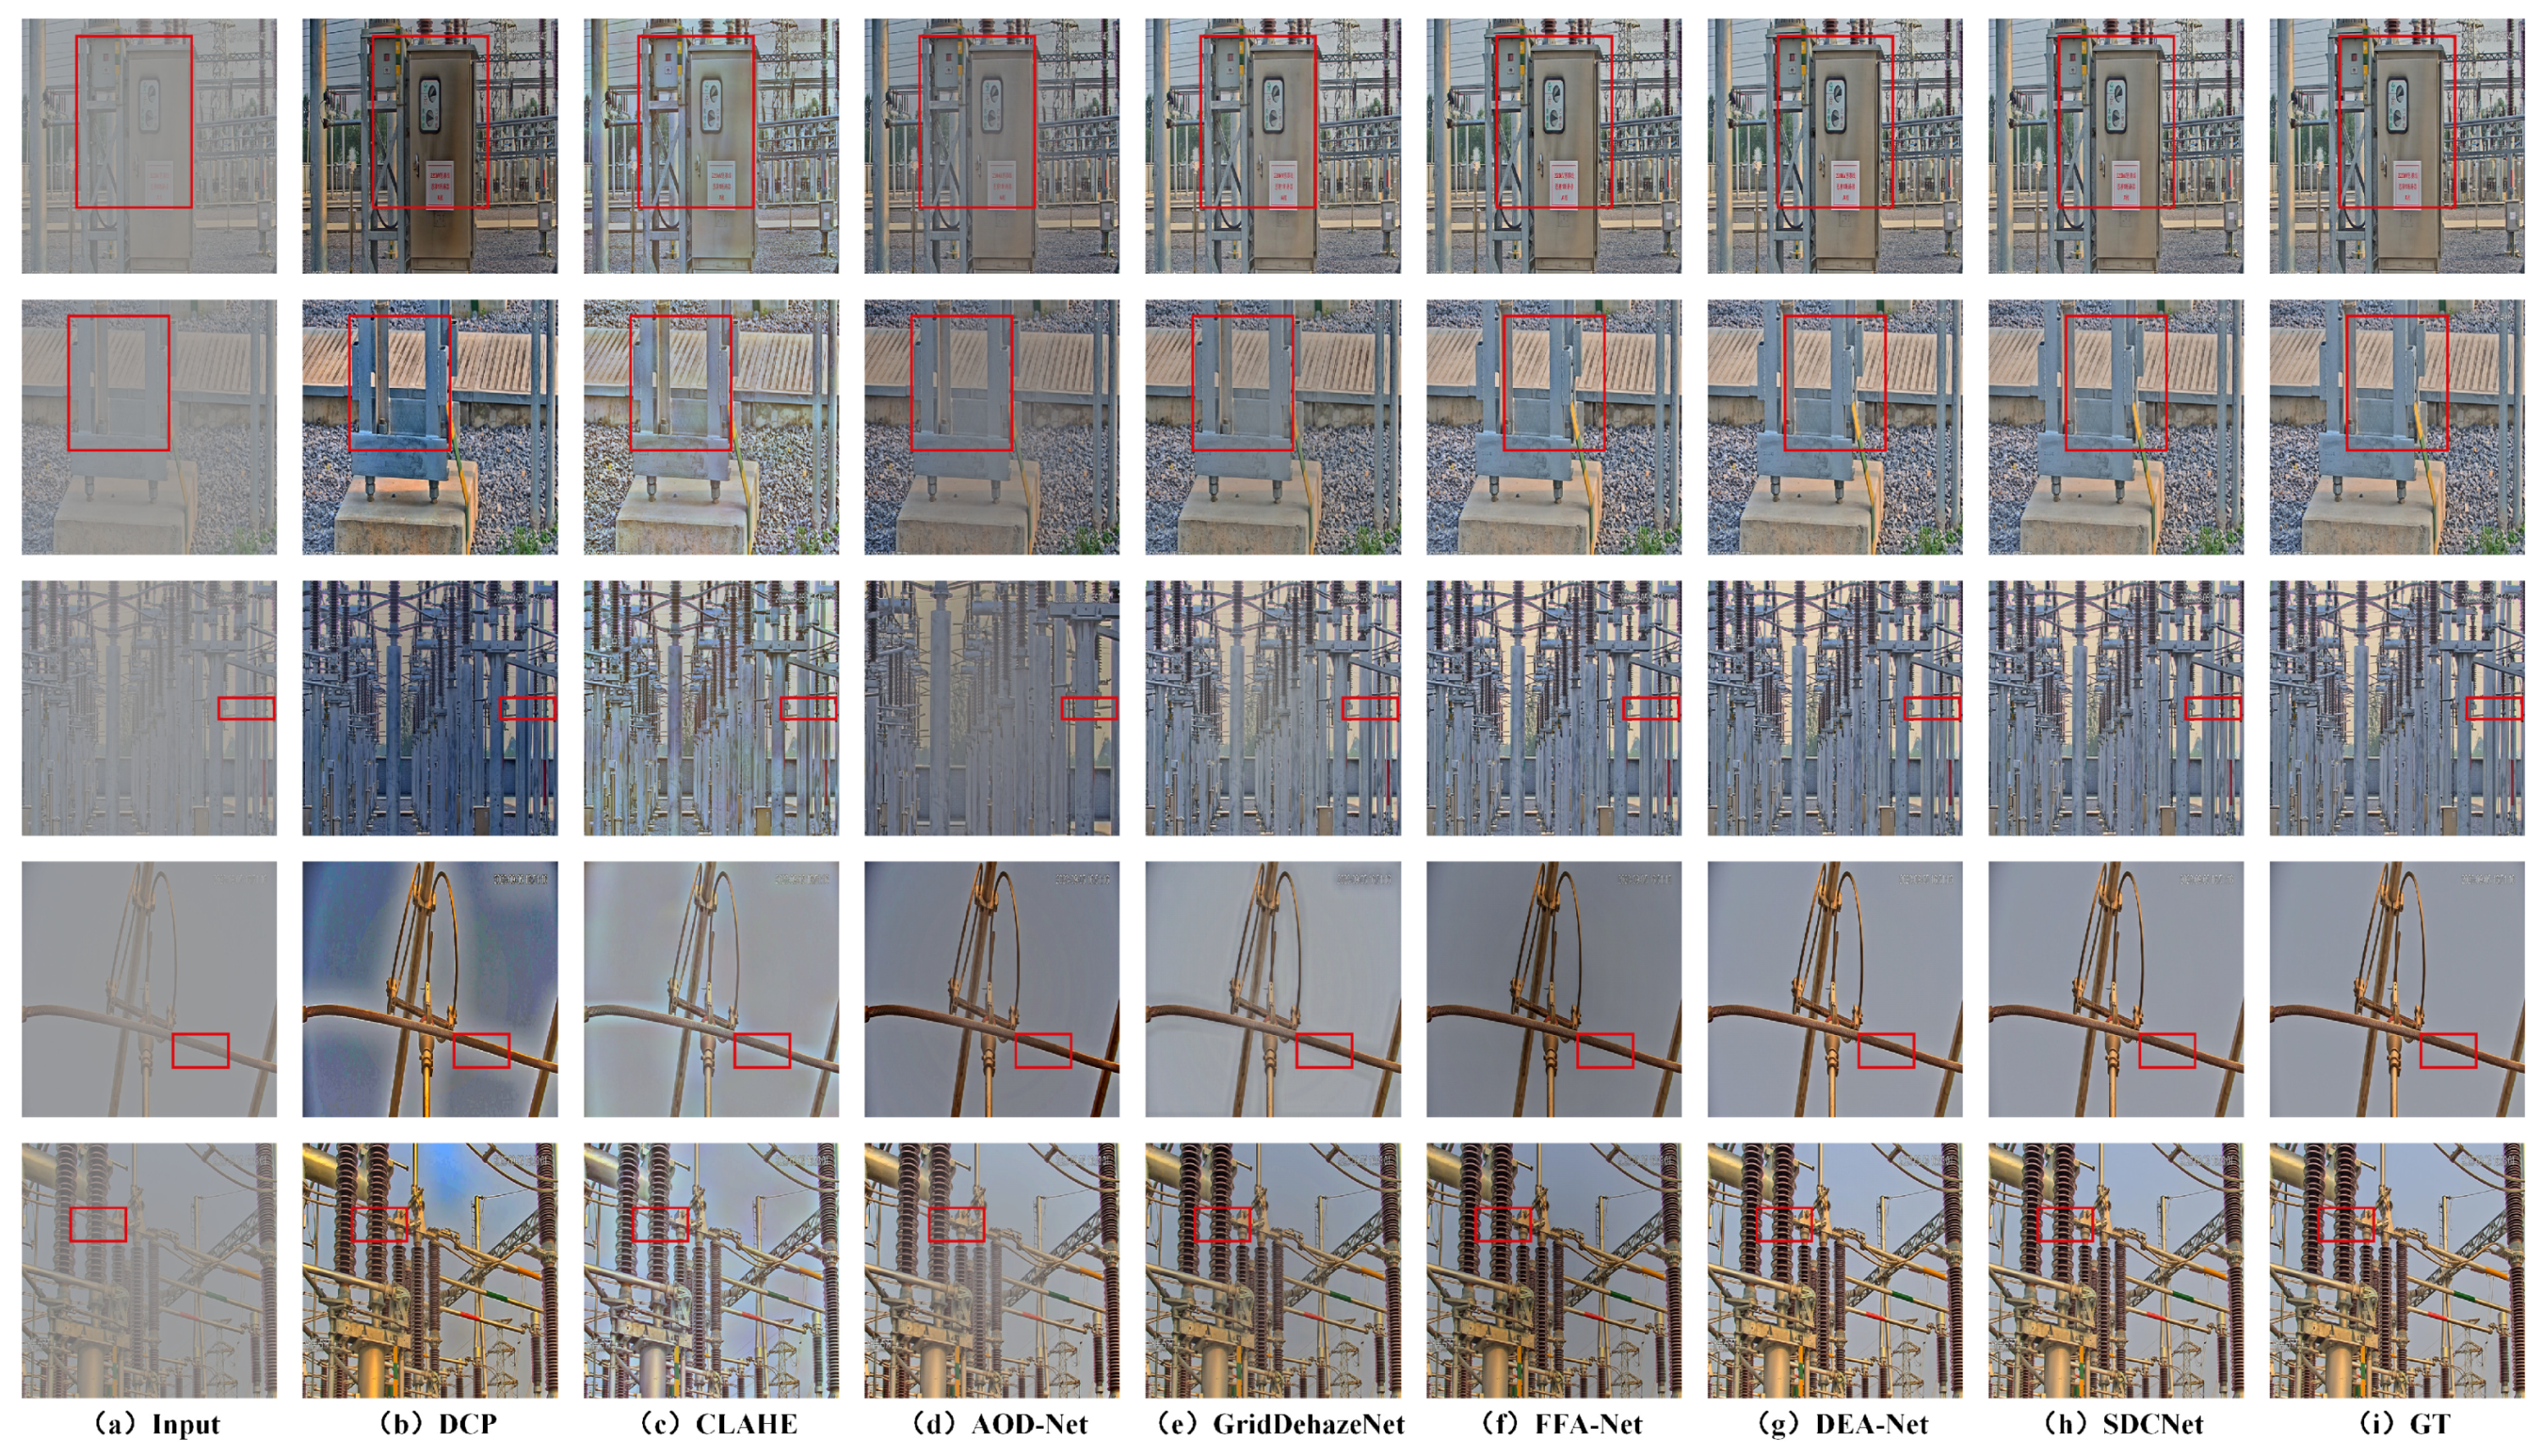
For qualitative analysis, five blurred substation images from the MIIS test set are selected, and the enhancement results of SDCNet and other methods are presented in Figure 6. In Figure 6a, the blurred substation images are shown, while (i) displays the corresponding clear substation images. By comparing the results of various methods, it is evident that the DCP method suffers from color distortion, as seen in the first and fourth rows of Figure 6b. Although the CLAHE algorithm offers improved color processing over DCP, it still shows noticeable blurring and poor edge preservation—particularly in the third and fourth rows of Figure 6c, with the latter exhibiting more severe degradation. AOD-Net offers noticeable improvements in detail restoration but still leaves haze residuals, as observed in the third and fifth rows of Figure 6d. GridDehazeNet, FFA-Net, and DEA-Net all show considerable enhancements, yet FFA-Net introduces unnatural sky colors in the fourth row of Figure 6f, and GridDehazeNet requires further refinement in detail handling. In contrast, SDCNet produces images with natural colors and well-preserved details, without any color distortion. Based on the analysis of Figure 6 and Table 1, it is clear that SDCNet outperforms other methods in both qualitative and quantitative assessments on the MIIS test set.

4.4.2. Test Results on RESIDE

Table 2 presents the performance of SDCNet and other competing methods on the SOTS dataset, with bold values indicating the highest metrics. As can be seen, CLAHE shows the lowest values for Peak Signal-to-Noise Ratio (PSNR) and Structural Similarity Index (SSIM) on this dataset. Despite its simple architecture, SDCNet achieves the highest PSNR and SSIM scores on the SOTS indoor set and attains the best SSIM on the outdoor set. For example, when compared to DEA-Net, SDCNet improves PSNR by 0.05 and SSIM by 0.001 on the indoor benchmark.
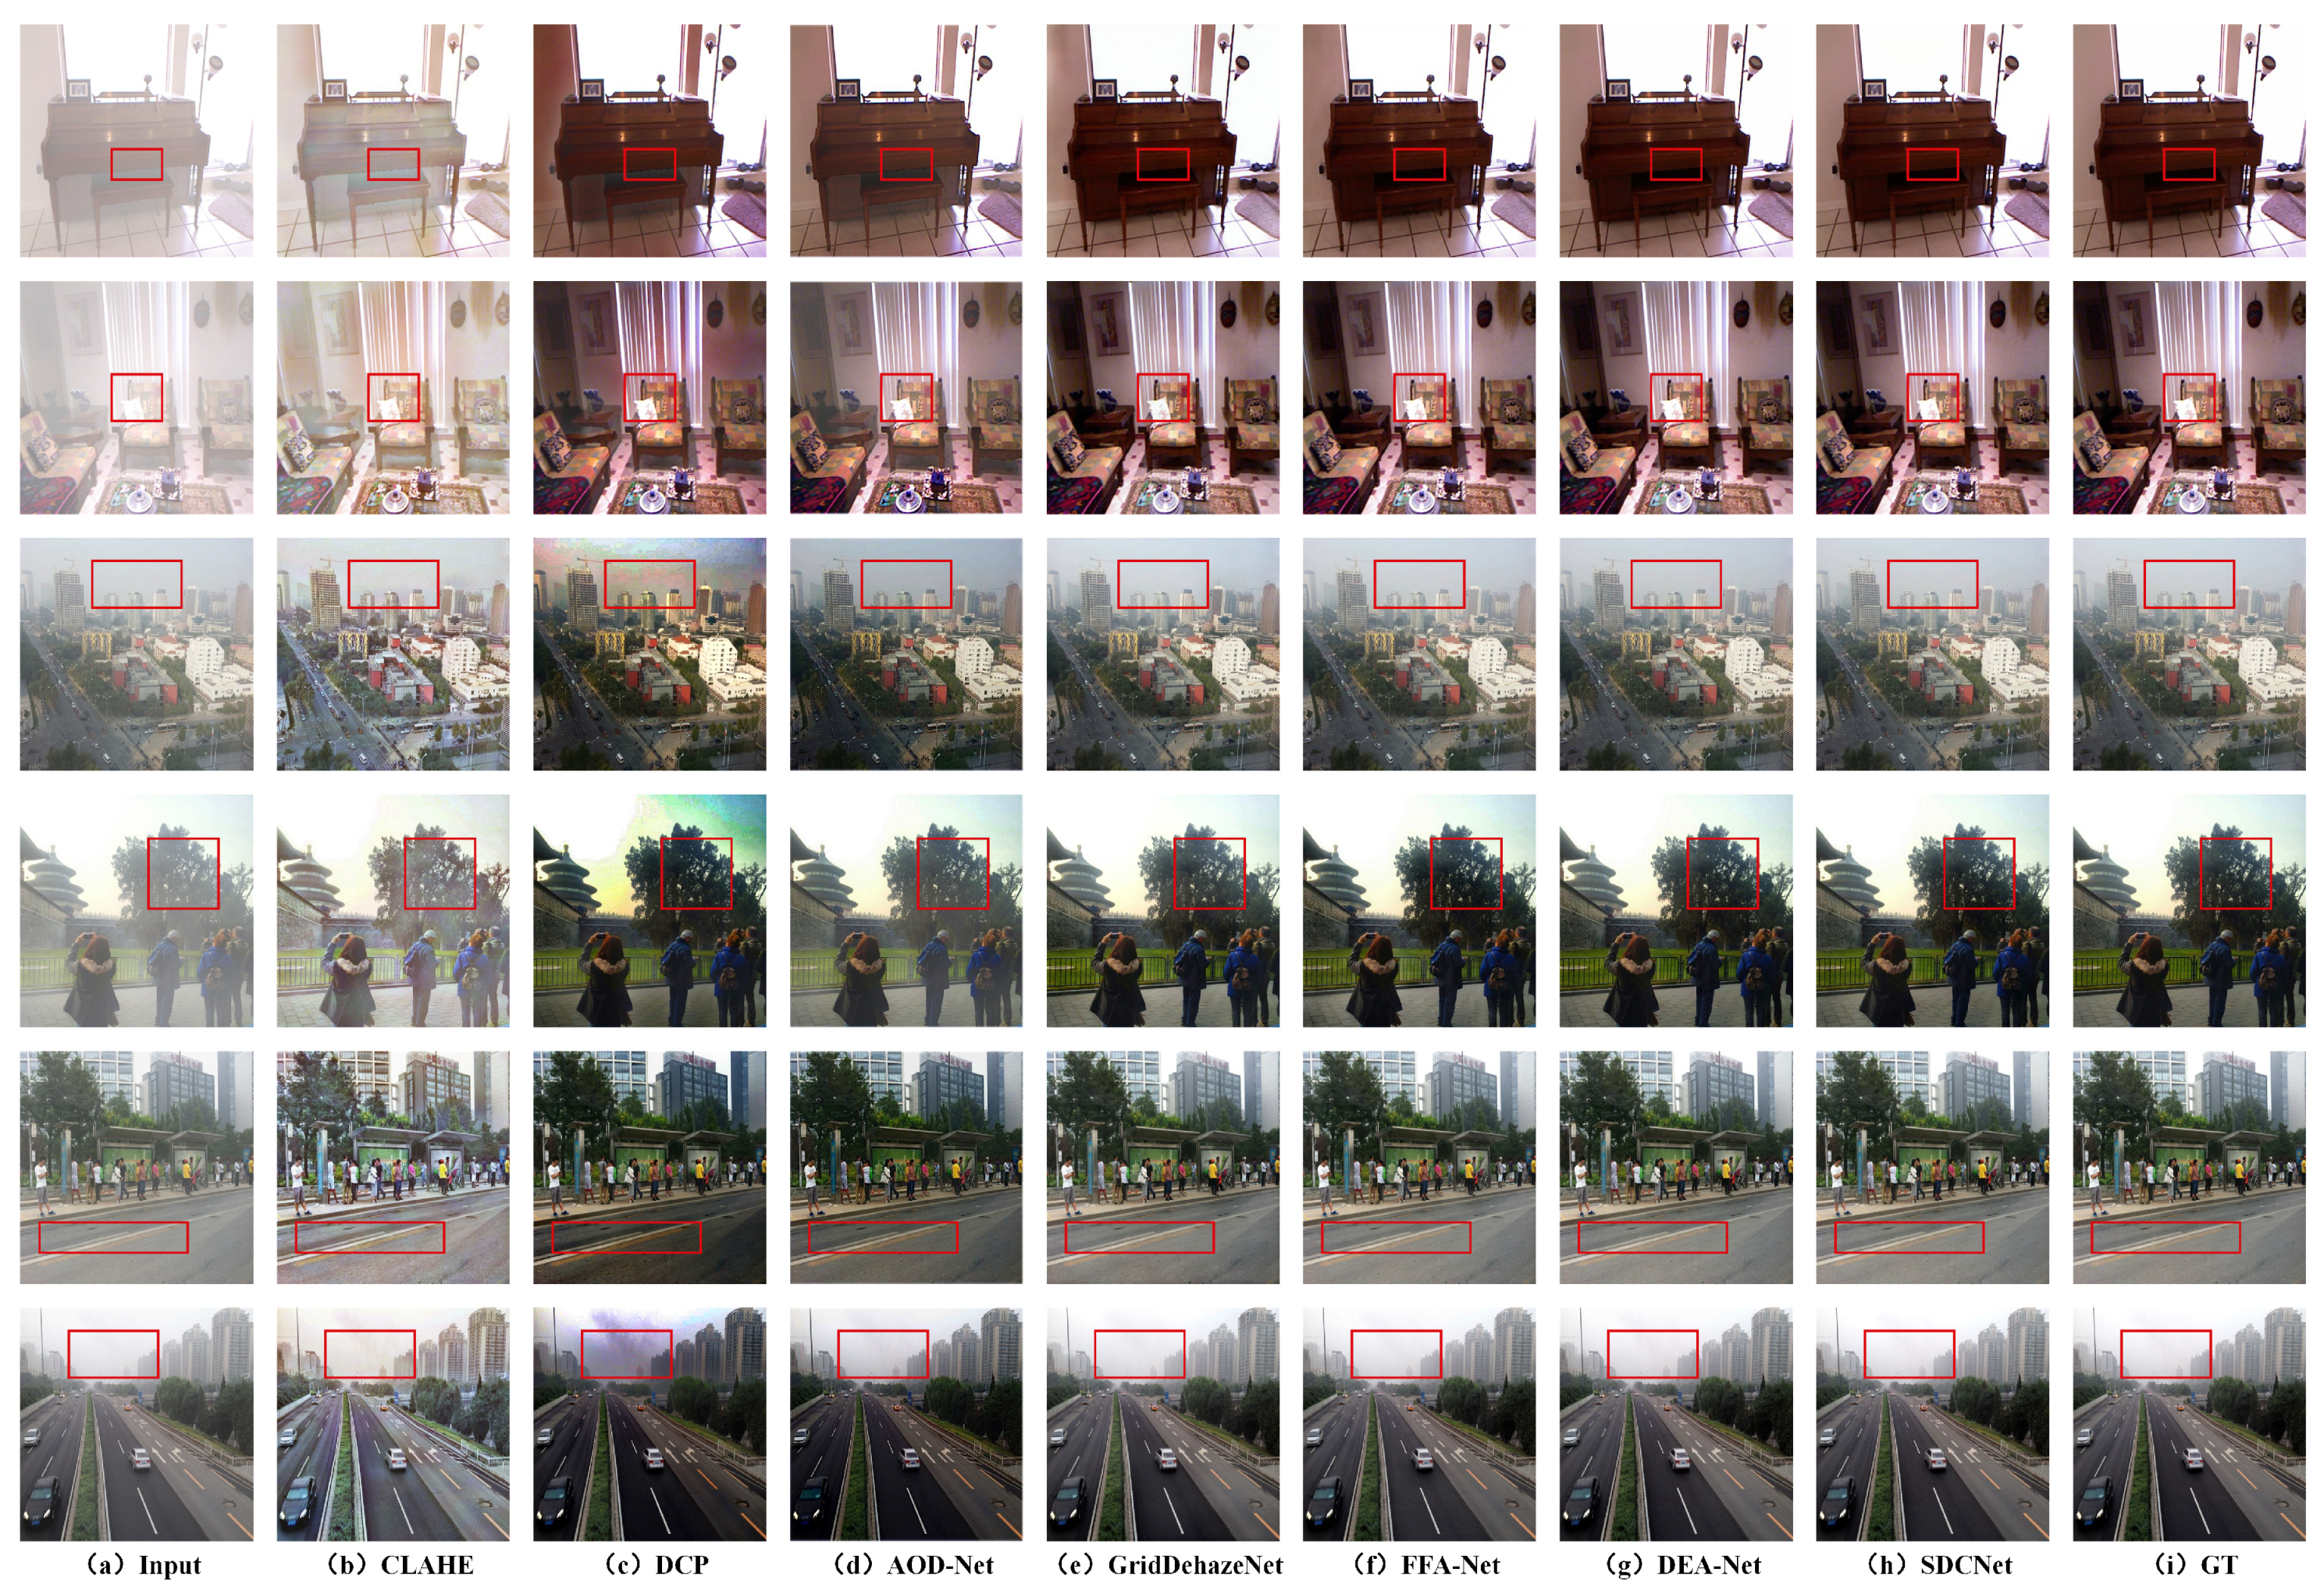
For qualitative analysis, two indoor and four outdoor images from the SOTS dataset were selected, with the dehazing results for SDCNet and other methods shown in Figure 7. In this figure, (a) displays the hazy images, and (i) illustrates the corresponding clear images. DCP performs well in regions with uniform color and minimal haze, but it struggles with sky color distortion, as observed in the third and sixth rows of Figure 7c. AOD-Net, however, introduces noticeable blurring around edges, especially in the first row of Figure 7d. While GridDehazeNet, FFA-Net, and DEA-Net show considerable improvement in haze removal, GridDehazeNet still suffers from edge blurring, as seen in the third row of Figure 7e. Among all the methods, the images processed by SDCNet are the most similar to the clear reference images.

4.4.3. Parameter Comparison

Table 3 presents the number of parameters, the average PSNR and SSIM values on the MIIS test set, and the average processing time per image for GCANet [31], GridDehazeNet [30], MSBDN [32], FFA-Net [14], and SDCNet.
As shown in Table 3, SDCNet has the fewest parameters and the fastest processing time. Additionally, SDCNet delivers the highest PSNR and SSIM values. Despite having the least number of parameters, SDCNet achieves the best performance in both PSNR and SSIM, highlighting its efficiency and outstanding performance.

4.5. Ablation Experiments

To evaluate the effectiveness of the proposed key modules, ablation studies were performed on the Decomposed Convolution Enhancement Module (DCEM), Adaptive Fusion Module (AFM), and Contrastive Regularization Module (CRM). The baseline model was created by replacing DCEM with a standard 5 × 5 convolution, substituting AFM with a basic skip connection, and omitting CRM. The modules were then added sequentially to the baseline model, and the results are presented in Table 4.
As shown in Table 4, comparing the results of the baseline and baseline + DCEM experiments, the incorporation of DCEM resulted in notable improvements in both average PSNR and SSIM, with increases of 4.084 and 0.01, respectively, while only adding 0.0201 M parameters. Under the same experimental setup, AFM and CRM were sequentially added to baseline + DCEM. The results indicate that adding AFM increased the parameter count by 0.0014 M and improved the average PSNR by 1.874, while the inclusion of CRM did not affect the parameter count but still improved the average PSNR by 2.863. In conclusion, the proposed modules, Decomposed Convolution Enhancement Module (DCEM), Adaptive Fusion Module (AFM), and Contrastive Regularization Module (CRM), effectively enhance the performance of the substation image enhancement network.

4.6. Application

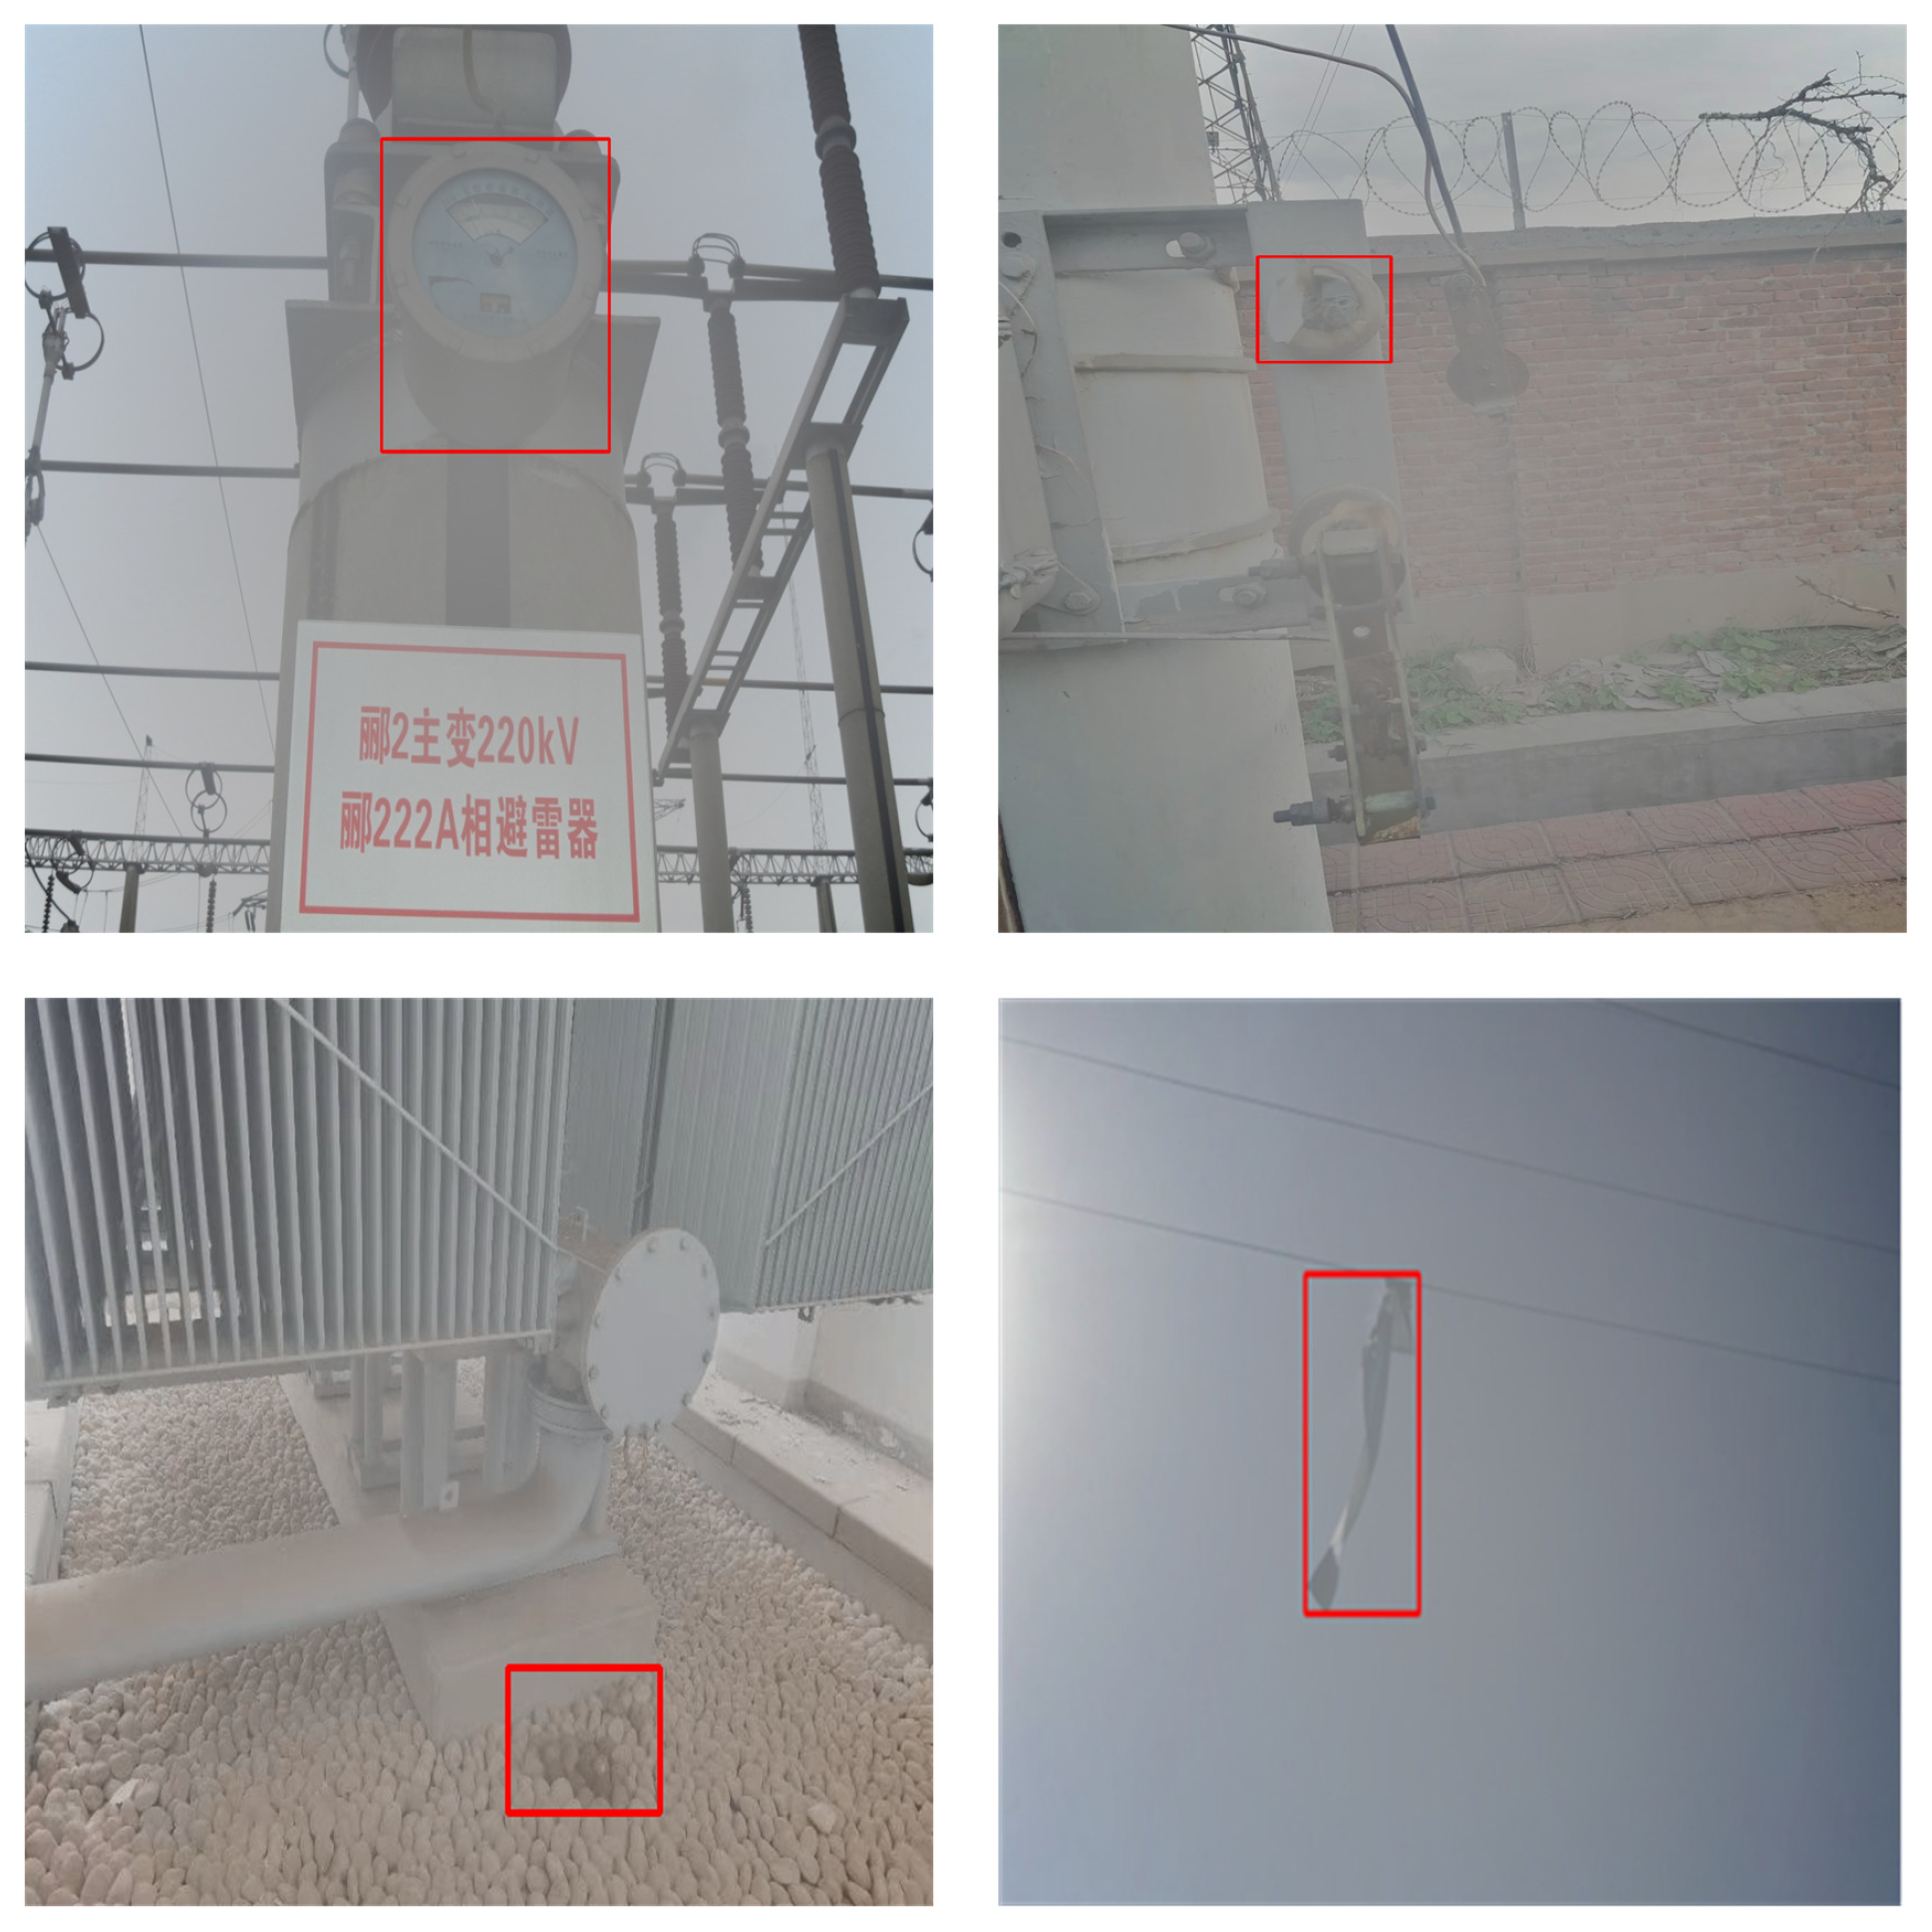
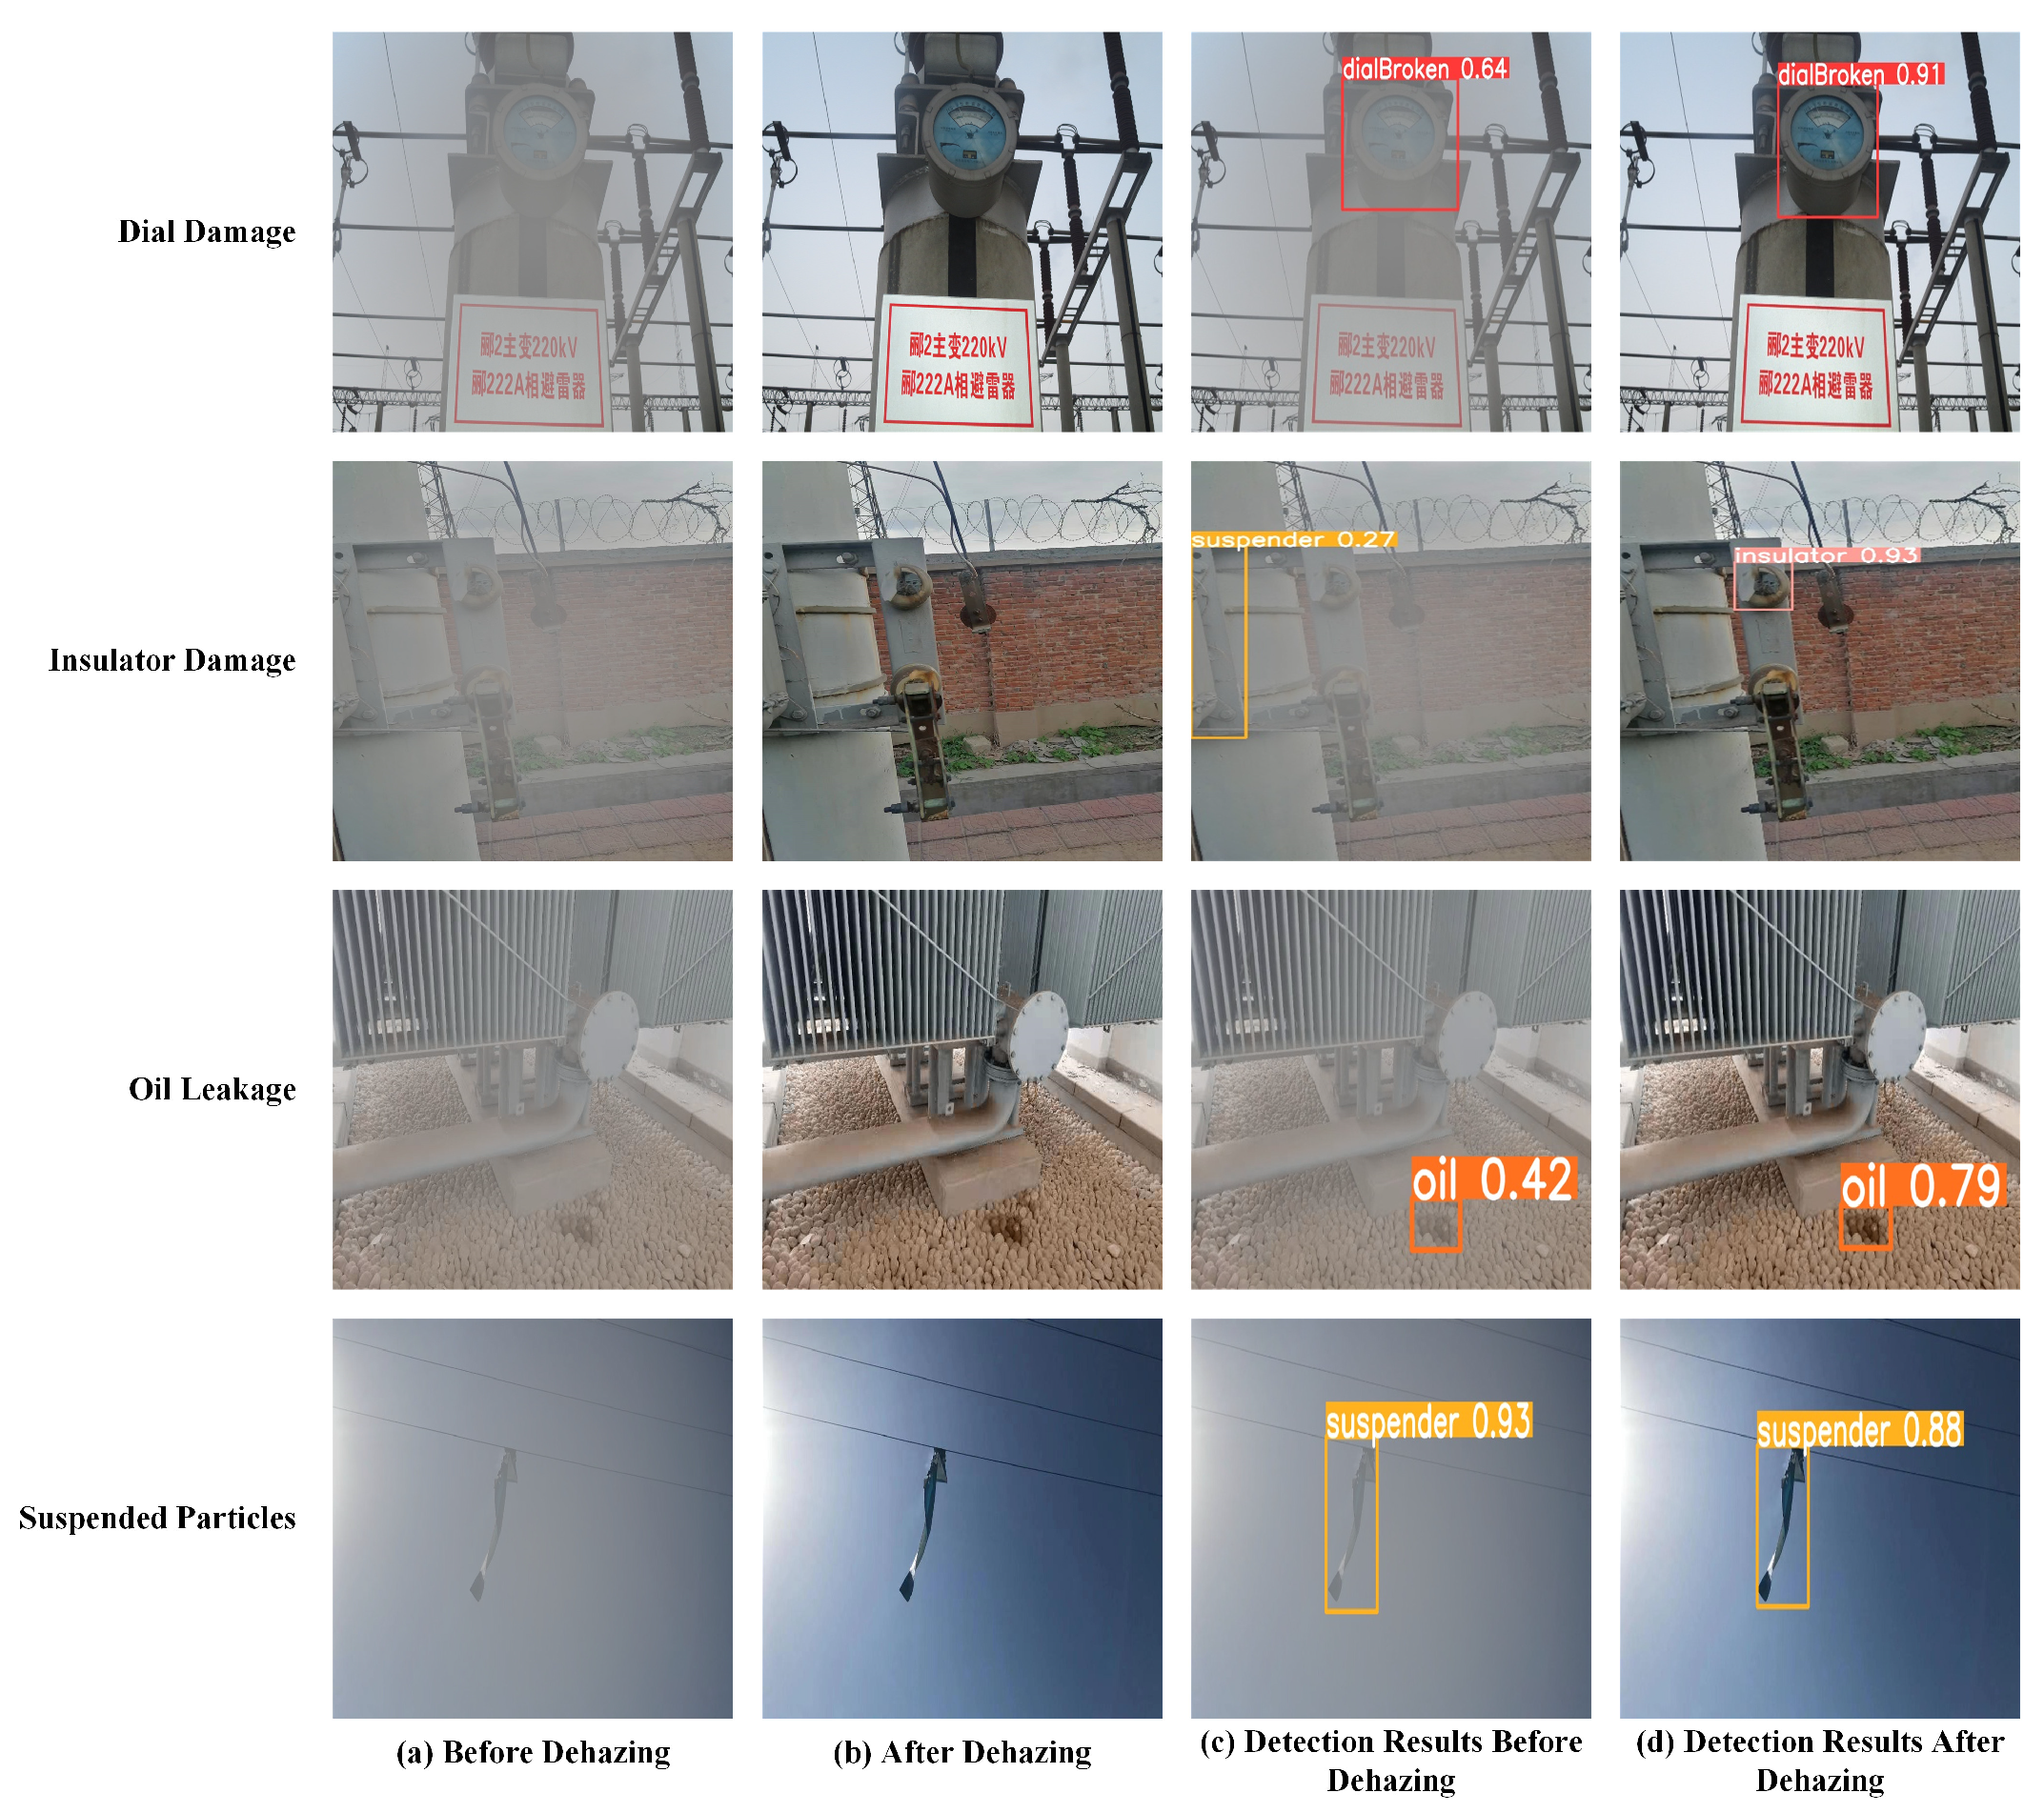
To evaluate the effectiveness of the proposed method, a substation blurred defect image dataset, named SSDF, was constructed based on existing datasets and real-world testing data. Sample images from this dataset are shown in Figure 8. The proposed algorithm was applied to enhance these images, and object detection experiments were conducted using YOLOv5s on both the original blurred images and the enhanced images. The detection performance was evaluated based on the accuracy of identifying dial damage, insulator damage, oil leakage, and suspended objects, as shown in Figure 9. According to the results in Figure 9, before enhancement, the detection accuracies for dial damage and oil leakage were 64% and 42%, respectively, while after enhancement, the accuracies increased to 91% and 79%, showing improvements of 27% and 37%, respectively. Additionally, insulator damage could not be correctly detected in the original blurred images and was mistakenly identified as suspended objects. However, after enhancement, insulator damage was successfully recognized with an accuracy of 93%. The experimental results show that the proposed algorithm significantly enhances defect detection accuracy in substations, even under challenging weather conditions like fog.

5. Conclusions

Existing substation image enhancement networks face challenges such as large parameter sizes, feature redundancy, and insufficient utilization of blurred image information. To address these issues, this paper proposes SDCNet, a substation image enhancement network based on decomposition convolution and adaptive fusion. This method directly learns the mapping relationship between blurred and clear substation images to generate high-quality clear images. By introducing a decomposition convolution enhancement module, SDCNet achieves strong performance while maintaining a low parameter count. To tackle the feature redundancy problem caused by addition or concatenation, an adaptive fusion module is proposed. This module automatically learns the weights or relationships between features, effectively integrating interdependent features from the encoder and decoder while preserving critical feature information and reducing redundancy. Furthermore, to make better use of blurred substation images, a contrastive regularization module is introduced, leveraging both blurred and clear images to guide the training of SDCNet. A synthetic algorithm is used to construct the MIIS dataset of blurred substation images, which is then used for comparative experiments and testing alongside the public RESIDE dataset against multiple state-of-the-art methods. The results verify the effectiveness and superiority of SDCNet. Finally, experiments conducted on the SSDF dataset demonstrate that the proposed algorithm exhibits strong stability and significantly improves the accuracy of defect detection in substations under complex weather conditions such as foggy days. Looking ahead, future work will focus on further enhancing the robustness of SDCNet by exploring more advanced regularization techniques, optimizing the decomposition convolution module, and expanding the dataset for more comprehensive testing in diverse real-world conditions. Additionally, the exploration of real-time substation image enhancement and defect detection will be prioritized, aiming to deploy the model in practical applications. Further improvements will also target fine-tuning the model to handle dynamic environmental changes such as varying lighting, weather conditions, and camera angles to enhance the reliability and efficiency of substation monitoring systems.

Author Contributions

Conceptualization, S.Y. and W.M.; Data curation, M.L.; Formal analysis, H.B.; Methodology, L.J., A.F., and H.B. All authors have read and agreed to the published version of the manuscript.

Funding

This research received no external funding.

Data Availability Statement

Restrictions apply to the availability of these data. Data were obtained from State Grid HENAN Electric Power Company and are available from the State Grid HENAN Electric Power Company with the permission of State Grid HENAN Electric Power Company. The MIIS and SSDF dataset is not publicly available due to company policy.

Conflicts of Interest

Authors Liang Jiang, Shaoguang Yuan, Wandeng Mao and Miaomiao Li were employed by the company State Grid HENAN Electric Power Company. The remaining authors declare that the research was conducted in the absence of any commercial or financial relationships that could be construed as a potential conflict of interest.

References

  1. Huang, S.; Wu, Z.S.; Ren, Z.G.; Liu, H.; Gui, Y. Research Review on Intelligent Inspection Robots for Power Grids. Electr. Meas. Instrum. 2020, 57, 26–38. (In Chinese) [Google Scholar]
  2. Dai, H.; Cui, Z.W.; Xie, Z.Y.; Lan, X. Research on Inspection Image Enhancement Algorithm under Complex Weather Conditions. Mech. Des. Manuf. Eng. 2021, 50, 105–109. (In Chinese) [Google Scholar]
  3. Zhu, B.B.; Fan, S.S. Recognition Method of Pointer Instruments in Rainy and Foggy Environment of Substation. Prog. Laser Optoelectron. 2021, 58, 221–230. [Google Scholar]
  4. Tan, Y.X.; Fan, S.S.; Wang, Z.Y. Global and Local Contrast Adaptive Enhancement Methods for Low-Quality Substation Equipment Infrared Thermal Images. IEEE Trans. Instrum. Meas. 2023, 73, 5005417. [Google Scholar] [CrossRef]
  5. Bai, W.R.; Zhang, X.; Zhu, X.Q.; Liu, J.; Cheng, Q.; Zhao, Y.; Shao, J. Power Inspection Image Enhancement Based on E-FCNN. Electr. Power China 2021, 54, 179–185. (In Chinese) [Google Scholar]
  6. Chen, X.; Fan, S.S. Meter Image Enhancement Method in High Light Substation Based on Improved CycleGAN. In Proceedings of the Third International Conference on Optics and Image Processing, Hangzhou, China, 14–16 April 2023. [Google Scholar]
  7. Zhou, J.; Tian, Z.X.; Wang, M.Y. Haze Removal for Inspection Images Using a Diffusion Model with External Attention. Electron. Meas. Technol. 2024, 47, 144–152. [Google Scholar]
  8. Wang, Z.; Jing, M.; Shi, J.; Chen, T.; Liu, W.; Fan, R. A Single Image Dehazing Algorithm with Improved CBAM Mechanism and Detail Recovery. Electron. Meas. Technol. 2023, 46, 161–168. (In Chinese) [Google Scholar]
  9. He, K.; Sun, J.; Tang, X. Single image haze removal using dark channel prior. IEEE Trans. Pattern Anal. Mach. Intell. 2010, 33, 2341–2353. [Google Scholar] [CrossRef] [PubMed]
  10. Zhu, Q.; Mai, J.; Shao, L. Single image dehazing using color attenuation prior. In Proceedings of the BMVC, Nottingham, UK, 1–5 September 2014; pp. 1674–1682. [Google Scholar]
  11. Berman, D.; Avidan, S. Non-local image dehazing. In Proceedings of the IEEE Conference on Computer Vision and Pattern Recognition, Las Vegas, NE, USA, 26 June–1 July 2016; pp. 1674–1682. [Google Scholar]
  12. Krizhevsky, A.; Sutskever, I.; Hinton, G.E. ImageNet classification with deep convolutional neural networks. Communications of the ACM 2017, 60, 84–90. [Google Scholar] [CrossRef]
  13. Cai, B.; Xu, X.; Jia, K.; Qing, C.; Tao, D. Dehazenet: An end-to-end system for single image haze removal. IEEE Trans. Image Process. 2016, 25, 5187–5198. [Google Scholar] [CrossRef] [PubMed]
  14. Qin, X.; Wang, Z.; Bai, Y.; Xie, X.; Jia, H. FFA-Net: Feature fusion attention network for single image dehazing. In Proceedings of the AAAI Conference on Artificial Intelligence, New York, NY, USA, 7–12 February 2020; Volume 34, pp. 11908–11915. [Google Scholar]
  15. Wu, H.; Qu, Y.; Lin, S.; Zhou, J.; Qiao, R.; Zhang, Z.; Xie, Y.; Ma, L. Contrastive learning for compact single image dehazing. In Proceedings of the IEEE/CVF Conference on Computer Vision and Pattern Recognition, Virtual, 19–25 June 2021; pp. 10551–10560. [Google Scholar]
  16. Lu, L.P.; Xiong, Q.; Xu, B.; Chu, D. MixDehazeNet: Mix Structure Block for Image Dehazing Network. In Proceedings of the 2024 International Joint Conference on Neural Networks (IJCNN), Yokohama, Japan, 30 June–5 July 2024; pp. 1–10. [Google Scholar]
  17. Chen, Z.; He, Z.; Lu, Z.M. DEA-Net: Single Image Dehazing Based on Detail-Enhanced Convolution and Content-Guided Attention. IEEE Trans. Image Process. 2024, 33, 1002–1015. [Google Scholar] [CrossRef] [PubMed]
  18. Dosovitskiy, A.; Beyer, L.; Kolesnikov, A.; Weissenborn, D.; Zhai, X.; Unterthiner, T.; Dehghani, M.; Minderer, M.; Heigold, G.; Gelly, S.; et al. An image is worth 16x16 words: Transformers for image recognition at scale. arXiv 2020, arXiv:2010.11929. [Google Scholar]
  19. Song, Y.; He, Z.; Qian, H.; Du, X. Vision transformers for single image dehazing. IEEE Trans. Image Process. 2023, 32, 1927–1941. [Google Scholar] [CrossRef] [PubMed]
  20. Li, B.; Ren, W.; Fu, D.; Tao, D.; Feng, D.; Zeng, W.; Wang, Z. Benchmarking single-image dehazing and beyond. IEEE Trans. Image Process. 2018, 28, 492–505. [Google Scholar] [CrossRef] [PubMed]
  21. Guo, C.L.; Yan, Q.; Anwar, S.; Cong, R.; Ren, W.; Li, C. Image Dehazing Transformer with Transmission-Aware 3D Position Embedding. In Proceedings of the IEEE/CVF Conference on Computer Vision and Pattern Recognition, New Orleans, LA, USA, 19–24 June 2022; pp. 5812–5820. [Google Scholar]
  22. Qiu, Y.; Zhang, K.; Wang, C.; Luo, W.; Li, H.; Jin, Z. Mb-TaylorFormer: Multi-Branch Efficient Transformer Expanded by Taylor Formula for Image Dehazing. In Proceedings of the IEEE/CVF International Conference on Computer Vision, Paris, France, 2–6 October 2023; pp. 12802–12813. [Google Scholar]
  23. Hong, M.; Liu, J.; Li, C.; Qu, Y. Uncertainty-driven dehazing network. In Proceedings of the AAAI Conference on Artificial Intelligence, Virtually, 22 February–1 March 2022; Volume 36, pp. 906–913. [Google Scholar]
  24. Ding, X.; Zhang, X.; Han, J.; Ding, G. Scaling up your kernels to 31x31: Revisiting large kernel design in CNNs. In Proceedings of the IEEE/CVF Conference on Computer Vision and Pattern Recognition, New Orleans, LA, USA, 19–24 June 2022; pp. 11963–11975. [Google Scholar]
  25. Luo, P.; Xiao, G.; Gao, X.; Wu, S. LKD-Net: Large Kernel Convolution Network for Single Image Dehazing. In Proceedings of the 2023 IEEE International Conference on Multimedia and Expo (ICME), Brisbane, Australia, 10–14 July 2023; pp. 1601–1606. [Google Scholar]
  26. He, K.; Zhang, X.; Ren, S.; Sun, J. Deep Residual Learning for Image Recognition. In Proceedings of the IEEE Conference on Computer Vision and Pattern Recognition, Las Vegas, NE, USA, 26 June–1 July 2016; pp. 770–778. [Google Scholar]
  27. Loshchilov, I.; Hutter, F. Decoupled Weight Decay Regularization. arXiv 2017, arXiv:1711.05101. [Google Scholar]
  28. Khalid, R.; Rehman, S.; Riaz, F.; Hassan, A. Enhanced Dynamic Quadrant Histogram Equalization Plateau Limit for Image Contrast Enhancement. In Proceedings of the Fifth International Conference on Digital Information and Communication Technology and its Applications (DICTAP), Beirut, Lebanon, 29 April–1 May 2015; pp. 86–91. [Google Scholar]
  29. Li, B.; Peng, X.; Wang, Z.; Xu, J.; Feng, D. An All-in-One Network for Dehazing and Beyond. arXiv 2017, arXiv:1707.06543. [Google Scholar]
  30. Liu, X.; Ma, Y.; Shi, Z.; Chen, J. GridDehazeNet: Attention-Based Multi-Scale Network for Image Dehazing. In Proceedings of the IEEE/CVF International Conference on Computer Vision, Seoul, Republic of Korea, 27 October–2 November 2019; pp. 7314–7323. [Google Scholar]
  31. Chen, D.; He, M.; Fan, Q.; Liao, J.; Zhang, L.; Hou, D.; Yuan, L.; Hua, G. Gated Context Aggregation Network for Image Dehazing and Deraining. In Proceedings of the 2019 IEEE Winter Conference on Applications of Computer Vision (WACV), Waikoloa, HI, USA, 7–11 January 2019; pp. 1375–1383. [Google Scholar]
  32. Dong, H.; Pan, J.; Xiang, L.; Hu, Z.; Zhang, X.; Wang, F.; Yang, M.H. Multi-Scale Boosted Dehazing Network with Dense Feature Fusion. In Proceedings of the IEEE/CVF Conference on Computer Vision and Pattern Recognition, Virtual, 24 June 2020; pp. 2157–2167. [Google Scholar]
Figure 1. The SDCNet network architecture.Contains an encoder and decoder, where the input image I is processed to learn a mapping function f, which directly outputs a clear image J ^ .
Electronics 14 03245 g001
Figure 2. The structure of the DCEM module includes Decomposed Convolution Module and Enhanced Mix Attention Module, capable of capturing multi-scale features and enhancing detail textures and color restoration in the image.
Electronics 14 03245 g002
Figure 3. 13 × 13 Convolution Decomposition Diagram. The figure shows that the 13 × 13 depthwise convolution can be decomposed into a combination of 5 × 5 depthwise convolution and 5 × 5 dilated depthwise convolution with a dilation rate of 3.
Electronics 14 03245 g003
Figure 4. The structure of the AFFM module can adaptively learn the weights or interdependencies between features to effectively integrate the mutually dependent encoder–decoder features, generating more expressive and discriminative representations while reducing redundant features.
Electronics 14 03245 g004
Figure 5. MIIS dataset example.
Electronics 14 03245 g005
Figure 6. The enhancement effects of several classic methods and SDCNet on the MIIS test set.
Electronics 14 03245 g006
Figure 7. The dehazing effects of several classic methods and SDCNet on SOTS.
Electronics 14 03245 g007
Figure 8. Dataset example.
Electronics 14 03245 g008
Figure 9. The object detection experimental results of the proposed algorithm on the SSDF dataset.
Electronics 14 03245 g009
Table 1. The quantitative comparison of several classic methods with SDCNet on the MIIS test set.
MethodsPSNR/dBSSIMFSIMEntropyPIQE
DCP18.7020.9240.9252.35461.647
CLAHE21.3380.9260.9423.65260.208
AOD-Net23.060.9690.9453.68159.255
GridDehazeNet32.1630.9840.9624.82356.296
FFA-Net36.3950.9890.9684.32256.254
DEA-Net39.1630.9920.9714.36554.239
SDCNet43.2160.9980.9734.52154.401
Table 2. The quantitative comparison of several classic methods with SDCNet on SOTS.
MethodsSOTS Indoor (PSNR/dB)SOTS Indoor (SSIM)SOTS Outdoor (PSNR/dB)SOTS Outdoor (SSIM)
CLAHE12.340.70315.690.801
DCP16.620.81819.130.815
AOD-Net19.060.85020.290.877
GridDehazeNet32.160.98430.860.982
FFA-Net36.390.98933.570.984
DEA-Net41.310.99436.590.989
SDCNet41.360.99536.390.990
Table 3. The parameter counts, average PSNR values, SSIM values, and running times on the MIIS test set for several methods.
EvaluationGCANetGridDehaze-NetMSBDNFFA-NetSDCNet
PSNR/dB30.48232.16333.67236.39543.216
SSIM0.9760.9840.9850.9890.998
Number of parameters70281895805131353061832825374822
Running time (s)0.090760.172481.032800.137910.10451
Table 4. Quantitative comparison results of ablation experiments.
MethodsDCEMAFMCRMPSNR (dB)SSIM#ParamFLOPs
Baseline35.2310.9810.3533 M3.3867 G
Baseline39.3150.9910.3734 M3.7060 G
Baseline41.1890.9950.3748 M3.7164 G
Baseline42.1780.9980.3748 M3.7164 G
Baseline43.2160.9980.3748 M3.7164 G
Disclaimer/Publisher’s Note: The statements, opinions and data contained in all publications are solely those of the individual author(s) and contributor(s) and not of MDPI and/or the editor(s). MDPI and/or the editor(s) disclaim responsibility for any injury to people or property resulting from any ideas, methods, instructions or products referred to in the content.