Article

Multi-Source Heterogeneous Data Fusion Algorithm for Vessel Trajectories in Canal Scenarios

1
College of Computer Science and Engineering, Guilin University of Technology, Guilin 541006, China
2
College of Physics and Electronic Information Engineering, Guilin University of Technology, Guilin 541006, China
3
School of Information and Communication, Guilin University of Electronic Technology, Guilin 541004, China
*
Author to whom correspondence should be addressed.
Electronics 2025, 14(16), 3223; https://doi.org/10.3390/electronics14163223 (registering DOI)
Submission received: 28 June 2025 / Revised: 8 August 2025 / Accepted: 11 August 2025 / Published: 14 August 2025

Abstract

With the globalization of trade, maritime transport is playing an increasingly strategic role in sustaining international commerce. As a result, research into the tracking and fusion of multi-source vessel data in canal environments has become critical for enhancing maritime situational awareness. In the existing research and development, the heterogeneity of and variability in vessel flow data often lead to multiple issues in tracking algorithms, as well as in subsequent trajectory-matching processes. The existing tracking and matching frameworks typically suffer from three major limitations: insufficient capacity to extract fine-grained features from multi-source data; difficulty in balancing global context with local dynamics during multi-scale feature tracking; and an inadequate ability to model long-range temporal dependencies in trajectory matching. To address these challenges, this study proposes the Shape Similarity and Generalized Distance Adjustment (SSGDA) framework, a novel vessel trajectory-matching approach designed to track and associate multi-source heterogeneous vessel data in complex canal environments. The primary contributions of this work are summarized as follows: (1) an enhanced optimization strategy for trajectory fusion based on Enhanced Particle Swarm Optimization (E-PSO) designed for the proposed trajectory-matching framework; (2) the proposal of a trajectory similarity measurement method utilizing a distance-based reward–penalty mechanism, followed by empirical validation using the publicly available FVessel dataset. Comprehensive aggregation and analysis of the experimental results demonstrate that the proposed SSGDA method achieved a matching precision of 96.30%, outperforming all comparative approaches. Additionally, the proposed method reduced the mean-squared error between trajectory points by 97.82 pixel units. These findings further highlight the strong research potential and practical applicability of the proposed framework in real-world canal scenarios.

1. Introduction

Since the early 21st century, the expansion of global trade and sustained economic growth have significantly driven the development of the maritime industry. Against this backdrop, smart canal technologies have become increasingly essential for ensuring navigational safety and fostering the sustainable development of inland waterways. Enabled by advances in smart sensing and Internet of Things (IoT) technologies, smart waterways integrate multi-source data perception [1], intelligent decision-making and scheduling [2], and assisted navigation systems [3]. Although the existing research has demonstrated promising results in controlled scenarios, numerous challenges remain in real-world applications, primarily due to the heterogeneity of trajectory data. For instance, video data typically feature high temporal resolution due to high frame rates, whereas Automatic Identification System (AIS) data are updated at one-second intervals, resulting in substantial disparities in both temporal and spatial resolution. The AIS provides high-precision geographic coordinates, while video-based pixel coordinates are highly sensitive to variations in the viewing angle and resolution. These two modalities exhibit significant discrepancies in spatial granularity, thereby posing substantial challenges for consistent data interpretation and effective fusion. These discrepancies lead to substantial differences in granularity between the two data types. Such disparities are particularly pronounced in cross-modal data fusion and long-term trajectory analysis.
Most of the existing trajectory-matching methods primarily focus on local point-to-point similarity, often overlooking the global dynamic characteristics of the overall trajectory [4]. However, algorithms that employ global strategies often fail to adequately capture local details, resulting in compromised spatiotemporal consistency. In addition, multi-source data such as video, AISs, and LiDAR differ significantly in their sampling frequencies, coordinate systems, and time stamps, further complicating multi-scale feature extraction and fusion. Despite recent advances, the existing methods still face significant limitations in real-time performance, matching precision, and system robustness [5], making them insufficient for the effective fusion and analysis of heterogeneous multi-source data in complex canal environments. Therefore, the development of more adaptable and robust algorithmic frameworks is imperative.
While the classical trajectory-matching algorithms have exhibited robust performances on single-source datasets [6] and under conditions of high sampling density [7], the widespread integration of multi-source heterogeneous data—such as video surveillance, AIS signals, LiDAR, and water quality sensors—into canal monitoring systems has made accurate and fine-grained cross-modal trajectory matching increasingly critical. Simultaneously, addressing the critical need for effective spatiotemporal information integration and multi-source data fusion in real-world scenarios is essential. To address the aforementioned core challenges, this paper proposes a novel trajectory-matching framework based on the Shape Similarity and Generalized Distance Adjustment (SSGDA) method. The framework comprises two key components: a rigid transformation module based on the Enhanced Particle Swarm Optimization (E-PSO) algorithm, and a trajectory similarity measurement module employing the distance-based reward–penalty-matching (DBRP-Match) algorithm. Based on the above, the main contributions of this paper are summarized as follows:
(1)
This paper addresses the limitations of spatial coordinate transformation algorithms across heterogeneous coordinate systems and the insufficient correction of trajectory information at multiple granularities. Prior to trajectory matching, this study employed the Enhanced Particle Swarm Optimization (E-PSO) algorithm to perform optimal rigid transformation correction on Automatic Identification System (AIS) data, thereby mitigating the degradation of the matching precision caused by coordinate transformation errors.
(2)
To address the limitations of traditional trajectory-matching algorithms that rely solely on either local point-to-point alignment or the contour-based analysis of multi-source features, this study proposes a novel trajectory-matching algorithm for asynchronous multi-source data, incorporating a distance-based reward–penalty mechanism. By comparing distances between local sampling points and incorporating a dynamic reward–penalty mechanism, the proposed method enhances both the local sensitivity and global optimization capability when processing information with varying levels of granularity in complex multi-source scenarios. This method takes into account global trajectory shape similarity as well as multi-scale matching and inference capabilities for locally discrete points. Building upon the aforementioned work, the SSGDA framework is developed to adaptively balance local and global search priorities, thereby significantly improving the practical performance of trajectory-matching methods when handling information of varying granularity.
The structure of this article is organized as follows: Section 2 provides a review of the related work on multi-target detection, tracking, and trajectory matching. Section 3 presents a detailed description of the proposed SSGDA trajectory-matching framework. In this study, the world coordinates of AIS data were projected into the image coordinate system. Video trajectories were extracted using YOLOv11 (You Only Look Once, Version 11) in combination with DeepSORT v1.0 (Simple Online and Realtime Tracking with a Deep Association Metric) for object detection and tracking. To achieve alignment and correction, the E-PSO (Enhanced Particle Swarm Optimization) algorithm was employed to perform rigid transformation on AIS trajectories for alignment and correction. During this stage, an adaptive adjustment mechanism was introduced through the DBRP-Match algorithm to enhance the similarity computation between multi-source trajectories. Section 4 presents comprehensive experiments and visual analyses conducted on public benchmark datasets to validate the effectiveness of the proposed SSGDA framework at fusing heterogeneous multi-source data for canal monitoring scenarios. Finally, Section 5 provides a summary of this study and discusses potential directions for future research.

2. Related Work

2.1. Multi-Target Detection and Tracking

Object detection is a fundamental prerequisite for advanced computer vision tasks, such as object tracking, recognition, and behavioral analysis, as it accurately localizes and classifies objects within visual data, including images and videos. Despite the growing computational demands of core algorithms, the rapid advancement of graphics processing units (GPUs) has substantially contributed to the emergence of deep learning as the dominant paradigm in computer vision. The region-based convolutional neural network (R-CNN) family represents a transformative milestone in object detection, establishing the foundation for the development of end-to-end detection frameworks based on deep learning. Among the R-CNN variants, Fast R-CNNs and Faster R-CNNs significantly improve detection efficiency and accuracy by introducing feature-sharing mechanisms and a Region Proposal Network (RPN) [8,9]. Meanwhile, single-stage detectors, such as YOLO and SSD, achieve superior real-time detection performances by directly regressing bounding boxes [10,11]. However, single-frame imagery alone is insufficient to ensure trajectory continuity or facilitate comprehensive behavioral analyses of targets. Therefore, object tracking has been increasingly integrated with other domains in complex scenarios, serving as a crucial component of multi-frame information analysis.
In its early stages, multi-object tracking primarily relied on methods such as the Kalman filter and particle filter, using state modeling to maintain inter-frame continuity [12,13]. Subsequently, the tracking-by-detection paradigm became mainstream, combining per-frame object detection with data association algorithms to establish inter-frame correspondences, thereby effectively addressing occlusion and target loss issues [14]. Simple Online and Realtime Tracking (SORT) integrates the Kalman filter with the Hungarian algorithm, providing a lightweight architecture and high computational efficiency [15]; DeepSORT further incorporates appearance features, significantly enhancing its ability to preserve object identities [16]. In recent years, Transformer-based and graph neural network (GNN)-based approaches have emerged, enabling end-to-end modeling and improving adaptability in complex scenarios [17,18].
Currently, object detection and tracking algorithms are evolving toward lightweight architectures, enhanced feature representations, multi-scale fusion strategies, and optimized attention mechanisms. By enhancing the backbone network and employing an efficient feature fusion strategy, both detection precision and multi-scale adaptability have been significantly improved [19,20,21,22,23]. The integration of temporal sequence modeling and cross-domain generalization capabilities into tracking tasks has further enhanced the robustness in dynamic environments [24,25,26]. However, multi-object detection remains sensitive to scale variations, occlusions, and lighting conditions. In addition, it often lacks effective attention mechanisms and robust feature fusion strategies, making it difficult to achieve a balance between accuracy and real-time performance. Although detection algorithms achieve high precision, they lack the capability to continuously identify target identities. Conversely, tracking algorithms assign unique IDs and enable inter-frame association; however, their performance heavily depends on the quality of the detection bounding boxes. Consequently, missed or false detections can easily cause ID switches and trajectory drift. Therefore, to address the aforementioned challenges, it is essential to establish a more tightly integrated coordination mechanism between object detection and tracking. This integration aims to enhance the overall robustness of the system in complex environments and improve the continuity of target recognition.

2.2. Trajectory Matching

Trajectory matching plays a critical role in multi-source data fusion and target tracking. Its primary objective is to facilitate accurate object-level identification and behavioral understanding by effectively aligning trajectory data from heterogeneous sources. Most of the existing methods rely on distance-based metrics and heuristic rules. Representative approaches include Dynamic Time Warping (DTW) [27,28], the Longest Common Subsequence (LCSS) [29,30], the Edit Distance on Real (EDR) sequence [31,32], the Fréchet Distance [33], and the Hausdorff Distance, among others. A common characteristic of these methods is their reliance on spatiotemporal similarity between trajectory points, typically under the assumption of strong temporal synchronization and structural stability. Consequently, their robustness and generalization capabilities are limited when faced with noise, unequal trajectory lengths, temporal asynchrony, or multi-target scenarios. The One-Way Distance (OWD) trajectory-matching algorithm [34] is applicable to grid-based representations and segmented linear trajectories. It places greater emphasis on capturing the spatial shape similarity between trajectories. The aforementioned trajectory-matching algorithms employ various strategies to process trajectory data, demonstrating strong robustness by tolerating local deformations and noise. They effectively perform similarity computations and matching tasks for trajectories.
The aforementioned studies primarily focus on distance measurement and similarity recognition for individual trajectories, enhancing the precision and robustness of unary trajectory matching through refined thresholding, weighting schemes, and local alignment techniques. However, unary trajectory matching is inherently limited by its focus on individual trajectory forms, lacking the capability to capture structural-level correspondences. In contrast, subsequent studies have increasingly focused on binary trajectory matching, which emphasizes fine-grained and structured correspondence analysis between pairs of trajectory sequences. Such methods typically integrate spatial topology, probabilistic models, and appearance features of trajectories, aiming to balance the matching precision with the real-time performance. They are widely applied in complex scenarios such as map matching and dense environments.
The adaptive map-matching method based on the Fréchet Distance reduces latency while maintaining high precision, thereby effectively enhancing the real-time performance and stability of positioning and navigation systems [35]. For densely populated target scenarios, researchers have proposed a center-based object-tracking algorithm that leverages inter-frame appearance similarity to facilitate accurate tracking and robust target association [36]. Map-matching methods for high-frequency trajectories incorporate road network topology constraints and employ segmented trajectory alignment, thereby improving the adaptability and precision in complex road network environments [37].
Although the aforementioned trajectory-matching algorithms exhibit strengths in addressing local misalignments, accommodating diverse trajectory shapes, and enhancing computational efficiency, most traditional approaches still face challenges in simultaneously balancing global shape similarity, fine-grained distance measurement, and computational efficiency. Specifically, although many algorithms achieve high precision and robustness, they often incur substantial computational costs when processing complex, asynchronous, multi-object, and long-duration trajectories. Moreover, although some algorithms improve the matching precision, their computational efficiency remains inadequate to meet the real-time demands of large-scale dataset processing. Therefore, achieving high precision while simultaneously maintaining computational efficiency and preserving global shape matching remains a fundamental challenge in the field of trajectory matching.

2.3. Comparative Analysis of Various Multi-Source Fusion Frameworks

In recent years, various multi-source data fusion frameworks have been proposed—particularly those integrating LiDAR, radar, and camera data—which have achieved remarkable success in autonomous driving and robotic perception. However, these frameworks are typically designed for high-frequency, synchronous, and structured data, which stands in sharp contrast to the heterogeneous, low-frequency, and asynchronous modalities—such as video and AIS signals—commonly encountered in waterway monitoring scenarios.
The multi-source fusion framework is shown in Table 1. Multi-View Fusion (MVFusion) employs multi-view images and LiDAR data to achieve multi-modal feature fusion through a cross-attention mechanism. However, its heavy reliance on hardware-level synchronization limits its ability to handle temporal delays and sampling frequency mismatches between AISs and video data. CenterFusion fuses radar and camera detection results in autonomous driving scenarios, leveraging cross-modal, cross-multiple attention, and joint cross-multiple attention mechanisms to improve the perception performance. Despite strong results under synchronized frame conditions, this approach struggles with temporal misalignment between AISs and video data. CBILR utilizes high-density LiDAR data for complementary information via a bidirectional fusion structure and a Bird’s Eye View (BEV)-based multimodal fusion approach. Nevertheless, its dependence on high-resolution, synchronized inputs restricts its applicability in asynchronous, multi-source sensing scenarios.
The fusion of heterogeneous data with varying sampling rates still presents significant challenges, particularly in effectively balancing spatiotemporal correlations and trajectory shape characteristics. In the matching methods for multi-source heterogeneous data, the asynchrony and unequal lengths of the data complicate handling variations across different time scales; ensuring the accuracy and robustness of the overall matching remains a major challenge in the current research.

3. Methods

This section provides a comprehensive description of the proposed SSGDA (Shape Similarity and Generalized Distance Adjustment) trajectory-matching framework. As illustrated in Figure 1, the overall pipeline is designed to address three primary challenges in trajectory matching between video and AIS data: data heterogeneity, temporal asynchrony, and spatial coordinate misalignment. The framework is structured into four key stages to systematically mitigate these issues. First, for the raw trajectory data obtained from the Automatic Identification System (AIS), the framework introduces a preprocessing module to construct an AIS trajectory sequence with clear structure and spatiotemporal continuity. This is achieved by removing discontinuous trajectory segments, eliminating redundant information, and supplementing missing position data, thereby providing a stable data foundation for subsequent matching operations. Second, during the video data processing stage, the YOLOv11 model is employed for the high-precision detection of ship targets in each frame. The DeepSORT algorithm is further integrated to perform cross-frame identity association and trajectory management. This module ensures both the real-time performance and accuracy of detection while maintaining identity consistency and trajectory continuity under occlusion, resulting in a stable visual trajectory. Next, to address the discrepancies in data sources and coordinate systems between video and AIS data, an Enhanced Particle Swarm Optimization (E-PSO) algorithm is developed to adaptively search for the optimal rotation angle and translation parameters within the defined search space. Upon convergence of the optimization process, a rigid transformation is applied to the video trajectory, enabling high-precision spatial alignment with the AIS trajectory. This alignment establishes a unified reference coordinate system, laying the foundation for subsequent similarity measurements. Finally, the coordinate-aligned visual trajectory and the preprocessed AIS trajectory are jointly input into the trajectory-matching module—DBRP-Match (distance-based reward–penalty matching). This module incorporates a spatial tolerance threshold and a reward–penalty mechanism at the point level, and it evaluates the correspondence between trajectory pairs by combining the overall shape similarity with a dynamically adjusted distance metric. Based on this strategy, the proposed framework enables precise cross-modal trajectory association and provides a robust and scalable matching mechanism for multi-source heterogeneous data fusion.
Distinct from traditional trajectory-matching methods, the proposed SSGDA framework adaptively assigns reward–penalty scores to each trajectory point based on inter-point distances. This mechanism not only enables the fine-grained characterization of the point-wise similarity but also allows for the flexible tuning of the reward–penalty rates to accommodate diverse application scenarios. Even in the presence of coordinate conversion errors, the enhanced E-PSO module is capable of performing high-precision rigid correction on video trajectories, thereby further improving the overall precision and robustness of trajectory matching.

3.1. Trajectory Extraction Based on AIS Data

This section primarily focuses on the analysis of AIS trajectory data. AIS data offers critical vessel information—including its position, heading, speed, and Maritime Mobile Service Identity (MMSI)—and has been widely utilized in various maritime applications. Based on the preceding discussion, the raw AIS data undergoes a multi-stage preprocessing procedure, which is visualized in the flowchart of Figure 2.

3.1.1. AIS Data Processing

Based on the operational principles of the AIS system, this study adopts a structured AIS data processing framework, as illustrated in Figure 2. Specifically, historical AIS records are fused with newly received data to form the input, which undergoes sequential processing, including initial cleaning, trajectory prediction, and secondary cleaning, ultimately yielding a high-quality AIS dataset. In the initial cleaning stage, incomplete or invalid records––such as those with illegitimate MMSI numbers, abnormal latitude or longitude values, or positions falling outside the video surveillance coverage area—are removed. The trajectory prediction module leverages Kalman filtering and interpolation techniques to supplement trajectory information during periods when no new AIS data are received, ensuring continuity in the vessel motion representation. Since Kalman filtering is better suited for short-term prediction [41], this study adopts a hybrid approach that combines Kalman filtering with interpolation to estimate the vessel’s AIS position at the next time step. The overall prediction workflow is illustrated in Figure 3. Specifically, interpolation is first performed between two consecutive AIS transmissions using their corresponding latitude and longitude values. Within each interval, spatial interpolation is carried out at 10 s intervals to enhance the prediction precision. Subsequently, Kalman filtering is applied to the temporally aligned trajectory for position estimation.
Let the latitude and longitude at the previous time step be denoted as l o n t 1 and l a t t 1 , respectively, with the vessel speed denoted as speed and the heading angle as heading. According to Equations (1) and (2), the corresponding changes in longitude and latitude are represented by Δ l o n and Δ l o n , respectively:
Δ l a t = s p e e d Δ t R sin h e a d i n g
Δ l o n = s p e e d Δ t R c o s ( l a t t 1 ) c o s ( h e a d i n g )
The longitude at the next time step can be expressed as l o n t = l o n t 1 + Δ l o n , and the latitude as l a t t = l a t t 1 + Δ l a t .

3.1.2. AIS Coordinate Transformation

To achieve the accurate fusion of AIS data and video-detected targets, it is necessary to project multi-source heterogeneous data into a unified coordinate space. Considering the limited variation in vessel latitude and longitude within the video monitoring range [42], this study first transforms the AIS world coordinates into the pixel coordinates of video frames.
To convert geographic coordinates (latitude and longitude) into pixel coordinates, the Web Mercator projection is employed to map them onto a Cartesian coordinate system. Let the longitude and latitude be denoted by l o n and l a t , respectively. Equations (3) and (4) convert the geographic coordinates into radians, and Equations (5) and (6) compute the corresponding Cartesian coordinates ( U , V , W ) . Since the vessel operates on the water surface, W = 0 . The detailed computation steps are as follows:
λ l o n = l o n × π 180
λ l a t = l a t × π 180
U = R × λ l o n
V = R × l n ( t a n ( π 4 + λ l a t 2 ) )
The pinhole camera model is used to project 3D Cartesian coordinates ( U , V , W ) onto 2D pixel coordinates ( x , y ) . For a monocular vision system [43], the corresponding projection relationship based on the pinhole camera model can be formulated as shown in Equation (7):
x y 1 = 1 z K i n K e x U V W 1
where K i n and K e x represent the intrinsic and extrinsic matrices of the camera, respectively. Since the camera position remains fixed, these parameters are treated as constant matrices. Based on the same MMSI identifier, the relevant AIS data are grouped into a single list to form the AIS trajectory of each vessel, represented as Γ a i s = { X a 1 , , X a i , , X a t } , where X a t denotes the AIS data point of the a t h trajectory at time ( t ).

3.2. Video-Based Trajectory Extraction

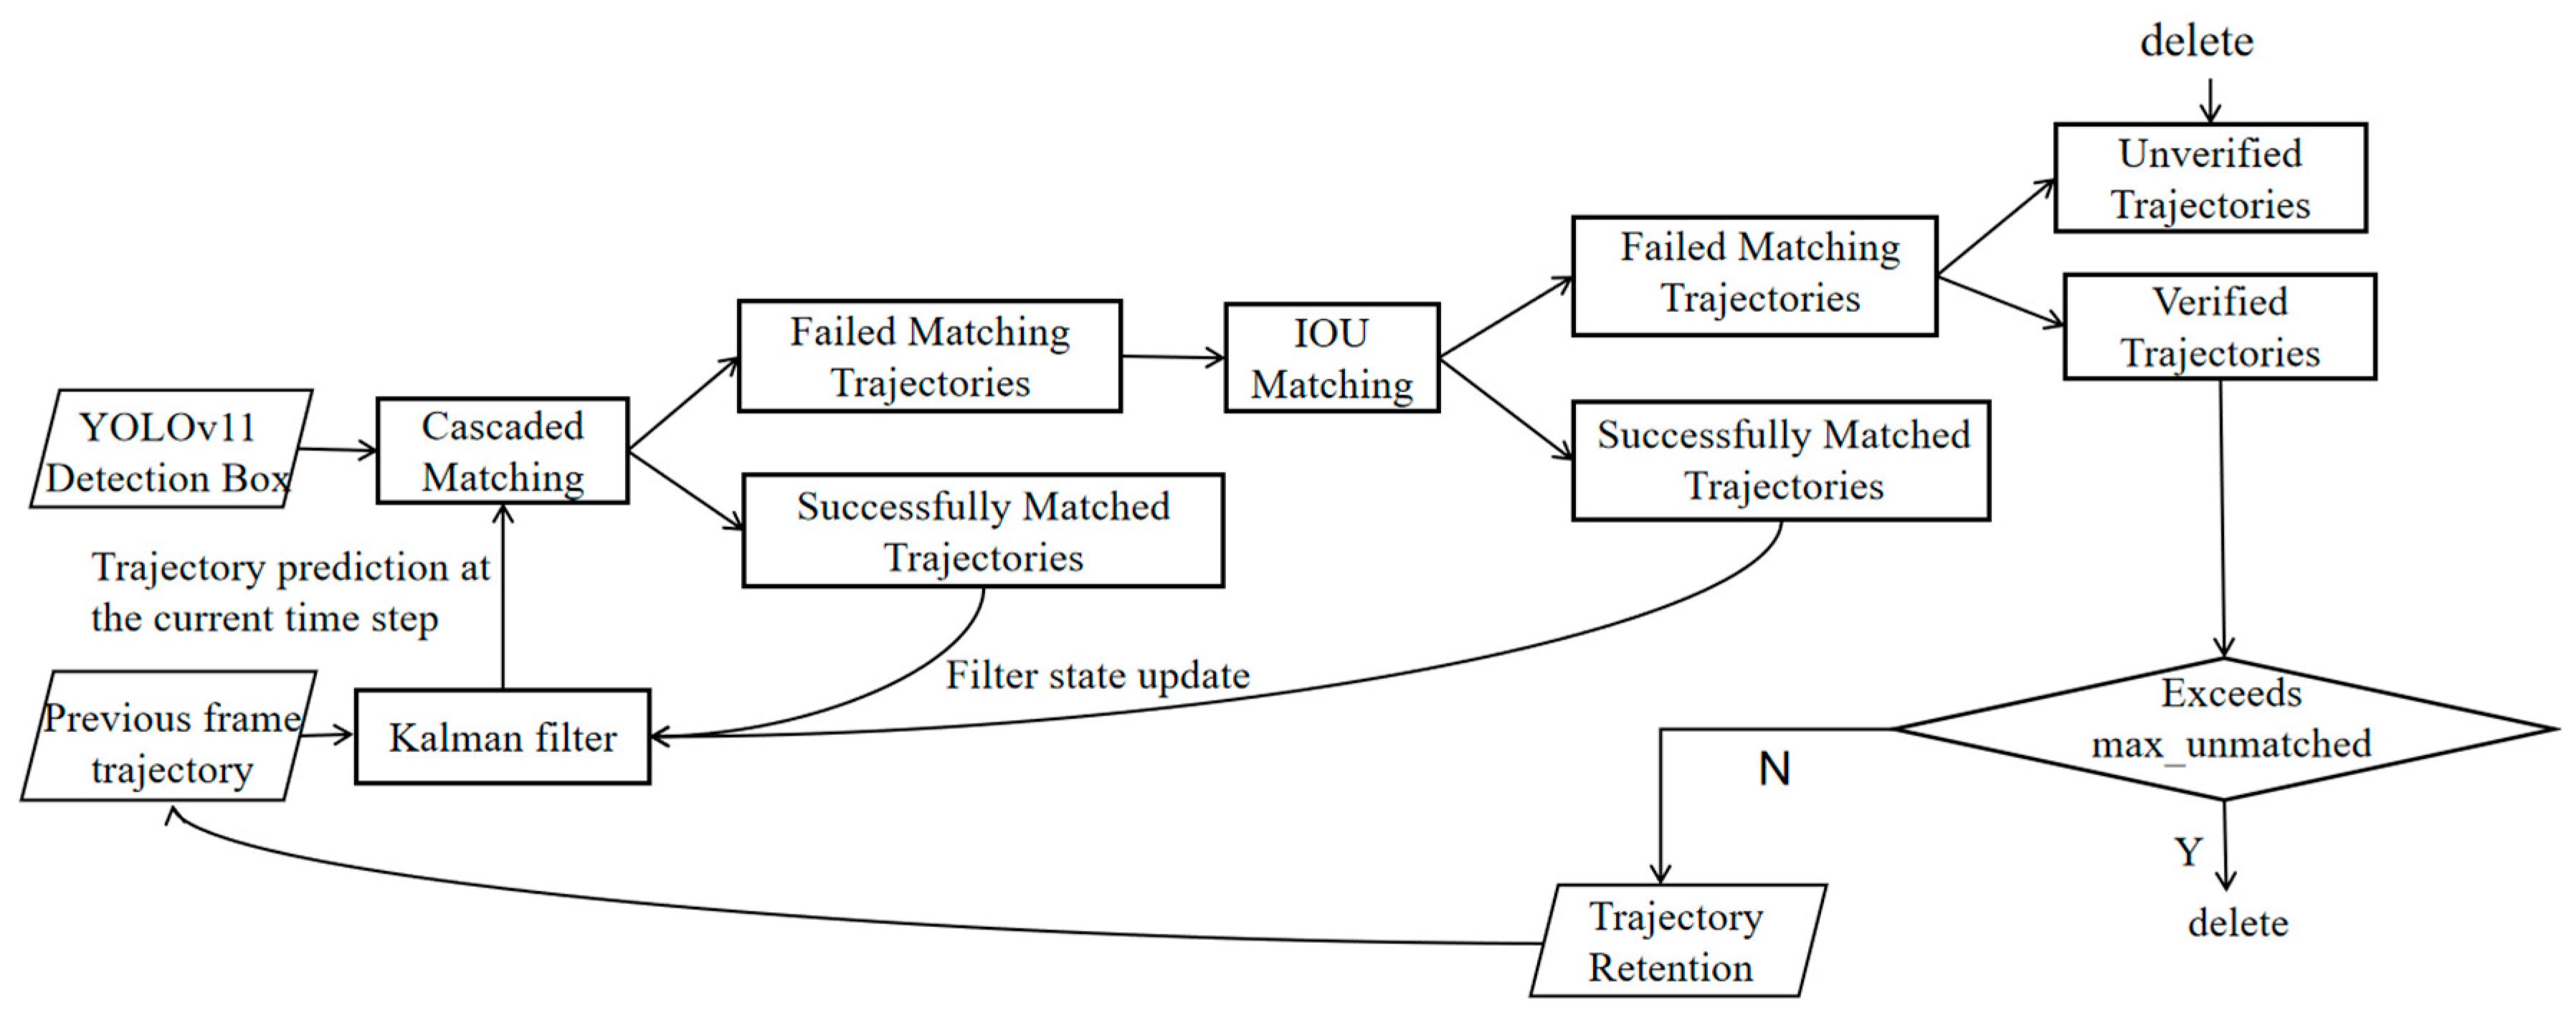
In maritime video surveillance, single-frame target detection often struggles with instability in long-range trajectory relationships, leading to errors with varying information granularity and additional tracking errors in the statistical process. To address the issues of discontinuous identity recognition, occlusion loss, and incoherent trajectories in single-frame object detection methods in videos, this paper introduces the multi-object tracking algorithm DeepSORT into the detection network. Although the traditional single-frame detection models offer high detection accuracy and real-time performance, they rely solely on information from the current frame for inference and are unable to recognize and correlate the continuous presence of the same target across different frames. When targets are briefly occluded, reappear in the scene, or when multiple targets share similar visual features, detectors often fail to maintain a consistent identity, leading to trajectory interruptions, frequent identity switches, or even the assignment of multiple IDs to the same target. To ensure identity consistency and temporal coherence across video frames, we integrate the multi-object tracking algorithm DeepSORT into the detection pipeline, which consists of three core components. Firstly, the system uses the Kalman filter to estimate the motion state and manage the trajectories of each detection frame in the two-dimensional image space, maintaining trajectory consistency and continuity in the presence of occlusion or missed detection. Next, the appearance feature extraction module (ReID) extracts the appearance features of the target to ensure identity consistency and assist in matching, thereby improving the tracking stability in scenarios with similar or complex appearances. The fusion of appearance information allows the system to maintain tracking even during long-term occlusion, effectively reducing the target ID switching rate while preserving the simplicity of the system structure and its adaptability to online application scenarios. Finally, the system combines the similarity of the target’s motion state and appearance, using the Hungarian algorithm to complete the target association between the Kalman predicted state and the new detection results, constructs the assignment matrix through joint measurements, and solves for the optimal match, thereby improving the accuracy of the target association. The overall tracking process is depicted in Figure 4. This process preserves the real-time frame rate of YOLOv11 while integrating the DeepSORT module to continuously assign consistent IDs to each target, maintaining trajectory continuity and robustness in complex scenarios such as occlusion and missed detection. As a result, it generates structured, high-integrity visual trajectories that are temporally consistent and identity-stable, providing a reliable and sustainable foundation for subsequent AIS data fusion and accurate matching.
(1)
Kalman filter
As the core component of a multi-target tracking system, the Kalman filter performs the dynamic estimation of target motion states through three sequential stages: prediction, fusion, and correction. First, based on the posterior state estimate from the previous time step and the process noise model, a linear state transition matrix is used to predict the prior state and its associated covariance matrix for the current frame. Then, upon receiving new observations, these are fused with the predicted state, and the state estimate is updated through a correction step. Even in the presence of missed detections or temporary occlusions, the Kalman filter remains capable of providing stable and reliable trajectory predictions [44]. The initial state vector is defined as shown in Equation (8):
x = C x , C y , a , h , v x , v y , v a , v h T
where ( C x , C y ) denote the coordinates of the center of the target bounding box, and a and h represent the width and height of the bounding box, respectively. The terms ( v x , v y , v a , v h ) correspond to the velocity components associated with the state vector. The state covariance matrix and the observation matrixs are defined as shown in Equations (9) and (10):
F = I 4 I 4 0 I 4
H = I 4 0
Here, I 4 denotes the 4 × 4 identity matrix. Based on the posterior state ( x k 1 | k 1 ) from the previous time step, the state transition matrix is applied to predict the prior state. Consequently, the prior probability distribution is computed using Equation (11):
x k | k 1 = F x k 1 | k 1
The prior covariance is given by P k | k 1 = F P k 1 | k 1 F + Q , where Q is the initial process noise covariance matrix. If no detection bounding box is present in the current frame, the filter skips the update step and directly takes the prior position state as the state estimate at the current time. Otherwise, based on the observation Z k , the associated residual is calculated as y k = z k H x k | k 1 , and the Kalman gain is computed as shown in Equation (12):
K k = P k | k 1 H ( H P k | k 1 H + R ) 1
where R denotes the observation noise covariance matrix. Finally, the state and covariance are updated using Equation (13):
x k | k = x k | k 1 + K k y k , P k | k = ( I K k H ) P k | k 1
(2)
Feature Extraction
In the DeepSORT framework, the appearance feature extraction module (ReID) processes each candidate box output by the detector using a pre-trained lightweight convolutional neural network. First, the candidate frame images are cropped and resized to a fixed size, and deep feature maps are extracted through multiple layers of convolution, batch normalization, and residual modules. The features are then compressed into a 256-dimensional vector via global average pooling and fully connected layers, followed by normalization. The network is jointly trained on a large-scale identity-labeled dataset using cross-entropy classification loss and triplet metric learning loss, which enhances the global discrimination across different targets and fosters compact clustering among samples of the same identity. During the online tracking phase, the system extracts appearance feature vectors for each of the N detected targets from each frame. It then computes the average of the vectors from the K most recent frames for each active trajectory to form a “trajectory template”. The cosine similarity between the current detection vector and each trajectory template is calculated to construct the appearance cost matrix, which is weighted and fused with the motion cost predicted by the Kalman filter. To achieve the optimal matching between detection boxes and historical trajectories, the Hungarian algorithm is incorporated into the framework, enabling robust multi-object tracking that combines appearance recognition with motion consistency.
(3)
Hungarian Algorithm
In DeepSORT, the Hungarian algorithm is employed to establish the optimal correspondence between the predicted trajectory and the current detection frame. First, a cost matrix is constructed using the Mahalanobis distance to measure the motion uncertainty between the predicted and observed states from the Kalman filter. For the i t h tracking trajectory and j t h detection frame, an i × j cost matrix ( C ) is constructed. Let the observed vector be z j = ( C x , C y , a , h ) ; its squared Mahalanobis distance is expressed by Equation (14):
d M 2 ( i , j ) = ( z j H x i | i 1 ) H P i | i 1 H + R 1 ( z y H x i | i 1 )
If d M 2 ( i , j ) > χ 2 , where χ 2 is the Kalman gating threshold, matching is prohibited, and the cost matrix ( C ( i , j ) ) is set to infinity. Otherwise, the appearance cost is calculated as shown in Equation (15):
a i j = 1 f i , g j f i g j
where f i is the ReID appearance template of the trajectory, and g j is the appearance vector of the detection frame. If a i j > D M A X (the appearance gating threshold), C ( i , j ) = ; otherwise, C ( i , j ) = a i j . In the updated cost matrix, the matching set with the least total cost is identified. Unmatched trajectories and detection frames are marked as “lost” and “new targets”, respectively, allowing for the synchronization of motion and appearance information while maintaining the inter-frame continuity and stability of the target IDs.

3.3. Trajectory Fusion of Multi-Source Heterogeneous Vessel Data

Trajectory similarity computation serves as a fundamental basis for multi-source data fusion. However, in practical trajectory-matching tasks, discrepancies between coordinate systems across heterogeneous data sources often result in inconsistencies in motion patterns, thereby impairing the precision and reliability of similarity evaluation. To address these challenges, this section proposes a customized trajectory-matching framework for fusing AISs and video-derived trajectory data. Specifically, an Enhanced Particle Swarm Optimization (E-PSO) algorithm is employed to explore the rigid transformation parameter space and identify the optimal spatial correction for AIS trajectories. By incorporating an early stopping criterion and a trajectory sparsity-based acceleration strategy, the E-PSO algorithm enables the efficient and precise encoding of rotation angles and translation vectors, thereby improving the alignment between the corrected AIS trajectories and video trajectories in both global configuration and local motion dynamics. On this basis, a distance-based reward–penalty-matching (DBRP-Match) algorithm is introduced to evaluate the trajectory similarity. This method not only identifies optimal matches within a global search space but also effectively mitigates the degradation of the long-range consistency caused by locally optimal yet globally inconsistent alignments.

3.3.1. Enhanced Particle Swarm Optimization

In the Enhanced Particle Swarm Optimization (E-PSO) algorithm, particles are initialized with random velocities and iteratively converge toward the optimal solution via an accelerated update mechanism. At each iteration, the velocity and position of each particle ( i ) are updated based on its previous velocity, personal best position, and the global best position found by the swarm. The position of particle i at iteration t is denoted as x i ( t ) = [ θ i ( t ) , d x i ( t ) , d y i ( t ) ] , where θ i ( t ) represents the rotation angle, and d x i ( t ) and d y i ( t ) represent the horizontal and vertical offsets, respectively. Similarly, the velocity of particle i at iteration t is v i ( t ) = [ v θ , i ( t ) , v d x , i ( t ) , v d y , i ( t ) ] , where v θ , i ( t ) denotes the angular velocity, and v d x , i ( t ) and v d y , i ( t ) represent the horizontal and vertical velocity components. The velocity update is governed by Equation (16):
v i ( t + 1 ) = ω v i ( t ) + c 1 r 1 ( p b e s t i x i ( t ) ) + c 2 r 2 ( g b e s t x i ( t ) )
where ω v i ( t ) is the inertia term reflecting the particle’s previous velocity, c 1 r 1 ( p b e s t i x i ( t ) ) is the cognitive component representing the particle’s personal experience, and c 2 r 2 ( g b e s t x i ( t ) ) is the social component accounting for swarm cooperation. Equation (17) updates the particle’s position as follows:
x i ( t + 1 ) = x i ( t ) + v i ( t + 1 )
To prevent the increase in time complexity caused by excessive iterations, an early stopping strategy and trajectory sparsification mechanism are incorporated into the Particle Swarm Optimization algorithm. The change in the global best position between successive iterations is quantified as | g b e s t ( t + 1 ) g b e s t ( t ) | . If this change remains below a predefined tolerance threshold ( ε ) for K consecutive iterations, the early stopping criterion is triggered, thereby terminating the optimization process and avoiding redundant computations.
Given the original trajectory point sequence { ( t 0 , x 0 , y 0 ) , ( t 1 , x 1 , y 1 ) , , ( t n , x n , y n ) } over the time interval [ t 0 , t n ] , a new trajectory is generated using cubic spline interpolation. This interpolated sequence is subsequently sparsified to extract the key features of the trajectory. To characterize the geometric complexity of a two-dimensional trajectory, its curvature is computed as κ ( t ) = | x ( t ) y ( t ) y ( t ) x ( t ) | [ x ( t ) 2 + y ( t ) 2 ] 3 / 2 , where x ( t ) and y ( t ) denote the first-order derivatives, and x ( t ) and y ( t ) are the second-order derivatives of the trajectory. The curvature is then normalized as κ ~ ( t ) = κ ( t ) κ m a x , where κ m a x denotes the maximum curvature over the entire interval. The adaptive step-size function is computed as shown in Equation (18):
Δ t ( t ) = Δ t m a x κ ~ ( t ) ( Δ t m a x Δ t m i n )
where Δ t m i n represents the minimum sampling interval when the local curvature ( κ ( t ) ) is large, and Δ t m a x denotes the maximum step size when the curvature approaches zero. As κ ~ ( t ) 1 , the trajectory exhibits sharp changes, and Δ t ( t ) Δ t m i n ; conversely, as κ ~ ( t ) 0 , the trajectory becomes nearly linear, and Δ t ( t ) Δ t m a x . Building upon the gradient-based computation and configuration described above, this module performs skip sampling on the original sequence based on the precomputed step size. The next sampling time point is determined by Equation (19), and the sampling proceeds iteratively until t k + 1 t n , at which point the process terminates. The specific formulation is as follows:
t k + 1 = t k + Δ t ( t k ) , k = 0 , 1 , 2 ,
During the final trajectory point selection process, the proposed method effectively retains the global shape and critical turning points of the trajectory while eliminating redundant data. This results in a compact and information-rich representation of the trajectory. The overall workflow of the Enhanced Particle Swarm Optimization (E-PSO) transformation algorithm is illustrated in Algorithm 1, with the detailed steps outlined as follows:
Algorithm 1. Rigid transformation of the E-PSO algorithm
Input:  original trajectory P   [ 0 n ]
PSO parameters  { N , T m a x , ε = 50 , K = 3 , ω , c 1 , c 2 }
   sparsity regularization parameter { Δ t m a x , Δ t m i n }
Output: optimal transformation parameters T = ( θ , d x , d y )
FinalTrajectory ← Final Transformed Trajectory
1:Initialization: Maximum number of particles N _ m a x , Particle parameters x i ( t ) = [ θ i ( t ) , d x i ( t ) , d y i ( t ) ] , p b e s t i (particle’s best position), g b e s t (global best particle position)
2:for i in 0, 1, 2, …, n
3:        r i = i n
4:Construct S x r , S y r using cubic spline interpolation
5:Compute normalized curvature: κ ~ ( r ) . Generate downsampling sequence S p a r s e T using: Δ t ( r ) = Δ t m a x κ ~ ( r ) Δ t m a x Δ t m i n
6:Iterative update: n o _ i m p r o v e = 0
7:while n o _ i m p r o v e < K do
8:        for each i ∈ {1, 2, 3, …, n} do
9:               v i t + 1 = ω v i t + c 1 r 1 p b e s t i x i t + c 2 r 2 g b e s t x i t
10:               x i ( t + 1 ) = x i ( t ) + v i ( t + 1 )
11:              update p b e s t i and g b e s t
12:        end
13:        delta = | g b e s t ( t + 1 ) g b e s t ( t ) |
14:if delta < ε
15:no_improve = no_improve + 1
16:end
17:Return T, FinalTrajectory
18:End

3.3.2. Trajectory-Matching Algorithm (DBRP-Match)

To establish identity associations between video trajectories and AIS trajectories, this paper models the matching algorithm as a binary classification problem, where the task is to determine whether any given pair of trajectories belong to the same target. Given the differences in the sampling frequency, coordinate accuracy, and time alignment across various data sources, this paper introduces a spatial tolerance threshold ( δ ) at the trajectory point level and designs a trajectory-level reward–penalty mechanism based on the point–pair-matching relationship. Specifically, when the Euclidean distance between synchronized trajectory point pairs is smaller than the δ , the pair is considered a valid match and assigned a positive score. Conversely, a penalty is imposed. The final trajectory-matching score is derived from the consistency trend of all point pairs, and the matching decision is made based on the score, allowing for a certain range of matching errors. Consequently, the trajectory-matching algorithm achieves efficient heterogeneous trajectory fusion and data association while maintaining model robustness. To achieve the aforementioned modeling objectives, the DBRP-Match trajectory-matching algorithm is proposed.
Let T v i d e o = ( v 1 x , v 1 y ) , , ( v i x , v i y ) , , ( v m x , v m y ) denote the target trajectory extracted from the video data, and let T a i s = ( a 1 x , a 1 y ) , , ( a i x , a i y ) , , ( a n x , a n y ) represent the corresponding trajectory obtained from AIS data. Here, ( v i x , v i y ) and ( a i x , a i y ) denote position points in a two-dimensional space. To compute the trajectory similarity using the DBRP-Match algorithm, a two-dimensional cost matrix ( M R m × n ) is first constructed. The element M ( 0 , 0 ) represents the penalty for aligning two empty trajectories and is initialized to 0. The boundary elements M ( i , 0 ) and M ( 0 , j ) represent the minimum penalty costs for matching the first i video points or the first j AIS points with an empty sequence, respectively, and are initialized as i and j . Subsequently, the Euclidean distance ( d i j ) between the trajectory points ( v i x , v i y ) and ( a i x , a i y ) is calculated using Equation (20):
d i j = ( v i x a j x ) 2 + ( v i y a j y ) 2
Let δ = w i d t h 1.25 2 + h e i g h t 1.25 2 denote the matching threshold. The parameter width and height correspond to the dimensions of the bounding box for the detected vessel in the video, representing its width and height, respectively.
To further improve the robustness and precision of trajectory matching, this paper proposes a dynamic matching strategy that integrates both reward–penalty mechanisms. This approach is designed to effectively mitigate abnormal deviations during the matching process. The main components of the strategy are as follows:
(1)
Dynamic Distance Penalty Mechanism:
When the distance between trajectory points exceeds a predefined threshold ( δ ), the deviation is considered indicative of potential mismatching. In such cases, a dynamic distance penalty term is introduced to penalize incorrect matches. The penalty value increases proportionally with the degree of deviation, with the exact computation detailed in Equation (21):
D y n a m i c _ p e n a l t y ( i , j ) = β × ( d ( i , j ) δ )
where d ( i , j ) denotes the Euclidean distance between the trajectory points v i and a j , and β is the dynamic penalty coefficient used to adjust the magnitude of the penalty term.
(2)
Time Penalty Mechanism:
To further ensure temporal synchronization between trajectory sequences, a time penalty term is introduced to quantify the time discrepancy between corresponding trajectory points. It is computed as shown in Equation (22):
T e m p o r a l _ p e n a l t y ( i , j ) = γ × Δ t ( i , j )
Here, Δ t ( i , j ) = t i t j represents the time difference between the trajectory points, and γ denotes the time penalty coefficient.
When the distance between trajectory points is within the predefined threshold ( δ ), the points are considered successfully matched, and no penalty is applied. Building upon the value of M ( i 1 , j 1 ) , a dynamic reward mechanism is introduced to adaptively reinforce high-quality matching results.
(3)
Dynamic Reward Mechanism:
A Gaussian decay function is employed to reward matching pairs, thereby promoting combinations with high spatial and temporal consistency. The reward function is given by Equation (23):
r e w a r d i j = A e x p d 2 ( i , j ) 2 σ 2
Here, A denotes the reward amplitude, and σ is the standard deviation of the Gaussian decay. This reward mechanism enhances spatial–temporal consistency, while the penalty term preserves the structural integrity of the trajectory.
The aforementioned punishment and reward strategies are jointly embedded in the update process of the matching cost matrix, adaptively modulating the weights associated with spatial and temporal consistency—assigning greater incentives to higher consistency. Additionally, global dynamic relationships are duly considered, thereby enhancing the overall stability and discriminative capability of the matching process.
M i , j = M i 1 , j 1 + r e w a r d i j ,   d i j ϵ   m i n M i 1 , j , M i , j 1 , M i 1 , j 1 D y n a m i c _ p e n a l t y ( i , j ) T e m p o r a l _ p e n a l t y ( i , j ) ,   o t h e r w i s e
The matching mechanism of DBRP-Match is defined in Equation (24). When the distance between a pair of points falls below a predefined threshold, the current matching position inherits the accumulated similarity score from the previously matched pair, with an additional dynamic reward term incorporated. Otherwise, the similarity score is computed as the minimum among those of adjacent point pairs, penalized by both a temporal cost and a dynamic distance penalty. M i , j represents the total accumulated similarity score at the terminal point i , j after traversing the entire pair of trajectories.
Due to discrepancies in trajectory lengths, directly comparing the minimum edit cost may lead to bias. To enhance the comparability and robustness of the trajectory matching across sequences with different lengths and sampling rates, a normalization strategy is employed. Specifically, the total edit cost is divided by the maximum value among all trajectory points, yielding a scale-independent normalized cost. The formal expression is defined as in Equation (25):
Similarity ( T v i d e o , T a i s ) = M ( m , n ) r e w a r d × m i n ( m , n )
To normalize the similarity index ( T v i d e o , T a i s ) , its value is restricted to the range [ 0 , 1 ] . This ensures that even when trajectory sampling granularities differ or trajectory spans vary significantly, the long-range dependencies can still be effectively represented. Such normalization improves the robustness of the matching strategy under complex input conditions.
The overall workflow of the DBRP-Match trajectory-matching algorithm is shown in Algorithm 2, with the detailed formulations provided below:
Algorithm 2. DBRP-Match Trajectory-Matching Algorithm
Input:  T v i d e o : a set of video trajectory points defined as ( v 1 x , v 1 y ) , . , ( v i x , v i y ) , . , ( v m x , v m y )
     T a i s : a set of AIS trajectory points defined as
     δ : matching tolerance distance threshold
Output:  S i m i l a r i t y 0 , 1 # similarity score
1: Initialize   an   m × n   dynamic   matrix   M :
  Set M 0 , 0 = 0
   For   1 i m ,   set   M i , 0 = i
   For   1 j n ,   set   M 0 , j = j
2: for   i = 1   to   m :
3:   for   j =   1   to   n :
4:      compute   the   Euclidean   distance   d i j   between   trajectory   points   ( v i x , v i y )   and   ( a j x , a j y )
5:      if   d i j δ
6:       M i , j = M i 1 , j 1
7:    else
8: M i , j = m i n { M i 1 , j , M i , j 1 , M i 1 , j 1 , } D y n a m i c _ p e n a l t y i , j Temporal _ penalty i , j
9: M ( m , n ) ← minimum total cost of trajectory matching
10: Similarity   ( T v i d e o , T a i s ) = 1 M ( m , n ) m a x ( m , n )
# Compute the normalized trajectory similarity
11:Return similarity
12:End

4. Results

To effectively evaluate the performance of the proposed algorithm, experiments were conducted by matching vessel video trajectories with AIS trajectories. The experimental section of this paper is based on the FVessel dataset [45]. The FVessel dataset consists of 26 videos and corresponding AIS data for specific time periods. The videos in the dataset have a resolution of 2560 × 1440 pixels and were filmed in the Wuhan section of the Yangtze River. Filming locations included bridges and riverbanks, capturing various weather conditions. The total duration of the dataset is approximately 309 min, and it contains data for about 107 vessels. The dataset representation is shown in Figure 5 and Figure 6, where Figure 5 illustrates the riverbank in the Wuhan section of the Yangtze River, and Figure 6 shows a bridge in the Yangtze River basin.
The development environment used in this work was PyCharm Community Edition 2021.2.2. The hardware specifications were as follows: 16 GB of RAM, and the GPU was an NVIDIA GeForce RTX 3060 Laptop GPU (Santa Clara, CA, USA).

4.1. Evaluation Metrics

To further evaluate the overall performance of the trajectory matching, this study treats the “video trajectory–AIS trajectory”-matching task as a binary classification problem, utilizing precision and recall as evaluation metrics. Let the number of true positives (TPs) and false positives (FPs) be denoted as follows; the definitions of each metric are provided below, and the corresponding notations are given in Equations (26) and (27):
P r e c i s i o n = T P T P + F P
R e c a l l = T P T P + F N
Precision focuses on evaluating the false-positive rate control of the detection system, assessing the ratio of truly correct matches among all the trajectories deemed correct by the system. Recall reflects the system’s tolerance for missed detections, representing the proportion of successfully identified and matched trajectories among all the true matching trajectories. Furthermore, to quantify the spatial deviation between matching points, this study introduces the mean-squared error (MSE) and the coefficient of determination ( R 2 ). The calculation formulas are as shown in Equations (28) and (29):
M S E = 1 P P = 1 P ν i x a j x 2 + ν i y a j y 2
R 2 = 1 i = 1 P ( y i y ^ i ) 2 i = 1 P ( y i y ¯ ) 2
Among these, P represents the total number of matched point pairs. The mean-squared error (MSE) is used to measure the pixel-level mean-squared error between corresponding points on the AIS trajectory before and after rotation correction, and the video trajectory. The coefficient of determination, R 2 , is used to evaluate the degree of fit between the trajectories before and after transformation. The value of the R 2 ranges from to 1, where a value closer to 1 indicates a better fit, while a value close to 0 or negative suggests a poor fit.

4.2. Comparison of SSGDA with Other Algorithms on the FVessel Dataset

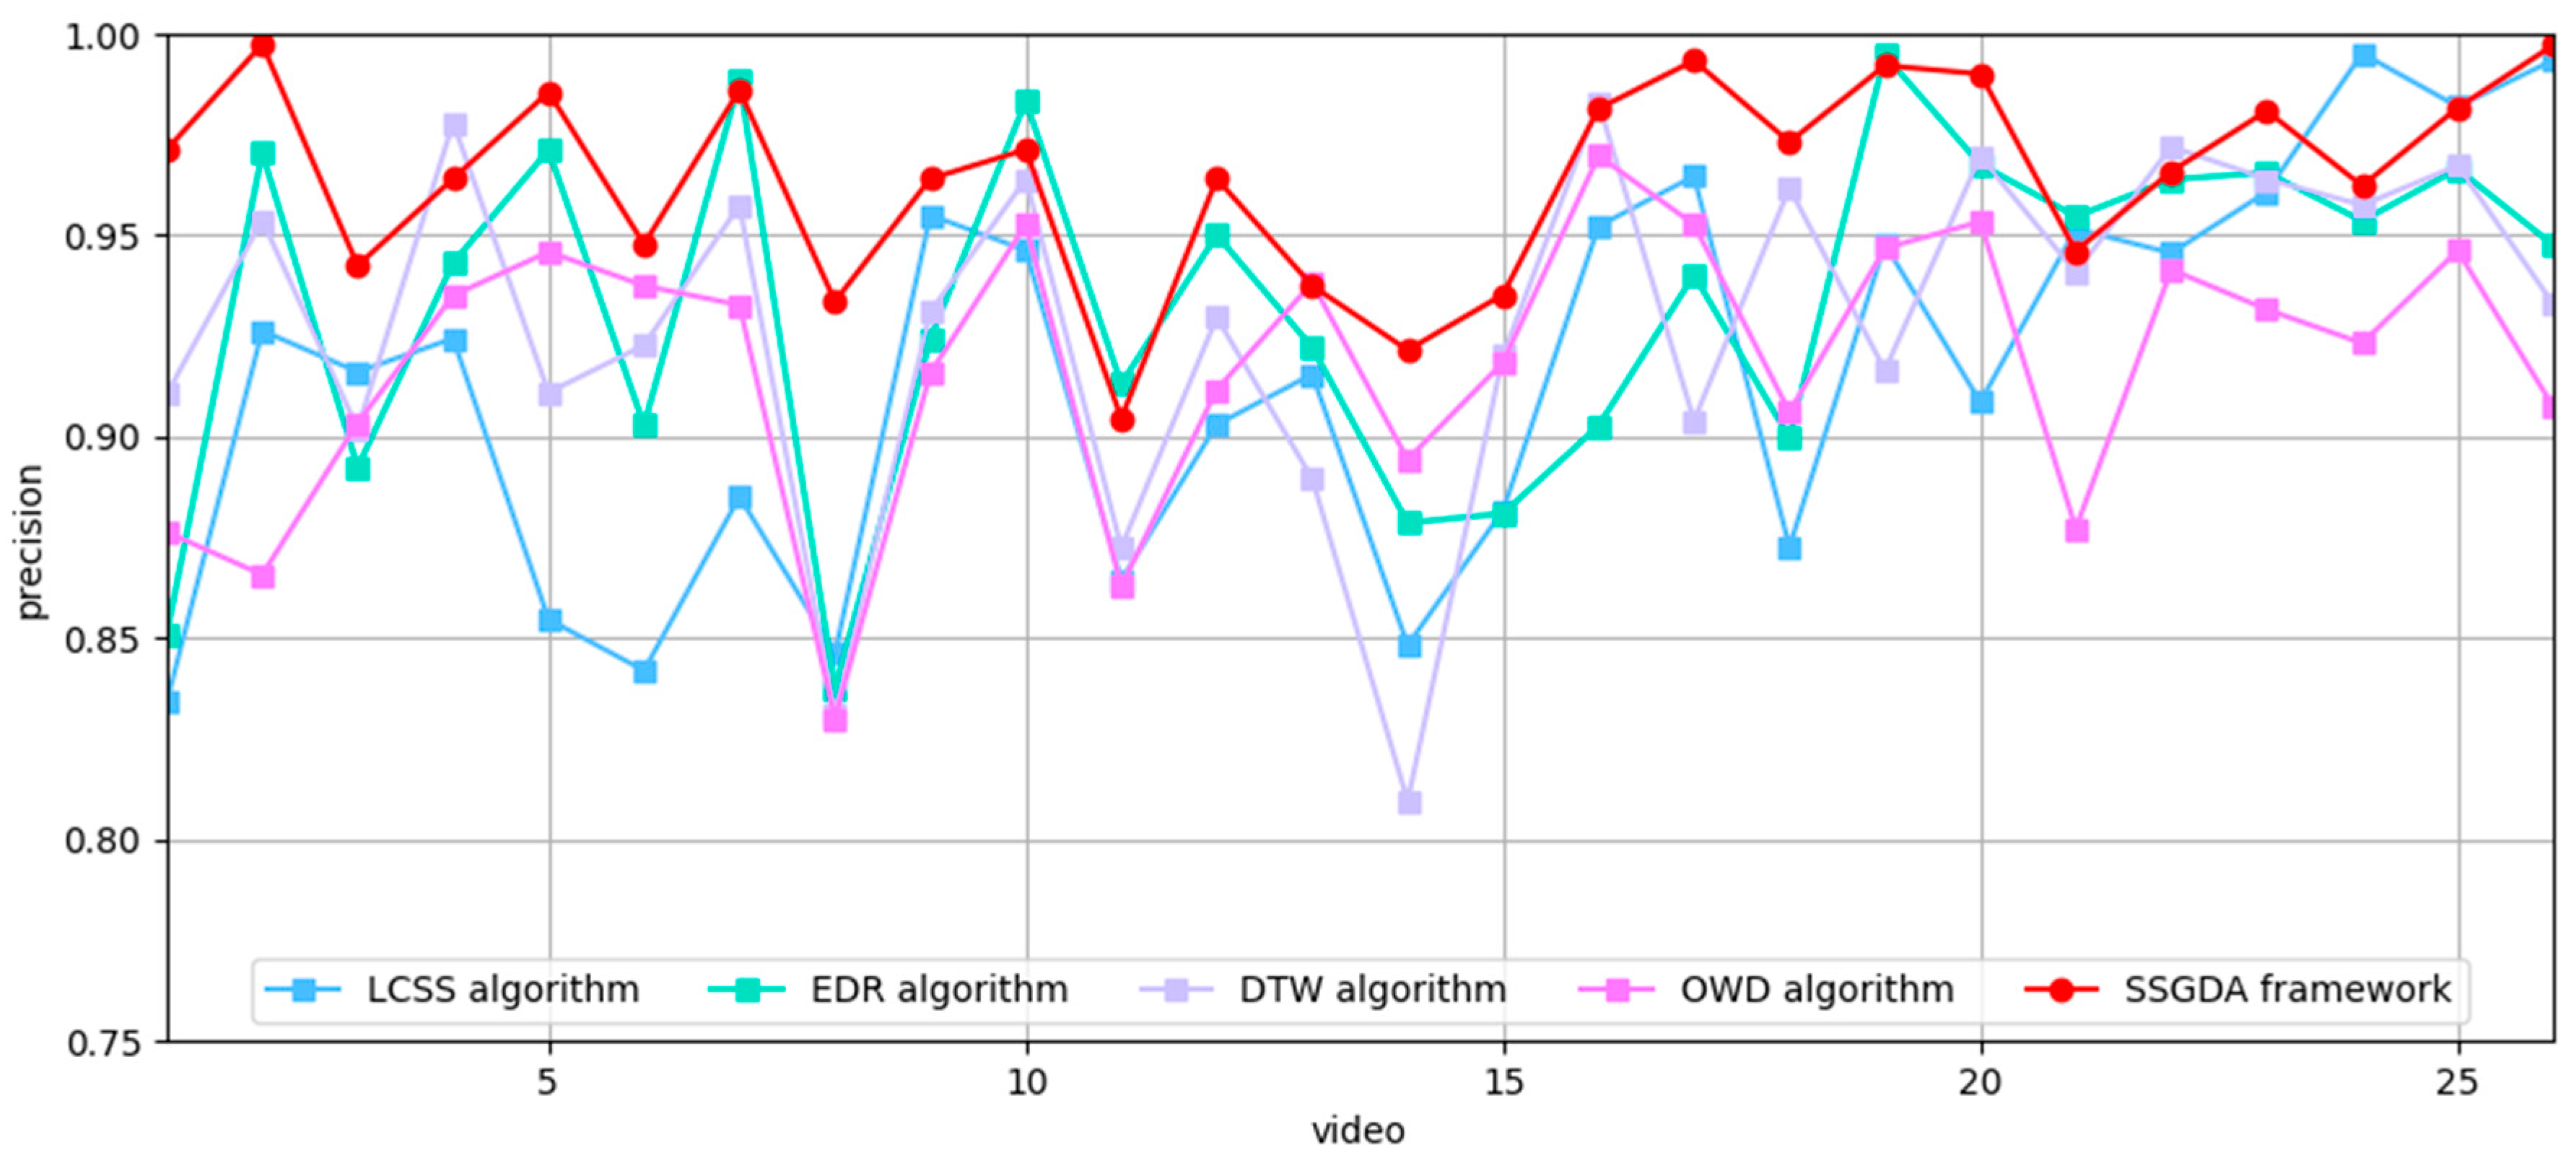
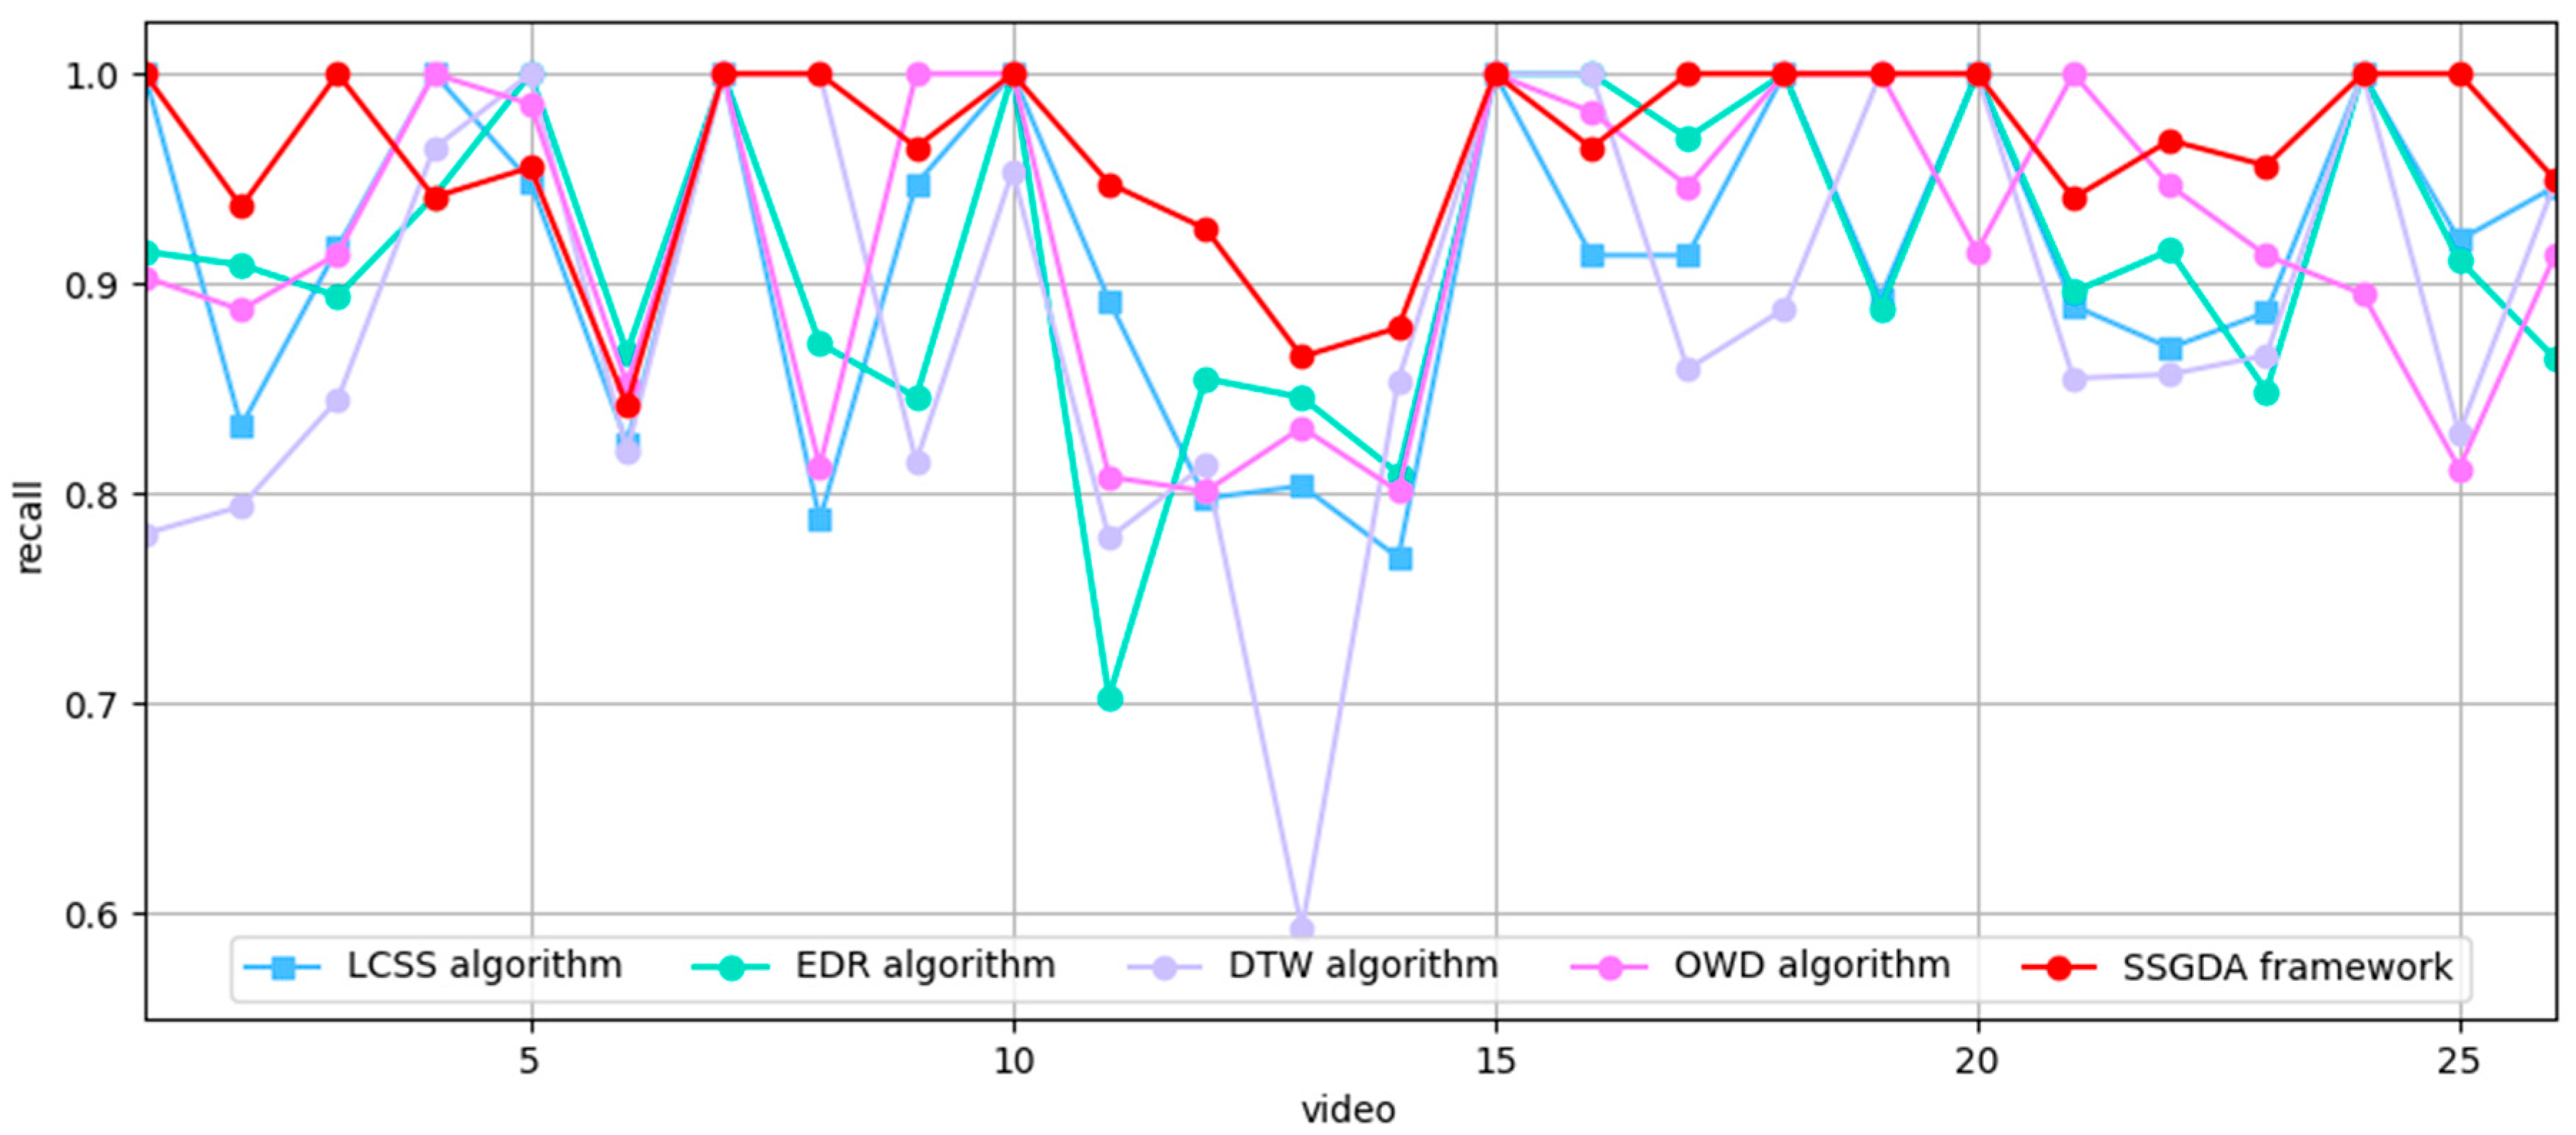
To assess the performance of the SSGDA trajectory-matching method proposed in this paper for matching video trajectories with AIS trajectories, comparative experiments were conducted between the SSGDA framework and several classical trajectory-matching algorithms on the FVessel dataset. The results, including the matching precision and recall rate, are presented in Figure 7 and Figure 8.
The comparison results in this paper focus solely on absolute percentage points, with Figure 7 and Figure 8 consistently evaluating the metrics in terms of precision and recall. The SSGDA method integrates trajectory shape similarity modeling and a dynamic reward–penalty mechanism, effectively balancing accuracy and robustness. Specifically, SSGDA is capable of modeling the global shape of trajectories, allowing it to accurately capture the overall matching trend of trajectories with unequal lengths and heterogeneous distributions. The dynamic reward–penalty mechanism adaptively adjusts the local error weight, improving sensitivity to key inflection points and anomalies while reinforcing control over the global pattern to ensure the accurate matching of local details. In contrast, LCSS matching heavily relies on spatial and temporal tolerance parameters, lacks adaptability, and struggles to handle scale differences and time shifts in heterogeneous data. Additionally, it only matches based on point-to-point distances, overlooking the overall trajectory shape and motion trend. The EDR algorithm focuses on local editing operations and neglects the overall trajectory structure, making it difficult to capture global motion characteristics. DTW emphasizes forced point-to-point pairing, which is sensitive to noise and local anomalies. It focuses solely on temporal distance, lacks shape modeling capabilities, and cannot effectively capture the global trend of target trajectories, nor does it possess cross-modal adaptability. The OWD algorithm improves adaptability to time-series distortions by dynamically adjusting the timeline, but its matching process lacks a representation of the overall trajectory geometry and motion patterns, making it unable to reflect the global characteristics of target trajectories. The overall experimental results indicate that the SSGDA method achieved the highest average matching precision in the trajectory-matching task. Compared to the LCSS, EDR, DTW, and OWD algorithms, the matching precision improved by 4.51%, 3.17%, 3.61%, and 4.67%, respectively, while the recall increased by 4.94%, 4.62%, 3.53%, and 4.29%, respectively. The SSGDA framework not only focuses on the similarity between sampling points but also incorporates a dynamic reward–penalty mechanism, enabling it to emphasize the overall shape of the trajectory. Through various trade-offs, it compensates for the limitations of traditional algorithms that focus solely on local or global similarity. Moreover, SSGDA demonstrates a superior performance over traditional LCSS algorithms in spatiotemporal joint modeling, as evidenced by its more reasonable balance in handling the challenges of matching trajectories of varying lengths and heterogeneity. Comparative results across multiple scenarios further validate its comprehensive advantages under different matching strategies.

4.3. Ablation Experiments

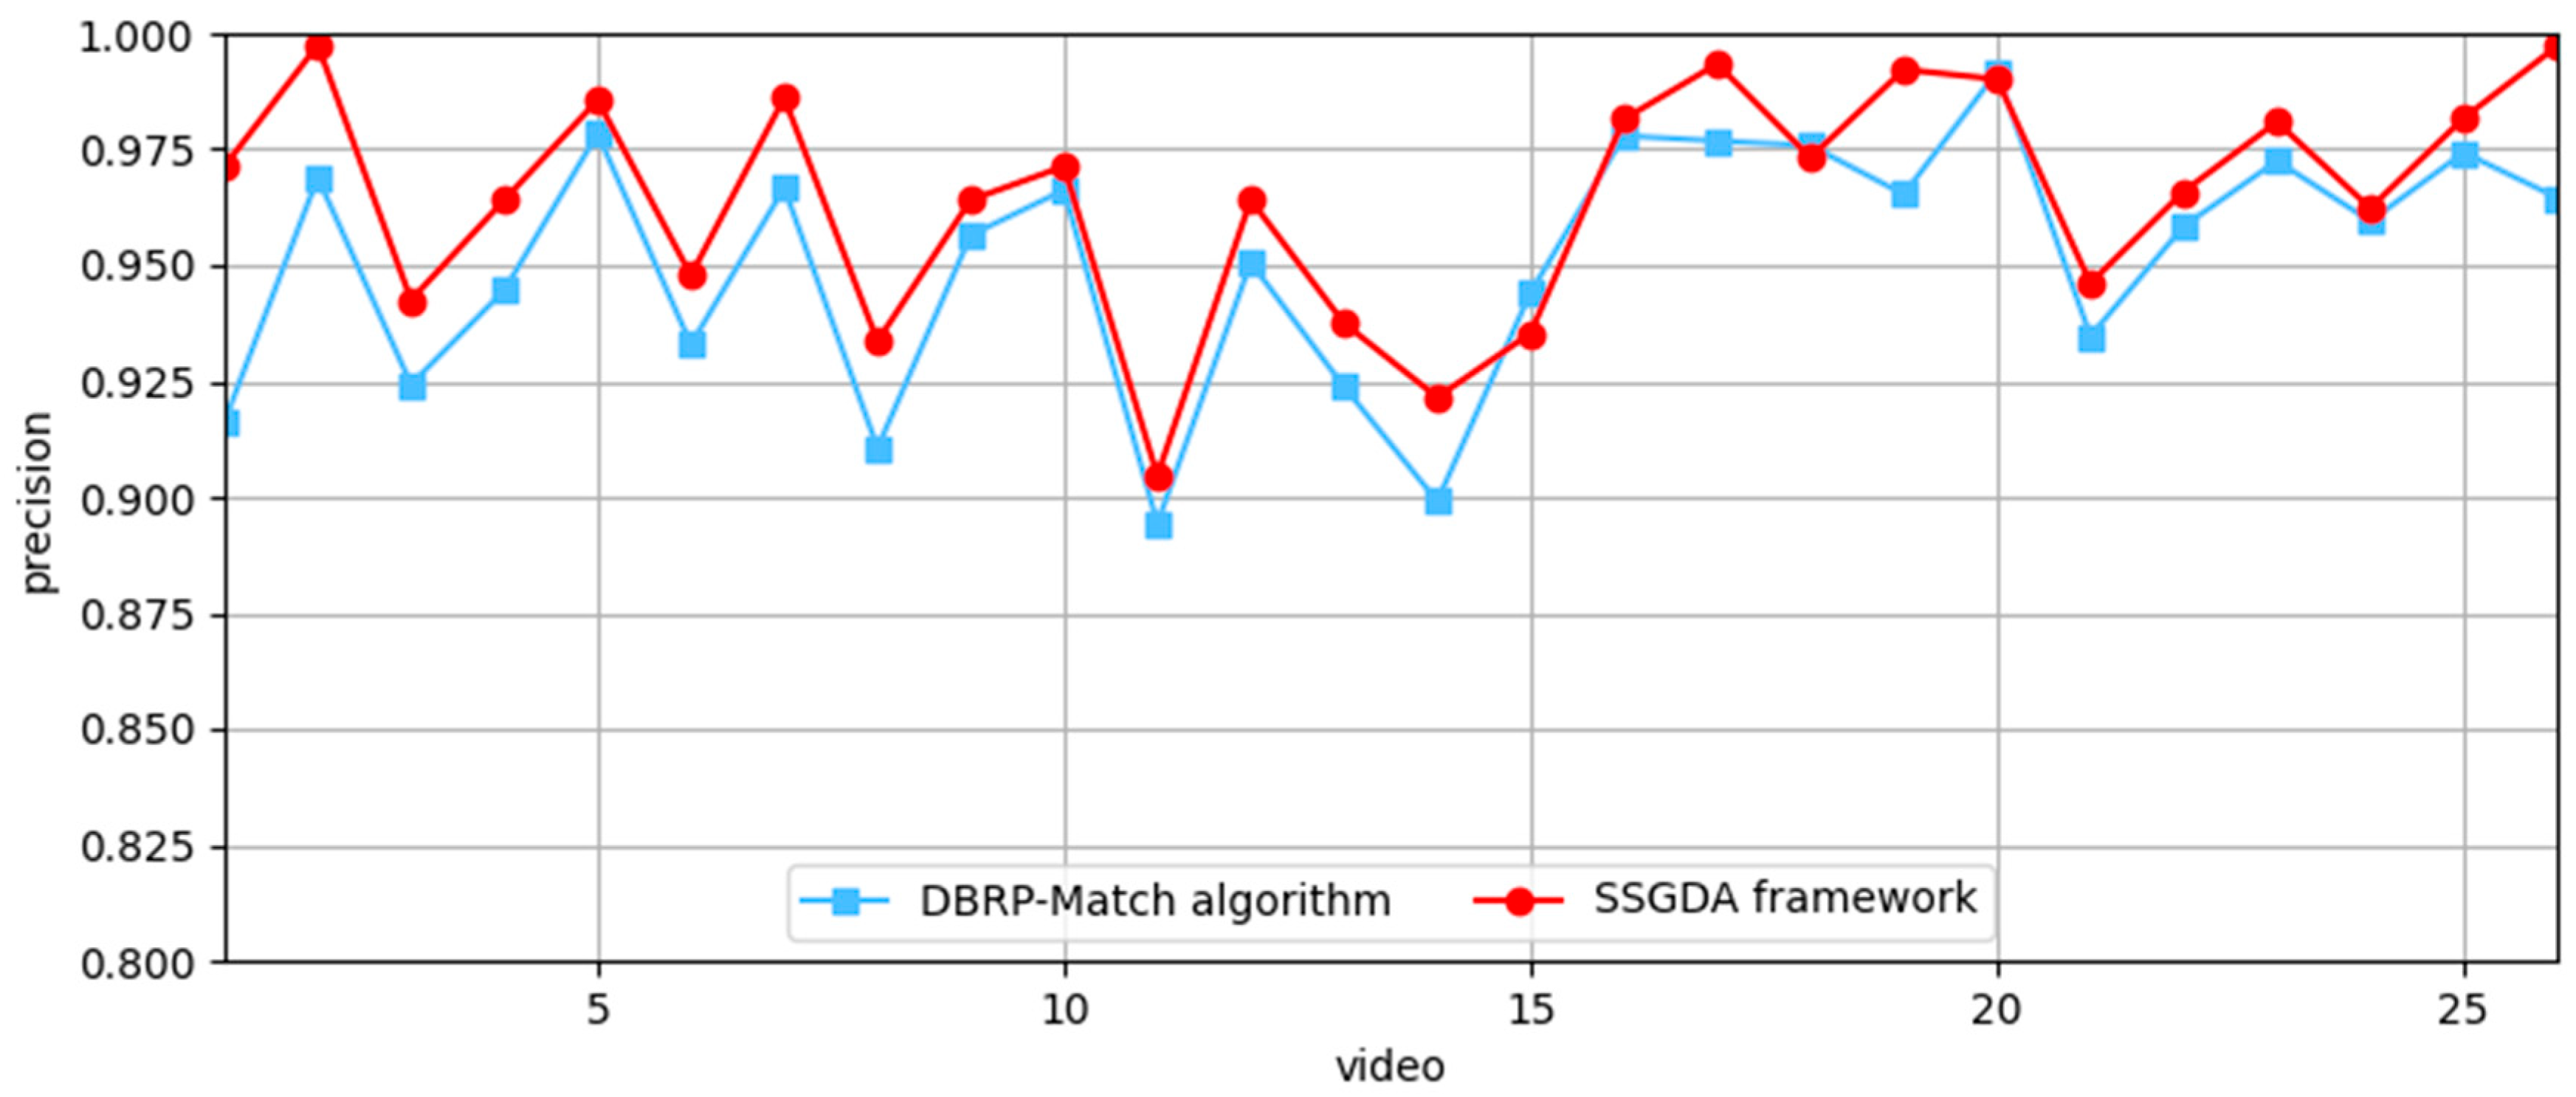
This experiment performed an ablation study on the FVessel dataset to quantify the contributions of the trajectory translation and rotation modules in E-PSO to the matching precision and recall rate. Additionally, it analyzed the impact of this rigid transformation on the global mean-squared error (MSE) and the coefficient of determination ( R 2 ) of the post-matching trajectories. The results are presented in Figure 9 and Figure 10.
The experimental results show that incorporating the E-PSO trajectory translation module improved the matching precision of the DBRP-Match algorithm by 1.39% compared to the version without the module. The mean-squared error between the tracks is 189.06 pixels without using E-PSO, while the mean-squared error after translation conversion with E-PSO is 91.24 pixels, a reduction of 97.82 pixels. After introducing the E-PSO trajectory rotation and translation algorithm, the average R 2 coefficient increased by 14.92%, indicating that the corrected trajectory more closely aligns with the motion trend of the actual matched trajectory. The E-PSO algorithm effectively balances the global semantic search for similar trajectory motion data with the ability to capture local patterns, enabling the DBRP-Match fusion algorithm to achieve more reliable matching through improved initial alignment. This significantly enhances the trajectory-matching precision and robustness.

4.4. Trajectory Visualization Analysis

This section evaluates the role of the E-PSO algorithm in trajectory matching through visual analysis. Visual analysis is used to compare the alignment of video and AIS trajectories before and after optimization. Figure 11 compares the spatial alignment before and after optimization. As shown in Figure 11, Figure 11a,c represent the original video and AIS trajectories captured along the riverbank and bridge without E-PSO correction, while Figure 11b,d show the trajectories after E-PSO correction, with the AIS trajectories corrected for translation and rotation. The experiments demonstrate that after rigid rotation correction by the E-PSO algorithm, AIS trajectories exhibit greater consistency with video trajectories in both overall direction and local motion patterns. This improves the coordinate alignment precision and reduces deviations caused by sensor coordinate transformation errors. Figure 12 illustrates the effectiveness of the SSGDA method for trajectory matching in real scenarios, successfully matching trajectories and accurately mapping AIS information to vessel targets in the video.

5. Conclusions

This paper addresses the problem of matching video and AIS trajectories in canal monitoring. It proposes a multi-source heterogeneous trajectory-matching method using the SSGDA framework. First, the method applies an improved Particle Swarm Optimization (E-PSO) algorithm for the optimal rigid transformation of AIS data to correct coordinates; then, high-precision video trajectories are constructed using YOLOv11 and DeepSORT; finally, the DBRP-Match algorithm is used for the precise matching of video trajectories with the corrected AIS segments. Using the publicly available FVessel dataset, actual measurements were conducted. The analysis revealed that the proposed method outperforms various typical trajectory-matching algorithms in terms of the matching precision on real canal scene data. The SSGDA framework achieved an average detection precision of 96.50%. After introducing the E-PSO algorithm, the mean-squared error decreased by 97.82 pixels, and the coefficient of determination increased by 14.92%. Overall, the proposed multi-source asynchronous trajectory-matching method provides strong technical support for applications such as navigation safety assurance, scheduling optimization, and environmental monitoring in intelligent canal systems. This study is intended for application in the Pinglu Canal Basin, which is currently under construction. Cameras and AIS receivers have been installed around the basin, with plans for field verification of the technology in the future.
However, the robustness of this method in handling large-scale trajectory data gaps still requires improvement, and the adaptive adjustment of the algorithm parameters will be a key focus of future research. Additionally, in complex scenarios with dense targets and highly overlapping trajectories, the existing detection framework may struggle to accurately distinguish true trajectory similarities between individuals. Therefore, there is an urgent need to develop frameworks for multi-batch and multi-scale individual trajectory tracking. Based on the foundation of an effective area-based foreground segmentation process and a multi-view visual interaction system, the proposed algorithm and its derivatives are expected to play a more significant role in complex scenarios.

Author Contributions

Conceptualization, J.Z. and M.W.; software, J.Z.; experiment analysis, J.Z. and Z.X.; writing—review and editing, J.Z., M.W. and R.K.; funding acquisition, M.W. and R.K.; investigation, J.Z.; visualization, J.Z.; supervision, J.Z. and M.W.; project administration, J.Z. and M.W. All authors have read and agreed to the published version of the manuscript.

Funding

This research was funded by the Guangxi Science and Technology Major Program under Grant No. GuikeAA23062035 and Grant No. GuikeAD23026032.

Data Availability Statement

We are unreservedly willing to provide the research data or key codes mentioned in this manuscript. If necessary, please contact Jia-yu Zhang via email (1020231188@glut.edu.cn) to obtain the Baidu Netdisk (Baidu Cloud) URL link and then download the files you need.

Acknowledgments

We are all very grateful to the volunteers and staff from GLUT and GUET for their selfless assistance during our experiments.

Conflicts of Interest

The authors declare no conflicts of interest.

References

  1. Ding, H.; Weng, J.; Shi, K. Real-time assessment of ship collision risk using image processing techniques. Appl. Ocean Res. 2024, 153, 104241. [Google Scholar] [CrossRef]
  2. Tang, N.; Wang, X.; Gao, S.; Ai, B.; Li, B.; Shang, H. Collaborative ship scheduling decision model for green tide salvage based on evolutionary population dynamics. Ocean Eng. 2024, 304, 117796. [Google Scholar] [CrossRef]
  3. Hao, G.; Xiao, W.; Huang, L.; Chen, J.; Zhang, K.; Chen, Y. The Analysis of Intelligent Functions Required for Inland Ships. J. Mar. Sci. Eng. 2024, 12, 836. [Google Scholar] [CrossRef]
  4. Hu, D.; Chen, L.; Fang, H.; Fang, Z.; Li, T.; Gao, Y. Spatio-temporal trajectory similarity measures: A comprehensive survey and quantitative study. IEEE Trans. Knowl. Data Eng. 2023, 36, 2191–2212. [Google Scholar] [CrossRef]
  5. Chen, G.; Liu, Z.; Yu, G.; Liang, J.; Hemanth, J. A new view of multisensor data fusion: Research on generalized fusion. Math. Probl. Eng. 2021, 2021, 5471242. [Google Scholar] [CrossRef]
  6. Guo, Z.; Yin, C.; Zeng, W.; Tan, X.; Bao, J. Data-driven method for detecting flight trajectory deviation anomaly. J. Aerosp. Inf. Syst. 2022, 19, 799–810. [Google Scholar] [CrossRef]
  7. Haoyan, W.; Yuangang, L.; Shaohua, L.; Bo, L.; Zongyi, H. A path increment map matching method for high-frequency trajectory. IEEE Trans. Intell. Transp. Syst. 2023, 24, 10948–10962. [Google Scholar] [CrossRef]
  8. Girshick, R.; Donahue, J.; Darrell, T.; Malik, J. Rich feature hierarchies for accurate object detection and semantic segmentation. In Proceedings of the IEEE Conference on Computer Vision and Pattern Recognition, Columbus, OH, USA, 23–28 June 2014; pp. 580–587. [Google Scholar]
  9. Vu, T.; Jang, H.; Pham, T.X.; Yoo, C. Cascade RPN: Delving into high-quality region proposal network with adaptive convolution. In Proceedings of the 32nd Conference on Neural Information Processing Systems (NeurIPS 2019), Vancouver, CA, Canada, 8–14 December 2019; Advances in Neural Information Processing Systems 32, Volume 2 of 20. Curran Associates, Inc.: New York, NY, USA, 2020; pp. 1421–1431. [Google Scholar]
  10. Dewi, C.; Chen, R.-C.; Yu, H. Weight analysis for various prohibitory sign detection and recognition using deep learning. Multimedia Tools Appl. 2020, 79, 32897–32915. [Google Scholar] [CrossRef]
  11. Bai, D.; Sun, Y.; Tao, B.; Tong, X.; Xu, M.; Jiang, G.; Chen, B.; Cao, Y.; Sun, N.; Li, Z. Improved single shot multibox detector target detection method based on deep feature fusion. Concurr. Comput. Pract. Exp. 2021, 34, e6614. [Google Scholar] [CrossRef]
  12. Liu, H.; Wu, W. Interacting multiple model (IMM) fifth-degree spherical simplex-radial cubature Kalman filter for maneuvering target tracking. Sensors 2017, 17, 1374. [Google Scholar] [CrossRef] [PubMed]
  13. Ubeda-Medina, L.; Garcia-Fernandez, A.F.; Grajal, J. Adaptive auxiliary particle filter for track-before-detect with multiple targets. IEEE Trans. Aerosp. Electron. Syst. 2017, 53, 2317–2330. [Google Scholar] [CrossRef]
  14. Zhang, Y.; Sun, P.; Jiang, Y.; Yu, D.; Weng, F.; Yuan, Z.; Luo, P.; Liu, W.; Wang, X. Bytetrack: Multi-object tracking by associating every detection box. In Proceedings of the European Conference on Computer Vision, Tel Aviv, Israel, 23–24 October 2022; Springer: Cham, Switzerland; pp. 1–21. [Google Scholar]
  15. Cao, J.; Pang, J.; Weng, X.; Khirodkar, R.; Kitani, K. Observation-centric sort: Rethinking sort for robust multi-object tracking. In Proceedings of the IEEE/CVF Conference on Computer Vision and Pattern Recognition, Vancouver, BC, Canada, 17–24 June 2023; pp. 9686–9696. [Google Scholar]
  16. Wu, B.; Liu, C.; Jiang, F.; Li, J.; Yang, Z. Dynamic identification and automatic counting of the number of passing fish species based on the improved DeepSORT algorithm. Front. Environ. Sci. 2023, 11, 1059217. [Google Scholar] [CrossRef]
  17. Chen, X.; Yan, B.; Zhu, J.; Wang, D.; Yang, X.; Lu, H. Transformer tracking. In Proceedings of the IEEE/CVF Conference on Computer Vision and Pattern Recognition, Nashville, TN, USA, 20–25 June 2021; pp. 8126–8135. [Google Scholar]
  18. Wang, Y.; Kitani, K.; Weng, X. Joint object detection and multi-object tracking with graph neural networks. In Proceedings of the 2021 IEEE International Conference on Robotics and Automation (ICRA), Xi’an, China, 30 May 30–5 June 2021; pp. 13708–13715. [Google Scholar]
  19. Yi, C.; Xu, B.; Chen, J.; Chen, Q.; Zhang, L. An improved YOLOX model for detecting strip surface defects. Steel Res. Int. 2022, 93, 2200505. [Google Scholar] [CrossRef]
  20. Qin, X.; Yu, C.; Liu, B.; Zhang, Z. YOLO8-FASG: A high-accuracy fish identification method for underwater robotic system. IEEE Access 2024, 12, 73354–73362. [Google Scholar] [CrossRef]
  21. Huang, Y.; Wang, D.; Wu, B.; An, D. NST-YOLO11: ViT Merged Model with Neuron Attention for Arbitrary-Oriented Ship Detection in SAR Images. Remote Sens. 2024, 16, 4760. [Google Scholar] [CrossRef]
  22. Chen, M.; Yu, L.; Zhi, C.; Sun, R.; Zhu, S.; Gao, Z.; Ke, Z.; Zhu, M.; Zhang, Y. Improved faster R-CNN for fabric defect detection based on Gabor filter with Genetic Algorithm optimization. Comput. Ind. 2022, 134, 103551. [Google Scholar] [CrossRef]
  23. Zhang, Z.; Liu, Y.; Zhou, Z.; Yang, G.; Wu, Q.M.J. Efficient object detector via dynamic prior and dynamic feature fusion. Comput. J. 2024, 67, 3196–3206. [Google Scholar] [CrossRef]
  24. Wang, J.; Zhang, X.; Gao, G.; Lv, Y.; Li, Q.; Li, Z.; Wang, C.; Chen, G. Open pose mask R-CNN network for individual cattle recognition. IEEE Access 2023, 11, 113752–113768. [Google Scholar] [CrossRef]
  25. Shi, H.; Ning, J.; Fu, Y.; Ni, J. Improved MDNet tracking with fast feature extraction and efficient multiple domain training. Signal Image Video Process. 2020, 15, 121–128. [Google Scholar] [CrossRef]
  26. Xiang, S.; Zhang, T.; Jiang, S.; Han, Y.; Zhang, Y.; Guo, X.; Yu, L.; Shi, Y.; Hao, Y. Spiking siamfc++: Deep spiking neural network for object tracking. Nonlinear Dyn. 2024, 112, 8417–8429. [Google Scholar] [CrossRef]
  27. Choi, W.; Cho, J.; Lee, S.; Jung, Y. Fast constrained dynamic time warping for similarity measure of time series data. IEEE Access 2020, 8, 222841–222858. [Google Scholar] [CrossRef]
  28. Han, T.; Peng, Q.; Zhu, Z.; Shen, Y.; Huang, H.; Abid, N.N. A pattern representation of stock time series based on DTW. Phys. A Stat. Mech. Its Appl. 2020, 550, 124161. [Google Scholar] [CrossRef]
  29. Khan, R.; Ali, I.; Altowaijri, S.M.; Zakarya, M.; Rahman, A.U.; Ahmedy, I.; Khan, A.; Gani, A. LCSS-based algorithm for computing multivariate data set similarity: A case study of real-time WSN data. Sensors 2019, 19, 166. [Google Scholar] [CrossRef]
  30. Soleimani, G.; Abessi, M. DLCSS: A new similarity measure for time series data mining. Eng. Appl. Artif. Intell. 2020, 92, 103664. [Google Scholar] [CrossRef]
  31. Han, K.; Xu, Y.; Deng, Z.; Fu, J. DFF-EDR: An indoor fingerprint location technology using dynamic fusion features of channel state information and improved edit distance on real sequence. China Commun. 2021, 18, 40–63. [Google Scholar] [CrossRef]
  32. Koide, S.; Xiao, C.; Ishikawa, Y. Fast subtrajectory similarity search in road networks under weighted edit distance constraints. arXiv 2020, arXiv:2006.05564. [Google Scholar] [CrossRef]
  33. Har-Peled, S.; Raichel, B. The Fréchet distance revisited and extended. ACM Trans. Algorithms 2014, 10, 1–22. [Google Scholar] [CrossRef]
  34. Lin, B.; Su, J. One way distance: For shape based similarity search of moving object trajectories. GeoInformatica 2007, 12, 117–142. [Google Scholar] [CrossRef]
  35. Bang, Y.; Kim, J.; Yu, K. An improved map-matching technique based on the fréchet distance approach for pedestrian navigation services. Sensors 2016, 16, 1768. [Google Scholar] [CrossRef]
  36. Wen, J.; Liu, H.; Li, J. PTDS CenterTrack: Pedestrian tracking in dense scenes with re-identification and feature enhancement. Mach. Vis. Appl. 2024, 35, 54. [Google Scholar] [CrossRef]
  37. Yu, Q.; Hu, F.; Ye, Z.; Chen, C.; Sun, L.; Luo, Y. High-frequency trajectory map matching algorithm based on road network topology. IEEE Trans. Intell. Transp. Syst. 2022, 23, 17530–17545. [Google Scholar] [CrossRef]
  38. Wu, Z.; Chen, G.; Gan, Y.; Wang, L.; Pu, J. MVFusion: Multi-view 3D object detection with semantic-aligned radar and camera fusion. In Proceedings of the 2023 IEEE International Conference on Robotics and Automation (ICRA), London, UK, 29 May–2 June 2023; pp. 2766–2773. [Google Scholar]
  39. Li, Y.; Zeng, K.; Shen, T. CenterTransFuser: Radar point cloud and visual information fusion for 3D object detection. EURASIP J. Adv. Signal Process. 2023, 2023, 7. [Google Scholar] [CrossRef]
  40. Nigmatzyanov, A.; Ferrer, G.; Tsetserukou, D. CBILR: Camera Bi-directional LiDAR-Radar Fusion for Robust Perception in Autonomous Driving. In Proceedings of the International Conference on Computational Optimization, Innopolis, Russia, 14 June 2024. [Google Scholar]
  41. Singh, K.K.; Kumar, S.; Dixit, P.; Bajpai, M.K. Kalman filter based short term prediction model for COVID-19 spread. Appl. Intell. 2020, 51, 2714–2726. [Google Scholar] [CrossRef] [PubMed]
  42. Iwami, K.; Ikehata, S.; Aizawa, K. Scale drift correction of camera geo-localization using geo-tagged images. In Proceedings of the European Conference on Computer Vision (ECCV) Workshops, Munich, Germany, 8–14 September 2018. [Google Scholar]
  43. Zhang, Z. Flexible camera calibration by viewing a plane from unknown orientations. In Proceedings of the Seventh IEEE International Conference on Computer Vision, Kerkyra, Greece, 20–27 September 1999; IEEE: New York, NY, USA, 1999; Volume 1, pp. 666–673. [Google Scholar]
  44. Li, J.; Xu, X.; Jiang, Z.; Jiang, B. Adaptive Kalman Filter for Real-Time Visual Object Tracking Based on Autocovariance Least Square Estimation. Appl. Sci. 2024, 14, 1045. [Google Scholar] [CrossRef]
  45. Guo, Y.; Liu, R.W.; Qu, J.; Lu, Y.; Zhu, F.; Lv, Y. Asynchronous trajectory matching-based multimodal maritime data fusion for vessel traffic surveillance in inland waterways. IEEE Trans. Intell. Transp. Syst. 2023, 24, 12779–12792. [Google Scholar] [CrossRef]
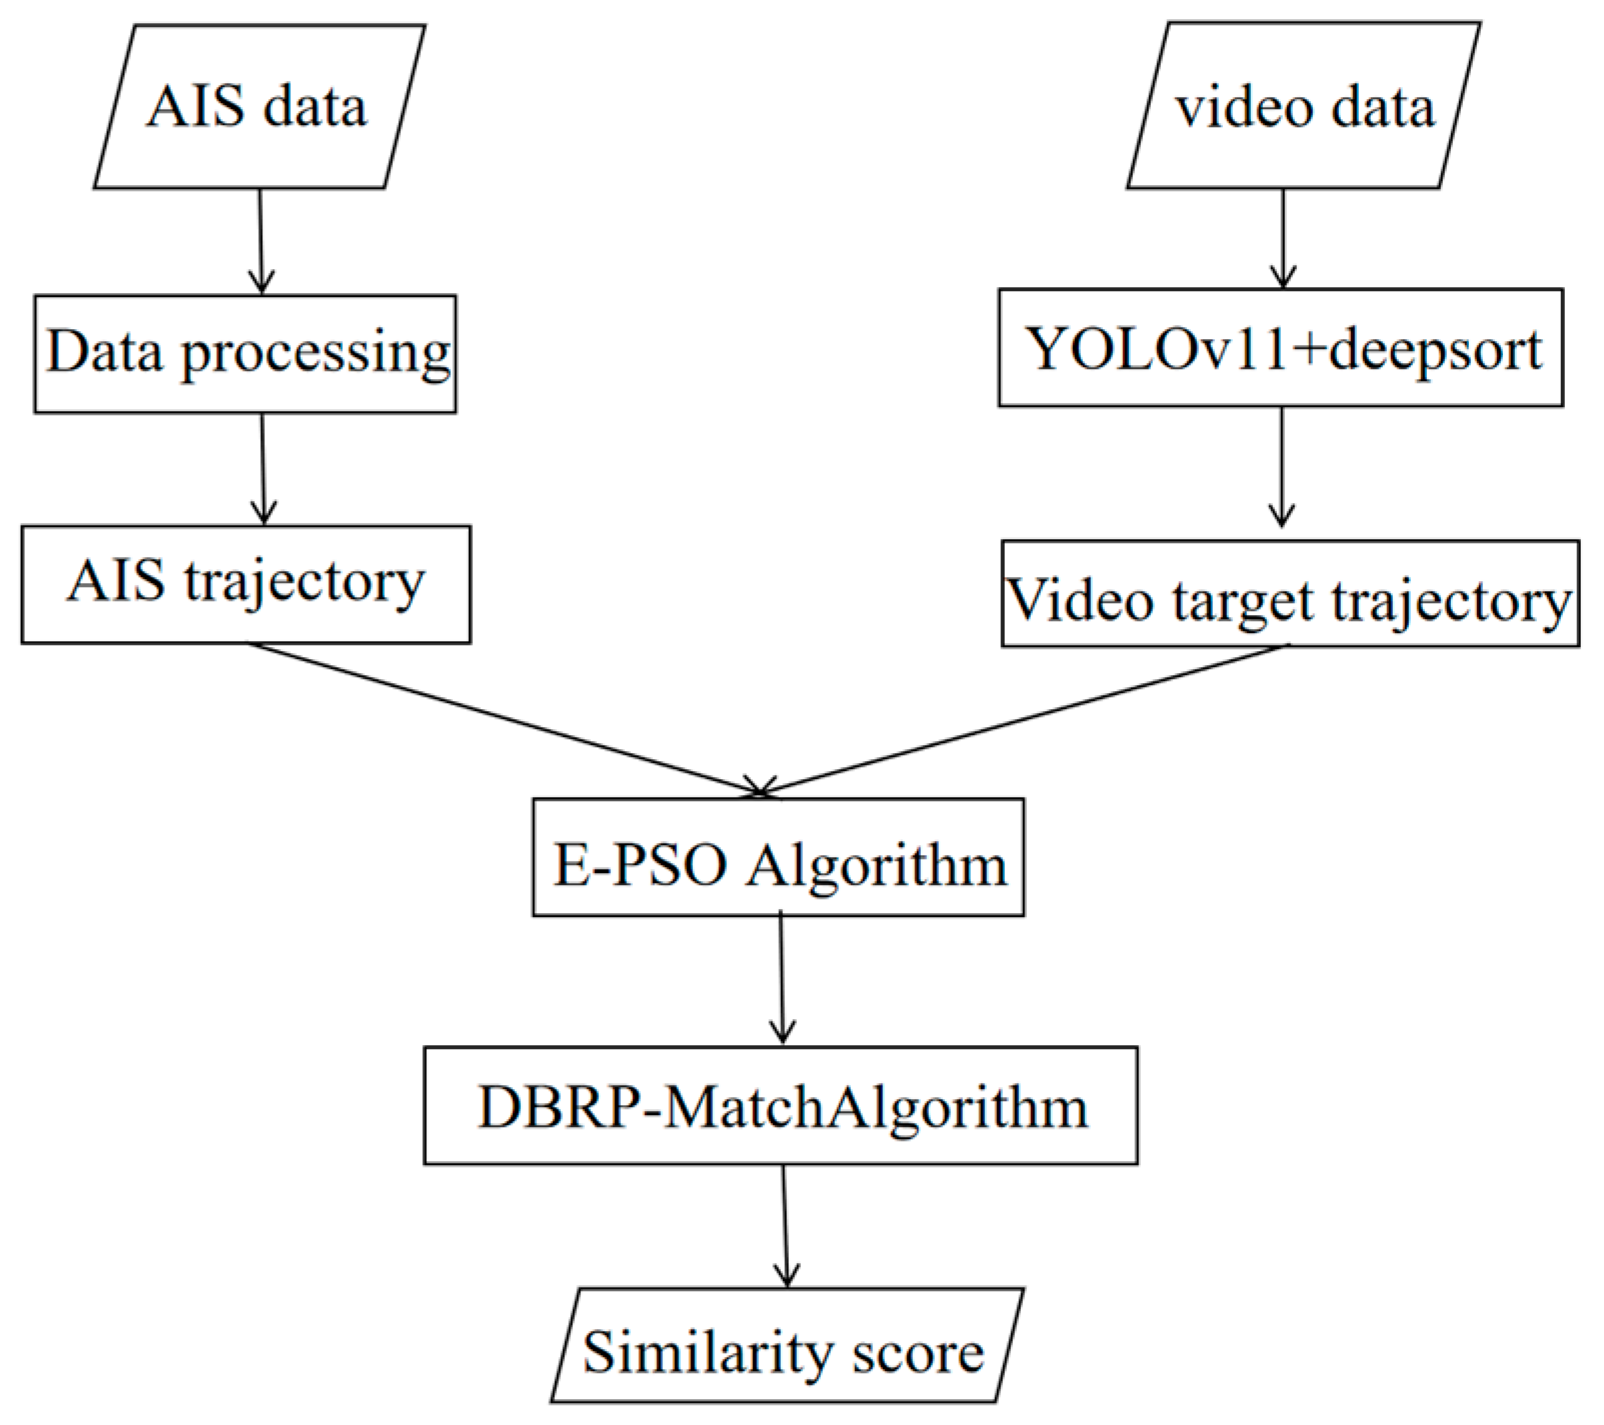
Figure 1. SSGDA trajectory-matching framework.
Electronics 14 03223 g001
Figure 2. AIS data processing.
Electronics 14 03223 g002
Figure 3. AIS trajectory prediction process.
Electronics 14 03223 g003
Figure 4. DeepSORT tracking process flowchart.
Electronics 14 03223 g004
Figure 5. The location along the Yangtze River.
Electronics 14 03223 g005
Figure 6. The location of a bridge.
Electronics 14 03223 g006
Figure 7. Comparison of matching precisions between SSGDA method and other algorithms on FVessel dataset.
Electronics 14 03223 g007
Figure 8. Comparison of recall rates between SSGDA method and other algorithms on FVessel dataset.
Electronics 14 03223 g008
Figure 9. Comparison of the matching precisions between the SSGDA method and the DBRP-Match algorithm on the FVessel dataset.
Electronics 14 03223 g009
Figure 10. Comparison of the MSE and R 2 values between the baseline (without E-PSO) and the proposed method on the FVessel dataset.
Electronics 14 03223 g010
Figure 11. Spatial transformation alignment effect of E-PSO.
Electronics 14 03223 g011
Figure 12. Trajectory-matching performance in real-world scenarios using the SSGDA framework.
Electronics 14 03223 g012
Table 1. Comparison of multi-source fusion frameworks.
Framework NameData Source TypesFusion ApproachApplication Domains
MVFusion [38]Video + RadarCross-attention and feature fusionAutonomous driving
CenterFusion [39]Video + RadarCross-modal, cross-multiple attention, and joint cross-multiple attentionAutonomous driving
CBILR [40]LiDAR, Radar, and VideoBidirectional pre-fusion + BEV space fusionAutonomous driving
Disclaimer/Publisher’s Note: The statements, opinions and data contained in all publications are solely those of the individual author(s) and contributor(s) and not of MDPI and/or the editor(s). MDPI and/or the editor(s) disclaim responsibility for any injury to people or property resulting from any ideas, methods, instructions or products referred to in the content.