Article

Gecko-Inspired Robots for Underground Cable Inspection: Improved YOLOv8 for Automated Defect Detection

by
Dehai Guan
1,2 and
Barmak Honarvar Shakibaei Asli
2,*
1
College of Mechanical and Electrical Engineering, Nanjing University of Aeronautics and Astronautics, Nanjing 210016, China
2
Centre for Life-Cycle Engineering and Management, Faculty of Engineering and Applied Sciences, Cranfield University, Cranfield, Bedfordshire MK43 0AL, UK
*
Author to whom correspondence should be addressed.
Electronics 2025, 14(15), 3142; https://doi.org/10.3390/electronics14153142
Submission received: 12 July 2025 / Revised: 29 July 2025 / Accepted: 4 August 2025 / Published: 6 August 2025
(This article belongs to the Special Issue Robotics: From Technologies to Applications)

Abstract

To enable intelligent inspection of underground cable systems, this study presents a gecko-inspired quadruped robot that integrates multi-degree-of-freedom motion with a deep learning-based visual detection system. Inspired by the gecko’s flexible spine and leg structure, the robot exhibits strong adaptability to confined and uneven tunnel environments. The motion system is modeled using the standard Denavit–Hartenberg (D–H) method, with both forward and inverse kinematics derived analytically. A zero-impact foot trajectory is employed to achieve stable gait planning. For defect detection, the robot incorporates a binocular vision module and an enhanced YOLOv8 framework. The key improvements include a lightweight feature fusion structure (SlimNeck), a multidimensional coordinate attention (MCA) mechanism, and a refined MPDIoU loss function, which collectively improve the detection accuracy of subtle defects such as insulation aging, micro-cracks, and surface contamination. A variety of data augmentation techniques—such as brightness adjustment, Gaussian noise, and occlusion simulation—are applied to enhance robustness under complex lighting and environmental conditions. The experimental results validate the effectiveness of the proposed system in both kinematic control and vision-based defect recognition. This work demonstrates the potential of integrating bio-inspired mechanical design with intelligent visual perception to support practical, efficient cable inspection in confined underground environments.

1. Introduction

With the increasing demand for inspection, maintenance, and cleaning of facilities in industrial, military, and civilian fields, it has become necessary to automate certain processes to reduce costs and ensure personnel safety. For example, in the industrial sector [1], intelligent inspection robots are used for the inspection and maintenance of equipment. These robots can easily access narrow spaces that are difficult for humans to reach, such as factory pipelines and the interiors of equipment, to conduct crack detection, corrosion monitoring, and routine maintenance. This improves the reliability and safety of the equipment while reducing downtime and maintenance costs. In the military sector [2], intelligent inspection robots can be used for the inspection and maintenance of military equipment. They can inspect rivets, loosened components, and engine blades inside complex equipment such as aircraft and ships, ensuring proper operation. In the civilian sector [3], inspection robots can be used for the inspection of corridors, pipelines, and cable trenches in power grids to identify corrosion, cracks, and other potential safety hazards.
Despite recent advancements in intelligent inspection technologies, the existing underground cable inspection robots still face considerable challenges [4] in practical applications. Most current systems adopt wheeled or tracked rigid-body structures, resulting in poor flexibility and limited adaptability in narrow, irregular, and obstacle-rich environments such as pipelines and cable trenches. These mechanical constraints severely restrict their operational capability.
From the perception perspective, many vision-based defect detection methods rely on general-purpose deep learning models, which struggle to identify small irregularly shaped defects (e.g., insulation aging and micro-cracks) in real underground scenarios, particularly under conditions with poor lighting, occlusion, or complex backgrounds. Although YOLO-series detectors exhibit strong performance in terms of detection speed, they still suffer from limitations in recognizing fine-grained defects, handling occlusions, and achieving lightweight deployment, making them less suitable for embedded mobile platforms.
Therefore, developing an inspection system capable of flexible locomotion in confined underground environments while ensuring high-precision visual detection remains a critical challenge. Although prior studies have addressed either mechanical adaptability or visual algorithms individually, practical deployment demands a tightly integrated solution that enhances mechanical compliance, visual robustness, and system-level deployability.
To address these challenges, the main contributions of this paper are as follows:
  • Gecko-Inspired Quadruped Robot Design:
    A novel quadruped robot is developed, inspired by the gecko’s flexible spine and multi-joint limb structure. By combining biologically inspired mechanics with Denavit–Hartenberg-based kinematic modeling and zero-impact gait trajectory planning, the robot achieves stable adaptive locomotion in constrained and irregular underground cable environments.
  • Improved Lightweight Vision Framework Based on YOLOv8:
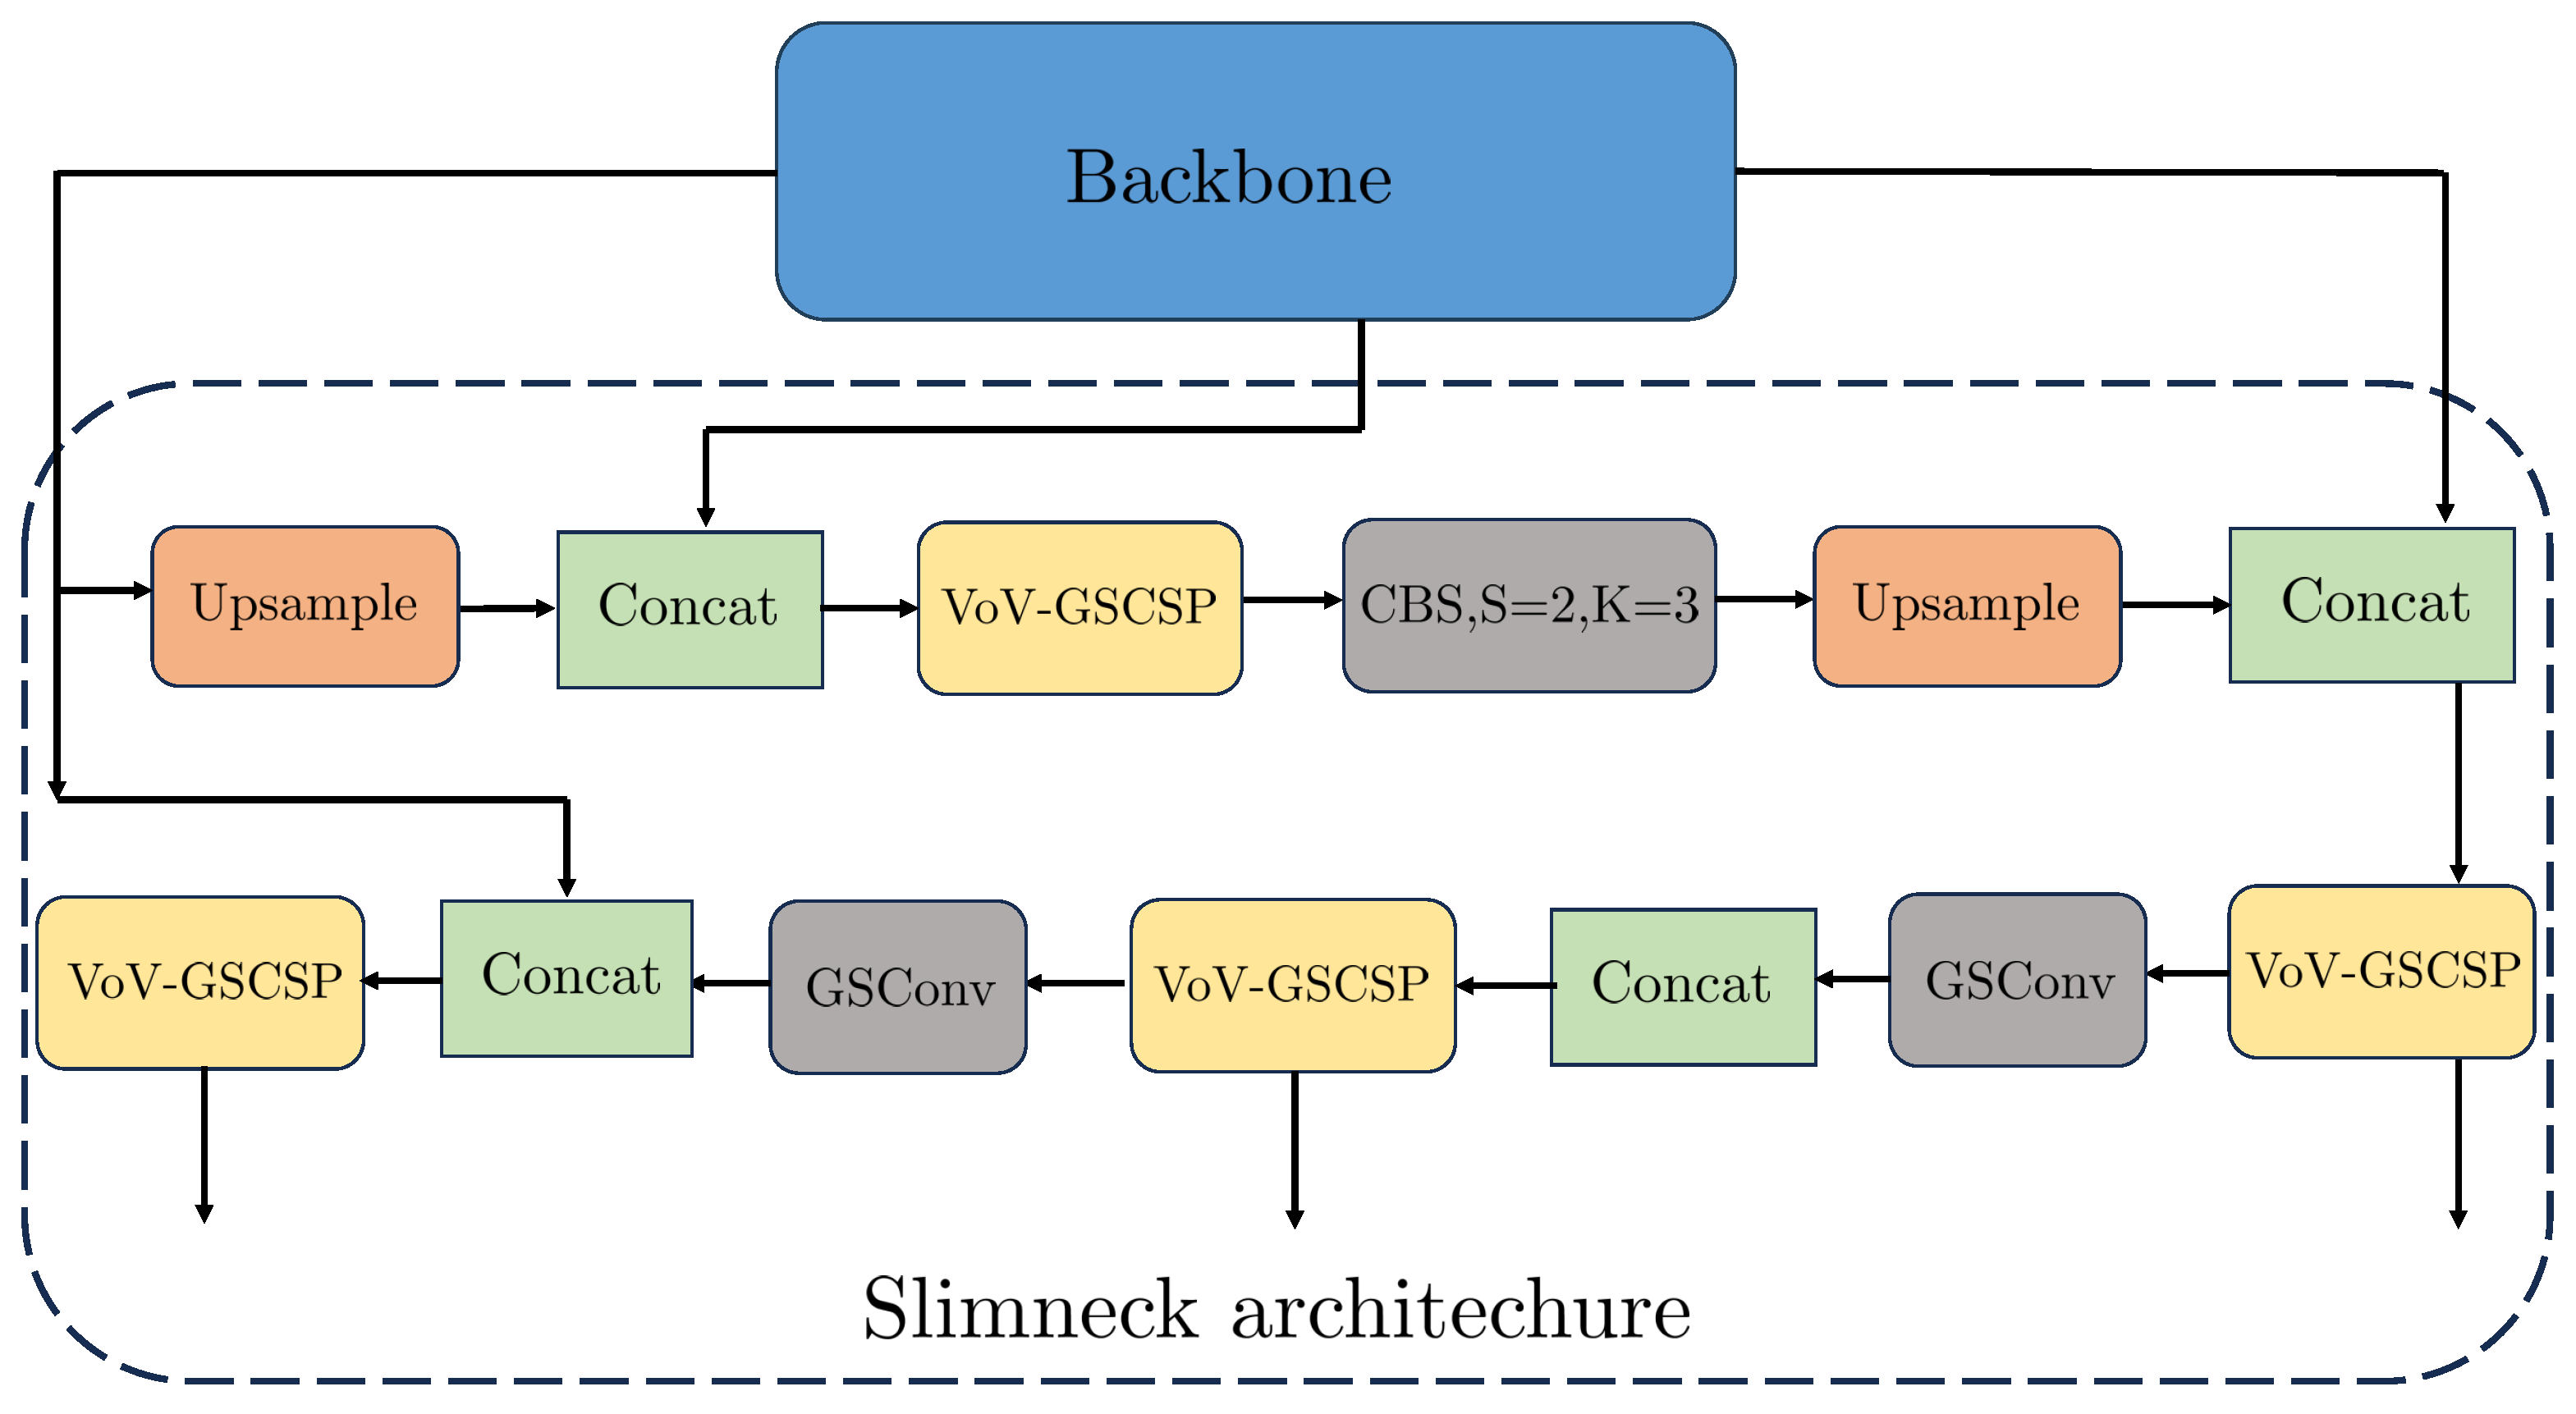
    To improve the performance of defect detection in complex underground environments, we propose an enhanced YOLOv8-based object detection model. This framework includes three novel modules: (1) SlimNeck, a lightweight neck architecture designed to efficiently aggregate multi-scale features using GSConv and VoV-GSCSP structures; (2) MCA, which introduces coordinate attention along the channel, width, and height dimensions to strengthen feature discrimination; and (3) MPDIoU loss, which introduces a geometric penalty based on the shortest point-to-point distance between predicted and ground-truth boxes, thus improving localization accuracy.
  In summary, this paper addresses key challenges in robotic mobility, fine-grained defect detection, and model deployability for underground cable inspection. By integrating a gecko-inspired mechanical system with a modular and efficient vision detection framework, the proposed solution offers a comprehensive and practical approach for intelligent inspection in constrained environments.
This paper is organized as follows. Section 2 reviews the current state of underground cable inspection robots and gecko-inspired climbing systems, highlighting the existing limitations. Section 3 presents the proposed solution, detailing the mechanical design of the gecko-inspired quadruped robot, its kinematic modeling, and the development of an enhanced YOLOv8-based visual detection framework. Section 4 describes the experimental setup and validation process, including kinematic simulation and cable defect detection performance comparisons. Finally, Section 5 concludes the paper and discusses future research directions.

2. Related Works

2.1. Currently Underground Cable Inspection Robots

Claudio et al. from the Federal University of Rio Grande in Mexico [5] developed a pipeline inspection robot named TATUBOT. The robot’s active wheels are located at its front end and are driven by independent motors to maintain contact with the inner wall of the pipeline. To adapt to different pipe diameters, the robot uses angle-adjustable driving wheels to rotate and reposition itself inside the pipeline. The Shanxi Branch of the State Grid Corporation of China [6] developed a small wheeled underground cable inspection robot. Its drive system is composed of drive wheels and guide wheels. The drive wheels contact the pipe wall and increase friction through a rough surface, while the guide wheels contact the cable to help the robot move smoothly along it. The Power Robotics Key Laboratory of Hunan [7] developed a tracked underground cable inspection robot. The robot uses a dual-motor tracked drive, with independent brushless DC motors on both sides, enabling flexible movement in narrow cable trenches. It can also climb slopes and cross obstacles of certain heights.
However, wheeled and tracked rigid-body robots have certain limitations when operating in pipeline environments. They perform poorly on complex pipe surfaces—such as those with dirt or obstacles—and the main bodies of rigid robots, lacking degrees of freedom, suffer from limited flexibility, which restricts movement during certain actions.

2.2. Gecko-Inspired Climbing Robots

Geckos are reptiles native to tropical and temperate regions, known for their flexible climbing abilities (Figure 1). Their spinal structures [8] consist of multiple vertebrae connected via complex joints, enabling bending and twisting for rapid motion and posture adjustment. Their muscular and flexible legs [9], ankles, and toes allow rapid running and surface climbing [10]. Independent toe movement enhances contact precision and grip stability during climbing [11].
To improve the mobility, compliance, and flexibility of quadruped crawling robots [13] in narrow and complex pipeline environments, particularly during high-speed motion, researchers have taken biological geckos as inspiration. They have conducted detailed studies on the gecko’s flexible spine, limb structure, and agile ankles. Based on these features, attempts have been made to develop gecko-shaped quadruped crawling robots, resulting in a series of achievements.
Since the 20th century, scholars both domestically and internationally have carried out extensive research on gecko-inspired robots [14,15], aiming to enhance the stability of robot movement. These robots are mainly classified by their actuation methods, including servo motors, shape memory alloys (SMAs), and cable-driven systems [16,17,18].
Imperial College London developed a quadrupedal standing-style gecko-inspired robot [19]. The robot’s spine and legs are driven by servo motors. The spine has two degrees of freedom, allowing the front and rear sections of the spine to oscillate. The legs also have two degrees of freedom. The first DOF is oriented perpendicular to the climbing surface, enabling the leg to swing forward during the stepping phase and maintain a consistent position and orientation during the stance phase. The second DOF rotates around an axis parallel to the wall and drives a four-bar linkage to ensure that the sole remains parallel to the ground while lifting or landing. The Ji Aihong research group at the Nanjing University of Aeronautics and Astronautics designed a gecko-inspired robot [20] with an SMA-driven flexible spine. By adjusting the temperature, the spine can perform bending movements and absorb impacts, enabling the robot to adopt multiple crawling postures. This driving method offers high efficiency, stability, and control accuracy and has broad application prospects. David et al. from the National Polytechnic Institute of Mexico [21] developed a cable-driven multi-joint gecko-inspired robot. The robot’s spine vertebrae are connected using flexible steel cables. One end of the cable is attached to the shaft of a DC motor, which maintains cable tension via motor control, thereby helping the robot to remain stable across its four limbs. The robot uses plastic and flexible steel cables as its primary structural materials, making the spine lightweight and easy to manufacture. The cables provide sufficient tension to maintain spinal posture during locomotion, offering solid support.

2.3. Three-Dimensional Image Acquisition and Analysis for Underground Cables

In recent years, with the growing demand for automated underground cable inspection, researchers have increasingly integrated visual sensors and intelligent image processing algorithms into the field of cable detection. This has led to the development of cable inspection robot systems capable of automatic identification and analysis. By leveraging computer vision techniques to recognize and enhance surface defects on cables, these algorithms have effectively replaced manual inspection methods and significantly improved both the efficiency and accuracy of the detection process. Gao et al. [22] developed a 3D vision-based robot for crack detection on large structures using MobileNetV2-DeepLabV3 and multi-sensor fusion. The system achieves sub-millimeter accuracy and supports spatial mapping through LiDAR and stereo cameras, enabling reliable deployment in construction environments. Meanwhile, Zhang et al. [23] proposed a non-scanning 3D imaging system using compressed sensing and dual-frequency continuous-wave LiDAR. By applying all-phase Fourier transform and integrating low-cost detectors, the method enables efficient depth acquisition with fewer measurements and enhanced safety, suitable for compact scene reconstruction.
In vision-based inspection systems, object detection algorithms are generally categorized into two types: one-stage and two-stage detectors [24]. While most conventional methods focus on 2D image-based detection, recent studies have begun exploring 3D vision technologies for more accurate and spatially aware defect analysis.
One-stage detectors perform object localization and classification simultaneously in a single forward pass, making them highly efficient and suitable for real-time applications. The representative algorithms in this category include the YOLO (You Only Look Once) series—such as YOLOv8 and YOLOv11—which are widely used for their balance between speed and accuracy. Liu et al. [25] proposed UCIW-YOLO, an improved YOLOv5-based model for farmland obstacle detection. By integrating lightweight UIB modules, coordinating attention, and a novel Inner-WIoU loss, the model enhances detection accuracy and efficiency. It achieved 0.845 mAP@0.5:0.95 and runs at 10.09 FPS, making it well-suited for real-time deployment in unstructured agricultural environments. Wang et al. [26] proposed Bi2F-YOLO, an improved YOLOv7 framework for underwater object detection. By integrating BiFormer attention, FasterNet backbone, and EfficientCIoU loss, the model enhances detection under blur and occlusion. It achieved 87.3% mAP@50 on RUOD with 14.3% fewer parameters and 5.5% less computation. Bhagwat et al. [27] proposed a real-time defect detection method for 11 kV power distribution insulators by combining a modified YOLOv11 with MobileNetV3. The model enhances feature extraction efficiency while remaining lightweight, making it suitable for drone-based inspections. The experimental results on a custom UAV-captured dataset demonstrated superior accuracy and speed compared to existing models, enabling practical deployment in power grid monitoring systems. Wang et al. [28] proposed a geometry-aware one-stage detector based on FCAF3D for precise cutting-point detection using multi-view fusion and SE attention, achieving high accuracy under occlusion. This demonstrates the potential of extending vision-based detection beyond 2D methods toward spatially informed 3D perception.
Two-stage detectors [29] perform object detection through a two-step process: first generating region proposals and then classifying and refining these candidate regions. This staged approach allows for more precise localization and classification, making it well-suited for applications that demand high accuracy. A representative algorithm in this category is the R-CNN (Region-based Convolutional Neural Network) series, which includes Fast R-CNN, Faster R-CNN, and Mask R-CNN. Magdy et al. [30] proposed a lightweight compression method for Faster R-CNN that combines mixed-precision training, pruning, and dynamic quantization. This approach reduced the model parameters by 56.6% and model size by 25.6% while maintaining detection accuracy. It demonstrates excellent performance in remote sensing image tasks and is suitable for deployment in resource-constrained environments. Gelu-Simeon et al. [31] proposed a deep learning model for real-time delineation of colorectal polyps during colonoscopy procedures. The method aims to enhance lesion detection accuracy and assist clinicians in making timely decisions. The experimental results demonstrate that the model achieves high precision and is well-suited for practical deployment in clinical environments.
Compared with other object detection algorithms, YOLOv8 demonstrates outstanding accuracy and strong generalization ability. These strengths make it particularly effective in addressing complex defect detection challenges, such as those found in underground cable systems. Numerous researchers have improved YOLOv8’s performance in various applications by restructuring its architecture and optimizing specific modules [32,33].

3. Methodology

To enable efficient and accurate inspection of underground cables, this study presents the development of a gecko-inspired quadruped bionic robot. As illustrated in Figure 1, the morphology of the gecko provides the biological basis for the robot’s flexible spine and limb layout. This inspiration is further translated into a physical prototype, as shown in Figure 2. The robot features a flexible spine and multi-degree-of-freedom limb design, enabling it to navigate complex environments such as tunnels and sloped surfaces with enhanced stability and mobility. The methodology begins with the kinematic modeling and analysis of the robot to ensure its adaptability across varying terrains.
A high-definition camera is mounted on its head for detection purposes. Building on this, a vision-based inspection framework is implemented to detect insulation wear, surface cracks, and potential safety hazards in cable systems. Advanced image processing techniques—including data augmentation, brightness normalization, and occlusion simulation—are applied to improve defect visibility under challenging conditions such as low light or noise interference. Additionally, optimized visual algorithms based on a modular object detection framework enhance recognition accuracy, particularly for fine-grained defects like micro-cracks or aged insulation.

3.1. Kinematic Modeling of a Quadruped Robot

D–H (Denavit–Hartenberg) modeling [34] is a method used to describe the relative positions and orientations of links in a mechanical system. This method is commonly used in the field of robotics, especially for describing the geometric relationships between robot joints and links (as shown in Figure 3). In the figure, the red circles represent the robot’s rotational joints parallel to the ground, the red rectangles represent the rotational joints perpendicular to the ground, and the blue circles indicate the foot support center points of the robot. The fundamental idea of this modeling is to divide the mechanical system into a series of joints and links and define a set of parameters to describe the rotational and translational relationships between each pair of adjacent joints and links.
To establish the coordinate systems for Denavit–Hartenberg (D–H) modeling, the following conventions are adopted. The Z-axis is defined as the direction of the axis of joint i + 1 . Although its orientation can be arbitrary, for simplicity, all Z-axes are typically considered parallel, and the direction parallel to the robot’s spine is chosen as the base coordinate direction for consistency. The X-axis is oriented along the common normal between adjacent Z-axes, pointing from one Z-axis to the next. The direction of the base coordinate system is arbitrary but is generally chosen to align with the global coordinate frame. The Y-axis is determined using the right-hand rule, where the thumb points in the Y direction when the fingers curl from the Z-axis to the X-axis. The origin of each coordinate frame is located at the intersection of its corresponding Z-axis and X-axis.
According to the standard Denavit–Hartenberg (SDH) convention, four parameters are used to define the relative transformation between adjacent links: (1) the joint angle θ , which is the rotation about the Z-axis to align the previous X-axis with the current one; (2) the joint distance d, which is the translation along the Z-axis to align the two X-axes; (3) the link length a, defined as the translation along the X-axis between the origins of adjacent coordinate frames; and (4) the link twist α , representing the rotation about the X-axis to align the Z-axes.
As shown in Figure 4, the standard D–H parameter model is constructed based on the robot’s leg and the rear segment of the spine. The coordinate frames are assigned according to the D–H convention, where the Z-axes are aligned along the joint axes, and the X-axes are defined by the common normals between adjacent Z-axes. This figure clearly illustrates the position of each joint and its associated coordinate frame, which provides the geometric basis for assigning the D–H parameters. The color and shape representations of the symbols in Figure 4 follow the same convention as those in Figure 3.
The corresponding D–H parameters used for the kinematic model are listed in Table 1. The table specifies the joint angle θ i , joint offset d i , link length a i , and link twist α i for each link in the leg structure.
We adopt the standard Denavit–Hartenberg (SDH) method to construct the forward kinematics model for a single leg of the quadruped robot. As shown in Equation (3)  [10], the transformation between adjacent joints is represented by a homogeneous transformation matrix composed of rotational and translational components:
T i 1 i           = R ( Z i 1 , θ i ) T ( Z i 1 , d i ) T ( X i 1 , a i ) R ( X i 1 , α i ) .
where R ( Z i 1 , θ i ) , T ( Z i 1 , d i ) , T ( X i 1 , a i ) , and R ( X i 1 , α i ) represent rotation about the Z-axis by angle θ i , translation along the Z-axis by distance d i , translation along the X-axis by distance a i , and rotation about the X-axis by angle α i , respectively.
In kinematic modeling, the fundamental pose transformation operations of a rigid body in three-dimensional space typically involve translations along and rotations about the coordinate axes. These transformations can be systematically represented using homogeneous transformation matrices, which serve as the fundamental building blocks for describing the pose of each link relative to the base frame. The commonly used homogeneous transformation matrices for translation and rotation are defined as follows [35]:
T ( a , b , c ) = 1 0 0 a 0 1 0 b 0 0 1 c 0 0 0 1 ,
R ( x , β ) = 1 0 0 0 0 cos β sin β 0 0 sin β cos β 0 0 0 0 1 ,
R ( z , β ) = cos β sin β 0 0 sin β cos β 0 0 0 0 1 0 0 0 0 1 .
In the above matrices, T ( a , b , c ) represents a translation along the x-, y-, and z-axes by distances a, b, and c, respectively. The rotation matrix R ( x , β ) denotes a rotation of angle β about the x-axis and is typically used to represent the link twist angle α in the Denavit–Hartenberg (D–H) model. Similarly, the matrix R ( z , β ) describes a rotation about the z-axis and is commonly employed to represent the joint angle θ , particularly for revolute joints.
With these transformation matrices defined, we can now apply the standard SDH formulation introduced in Equation (1). As an example, the transformation from the base frame to joint 1 can be derived as follows:
T 1 0 = R ( Z 0 , θ 1 ) T ( Z 0 , d 1 ) T ( X 0 , a 1 ) R ( Z 0 , α 1 ) = cos θ 1 0 sin θ 1 L 1 cos θ 1 sin θ 1 0 cos θ 1 L 1 sin θ 1 0 1 0 0 0 0 0 1 .
The remaining transformation matrices (from 1T2 to 4T5) can be constructed following the same rules, as already listed earlier, and thus omitted here for brevity.
By sequentially multiplying these local transformation matrices, we obtain the overall transformation matrix from the base coordinate system to the foot coordinate system:
T 5 0 = T 1 0 · T 3 1 · T 3 2 · T 4 3 · T 5 4 .
The final homogeneous transformation matrix from the base coordinate system to the foot coordinate system can be obtained as follows:
T 5 0 = cos ( P 1 + P 4 + P 5 ) sin ( P 1 + P 4 + P 5 ) 0 L 2 cos θ 12 2 + L 4 cos θ 4 + L 13 cos θ 1 + L 5 cos θ 145 + L 5 cos θ 1 2 2 sin ( P 1 + P 4 + P 5 ) cos ( P 1 + P 4 + P 5 ) 0 L 2 sin θ 12 2 + L 4 sin θ 4 + L 13 sin θ 1 + L 5 sin θ 145 + L 5 sin θ 1 2 2 0 0 1 L 2 sin θ 2 0 0 0 1 .
The position of the foot in the base frame can then be extracted by multiplying this transformation matrix with the homogeneous point vector [ 0 0 0 1 ] T :
P 0 = T 5 0 · 0 0 0 1 = P X P Y P Z 1 .
Note: The components P X , P Y , and P Z represent the 3D position of the foot in the base frame and are obtained from the last column of the full transformation matrix.
Expanding and simplifying the resulting position expressions yields
P X = L 2 cos θ 12 2 + L 4 cos θ 4 + L 13 cos θ 1 + L 5 cos θ 145 + L 2 cos θ 1 2 2 P Y = L 2 sin θ 12 2 + L 4 sin θ 4 + L 13 sin θ 1 + L 5 sin θ 145 + L 2 sin θ 1 2 2 P Z = L 2 sin θ 2 .
Note: For simplification, we define shorthand notations such as θ i j = θ i + θ j or θ i θ j , e.g., θ 12 = θ 1 + θ 2 , θ 145 = θ 1 + θ 4 + θ 5 , etc.
Given the desired end-effector position in Cartesian space ( P X , P Y , P Z ) , the joint angles θ 1 through θ 5 can be computed using inverse kinematics. In practical applications, θ 1 is often predefined based on the foot trajectory, while the remaining joint angles can be derived geometrically. The resulting inverse kinematics expressions are summarized as follows:
θ 2 = arcsin P Z L 2 θ 3 = θ 2 θ 5 = arccos ( P X a ) 2 + ( P Y b ) 2 L 4 2 L 5 2 2 L 4 L 5 θ 4 = arcsin P X a + P Y b c 1 2 + c 2 2 arctan c 1 c 2 θ 1 .
where the intermediate variables a, b, c 1 , and c 2 are defined as
a = L 2 2 cos ( θ 1 + θ 2 ) + L 13 cos θ 1 + L 2 2 cos ( θ 1 θ 2 ) b = L 2 2 sin ( θ 1 + θ 2 ) + L 13 sin θ 1 + L 2 2 sin ( θ 1 θ 2 ) c 1 = L 4 + L 5 ( cos θ 5 + sin θ 5 ) c 2 = L 4 + L 5 ( cos θ 5 sin θ 5 ) .
We have derived the inverse kinematic expressions for each joint of the robot’s single leg. To verify the correctness of the derived inverse solutions, we can design a foot-end trajectory curve and substitute this curve into the kinematic equations to obtain joint position curves. Then, by using forward kinematics, we can calculate the resulting foot-end trajectory and compare it with the original.
Zero-impact foot trajectory curve [36] ensures smooth and continuous velocity and acceleration at the joints, enabling quick and stable leg swing with no foot sliding or dragging. The trajectory is defined as
P = [ P x , P y , P z ] .
where P x , P y , P z represent the X, Y, and Z position changes of the foot end in the base coordinate system, and the expressions are
P x = L 1 + L 2 + L 3 + L 4 , 0 t T .
P y = P y 0 + S t T m 1 2 π sin 2 π t T m , 0 t T m , P y 0 + S T t T m 1 2 π sin 2 π ( T t ) T m , T m t T .
P z = H t T m · k 1 2 π sin 2 π t T m · k , 0 t 0.5 T m , H T m t T m · k 1 2 π sin 2 π t T m · k , 0.5 T m t T m , H t T m · k 0 , T m t T .
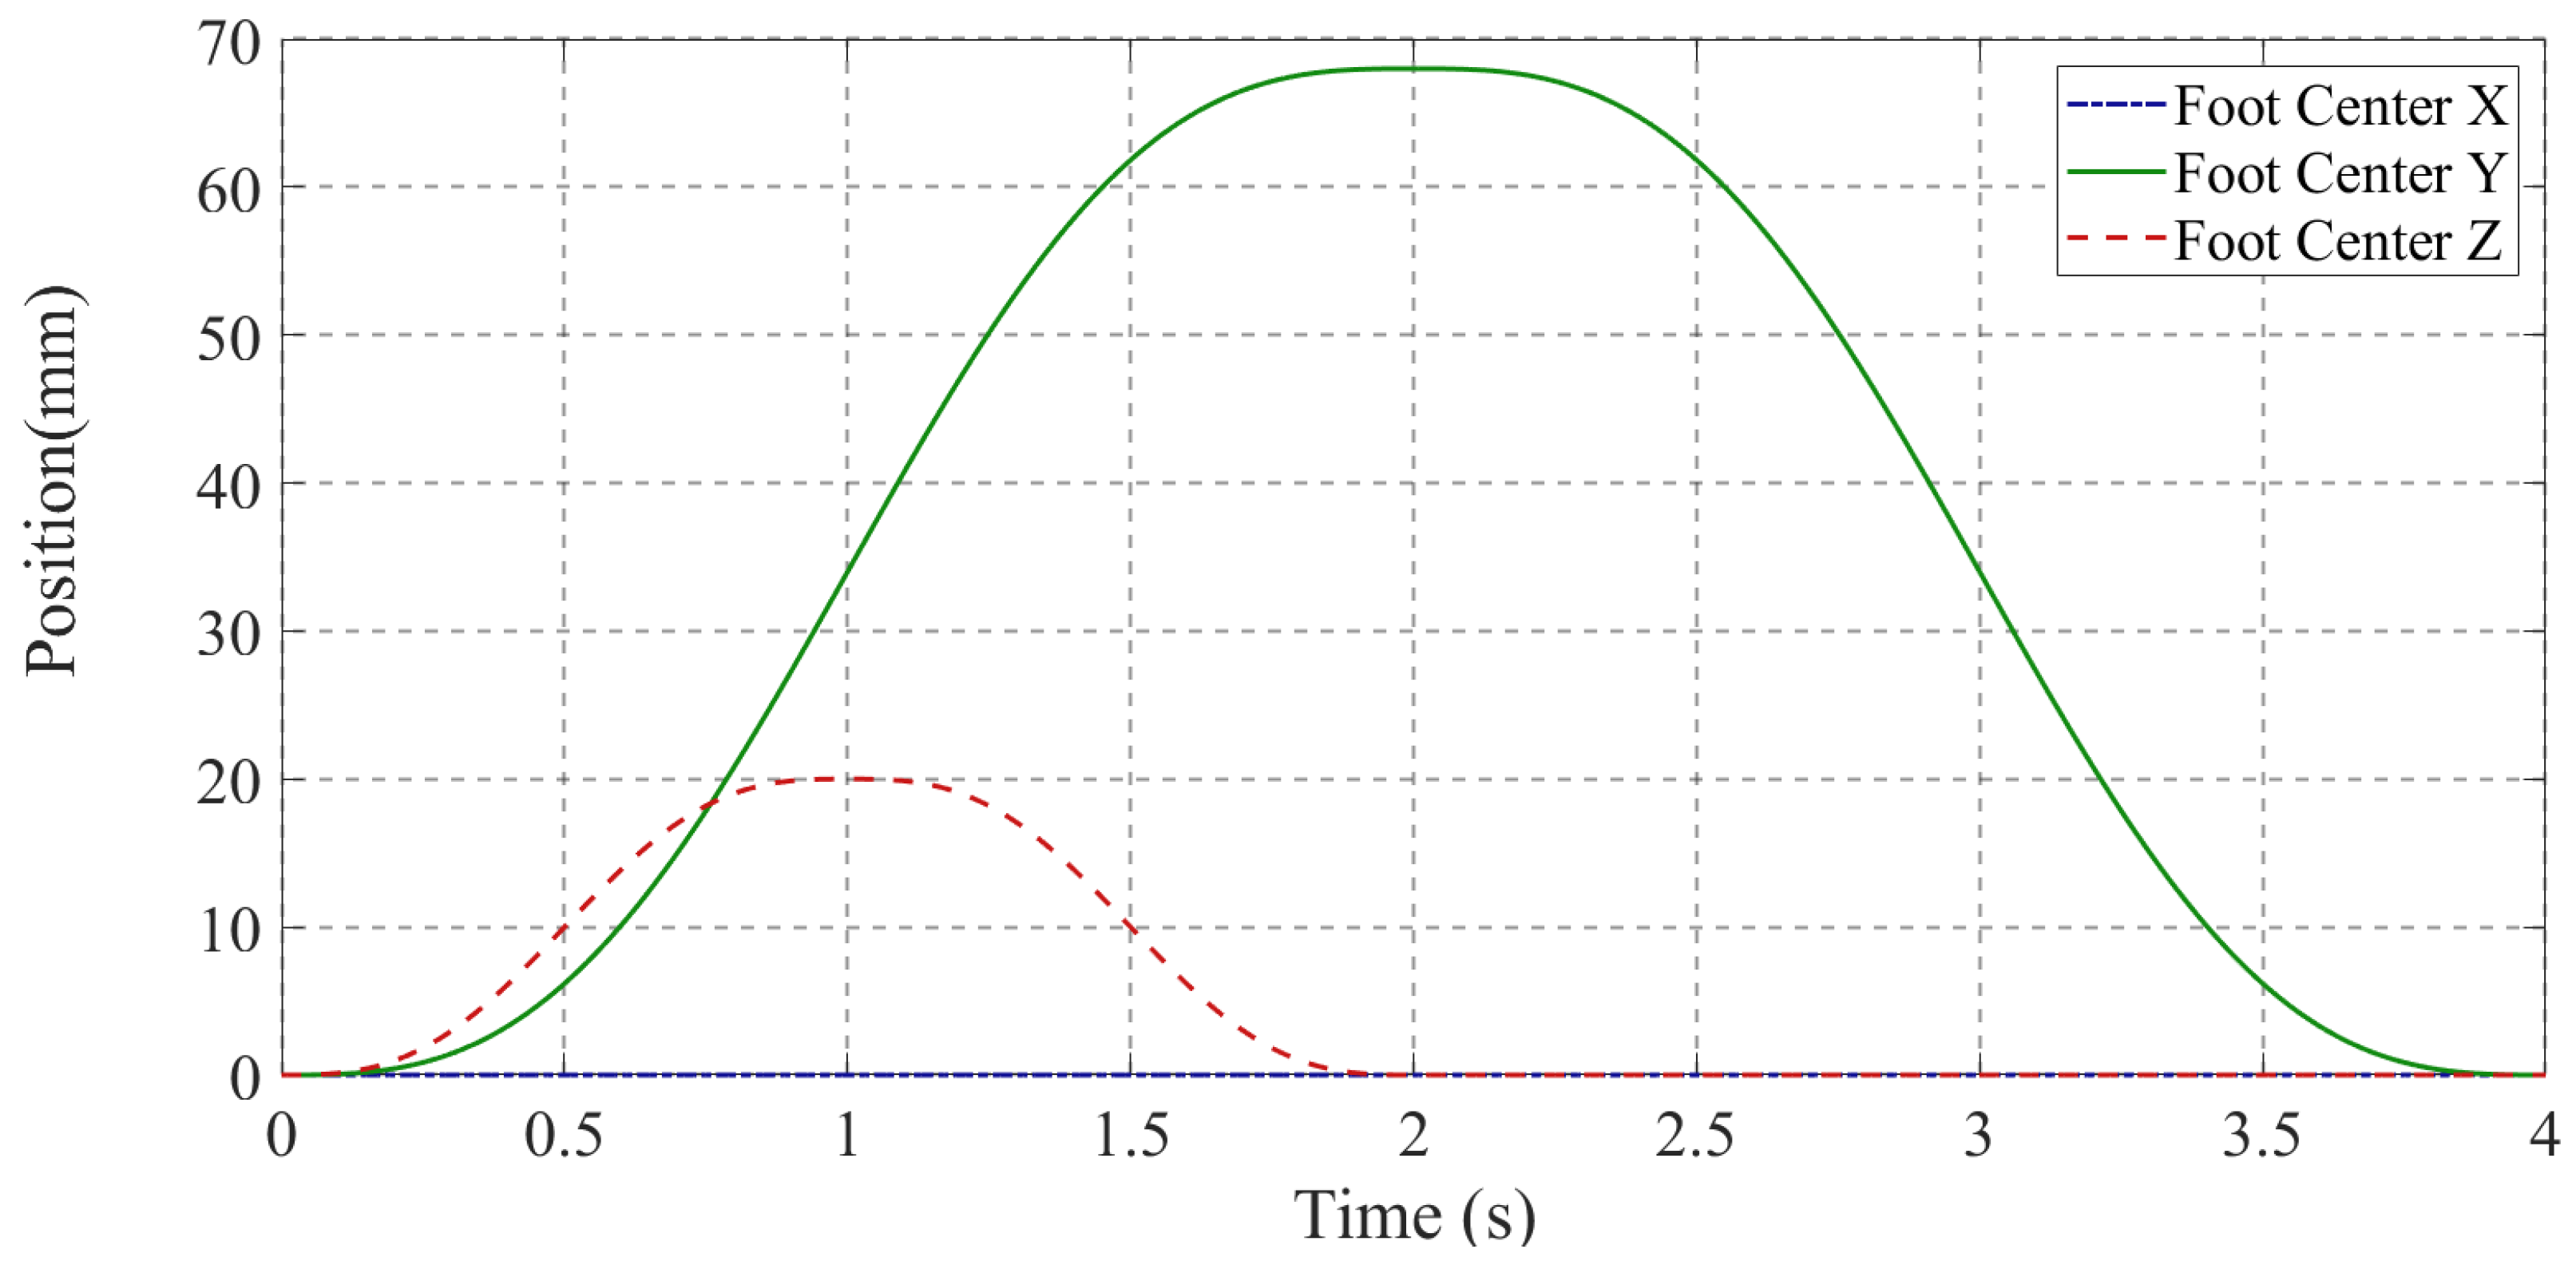
where S is the stride, H is the leg lift height, T m is the swing phase period, T = 2 T m , vertical motion time parameter k = 0.5 , and P y 0 is the initial Y-direction position of the foot end. In the simulation, the stride S is set to 68 mm , the leg lift height H is 20 mm , and the total cycle period T is 4 s .
This zero-impact trajectory reduces impact at foot-ground contact and improves motion stability and efficiency, making it ideal for pipeline crawling robots. Therefore, trajectory P is adopted for inverse kinematics verification. The leg lift height affects foot impact force and should not exceed the leg L 2 length. The stride is limited by swing joint length L 3 and should be close to this length.
After planning the trajectory curve of the robot’s foot end, a kinematic simulation experiment can be conducted to verify the correctness of the derived inverse kinematic solutions.

3.2. Image Dataset Preparation and Modular Detection Enhancements

To ensure accurate detection of cable surface defects such as insulation damage, cracks, or wear, the robot integrates a vision-based inspection module. This module is responsible for acquiring high-quality images in underground cable environments, which often suffer from poor lighting and complex visual backgrounds. Therefore, the image acquisition process is coupled with a series of enhancement techniques aimed at improving image clarity and defect visibility.

3.2.1. Image Collection

To validate the effectiveness of the robot’s visual recognition module in real-world scenarios, a publicly available cable defect image dataset [37] was employed in this study (as shown in Figure 5). After undergoing image enhancement processing, the dataset comprises over 1500 annotated images, covering a wide range of common cable surface damage types, such as insulation aging, cracks, scratches, and contamination. The images were collected under diverse underground conditions, including varying lighting levels, background clutter, and overlapping cables, to ensure high variability and realism. The dataset is divided into training and validation sets with a ratio of 4:1, ensuring effective model learning and performance evaluation. In addition, a separate test set consisting of 113 unlabeled images is used to assess the model’s generalization in unseen conditions. By encompassing diverse scenarios, the dataset ensures high representativeness and robustness for training and evaluation.
In addition, each image is accompanied by a corresponding label file in YOLO format, which provides detailed annotations of defect categories and bounding box coordinates. These label files enable the object detection model to learn the spatial location and class of each defect during training, serving as essential ground-truth references for supervised learning.

3.2.2. Data Augmentation

In real-world underground cable inspection environments, image acquisition is often affected by noise interference, uneven lighting, occlusions, and perspective distortions [38], which reduce the clarity and distinguishability of defect areas. To enhance the robustness and generalization ability of detection models under complex conditions, this study implements a series of image augmentation strategies. These methods not only enrich sample diversity but also improve the detection of fine features such as micro-cracks and aged insulation layers.
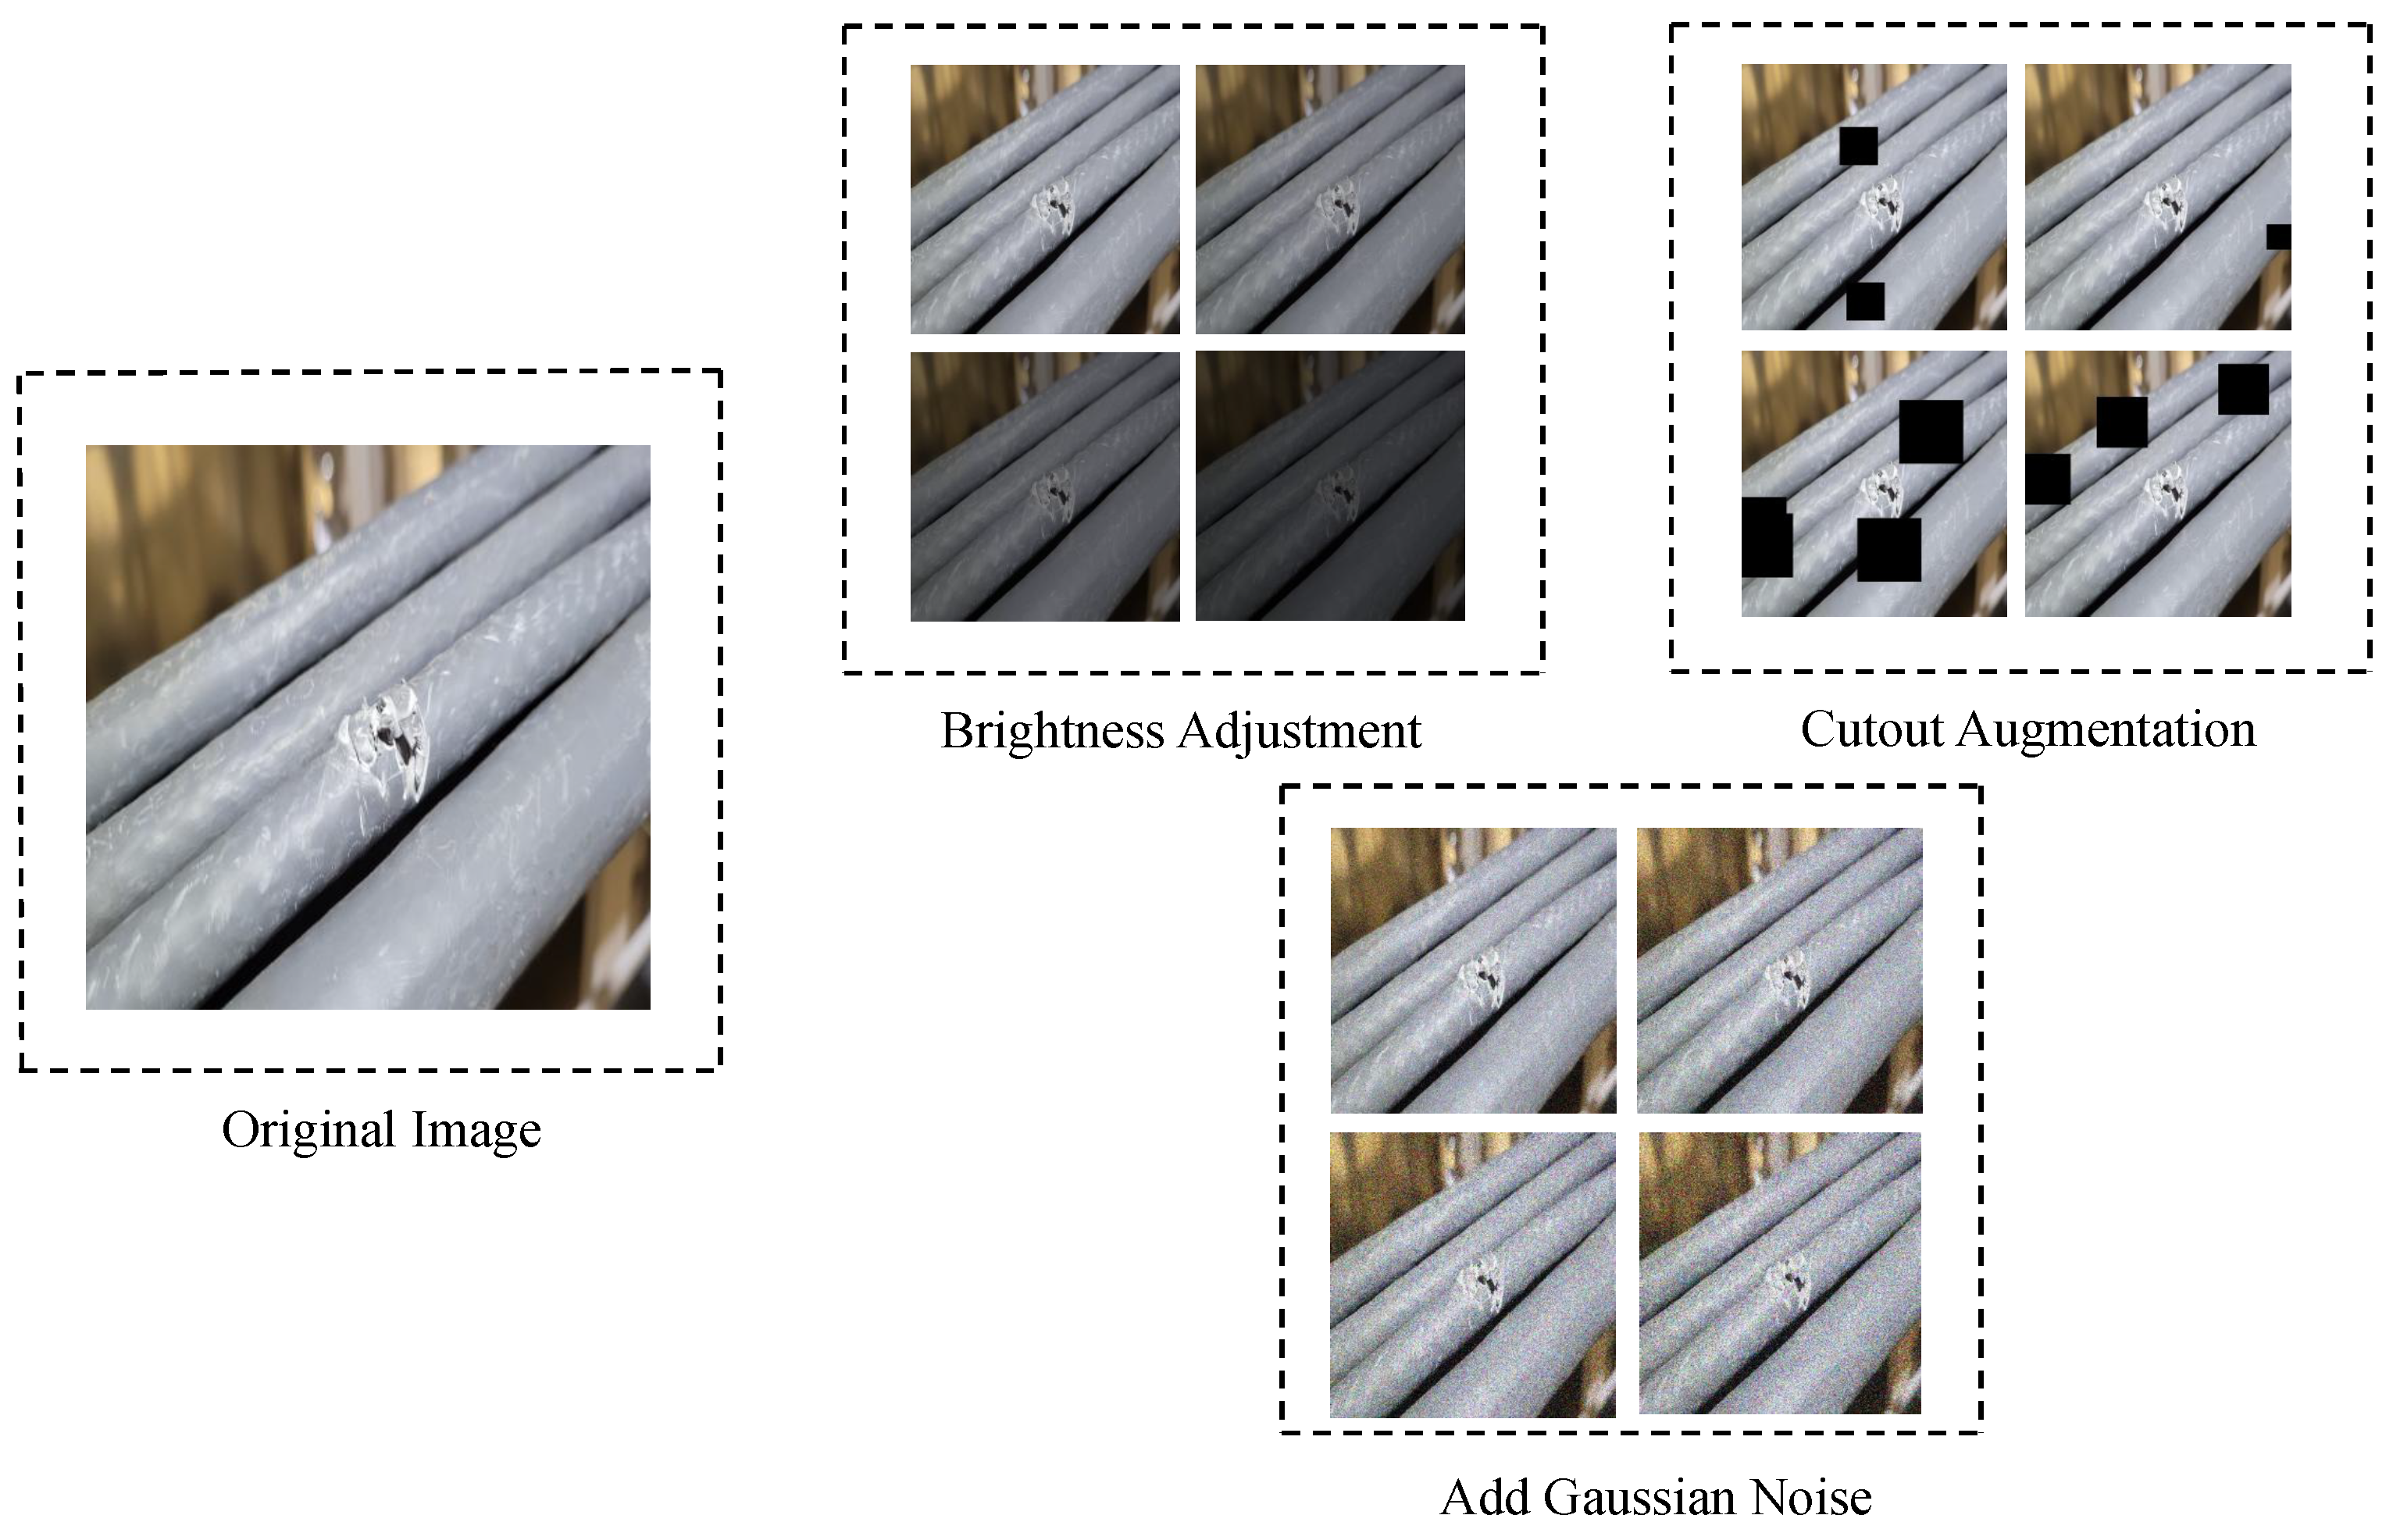
The augmentation techniques adopted in this work include geometric transformations, photometric perturbations, and occlusion simulation. Geometric enhancements involve random cropping, shifting, rotation (45°, 90°, 135°, and 180°), and flipping (horizontal, vertical, and diagonal), with corresponding updates to bounding boxes to ensure label consistency (as shown in Figure 6).
Brightness adjustment [39] is a common data augmentation technique designed to simulate variations in lighting conditions. In this method, the overall brightness of an image is modified by scaling its pixel intensities and optionally adding an offset. Gaussian noise [40] is a widely used data augmentation technique that simulates sensor noise or environmental disturbance in images. Random Erasing [41] is a data augmentation method designed to improve the robustness of visual models by randomly occluding a rectangular region of the input image.
To intuitively demonstrate the effects of different image augmentation techniques, Figure 7 presents representative examples: the original image, brightness adjustment, additive Gaussian noise, and cutout augmentation. These visualizations illustrate how each method introduces controlled perturbations to the input, enhancing the model’s robustness under varying conditions such as lighting changes, noise interference, and partial occlusion.
In summary, image augmentation techniques such as brightness adjustment, Gaussian noise injection, and cutout occlusion play a vital role in enhancing object detection performance. These methods significantly improve the model’s robustness and generalization ability by enriching the diversity of training data and simulating real-world challenges like lighting variation, sensor noise, and partial occlusion. By introducing controlled perturbations, the model learns more representative and resilient feature patterns, laying a solid foundation for downstream training and deployment.

3.2.3. Enhancement Algorithms

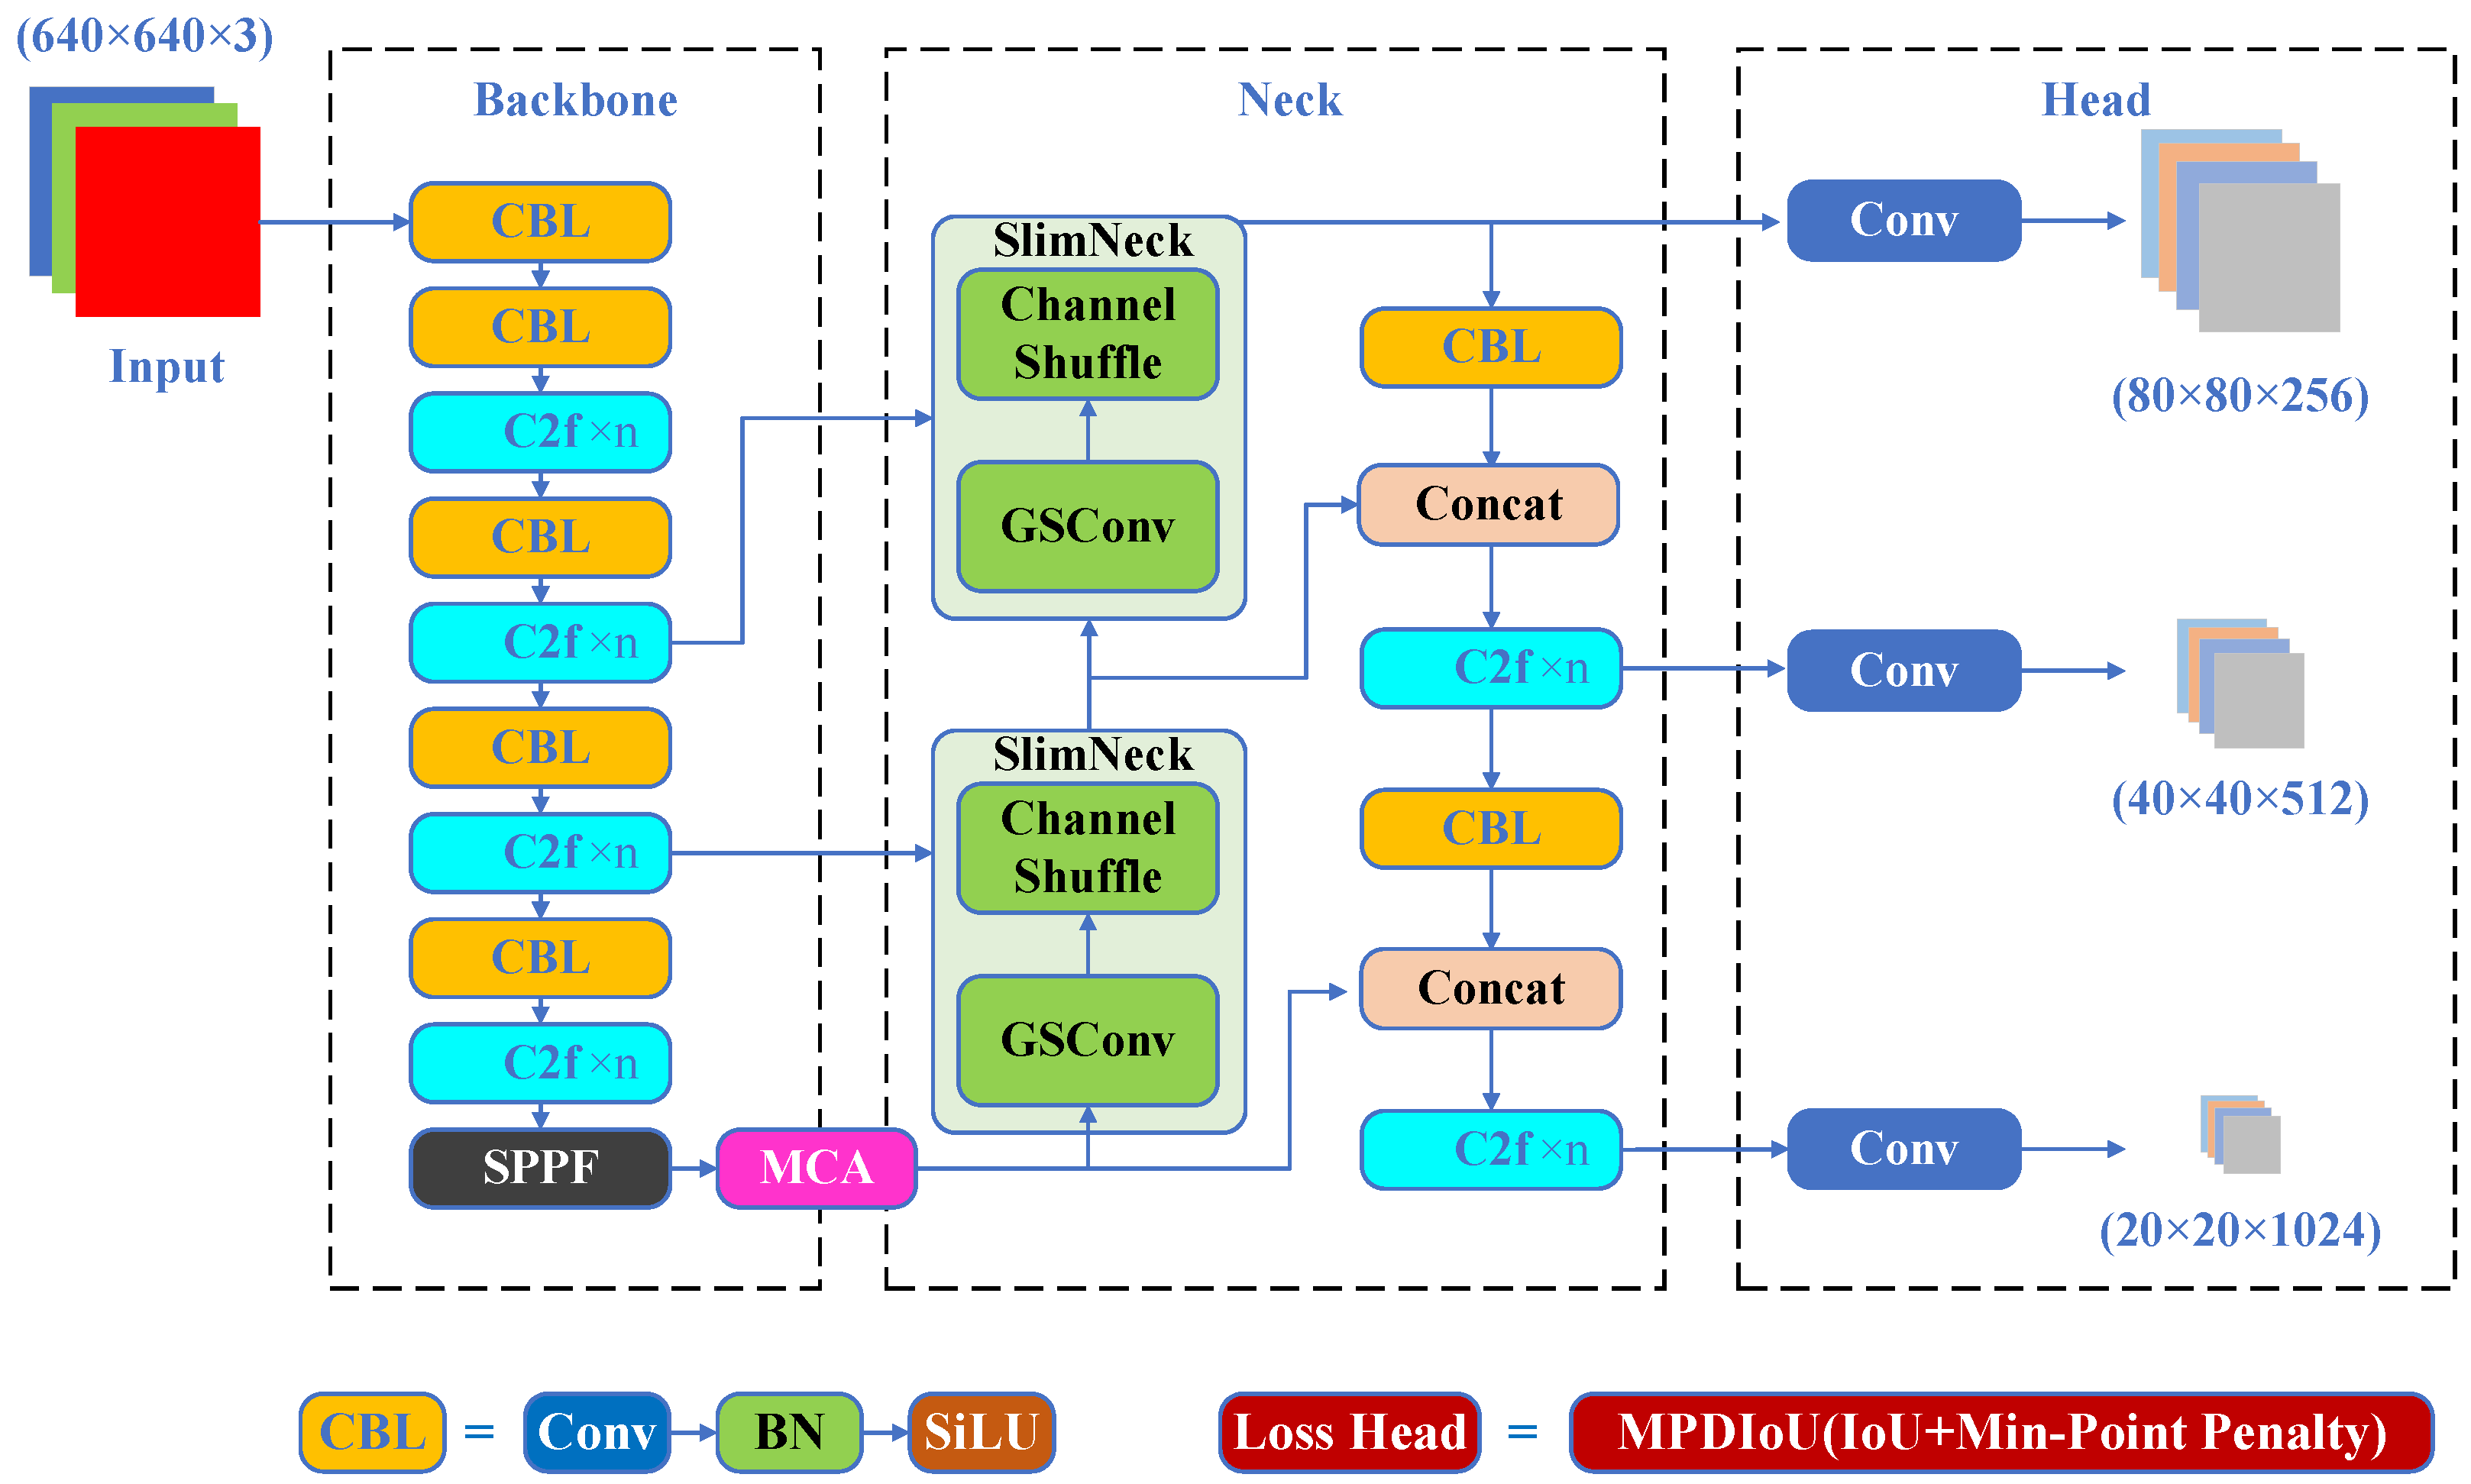
To address the limitations of existing YOLOv8-based detectors in identifying fine-grained cable defects under occlusion and uneven lighting, we introduce a modular enhancement strategy composed of three core components: SlimNeck, MCA, and MPDIoU. The SlimNeck module, designed to improve feature aggregation efficiency, integrates GSConv and VoV-GSCSP blocks to build a lightweight neck architecture. This design improves model compactness and ensures faster inference, making it suitable for real-time deployment on edge devices. The MCA module applies coordinate attention along the channel, width, and height dimensions, enhancing the model’s ability to focus on defect-relevant regions in complex visual scenarios. This helps to boost the discriminative power of extracted features, especially for small-scale or subtle cable defects. The MPDIoU loss function introduces a geometric penalty based on the minimum point-to-point distance between predicted and ground-truth bounding boxes. This refinement addresses limitations of standard IoU-based metrics, improving the localization accuracy for fine-grained defect boundaries. These components are designed to work together to improve feature fusion, spatial attention, and localization accuracy while maintaining real-time performance.
The implementation follows a structured three-step process: module definition, module registration, and structural parsing. This enables seamless integration of customized components without altering the core logic of the backbone network.
First, all custom modules are implemented to maintain compatibility with the base architecture. The SlimNeck module, designed to improve feature aggregation efficiency, combines Grouped Spatial Convolution (GSConv) and Channel Shuffling to compress features with low computational cost. This operation is formulated as [42]
y = GSConv ( x ) + ChannelShuffle ( x ) .
As shown in Figure 8, the SlimNeck architecture integrates the VoV-GSCSP module with GSConv and GSBottleneck components to construct an efficient feature fusion network. By adopting this lightweight design, the YOLOv8n model achieves improved detection accuracy for cable defect recognition while significantly reducing model parameters and enhancing inference speed. Through the collaborative interaction of these modules, the architecture strikes a balance between computational efficiency and feature representation capability, effectively addressing key challenges in cable defect detection systems deployed on edge devices.
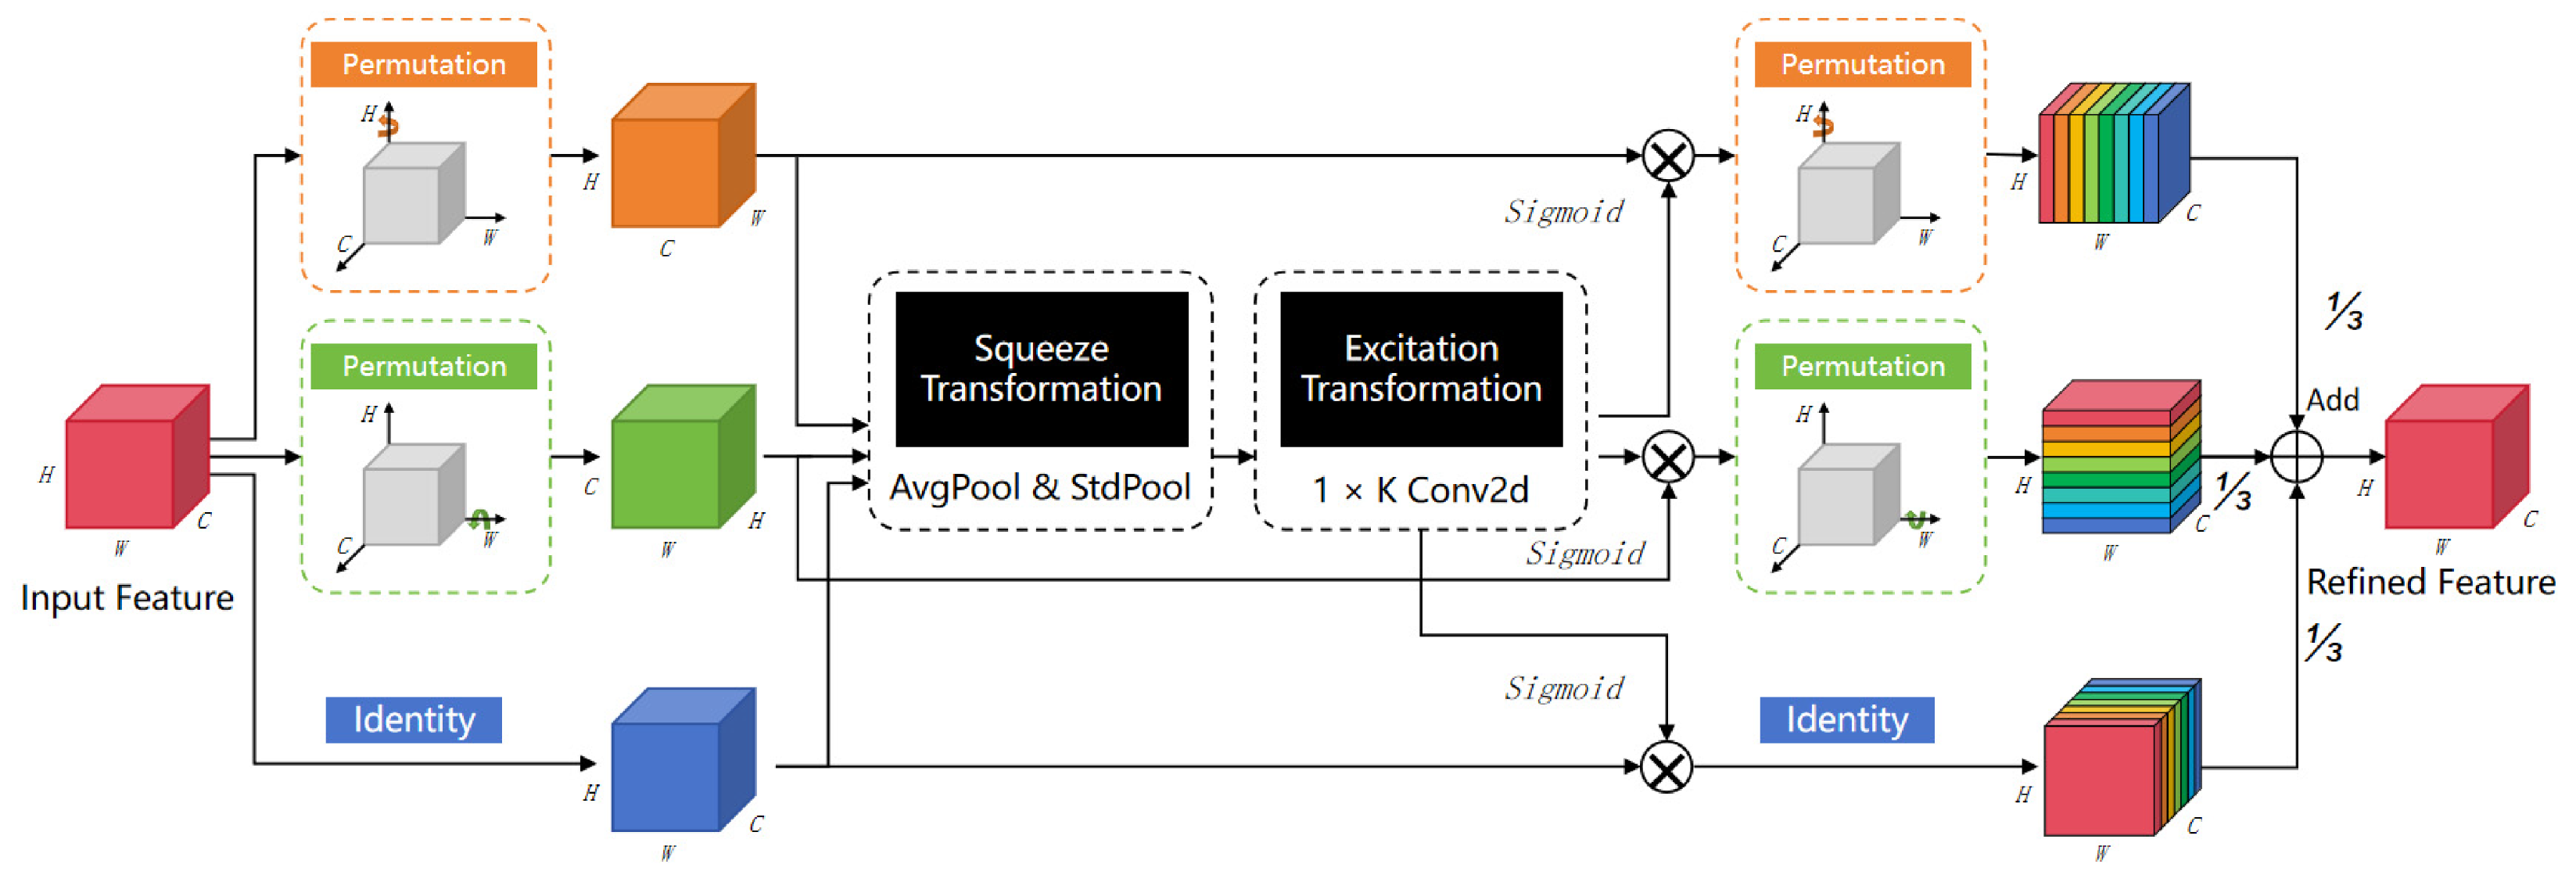
Next, these modules are centrally registered to ensure that they are properly exposed and accessible during model construction. The MCA module enhances feature expressiveness by generating attention weights along three spatial dimensions—channel, width, and height—and applying element-wise modulation to focus the model on informative regions. The process is defined as [43]
X = X · σ ( A c A w A h ) ,
where X denotes the input feature map, A c , A w , and A h are attention weights along the channel, width, and height dimensions, respectively, σ is the sigmoid activation, and ⊕ represents broadcast addition.
As shown in Figure 9, the MCA structure consists of three branches [44]. The top branch, corresponding to the width dimension, reshapes the tensor to focus on defect features distributed horizontally along the cable surface. The middle branch, corresponding to the height dimension, has a similar structure and captures features distributed vertically. The bottom branch, corresponding to the channel dimension, preserves the original channel structure and retains global semantic information. The attention mechanism of MCA includes two key components: compression transformation and excitation transformation. The compression transformation adaptively enhances the feature distinction between defective regions and the background by integrating global average pooling and standard deviation pooling. The excitation transformation determines the interaction coverage range between channels through nonlinear activation, improving the receptive field for small localized defects and generating precise attention weights. On the right side of Figure 9, the outputs of the three branches are recalibrated through attention weights and then fused by simple averaging. This adaptively enhances the feature maps of defects and improves the accuracy of defect localization and recognition.
To support modular flexibility, the model parsing logic is extended to enable the correct instantiation of these modules from YAML-based configuration files. For loss design, this work introduces the MPDIoU loss function, an enhanced variant of Intersection over Union (IoU), which incorporates a geometric penalty based on the shortest point-to-point distance between predicted and ground-truth bounding boxes [45]:
MPDIoU = IoU λ · d min d max .
Here, d min is the minimum Euclidean distance between box boundaries, d max is the maximum possible diagonal distance, and λ is a tunable penalty coefficient.
This modular design decouples task-specific enhancements from the backbone network, enabling plug-and-play extensibility for rapid experimentation. During deployment, the integration of modules is controlled via a unified YAML configuration, ensuring consistency and compatibility across different training pipelines.
To visually illustrate the proposed modular enhancement framework and clarify the interconnections among the custom modules, the overall system architecture is depicted in Figure 10. This diagram outlines the integration of the SlimNeck, MCA, and MPDIoU components within the base network, highlighting their roles in feature fusion, attention modulation, and loss refinement. Each module is designed to operate independently yet cohesively, enabling scalable improvements with minimal disruption to the backbone structure.

3.2.4. Model Accuracy Analysis

To evaluate the effectiveness of the improved YOLOv8 model [46], this study adopts standard object detection evaluation metrics along with loss-based analysis methods. By analyzing the confusion matrix and loss curves, the model’s behavior regarding false positives, false negatives, and overall detection performance is thoroughly examined.
Additionally, a horizontal comparison is conducted among the improved YOLOv8, the original YOLOv8, YOLOv5, YOLOv11, Faster R-CNN, and SSD models. YOLOv11 is included only as a baseline reference, and no component-level integration is performed since the proposed SlimNeck, MCA, and MPDIoU modules were specifically designed and optimized for YOLOv8’s modular and lightweight architecture. Due to architectural differences, applying these components to YOLOv11 would require significant structural adjustments and was therefore beyond the scope of this work. Among other YOLO series, YOLOv6 and YOLOv7 were excluded due to the lack of stable officially maintained implementations. YOLOv12 and later versions were not considered as they were not released or documented during the experimental phase.
The evaluation metrics include precision, recall, average precision (AP), and mean average precision (mAP). These metrics are computed as the area under the precision–recall curve and are used to comprehensively reflect the model’s classification and localization accuracy. Furthermore, model size is also considered to evaluate the efficiency of different models in terms of storage and deployment.
Precision measures the proportion of correctly predicted positive samples among all predicted positives, reflecting the model’s ability to avoid false alarms:
Precision = T P T P + F P .
where T P s (true positives) are instances that were correctly classified as positive and F P s (false positives) are instances that were incorrectly classified as positive. Recall measures the proportion of actual positive samples that are correctly identified, reflecting the model’s sensitivity:
Recall = T P T P + F N .
where F N s (false negatives) are the instances that were incorrectly identified as negative by the model even though they were actually positive. Average precision (AP) is defined as the area under the precision–recall curve for a single class, which evaluates the trade-off between precision and recall across various confidence thresholds:
AP = 0 1 p ( r ) d r .
where p ( r ) is the precision as a function of recall r.
Mean average precision (mAP) is the average of AP values over all object classes and serves as a key indicator of overall detection performance:
mAP = 1 N i = 1 N AP i .
where N is the number of object classes and AP i is the average precision for the i-th class.
By comparing loss values, confusion matrix distributions, and the aforementioned metrics, this study systematically evaluates the effectiveness of the proposed improvements to the YOLOv8 model and validates its performance advantages over mainstream detection models under consistent testing conditions.

4. Experiment

To validate the feasibility and effectiveness of the proposed gecko-inspired underground cable inspection robot, two primary experiments were conducted: a kinematic simulation experiment and a cable defect object detection experiment. Each experiment aimed to evaluate a specific aspect of the robot’s functionality—its locomotion mechanism and its defect recognition capabilities, respectively.

4.1. Kinematic Simulation Experiment

This experiment focused on verifying the accuracy and adaptability of the robot’s motion control based on the established Denavit–Hartenberg (D–H) kinematic model. Using MATLAB and ADAMS, forward and inverse kinematic solutions were simulated to determine the robot’s ability to reach target foot positions and maintain stability during crawling movements. The simulation procedure was carried out as follows:
The 3D model of the robot’s right hind leg was imported into ADAMS in .x_t format. Material properties were assigned to each component, and appropriate joint constraints and motion drivers were applied to the relevant joints. The simulation parameters [47,48] are listed in Table 2 below.
In MATLAB R2023b, trajectory planning and kinematic modeling were performed. The joint position curves during leg motion were computed and exported in text format. The computed joint trajectories were then imported into ADAMS. The CUBSPL function was used to perform cubic spline interpolation on the data, converting it into smooth position curves that were subsequently used as motion drivers for the corresponding joints. Then, an observation point was placed at the foot-end center to monitor the resulting motion.
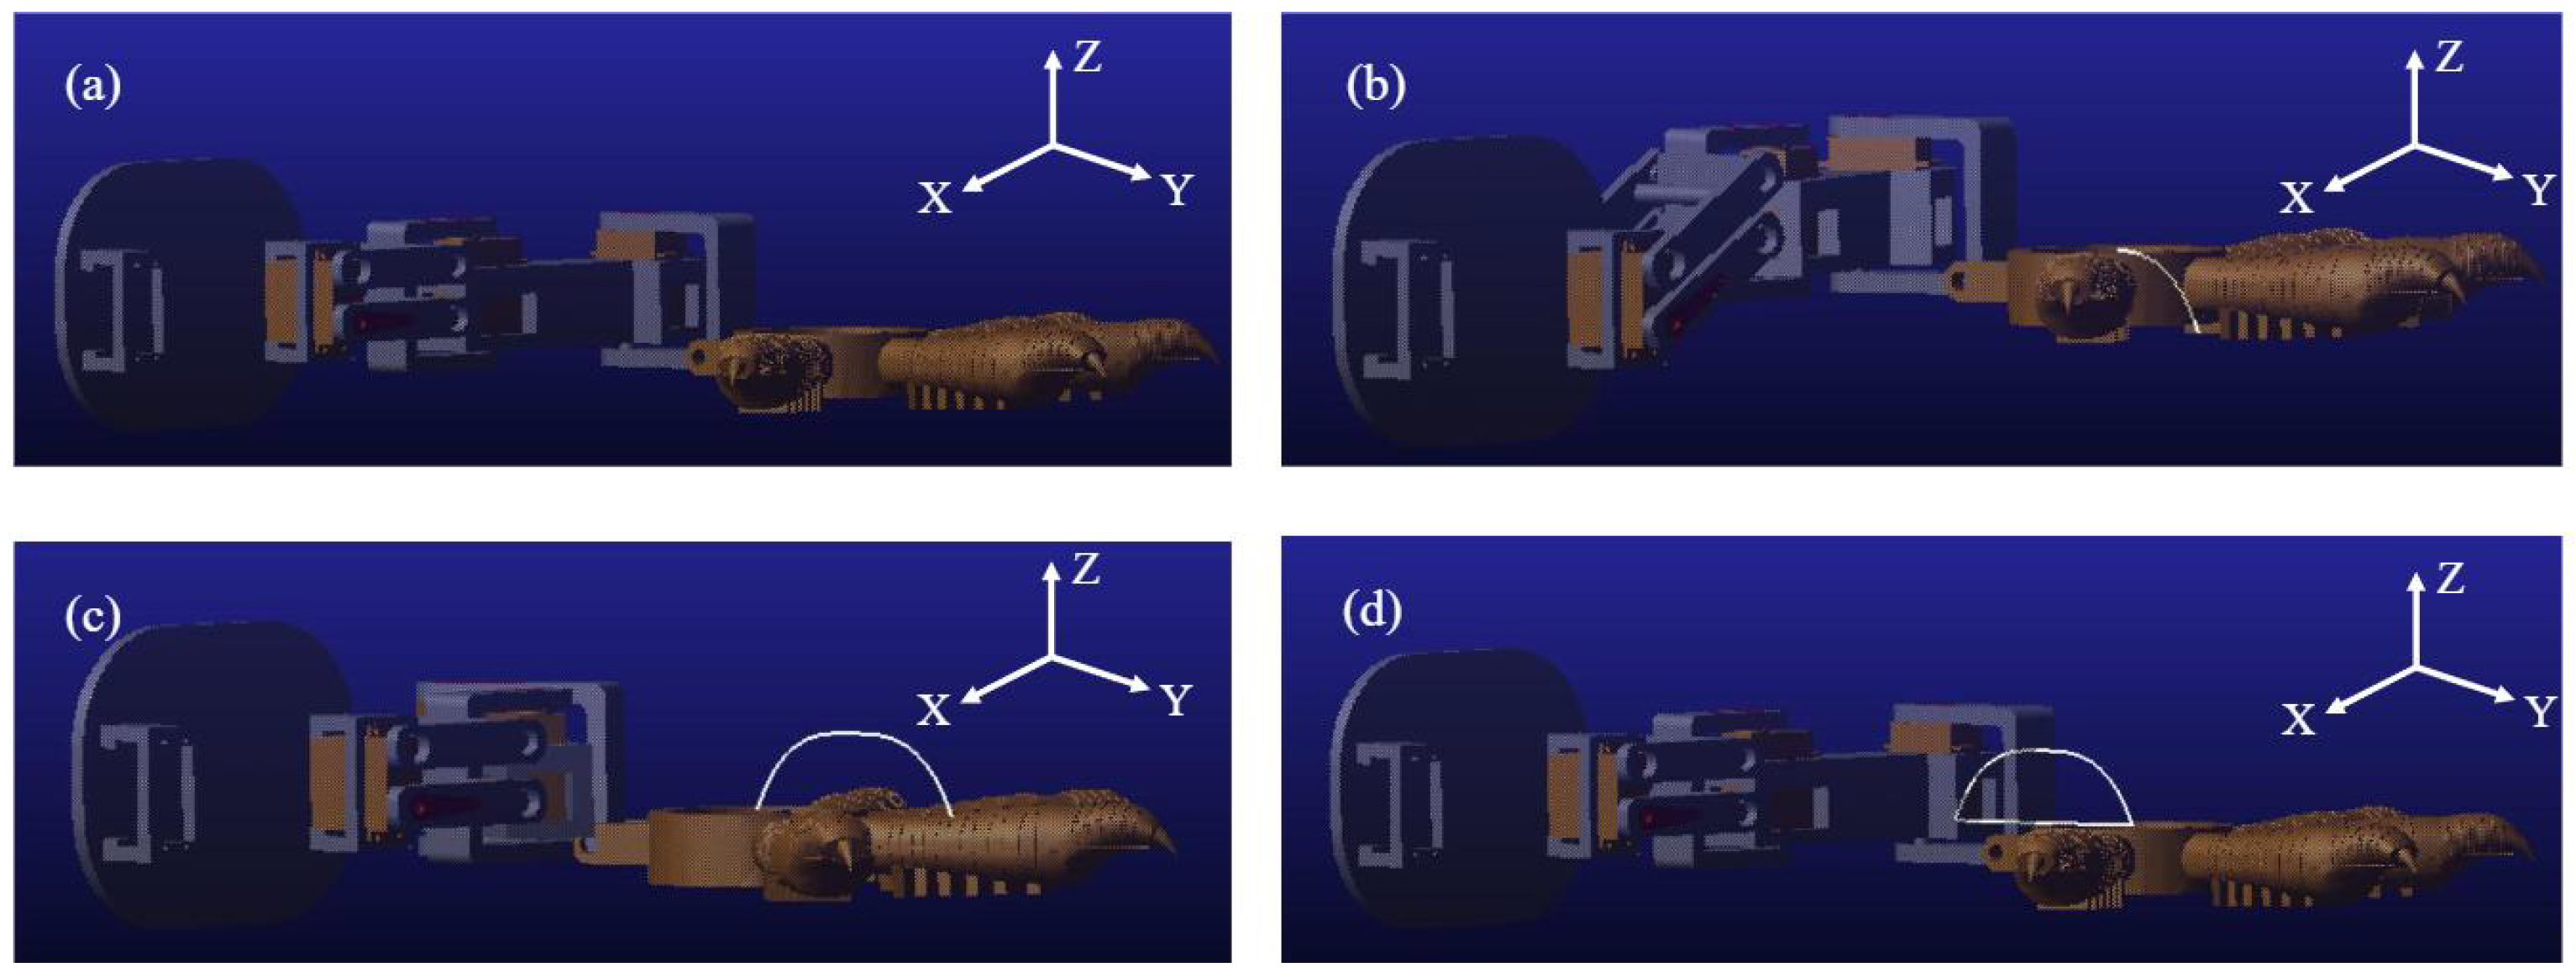
After setting the simulation parameters, time, and step size, the observation point is placed at the center of the foot end to better visualize the motion trajectory. Therefore, in Equations (13) and (14), p x = 0 and p y 0 = 0 . The simulation is then executed. After completion, the motion trajectories of the observation point are exported, as shown in Figure 11.
The figures above show the overall motion trajectory of the robot’s right hind leg. We can observe that the simulated trajectory closely matches the planned foot-end trajectory P (as shown in Figure 12), forming a semi-circular closed loop. Next, we further verify whether the actual trajectory fully coincides with the planned trajectory P.
As shown in Figure 13, the motion trajectory of the foot end in the X, Y, and Z directions is presented. The position in the X direction remains constant throughout the cycle, forming a straight line that aligns with the expected plan. In the Y-direction, the foot-end position increases from 0 mm to 68 mm during the first half of the cycle (0–2 s), then returns from 68 mm to 0 mm during the second half (2–4 s). The total range of motion is 68 mm , which matches the stride length S. In the Z-direction, the foot-end position changes from 0 mm to 20 mm during the first quarter of the cycle (0–1 s), returns to 0 mm in the second quarter (1–2 s), and remains constant during the remaining half. The peak-to-valley distance of 20 mm matches the leg lift height H.
In conclusion, the motion trajectories in all three directions meet the expected design, confirming that the actual motion trajectory coincides with the planned trajectory P.
Figure 14 illustrates the joint angle variations in a complete motion cycle. It can be observed that the motion of each joint exhibits continuous and smooth trends, satisfying the kinematic requirements of the zero-impact trajectory.

4.2. Cable Defect Identification Model Experiment

After the collection and organization of the cable defect data were completed, the model training process was officially initiated. The training and evaluation of the model in this study were conducted on the following hardware and software platforms. The hardware setup includes an Intel i7-11700 CPU (4 cores, 8 threads), an NVIDIA (Santa Clara, CA, USA) GeForce RTX 4080 GPU, and 24 GB of RAM, which provides sufficient computational power for large-scale image data and high-precision detection tasks. The software environment is based on the Linux-Ubuntu 20.04 operating system, with PyTorch 1.11 as the deep learning framework, supported by CUDA 11.3, cuDNN 8.0.4, and OpenCV 4.6.0.6. PyCharm (Community Edition 2024.1.7) was used as the integrated development environment (IDE).
The specific training hyperparameters used in this study are summarized in Table 3. All models were trained and evaluated under the same experimental settings.
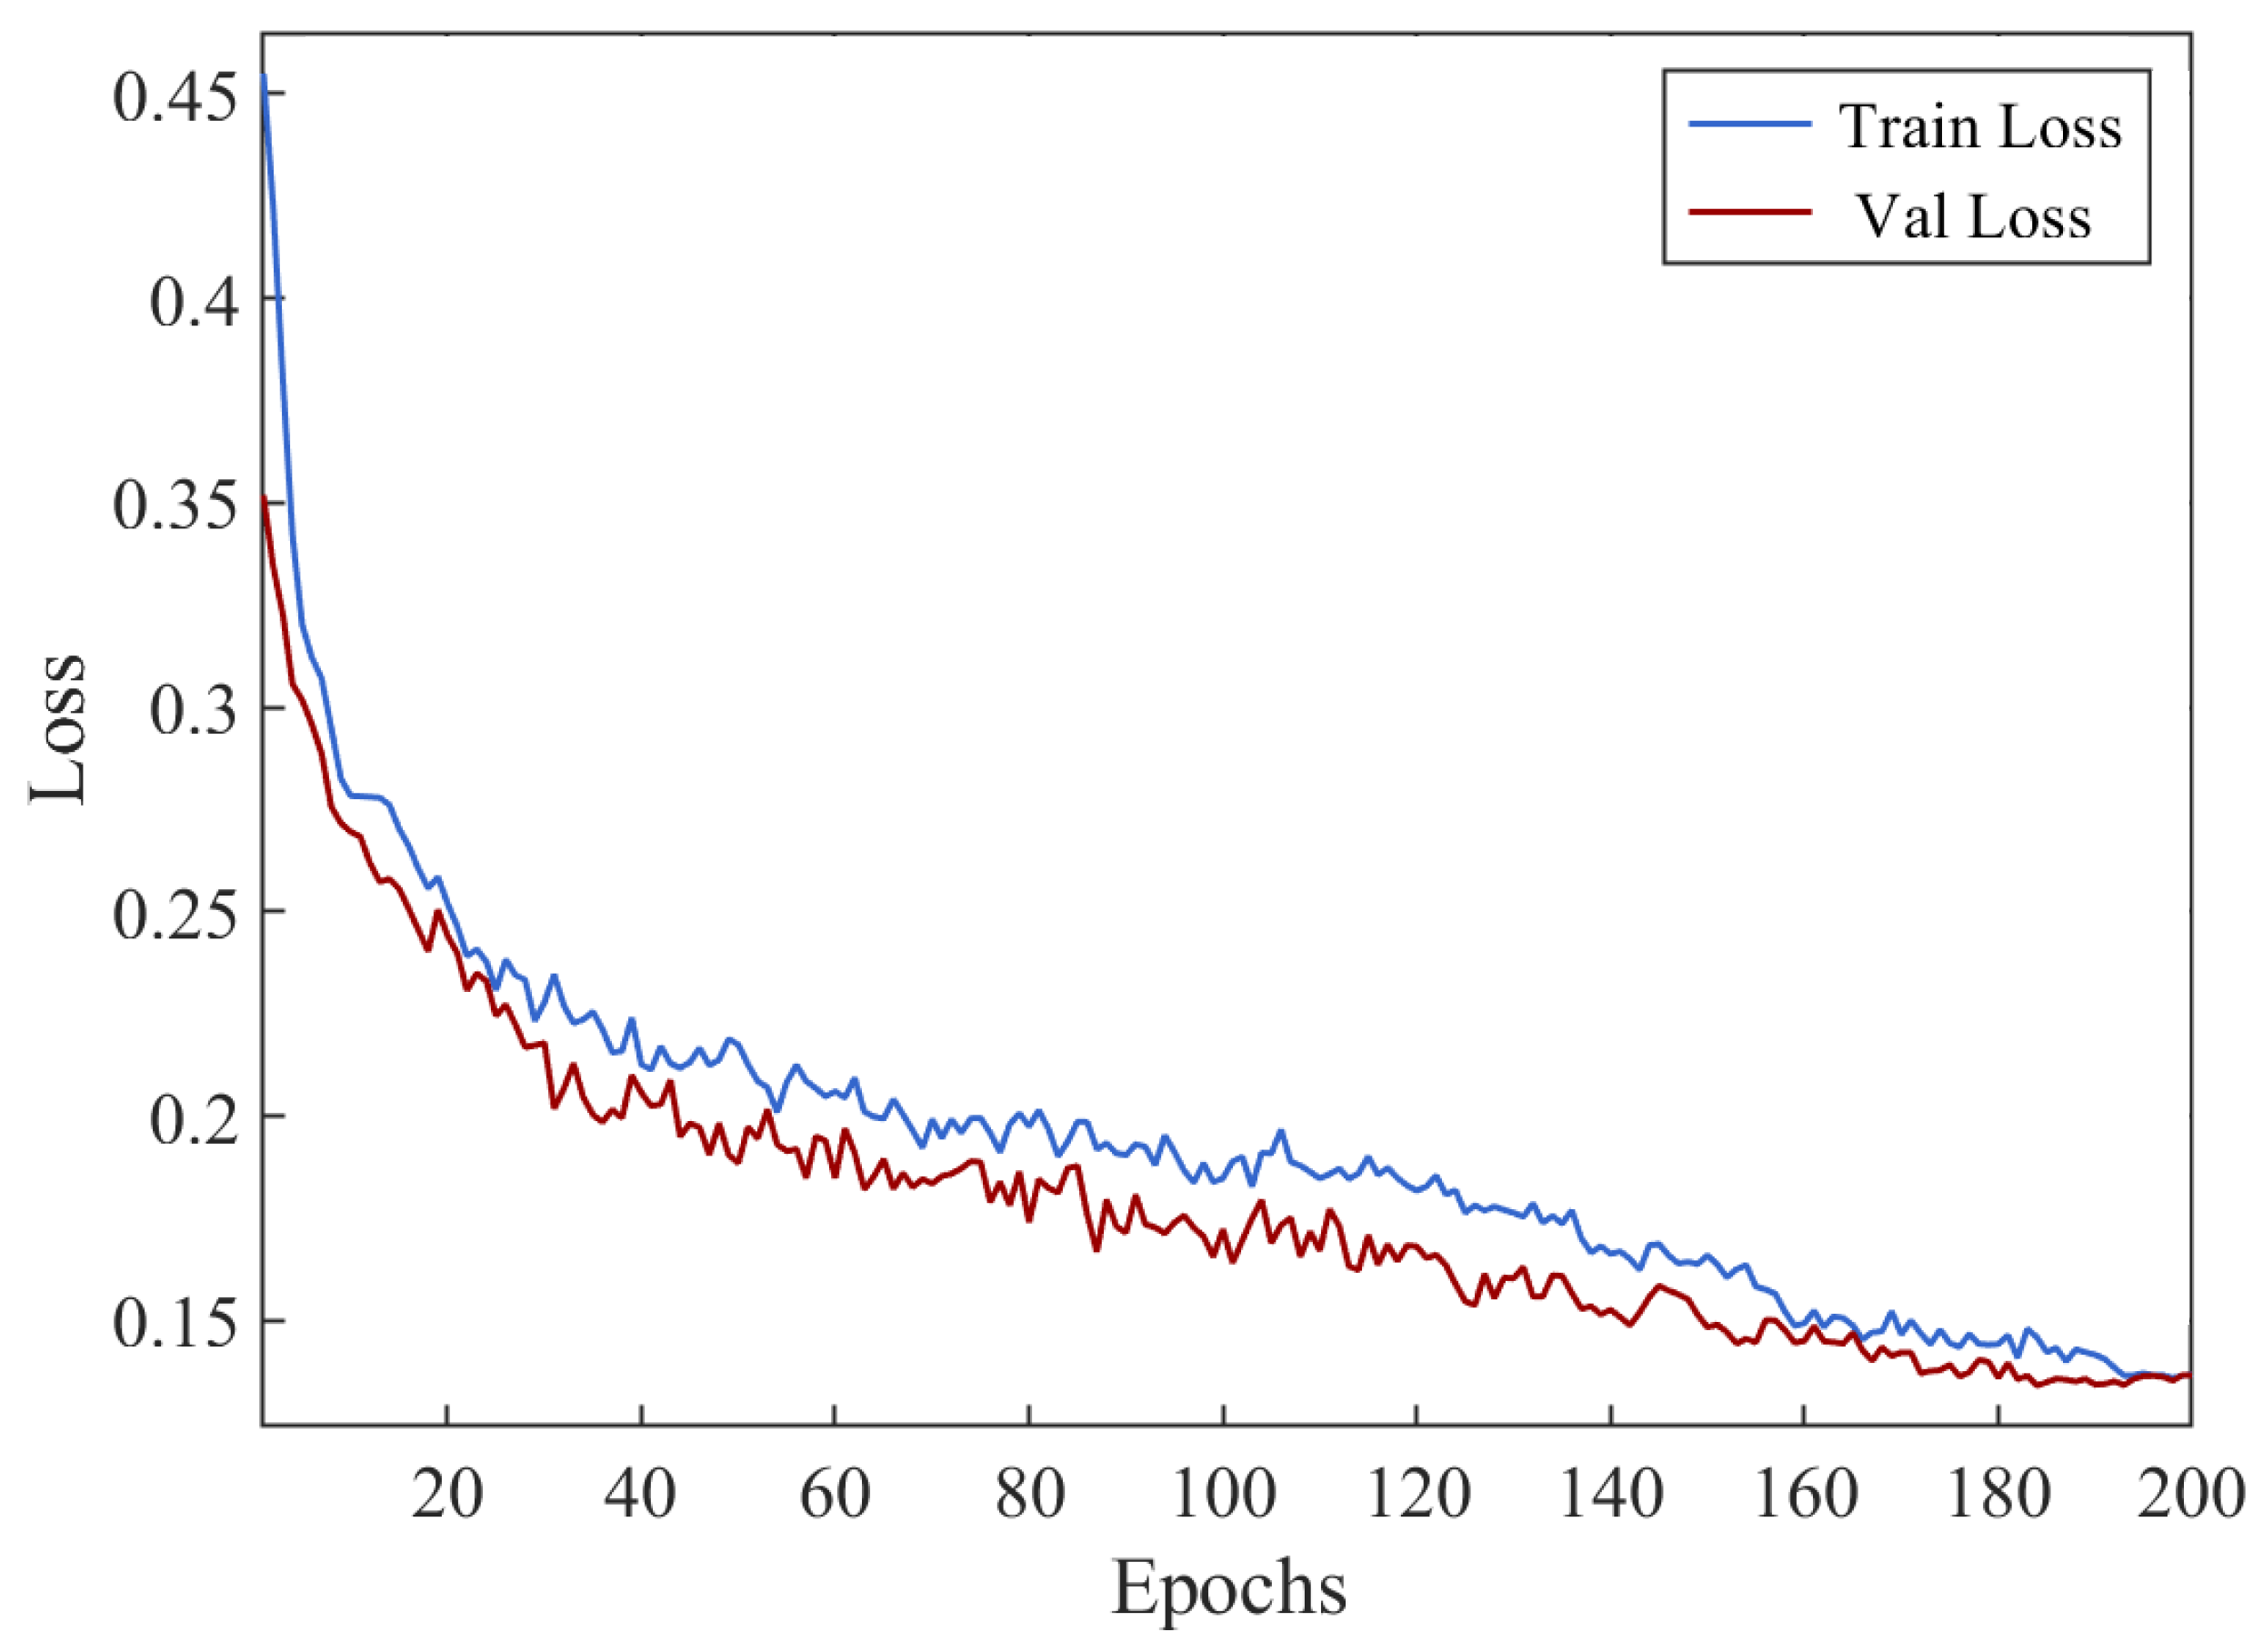
During training, the model’s performance was evaluated by predicting the test set. Figure 15 illustrates the loss curves for both the training set and the validation set over 200 epochs. As shown in the figure, both the training loss and validation loss exhibit a clear downward trend as the number of epochs increases, indicating effective learning by the model. Initially, the loss values are relatively high, but they decrease rapidly during the early epochs, reflecting a steep learning phase. After approximately 50 epochs, the rate of decrease slows, and the curves begin to converge gradually.
Throughout the training process, the validation loss remains consistently lower than the training loss, which suggests that the model generalizes well to unseen data and does not exhibit signs of overfitting. By the end of the training, both losses stabilized around a low value, further indicating that the model had reached convergence and maintained good performance across both datasets.
To thoroughly evaluate the model’s capability in identifying cable defects, a confusion matrix was utilized as the primary performance assessment tool, as presented in Figure 16. The confusion matrix provides detailed insights into classification performance using four essential indicators: true positive (TP), true negative (TN), false positive (FP), and false negative (FN).
According to the figure, the model correctly identifies 97% of actual defects ( T P = 0.97 ) and all background instances ( T N = 1.00 ), with no false positives ( F P = 0.00 ) and only a 3% false negative rate ( F N = 0.03 ). These results indicate that the model achieves high accuracy and strong robustness in distinguishing cable defects from the background. The nearly perfect classification performance demonstrates the model’s reliability and effectiveness in defect detection, offering valuable guidance for further optimization and practical deployment capability.
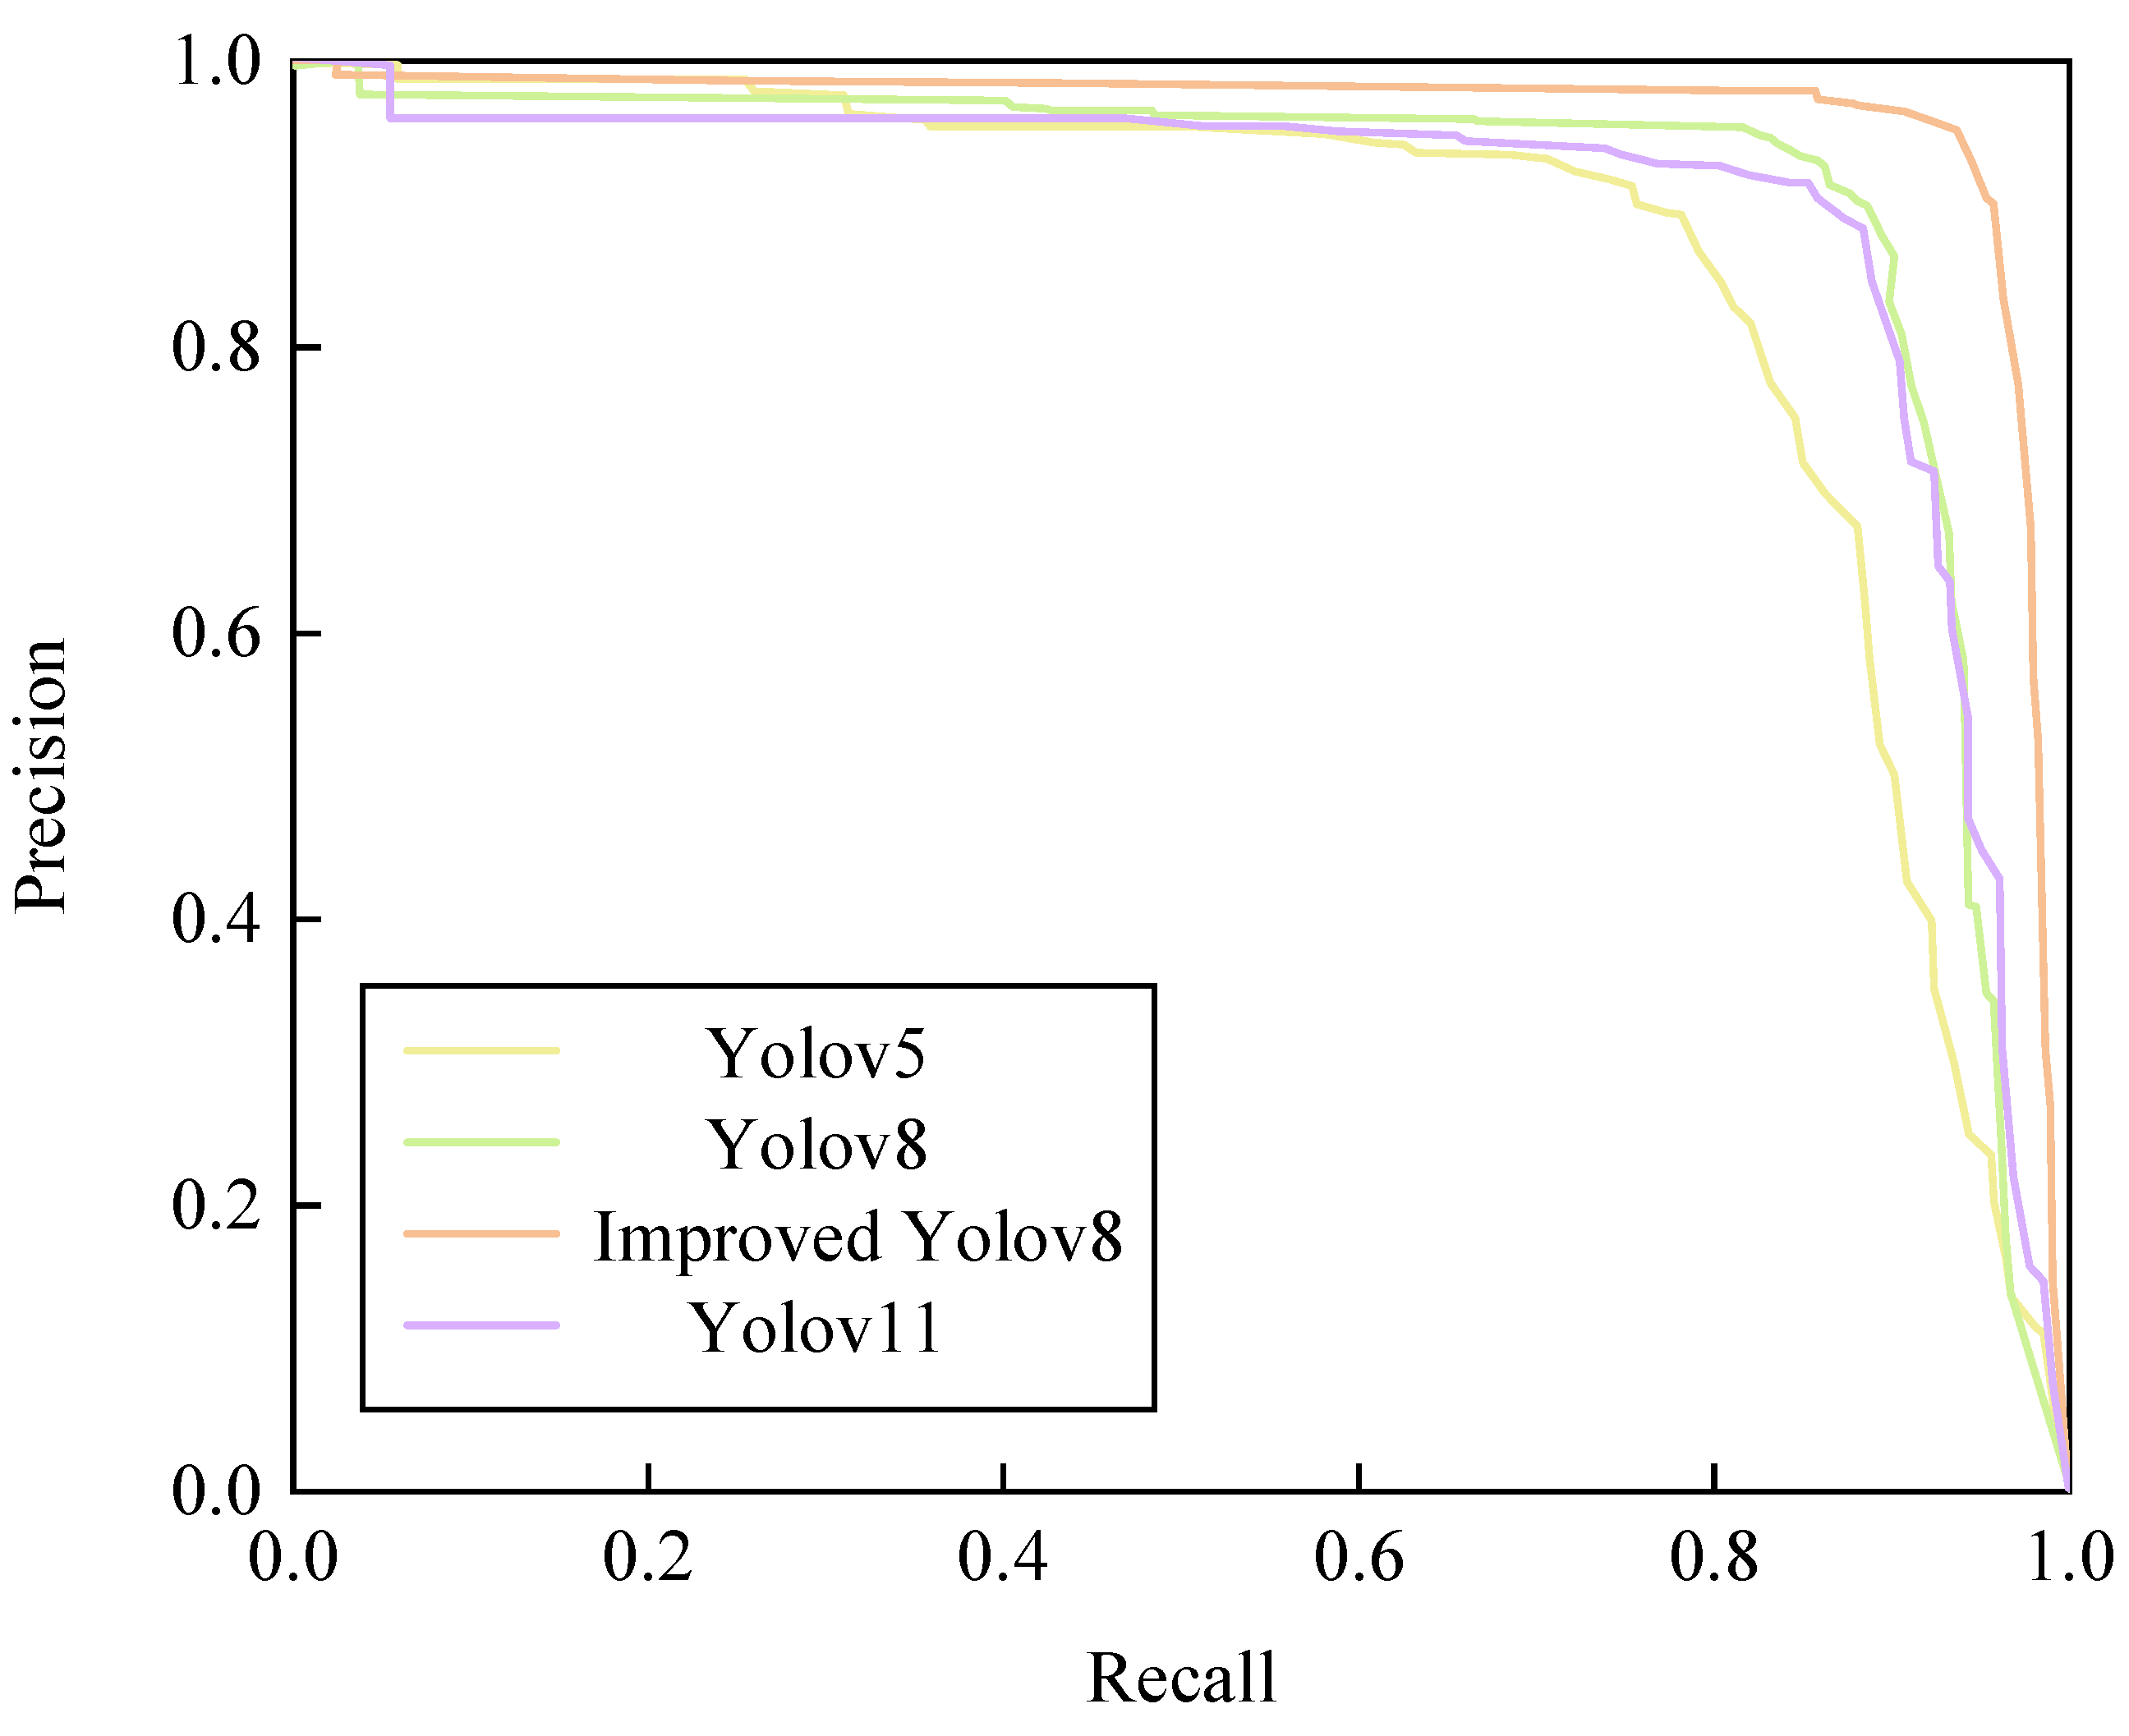
The P–R curve provides an intuitive representation of the trade-off between precision and recall under different confidence thresholds by comparing YOLOv5, YOLOv8, YOLOv11, and the improved YOLOv8, as illustrated in Figure 17. It effectively highlights the overall effectiveness and performance differences of each model in multi-category defect identification tasks.
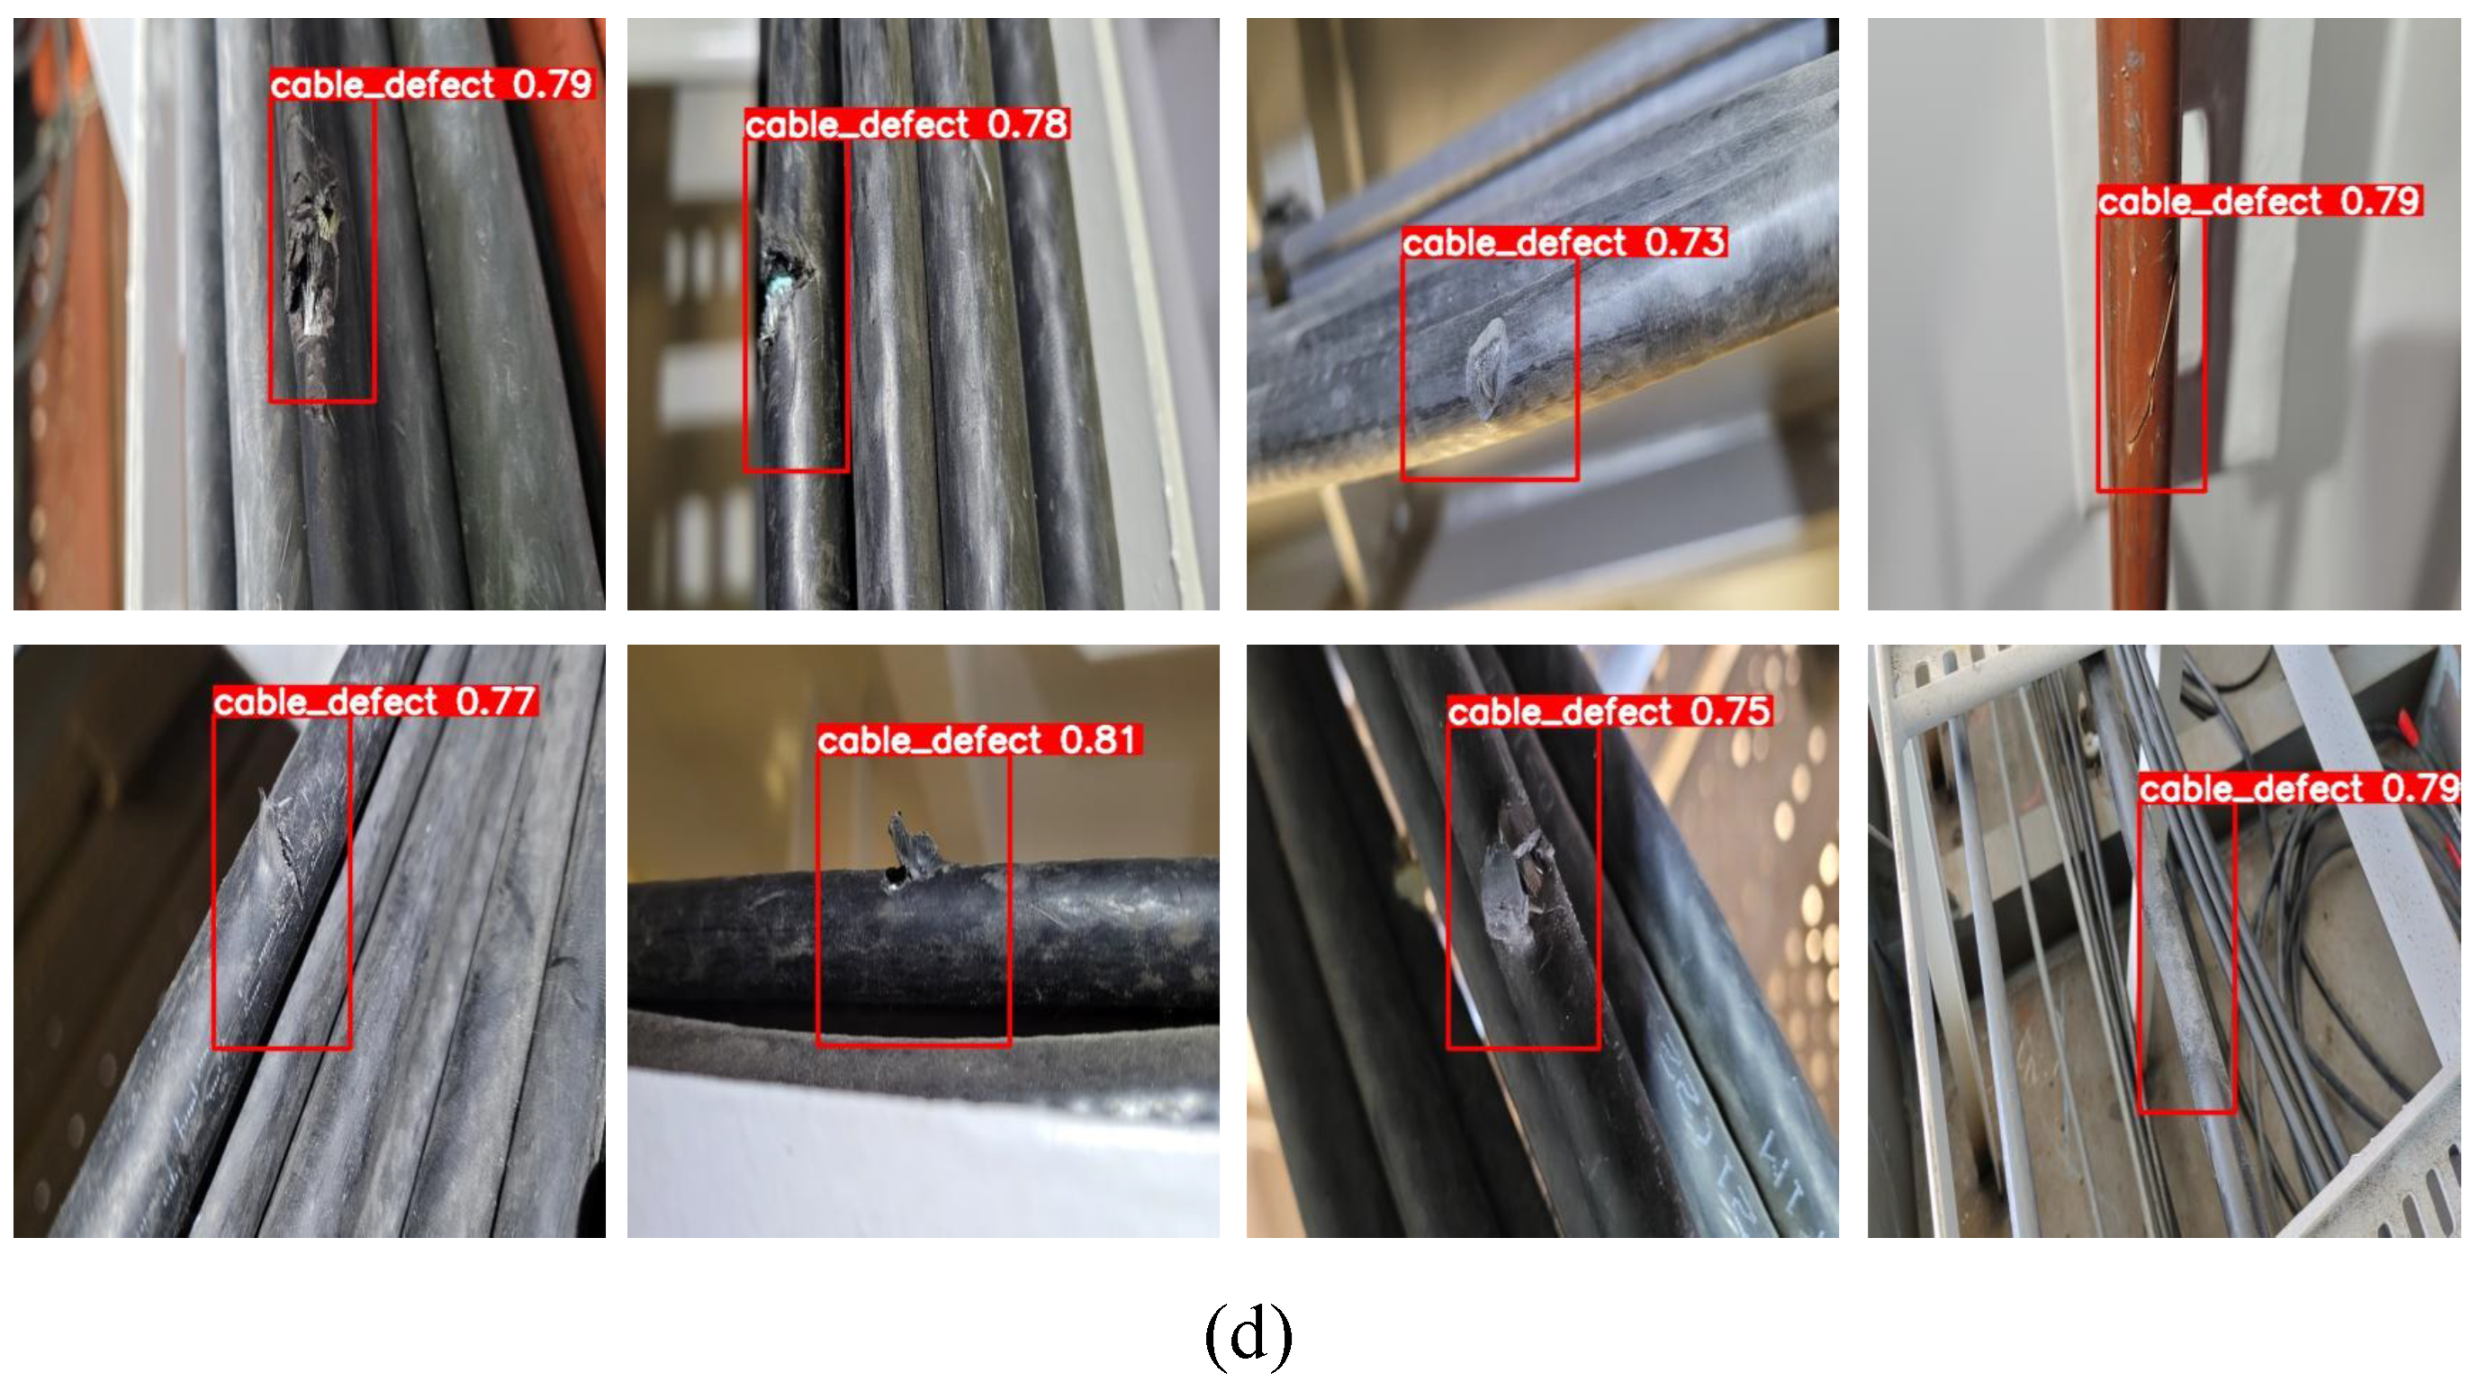
Furthermore, Figure 18 visualizes the prediction results of YOLOv5, YOLOv8, YOLOv11, and the improved YOLOv8. Defect locations are highlighted with red bounding boxes, along with the corresponding prediction confidence. These results highlight the improved model’s superior overall prediction efficacy.
The improved model generates more accurate and consistent detections, with higher confidence scores and more precise localization. Additionally, some unclear or low-confidence predictions in other YOLO models are better resolved in the improved version, demonstrating enhanced feature extraction and classification capability.
Figure 19 presents the performance comparison of four object detection models for cable defect detection. Among them, YOLOv5 shows comparatively lower performance across all the evaluated metrics, implying a higher tendency for false positives and false negatives. The original YOLOv8 demonstrates marked improvements in both precision and recall, resulting in better overall detection accuracy. The improved YOLOv8 model further enhances this performance, achieving superior balance and robustness. In contrast, YOLOv11 maintains relatively high recall but shows a decline in precision and overall F 1 -score, indicating potential weaknesses in suppressing false detections. Overall, the improved YOLOv8 outperforms the other models in terms of comprehensive detection capability.
Table 4 provides a comprehensive comparison of the object detection models in terms of accuracy, model complexity, and inference performance. The proposed YOLOv8-Improved model achieves the highest F1-score (0.933), indicating strong overall detection performance. In addition, it maintains a compact model size (5.78 MB), slightly smaller than YOLOv8 (5.95 MB) and YOLOv11 (5.24 MB), while delivering the fastest inference speed among all the models tested (82.1 FPS). Compared to SSD (65.3 FPS) and Faster R-CNN (59.8 FPS), the improved model exhibits better real-time capabilities without compromising accuracy. These results confirm the effectiveness of the proposed modifications in achieving both high precision and practical deployment efficiency.
To evaluate the individual contributions of each proposed module, an ablation study was conducted by integrating SlimNeck, multidimensional coordinate attention (MCA), and the refined MPDIoU loss into the baseline YOLOv8 model separately. The performance metrics are summarized in Table 5.
Compared to the baseline, YOLOv8-SlimNeck exhibits a notable improvement in inference speed (80.6 FPS vs. 76.6 FPS) and a reduction in model size (5.75 MB vs. 5.95 MB), indicating advantages in deployment efficiency. However, its recall drops (0.888 vs. 0.923), suggesting that excessive lightweighting may lead to missed detections. YOLOv8-MCA achieves a balanced performance between precision (0.896) and recall (0.932), resulting in the highest F1-score (0.9240) among all the variants. This demonstrates the effectiveness of the MCA mechanism in enhancing spatial and channel feature attention. Its FPS also slightly increases to 77.2, showing that the module improves performance without incurring significant computational cost. YOLOv8-MPDIoU improves recall substantially (0.965 vs. 0.923) while maintaining comparable precision and model size. The F1-score increases to 0.9189, and FPS reaches 78.3, indicating that the refined loss function enhances bounding box regression and robustness.
In summary, each module contributes unique strengths: SlimNeck optimizes speed and compactness, MCA enhances robustness and detection performance, and MPDIoU improves localization accuracy. These results validate the effectiveness and practicality of the proposed improvements.

5. Conclusions

This study proposes a novel gecko-inspired quadruped robotic system integrated with a lightweight modular visual inspection framework for the intelligent detection of underground cable defects. Drawing inspiration from the gecko’s flexible spine and articulated limb mechanics, the robot is capable of navigating narrow, uneven, and confined tunnel environments with improved adaptability, stability, and terrain compliance. The robot’s locomotion control is modeled analytically using the Denavit–Hartenberg (D–H) approach, and its performance is validated through zero-impact foot trajectory planning and kinematic simulation, confirming its motion accuracy and gait smoothness.
To tackle the challenges associated with detecting subtle and fine-grained cable surface defects such as insulation aging, micro-cracks, and contamination, we propose an enhanced YOLOv8 detection model. The framework incorporates three key components: a SlimNeck module for efficient feature fusion, a multidimensional coordinate attention (MCA) mechanism for spatial-channel refinement, and a Minimum Point Distance IoU (MPDIoU) loss function for precise object localization. In addition, a suite of data augmentation techniques—including brightness variation, noise injection, and occlusion simulation—were employed to enhance model generalization and robustness under complex underground conditions.
Extensive experimental evaluations demonstrate that the proposed system achieves superior performance in defect detection accuracy, recall, and F 1 -score when compared to the YOLOv5, YOLOv11, SSD, and Faster R-CNN models. These improvements validate the effectiveness of the model enhancements and affirm the feasibility of deploying the system in real-world inspection tasks for power infrastructure.
This work exemplifies the promising synergy between biomimetic mechanical design and deep learning-based visual perception. At the current stage, the system has been evaluated through a detailed kinematic simulation, which validates the robot’s motion planning, coordination, and adaptability in pipeline-like environments. Looking forward, future efforts will focus on building a physical prototype and conducting real-world tests to verify the system’s robustness under practical conditions. In addition, the integration of autonomous decision-making, real-time terrain adaptation, and multi-sensor fusion will be explored to further enhance the robot’s autonomy and environmental awareness. Ultimately, this research lays a solid foundation for developing next-generation inspection robots capable of safe, efficient, and intelligent operations in complex industrial environments.

Author Contributions

Conceptualization, D.G. and B.H.S.A.; methodology, D.G. and B.H.S.A.; resources, B.H.S.A. and D.G.; writing—original draft preparation, B.H.S.A. and D.G.; writing—review and editing, B.H.S.A. and D.G.; supervision, B.H.S.A.; visualization, D.G. and B.H.S.A. All authors have read and agreed to the published version of the manuscript.

Funding

This research received no external funding.

Data Availability Statement

The data presented in this study are available on request from the corresponding author.

Conflicts of Interest

The authors declare no conflicts of interest.

References

  1. Yangí, L.; Yang, G.; Liu, Z.; Chang, Y.; Jiang, B.; Awad, Y.; Xiao, J. Wall-climbing robot for visual and GPR inspection. In Proceedings of the 2018 13th IEEE Conference on Industrial Electronics and Applications (ICIEA), Wuhan, China, 31 May–2 June 2018; pp. 1004–1009. [Google Scholar]
  2. Raut, H.K.; Baji, A.; Hariri, H.H.; Parveen, H.; Soh, G.S.; Low, H.Y.; Wood, K.L. Gecko-inspired dry adhesive based on micro–nanoscale hierarchical arrays for application in climbing devices. ACS Appl. Mater. Interfaces 2018, 10, 1288–1296. [Google Scholar] [CrossRef]
  3. Hegde, N.; Samantaray, R.R.; Kamble, S.J. Automated Robotic System for Pipeline Health Assessment. In Proceedings of the 2025 International Conference on Intelligent and Innovative Technologies in Computing, Electrical and Electronics (IITCEE), Bangalore, India, 16–17 January 2025. [Google Scholar] [CrossRef]
  4. Bian, S.; Xu, F.; Wei, Y.; Kong, D. A Novel Type of Wall-Climbing Robot with a Gear Transmission System Arm and Adhere Mechanism Inspired by Cicada and Gecko. Appl. Sci. 2021, 11, 4137. [Google Scholar] [CrossRef]
  5. Mello, C., Jr.; Gonçalves, E.M.; Estrada, E.; Oliveira, G.; Souto, H., Jr.; Almeida, R.; Botelho, S.; Santos, T.; Oliveira, V. TATUBOT–Robotic System for Inspection of Undergrounded Cable System. In Proceedings of the 2008 IEEE Latin American Robotic Symposium, Salvador, Brazil, 29–30 October 2008; pp. 170–175. [Google Scholar] [CrossRef]
  6. Zheng, Z.; Yuan, X.; Huang, H.; Yu, X.; Ding, N. Mechanical Design of a Cable Climbing Robot for Inspection on a Cable-Stayed Bridge. In Proceedings of the 2018 13th World Congress on Intelligent Control and Automation (WCICA), Changsha, China, 4–8 July 2018; pp. 1680–1684. [Google Scholar] [CrossRef]
  7. Jia, Z.; Liu, H.; Zheng, H.; Fan, S.; Liu, Z. An Intelligent Inspection Robot for Underground Cable Trenches Based on Adaptive 2D-SLAM. Machines 2022, 10, 1011. [Google Scholar] [CrossRef]
  8. Chen, G.; Lin, T.; Lodewijks, G.; Ji, A. Design of an Active Flexible Spine for Wall Climbing Robot Using Pneumatic Soft Actuators. J. Bionic Eng. 2023, 20, 530–542. [Google Scholar] [CrossRef]
  9. Schmidt, D.; Berns, K. Climbing robots for maintenance and inspections of vertical structures—A survey of design aspects and technologies. Robot. Auton. Syst. 2013, 61, 1288–1305. [Google Scholar] [CrossRef]
  10. Chen, M.; Li, Q.; Wang, S.; Zhang, K.; Chen, H.; Zhang, Y. Single-Leg Structural Design and Foot Trajectory Planning for a Novel Bioinspired Quadruped Robot. Complexity 2021, 2021, 6627043. [Google Scholar] [CrossRef]
  11. Feng, X.; Han, Q.; Qiu, B.; Ji, A. Design of a Gecko-Inspired Flexible Foot Using Shape Memory Alloys. J. Nanjing Univ. Aeronaut. Astronaut. 2023, 55, 427–436. (In Chinese) [Google Scholar]
  12. Wang, Z.; Feng, Y.; Wang, B.; Yuan, J.; Zhang, B.; Song, Y.; Wu, X.; Li, L.; Li, W.; Dai, Z. Device for Measuring Contact Reaction Forces during Animal Adhesion Landing/Takeoff from Leaf-like Compliant Substrates. Biomimetics 2024, 9, 141. [Google Scholar] [CrossRef]
  13. Haomachai, W.; Dai, Z.; Manoonpong, P. Transition Gradient From Standing to Traveling Waves for Energy-Efficient Slope Climbing of a Gecko-Inspired Robot. IEEE Robot. Autom. Lett. 2024, 9, 2423–2430. [Google Scholar] [CrossRef]
  14. Li, B.; Wang, X.; Yu, S.; Mei, T. Structure of Gecko Inspired Flexible Foot and Control System. Res. Prepr. 2011, 22, 897–900. [Google Scholar]
  15. Yu, Z.; Fu, J.; Ji, Y.; Zhao, B.; Ji, A. Design of a Variable Stiffness Gecko-Inspired Foot and Adhesion Performance Test on Flexible Surface. Biomimetics 2022, 7, 125. [Google Scholar] [CrossRef] [PubMed]
  16. Tang, Y.; Chi, Y.; Sun, J.; Huang, T.H.; Maghsoudi, O.H.; Spence, A.; Zhao, J.; Su, H.; Yin, J. Leveraging elastic instabilities for amplified performance: Spine-inspired high-speed and high-force soft robots. Sci. Adv. 2020, 6, eaaz6912. [Google Scholar] [CrossRef] [PubMed]
  17. Liu, J.; Xu, L.; Chen, S.; Xu, H.; Cheng, G.; Li, T.; Yang, Q. Design and realization of a bio-inspired wall climbing robot for rough wall surfaces. In Proceedings of the Intelligent Robotics and Applications: 12th International Conference, ICIRA 2019, Shenyang, China, 8–11 August 2019; Springer: Berlin/Heidelberg, Germany, 2019; pp. 47–59. [Google Scholar]
  18. Chen, D.; Zhang, Q.; Wang, L.; Zu, Y. Design and realization of a kind of rough wall climbing robot. J. Harbin Eng. Univ. 2012, 33, 209–213. [Google Scholar]
  19. Beck, H.K.; Schultz, J.T.; Clemente, C.J. A Bio-Inspired Robotic Climbing Robot to Understand Kinematic and Morphological Determinants for an Optimal Climbing Gait. Bioinspiration Biomimetics 2022, 17, 016005. [Google Scholar] [CrossRef]
  20. Qiu, J.; Ji, A.; Zhu, K.; Han, Q.; Wang, W.; Qi, Q.; Chen, G. A Gecko-Inspired Robot with a Flexible Spine Driven by Shape Memory Alloy Springs. Soft Robot. 2023, 10, 713–723. [Google Scholar] [CrossRef]
  21. Cruz-Ortiz, D.; Ballesteros-Escamilla, M.; Chairez, I.; Luviano, A. Output Second-Order Sliding-Mode Control for a Gecko Biomimetic Climbing Robot. J. Bionic Eng. 2019, 16, 633–646. [Google Scholar] [CrossRef]
  22. Hu, K.; Chen, Z.; Kang, H.; Tang, Y. 3D vision technologies for a self-developed structural external crack damage recognition robot. Autom. Constr. 2024, 159, 105262. [Google Scholar] [CrossRef]
  23. Li, X.; Hu, Y.; Jie, Y.; Zhao, C.; Zhang, Z. Dual-Frequency Lidar for Compressed Sensing 3D Imaging Based on All-Phase Fourier Transform. J. Opt. Photonics Res. 2023, 1, 74–81. [Google Scholar] [CrossRef]
  24. Xiao, F.; Chu, S.; Guo, X.; Zhang, Y.; Huang, R. Enhanced path planning for robot navigation in Gaussian noise environments with YOLO v10 and depth deterministic strategies. Discov. Artif. Intell. 2025, 5, 44. [Google Scholar] [CrossRef]
  25. Liu, G.; Jin, C.; Ni, Y.; Yang, T.; Liu, Z. UCIW-YOLO: Multi-category and high-precision obstacle detection model for agricultural machinery in unstructured farmland environments. Expert Syst. Appl. 2025, 294, 128686. [Google Scholar] [CrossRef]
  26. Liu, X.; Zhao, K.; Liu, C.; Chen, L. Bi2F-YOLO: A novel framework for underwater object detection based on YOLOv7. Intell. Mar. Technol. Syst. 2025, 3, 9. [Google Scholar] [CrossRef]
  27. Bhagwat, A.; Dutta, S.; Saha, D.; Reddy, M.J.B. An online 11 kV distribution system insulator defect detection approach with modified YOLOv11 and MobileNetV3. Sci. Rep. 2025, 15, 15691. [Google Scholar] [CrossRef]
  28. Wang, H.; Zhang, G.; Cao, H.; Hu, K.; Wang, Q.; Deng, Y.; Gao, J.; Tang, Y. Geometry-Aware 3D Point Cloud Learning for Precise Cutting-Point Detection in Unstructured Field Environments. J. Field Robot. 2025; early view. [Google Scholar] [CrossRef]
  29. Hou, S.; Dong, B.; Wang, H.; Wu, G. Inspection of surface defects on stay cables using a robot and transfer learning. Autom. Constr. 2020, 119, 103382. [Google Scholar] [CrossRef]
  30. Magdy, A.; Moustafa, M.S.; Ebied, H.M.; Tolba, M.F. Lightweight faster R-CNN for object detection in optical remote sensing images. Sci. Rep. 2025, 15, 16163. [Google Scholar] [CrossRef]
  31. Gelu-Simeon, M.; Mamou, A.; Saint-Georges, G.; Alexis, M.; Sautereau, M.; Mamou, Y.; Simeon, J. Deep learning model applied to real-time delineation of colorectal polyps. BMC Med. Inform. Decis. Mak. 2025, 25, 206. [Google Scholar] [CrossRef] [PubMed]
  32. Terven, J.; Córdova-Esparza, D.M.; Romero-González, J.A. A Comprehensive Review of YOLO Architectures in Computer Vision: From YOLOv1 to YOLOv8 and YOLO-NAS. Mach. Learn. Knowl. Extr. 2023, 5, 1680–1716. [Google Scholar] [CrossRef]
  33. Varghese, R.; Sambath, M. YOLOv8: A Novel Object Detection Algorithm with Enhanced Performance and Robustness. In Proceedings of the 2024 International Conference on Advances in Data Engineering and Intelligent Computing Systems (ADICS), Chennai, India, 18–19 April 2024. [Google Scholar] [CrossRef]
  34. Biswal, P.; Mohanty, P.K. Kinematic and Dynamic Modeling of a Quadruped Robot. In Proceedings of the Machines, Mechanism and Robotics, Ischia, Italy, 1–3 June 2022; Kumar, R., Chauhan, V.S., Talha, M., Pathak, H., Eds.; Springer: Singapore, 2022; pp. 369–378. [Google Scholar]
  35. Patil, A.; Kulkarni, M.; Aswale, A. Analysis of the inverse kinematics for 5 DOF robot arm using D-H parameters. In Proceedings of the 2017 IEEE International Conference on Real-time Computing and Robotics (RCAR), Okinawa, Japan, 14–18 July 2017; pp. 688–693. [Google Scholar] [CrossRef]
  36. Wang, L.; Wang, J.; Wang, S.; He, Y. Gait Control Strategy of a Hydraulic Quadruped Robot Based on Foot-End Trajectory Planning Algorithm. J. Mech. Eng. 2013, 49, 39–44. [Google Scholar] [CrossRef]
  37. Roboflow, S. Cable Surface Defect Detection Dataset. 2025. Available online: https://universe.roboflow.com/seok-6suvt/-q5ecy (accessed on 23 June 2025).
  38. Ogino, Y.; Shoji, Y.; Toizumi, T.; Ito, A. ERUP-YOLO: Enhancing Object Detection Robustness for Adverse Weather Condition by Unified Image-Adaptive Processing. In Proceedings of the 2025 IEEE/CVF Winter Conference on Applications of Computer Vision (WACV), Tucson, AZ, USA, 26 February–6 March 2025; pp. 8597–8605. [Google Scholar] [CrossRef]
  39. Kaur, P.; Khehra, B.S.; Mavi, E.B.S. Data Augmentation for Object Detection: A Review. In Proceedings of the 2021 IEEE International Midwest Symposium on Circuits and Systems (MWSCAS), Lansing, MI, USA, 9–11 August 2021; pp. 537–543. [Google Scholar] [CrossRef]
  40. Uddin, A.F.M.S.; Qamar, M.; Mun, J.; Lee, Y.; Bae, S.H. GaussianMix: Rethinking Receptive Field for Efficient Data Augmentation. Appl. Sci. 2025, 15, 4704. [Google Scholar] [CrossRef]
  41. Zhong, Z.; Zheng, L.; Kang, G.; Li, S.; Yang, Y. Random Erasing Data Augmentation. arXiv 2017, arXiv:1708.04896. [Google Scholar] [CrossRef]
  42. Li, H.; Li, J.; Wei, H.; Liu, Z.; Zhan, Z.; Ren, Q. Slim-neck by GSConv: A lightweight-design for real-time detector architectures. J. Real Time Image Process. 2024, 21, 62. [Google Scholar] [CrossRef]
  43. Yu, Y.; Zhang, Y.; Cheng, Z.; Song, Z.; Tang, C. MCA: Multidimensional collaborative attention in deep convolutional neural networks for image recognition. Eng. Appl. Artif. Intell. 2023, 126, 107079. [Google Scholar] [CrossRef]
  44. Zhou, N.; Gao, D.; Zhu, Z. YOLOv8n-SMMP: A Lightweight YOLO Forest Fire Detection Model. Fire 2025, 8, 183. [Google Scholar] [CrossRef]
  45. Ma, S.; Xu, Y. MPDIoU: A Loss for Efficient and Accurate Bounding Box Regression. arXiv 2023, arXiv:2307.07662. [Google Scholar]
  46. Alqahtani, D.K.; Cheema, A.; Toosi, A.N. Benchmarking Deep Learning Models for Object Detection on Edge Computing Devices. arXiv 2024, arXiv:2409.16808. [Google Scholar]
  47. Lankarani, H.; Nikravesh, P. Continuous contact force models for impact analysis in multibody systems. Nonlinear Dyn. 1994, 5, 193–207. [Google Scholar] [CrossRef]
  48. Flores, P.; Ambrósio, J.; Claro, J.; Lankarani, H. Influence of the contact-impact force model on the dynamic response of multi-body systems. Proc. Inst. Mech. Eng. K 2006, 220, 21–34. [Google Scholar] [CrossRef]
Figure 1. Biological gecko [12].
Electronics 14 03142 g001
Figure 2. Structural diagram of a wall-climbing bionic robot.
Electronics 14 03142 g002
Figure 3. Denavit–Hartenberg modeling diagram of a quadruped robot.
Electronics 14 03142 g003
Figure 4. SDH parameter reference diagram.
Electronics 14 03142 g004
Figure 5. Cable defect dataset [37].
Electronics 14 03142 g005
Figure 6. Examples of cropping, flipping, rotating, and translation on an image.
Electronics 14 03142 g006
Figure 7. Examples of brightness adjustment, adding Gaussian noise, and cutout augmentation on an image.
Electronics 14 03142 g007
Figure 8. Structural diagram of the SlimNeck neck module.
Electronics 14 03142 g008
Figure 9. Architecture of the multidimensional channel attention (MCA) module [44].
Electronics 14 03142 g009
Figure 10. Modular enhanced detection framework based on YOLOv8.
Electronics 14 03142 g010
Figure 11. Simulated foot trajectory of the motion cycle: (a) t = 0 s, (b) t = 1 s, (c) t = 2 s, and (d) t = 4 s.
Electronics 14 03142 g011
Figure 12. Planned foot-end trajectory P for the robot’s right hind leg.
Electronics 14 03142 g012
Figure 13. Variations in foot-end position in three directions.
Electronics 14 03142 g013
Figure 14. Joint angle trajectories over a complete motion cycle.
Electronics 14 03142 g014
Figure 15. Loss curves during model training and validation.
Electronics 14 03142 g015
Figure 16. Confusion matrix for cable defect classification.
Electronics 14 03142 g016
Figure 17. Precision–recall curve for cable defect detection for YOLOv5, YOLOv8, improved YOLOv8, and YOLOv11.
Electronics 14 03142 g017
Figure 18. Comparison of detection results for cable defects: (a) YOLOv5, (b) YOLOv8, (c) improved YOLOv8, and (d) YOLOv11.
Electronics 14 03142 g018aElectronics 14 03142 g018b
Figure 19. Detection performance comparison for cable defects across different algorithms.
Electronics 14 03142 g019
Table 1. Denavit–Hartenberg parameters.
Joint Angle ( θ i )Joint Distance ( d i )Link Length ( a i )Link Twist ( α i )
θ 1 0 L 1 90
θ 2 0 L 2 0
θ 3 0 L 3 90
θ 4 0 L 4 0
θ 5 0 L 5 0
Table 2. Contact parameters between foot and ground.
ParameterValueUnit
Stiffness2855N/mm
Force Exponent1.5
Damping5N·s/mm
Penetration Depth0.1mm
Static Friction Coefficient0.8
Dynamic Friction Coefficient0.6
Friction Transition Velocity1mm/s
Stiction Transition Velocity10mm/s
Table 3. Training hyperparameters used in this study.
ParameterValue
Epochs200
Batch Size16
Momentum0.937
Initial Learning Rate0.01
Learning Rate ScheduleDynamic
Weight Decay0.0005
OptimizerSGD
Table 4. Performance comparison of object detection models.
ModelPrecisionRecallF1-ScoreModel Size (MB)FPS
YOLOv50.7280.8750.7955.0370.2
YOLOv80.8950.9230.9095.9576.6
YOLOv8-Improved0.9000.9700.9335.7882.1
YOLOv110.8020.9160.8555.2474.7
Faster R-CNN0.8990.8270.860108.959.8
SSD0.8770.8070.84090.665.3
Table 5. Ablation study results of YOLOv8 variants across key performance metrics.
ModelPrecisionRecallF1-ScoreModel Size (MB)FPS
YOLOv80.8950.9230.9095.9576.6
YOLOv8-Slimneck0.8980.8880.90615.7580.6
YOLOv8-MCA0.8960.9320.92405.9677.2
YOLOv8-MPDIoU0.8950.9650.91895.9578.3
Disclaimer/Publisher’s Note: The statements, opinions and data contained in all publications are solely those of the individual author(s) and contributor(s) and not of MDPI and/or the editor(s). MDPI and/or the editor(s) disclaim responsibility for any injury to people or property resulting from any ideas, methods, instructions or products referred to in the content.