Review

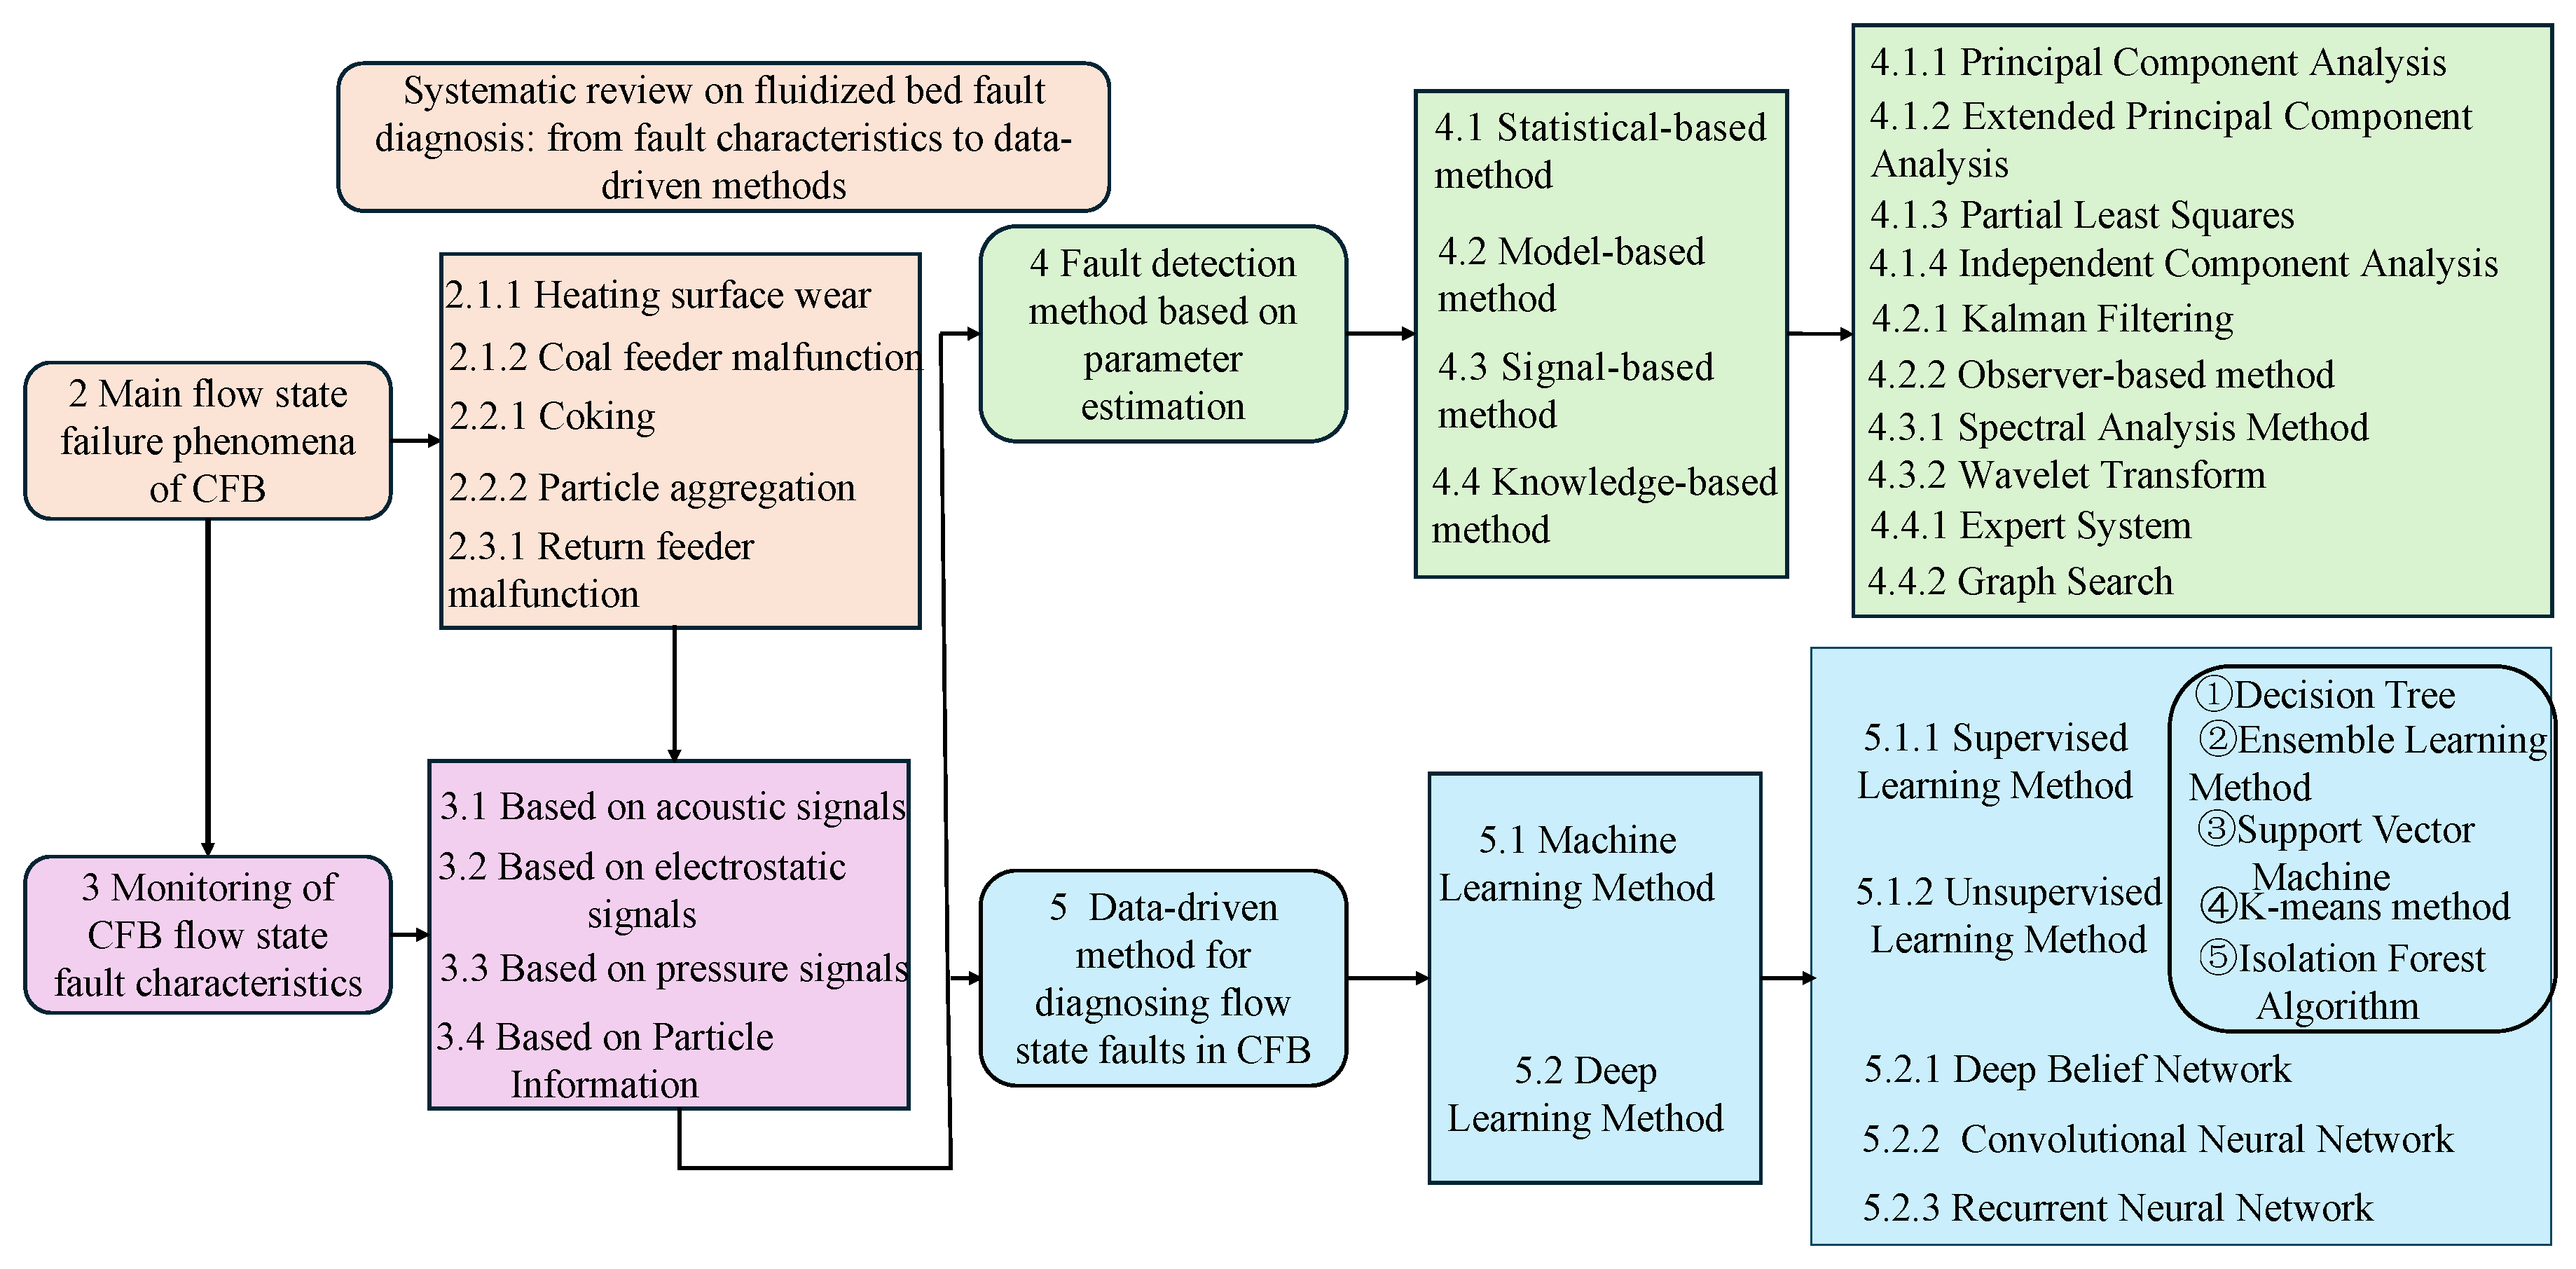
Systematic Review on Fluidized Bed Fault Diagnosis: From Fault Characteristics to Data-Driven Methods

1
School of Advanced Interdisciplinary Studies, Hunan University of Technology and Business, Changsha 410205, China
2
Xiangjiang Laboratory, Changsha 410205, China
3
Sand Hazards & Opportunities for Resilience, Energy & Sustainability (SHORES), New York University Abu Dhabi, Abu Dhabi 129188, United Arab Emirates
*
Authors to whom correspondence should be addressed.
Electronics 2025, 14(15), 3043; https://doi.org/10.3390/electronics14153043
Submission received: 27 June 2025 / Revised: 29 July 2025 / Accepted: 29 July 2025 / Published: 30 July 2025
(This article belongs to the Special Issue Digital Intelligence Technology and Applications)

Abstract

In recent times, circulating fluidized beds have become increasingly important in various industries, such as in the metallurgy, pharmaceuticals, and food-processing industries, due to their excellent fuel adaptability and environmental friendliness. Therefore, how to diagnose fluidized bed flow faults more efficiently and handle them earlier are important issues that cannot be ignored. This article starts with an introduction to fluidized beds and their common fault phenomena, and then integrates the research of scholars on fluidized bed characteristic-monitoring methods and fault diagnosis methods in recent years and summarizes the shortcomings of each method. Subsequently, a summary and induction of data-driven fault diagnosis methods for circulating fluidized beds are conducted, and the applicability, advantages, and disadvantages of each method are pointed out. Finally, this article presents some of the main challenges currently faced and suggests several possible future development directions.

1. Introduction

As the core technology of coal utilization technology, the circulating fluidized bed (CFB) enables the efficient and clean utilization of coal. In this process, solid coal is converted into combustible gas. The CFB is a fluidized bed in which gas and solid particles are separated, and the solid particles are recirculated within the system. The unique features of the CFB, including its fuel adaptability, high efficiency, and low environmental impact, have led to its extensive use in a variety of sectors such as chemical engineering, metallurgy, energy, and environmental protection [1]. Figure 1 shows the principle of the CFB.
One of the key characteristics of the CFB is the movement of many solid coal particles along a designated circulation loop. However, the inherent complexity and unstable environment of CFB systems pose significant challenges in maintaining stable particle circulation, which is crucial for system performance. Flow regime failures in particle circulation can occur easily, leading to catastrophic consequences such as system breakdowns, economic losses, or even safety risks [2]. Therefore, monitoring the CFB particle circulation process and diagnosing early-stage failures are crucial for ensuring long-term stable operation and improving production efficiency [3]. To guarantee the stable operation of the CFB particle circulation process, the first step is to deeply understand and analyze the potential types of faults and their flow mechanisms during CFB operation. The main contributions of this paper regarding the failure mechanisms and fault diagnosis methods of CFB are as follows:
(1) A comprehensive summary of CFB failure types, including an overview of CFB operating principles and an analysis of various failure causes and their impacts.
(2) A detailed review of statistic-based fault diagnosis methods, evaluating the advantages and limitations of different approaches employed in CFB systems.
(3) A discussion of the latest developments in data-driven fault diagnosis techniques, including a systematic examination of the methods, their strengths, and their limitations.
(4) An exploration of the methods for collecting CFB-related datasets, which are critical for developing and refining accurate fault prediction models.
(5) An analysis of the key challenges in diagnosing CFB flow faults, such as the acquisition of high-quality data and the interpretability of fault detection models, along with potential future research directions.
The research structure of this paper on circulating fluidized beds is illustrated in Figure 2.

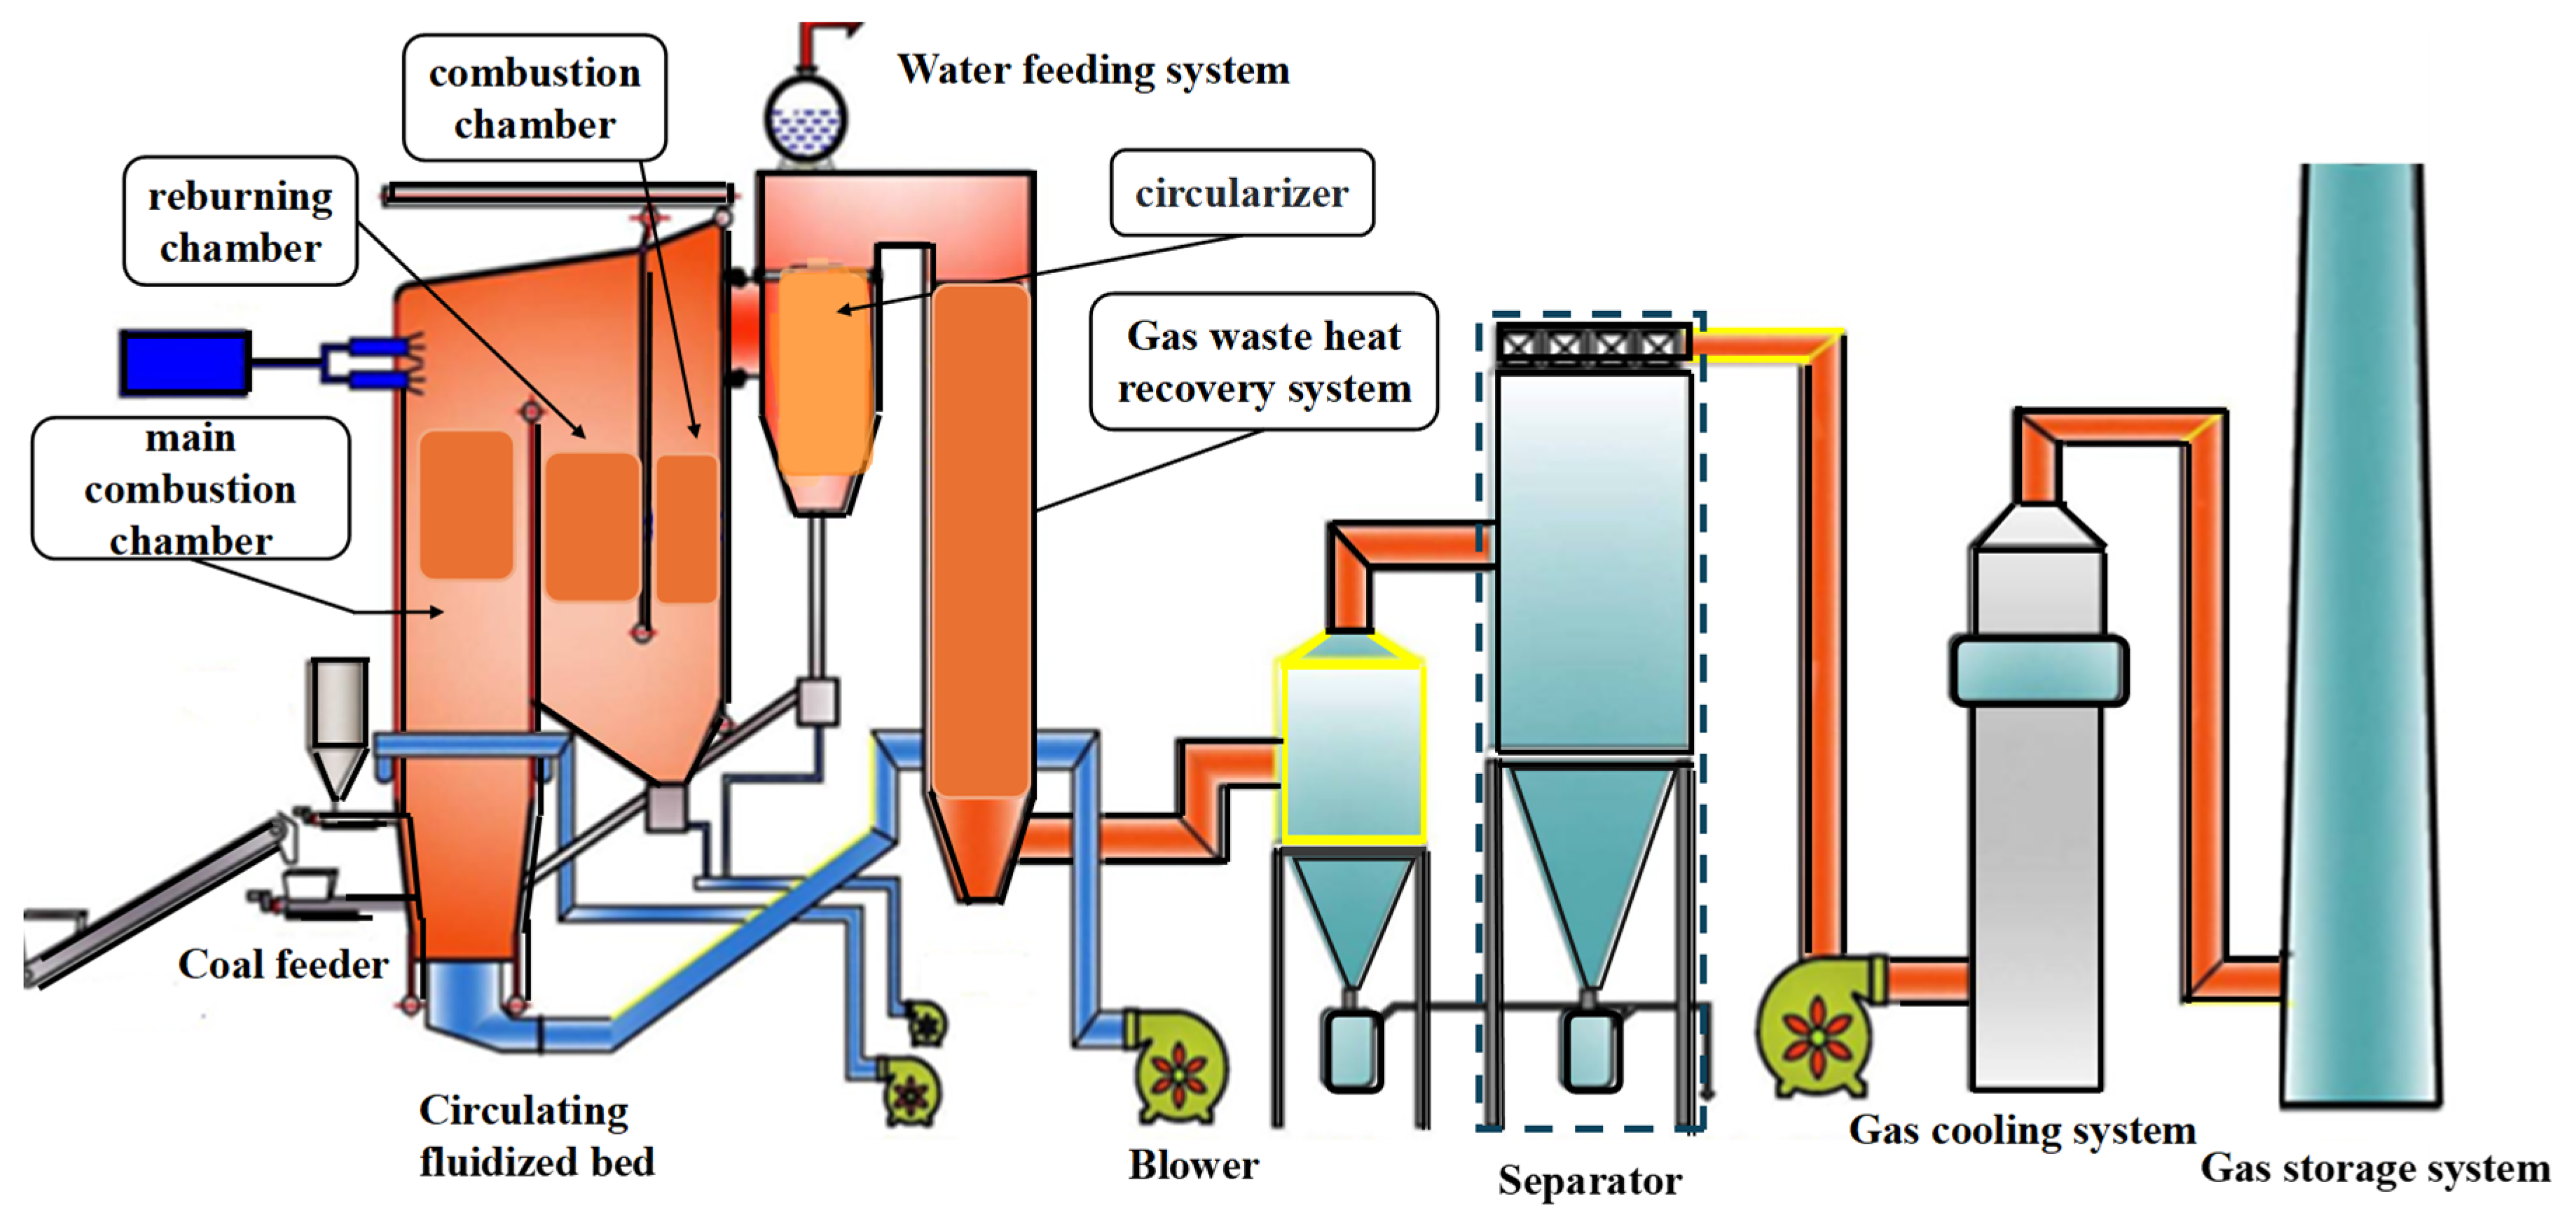
2. Main Flow State Failure Phenomena of CFB

CFB systems are widely used in the energy, chemical, and other fields due to their advantages of efficient combustion, low pollution emissions, and wide fuel adaptability. However, due to the strong nonlinearity and multi-scale coupling characteristics of its internal gas–solid two-phase flow, as well as the operating environment of high temperature, high pressure, and high wear, CFB is prone to various failures during long-term operation, seriously affecting the stability, safety, and economy of the system. These faults include both deterministic faults with clear physical characteristics (such as heating surface wear, mechanical structure damage), as well as stochastic faults that require statistical analysis of process parameters (such as particle agglomeration, progressive coking), and even composite faults involving a mixture of the two (such as blockage of the return feeder). The characteristic differences between faults are shown in the following Table 1.
There are significant differences in the occurrence mechanism, evolution law, and detection methods of different types of faults. Therefore, it is crucial to have a deep understanding of the characteristics of typical CFB faults and select appropriate diagnostic strategies accordingly to achieve early warning and optimize operation and maintenance.

2.1. Deterministic Faults

Deterministic faults usually have clear and observable physical characteristics or mechanical damage, and their occurrence is often directly related to material wear, structural failure, or operating parameter exceeding limits. For example, wear on the heating surface and mechanical failures in the coal feeding system are typical deterministic faults, and their development process usually follows deterministic laws.

2.1.1. Heating Surface Wear

In the CFB, the movement and collision of fuel particles and their friction with the heating surface can cause varying degrees of wear on the heating surface. Wear of the heating surface includes the wear of the convective heating surface, the wear of the return device, the wear of the water-cooled wall tubes and the wear of the separator-heating surface, whereby the wear of the water-cooled wall tubes occurs most frequently. Due to the combustion process in the CFB, the gas and solid particles in the central area rise with the airflow and gradually accumulate on the wall after being subjected to the high-speed fluidization wind in the central region. The solid particles in the surrounding four wall areas flow in the opposite direction along the inner wall of the furnace, forming a core flow model, which leads to wall wear [4]. If the water-cooled wall tube is worn, this leads to a certain temperature loss in this area and impairs the combustion efficiency of the material. Severe wear may even cause blockage of the CFB or other fluidization faults, resulting in CFB shutdown [5]. Zhao et al. [6] pointed out that the wear of the water-cooled wall tubes can affect the particle concentration, flow velocity, and fuel gas composition in the bed. This, in turn, affects the flow condition of the CFB. In addition, the wear of the heating surface reduces its surface area, which reduces the thermal conductivity and heat output. This affects the thermal energy utilization of the entire system.

2.1.2. Coal Feeder Malfunction

The coal feeder is a vital equipment in CFB boilers. It can transport coal materials evenly and continuously into the furnace, ensure a stable fuel supply and support the combustion process of the fluidized bed. Failures in coal feeding include coal blockage, coal transportation, air and powder leakage, etc. [7].
(1) Coal blockage faults: The moisture content of coal is an essential factor affecting coal blockage faults. If the moisture content of the coal entering the furnace is too high, the viscosity of the coal will increase, making the coal material easier to clump and block in the coal bin. In addition, during the operation of CFB boilers, due to design, operation, or environmental factors, coal blockage can easily occur in the coal feeding system, which not only affects the regular operation of the boiler, but may also pose a threat to safety and stability [8].
(2) Transportation faults: The main reason for the transportation failure of the coal feeder is the poor transportation of coal materials. If the moisture content of coal is too high, or the particle size is too large, it will cause blockage of the conveying pipeline due to increased transportation difficulty. In addition, abnormal equipment operation, such as screw or belt wear, drive system failure, and uneven coal dropping from the coal bin can also affect the stability of the conveying process, leading to transportation failures.
(3) Air and powder leakage faults: The main reason for air and powder leakage in coal feeders is poor sealing performance. If the sealing device ages or is improperly installed, it can cause airflow leakage, which will carry coal powder out of the equipment. In addition, long-term operation of equipment operation leading to wear and tear of pipelines or shells, as well as factors such as excessive system operating pressure, can also exacerbate air and powder leakage problems.
In addition to coking faults, heating surface wear, particle agglomeration faults, coal feeding system faults, and feeder blockage faults, CFB also includes several other types of faults. Some of these faults include fan faults, furnace explosions, boiler water supply machines, steam and water pipeline damage, a sudden reduction in electrical load, high or low bed temperature, high or low bed pressure, cooler faults, and secondary combustion in the tail flue.

2.2. Statistical Faults

Statistical faults typically arise from complex interactions among multiple variables, demonstrating significant uncertainty in both occurrence and progression that cannot be reliably predicted using deterministic models alone. For instance, the development of faults like catalyst deactivation or bed material segregation depends on stochastic variations in operational parameters and particle properties, manifesting inherent probabilistic characteristics.

2.2.1. Coking

Coking usually forms in localized areas within the bed, which leads to poor local fluidization or unstable flow conditions. Coking in CFB boilers is mainly divided into three types: low-temperature coking, high-temperature coking, and progressive coking [9].
Low-temperature coking: The coking phenomenon caused by local overheating when the temperature during CFB operation is lower than the deformation temperature of the ash is called low-temperature coking. It often occurs during equipment startup and ignition.
High-temperature coking refers to the phenomenon of coking caused by a significant increase in bed temperature during the operation of a fluidized bed, due to factors such as high carbon content and delayed heat dissipation. This phenomenon occurs when the bed temperature exceeds the melting point of the ash residue.
Progressive coking: Progressive coking is more difficult to detect compared to the first two types, but it is more common. It is usually caused by the addition of too-large coal particles or poor quality of the air distribution system during CFB operation.
Generally, the normal fluidization process of the CFB is disturbed by coking, resulting in a local temperature rise and uncontrolled bed temperature. This further exacerbates equipment wear and damage to the heating surface. For enterprises, coking problems increase operating and maintenance costs and may cause downtime, affect production continuity and economic benefits, and even lead to safety hazards [10].

2.2.2. Particle Aggregation

Particle agglomeration refers to the phenomenon of particles agglomerating into larger particle clusters during CFB operation due to the interaction between the particles. This phenomenon can lead to blockage of the local CFB, thereby affecting the overall stability of the CFB. Qi et al. [11] pointed out that viscous forces can cause the particles to agglomerate more easily during fluidization, thereby affecting normal fluidization. Zhou et al. [12] investigated the forms of agglomerates in the CFB and found that macroscopic agglomerates are deposited at the bottom of the bed, while small agglomerates and free particles are evenly distributed in the CFB. These studies suggest that particle clusters can alter the distribution and flow characteristics of particles in the bed, which affects the overall performance of the CFB. In addition, the size and distribution of bubbles can also affect the formation and stability of particle aggregation. For example, larger bubbles can carry more particles, enhance the contact and aggregation between particles, and thus accelerate the generation of aggregates. Some studies have indicated that particle agglomeration can cause changes in the fluid dynamics characteristics inside the CFB, such as changes in bed expansion ratio and axial velocity distribution. These changes may intensify the frequency of collision between particles and thus promote the formation of larger particle aggregates [13]. As the agglomeration phenomenon becomes increasingly strong, the size of the agglomerates in the CFB will also gradually increase. At this point, they not only affect the efficiency of particle movement in the CFB, but also cause flow faults such as channeling, collapse, and blockage in the CFB, ultimately leading to the shutdown of the CFB.

2.3. Composite Faults

Composite faults have both deterministic and stochastic characteristics, and their diagnosis requires a combination of physical mechanism analysis and data statistical methods. This type of malfunction includes both observable physical anomalies (such as pressure drop caused by blockage of the return feeder) and random factors that are difficult to directly quantify (such as uneven material flow).

Return Feeder Malfunction

The return feed plays a crucial role in CFB boilers. It can transport the high-temperature materials separated by the separator back into the furnace and thus maintain a stable bed temperature and a fluidized state of the materials. By adjusting the return feeder, the circulation of materials can be controlled, which changes the concentration distribution of materials in the furnace, significantly affecting the combustion rate, heat transfer efficiency and desulfurization performance. The faults of the return feeder mainly include overheating of the combustion chamber [14], system air leakage [15], blockage of the air cap [16], and detachment of the casting material [17].
(1) Overheating of the combustion chamber: The overheating of the combustion chamber is mainly caused by insufficient material circulation in the return feeder, low return gas velocity, or uneven fuel distribution, which may cause high-temperature materials to fail to return to the furnace in time for cooling or excessive concentration of local combustion. In addition, excessive ash discharge can reduce the bed material, lower the heat capacity, and make it difficult to absorb the heat generated by combustion. Abnormal cooling systems can also exacerbate poor heat dissipation and lead to overheating problems.
(2) System air leakage: The air leakage in the return feeder system is mainly caused by poor sealing performance, loose connections, or pipeline wear. Air leakage can disrupt the pressure balance within the return feeder, resulting in poor material return or reduced return volume. At the same time, the introduced cold air can lower the furnace temperature, which affects combustion efficiency and system stability. If the air leakage is serious, it may also exacerbate material wear and system heat loss.
(3) Blockage of the air cap: The accumulation of granular materials, ash or impurities usually causes the blockage of the return feeder air cap. This leads to an uneven distribution of the airflow, a decrease in the velocity of the return gas, and an obstruction of material reflux, which impairs the material circulation and the fluidization effect in the furnace. In severe cases, it may also cause material return interruption or localized overheating problems, which will affect the combustion and heat transfer efficiency of the boiler.
(4) Detachment of the casting material: If a CFB boiler is improperly controlled or the system is operated for long time, the casting material at the inlet of the cyclone separator and return feeder may fall off and deposit at the bottom of the return feeder. This can cover the air cap and further affect the material fluidization process. A small number of small particles falling off has a minor impact, but a large amount of falling cast material can cause poor fluidization, disturb the balance of return materials, trigger intermittent return materials, affect the stable operation of the boiler, and even cause blockage and coking of the return material feeder in severe cases [17].
Various faults in CFB can disrupt particle flow patterns, reduce heat and mass transfer efficiency and energy utilization, accelerate wear and coking, shorten equipment lifespan, and increase operating costs. Early detection of fault can help to ensure that the faults are rectified earlier. This is significant to maintain the efficiency of CFB, save energy, reduce consumption and improve enterprise profitability. However, due to the diverse faults and complex internal environment of CFB, early features are often hidden and difficult to detect. Thus, fault detection of CFB still imposes significant challenges.

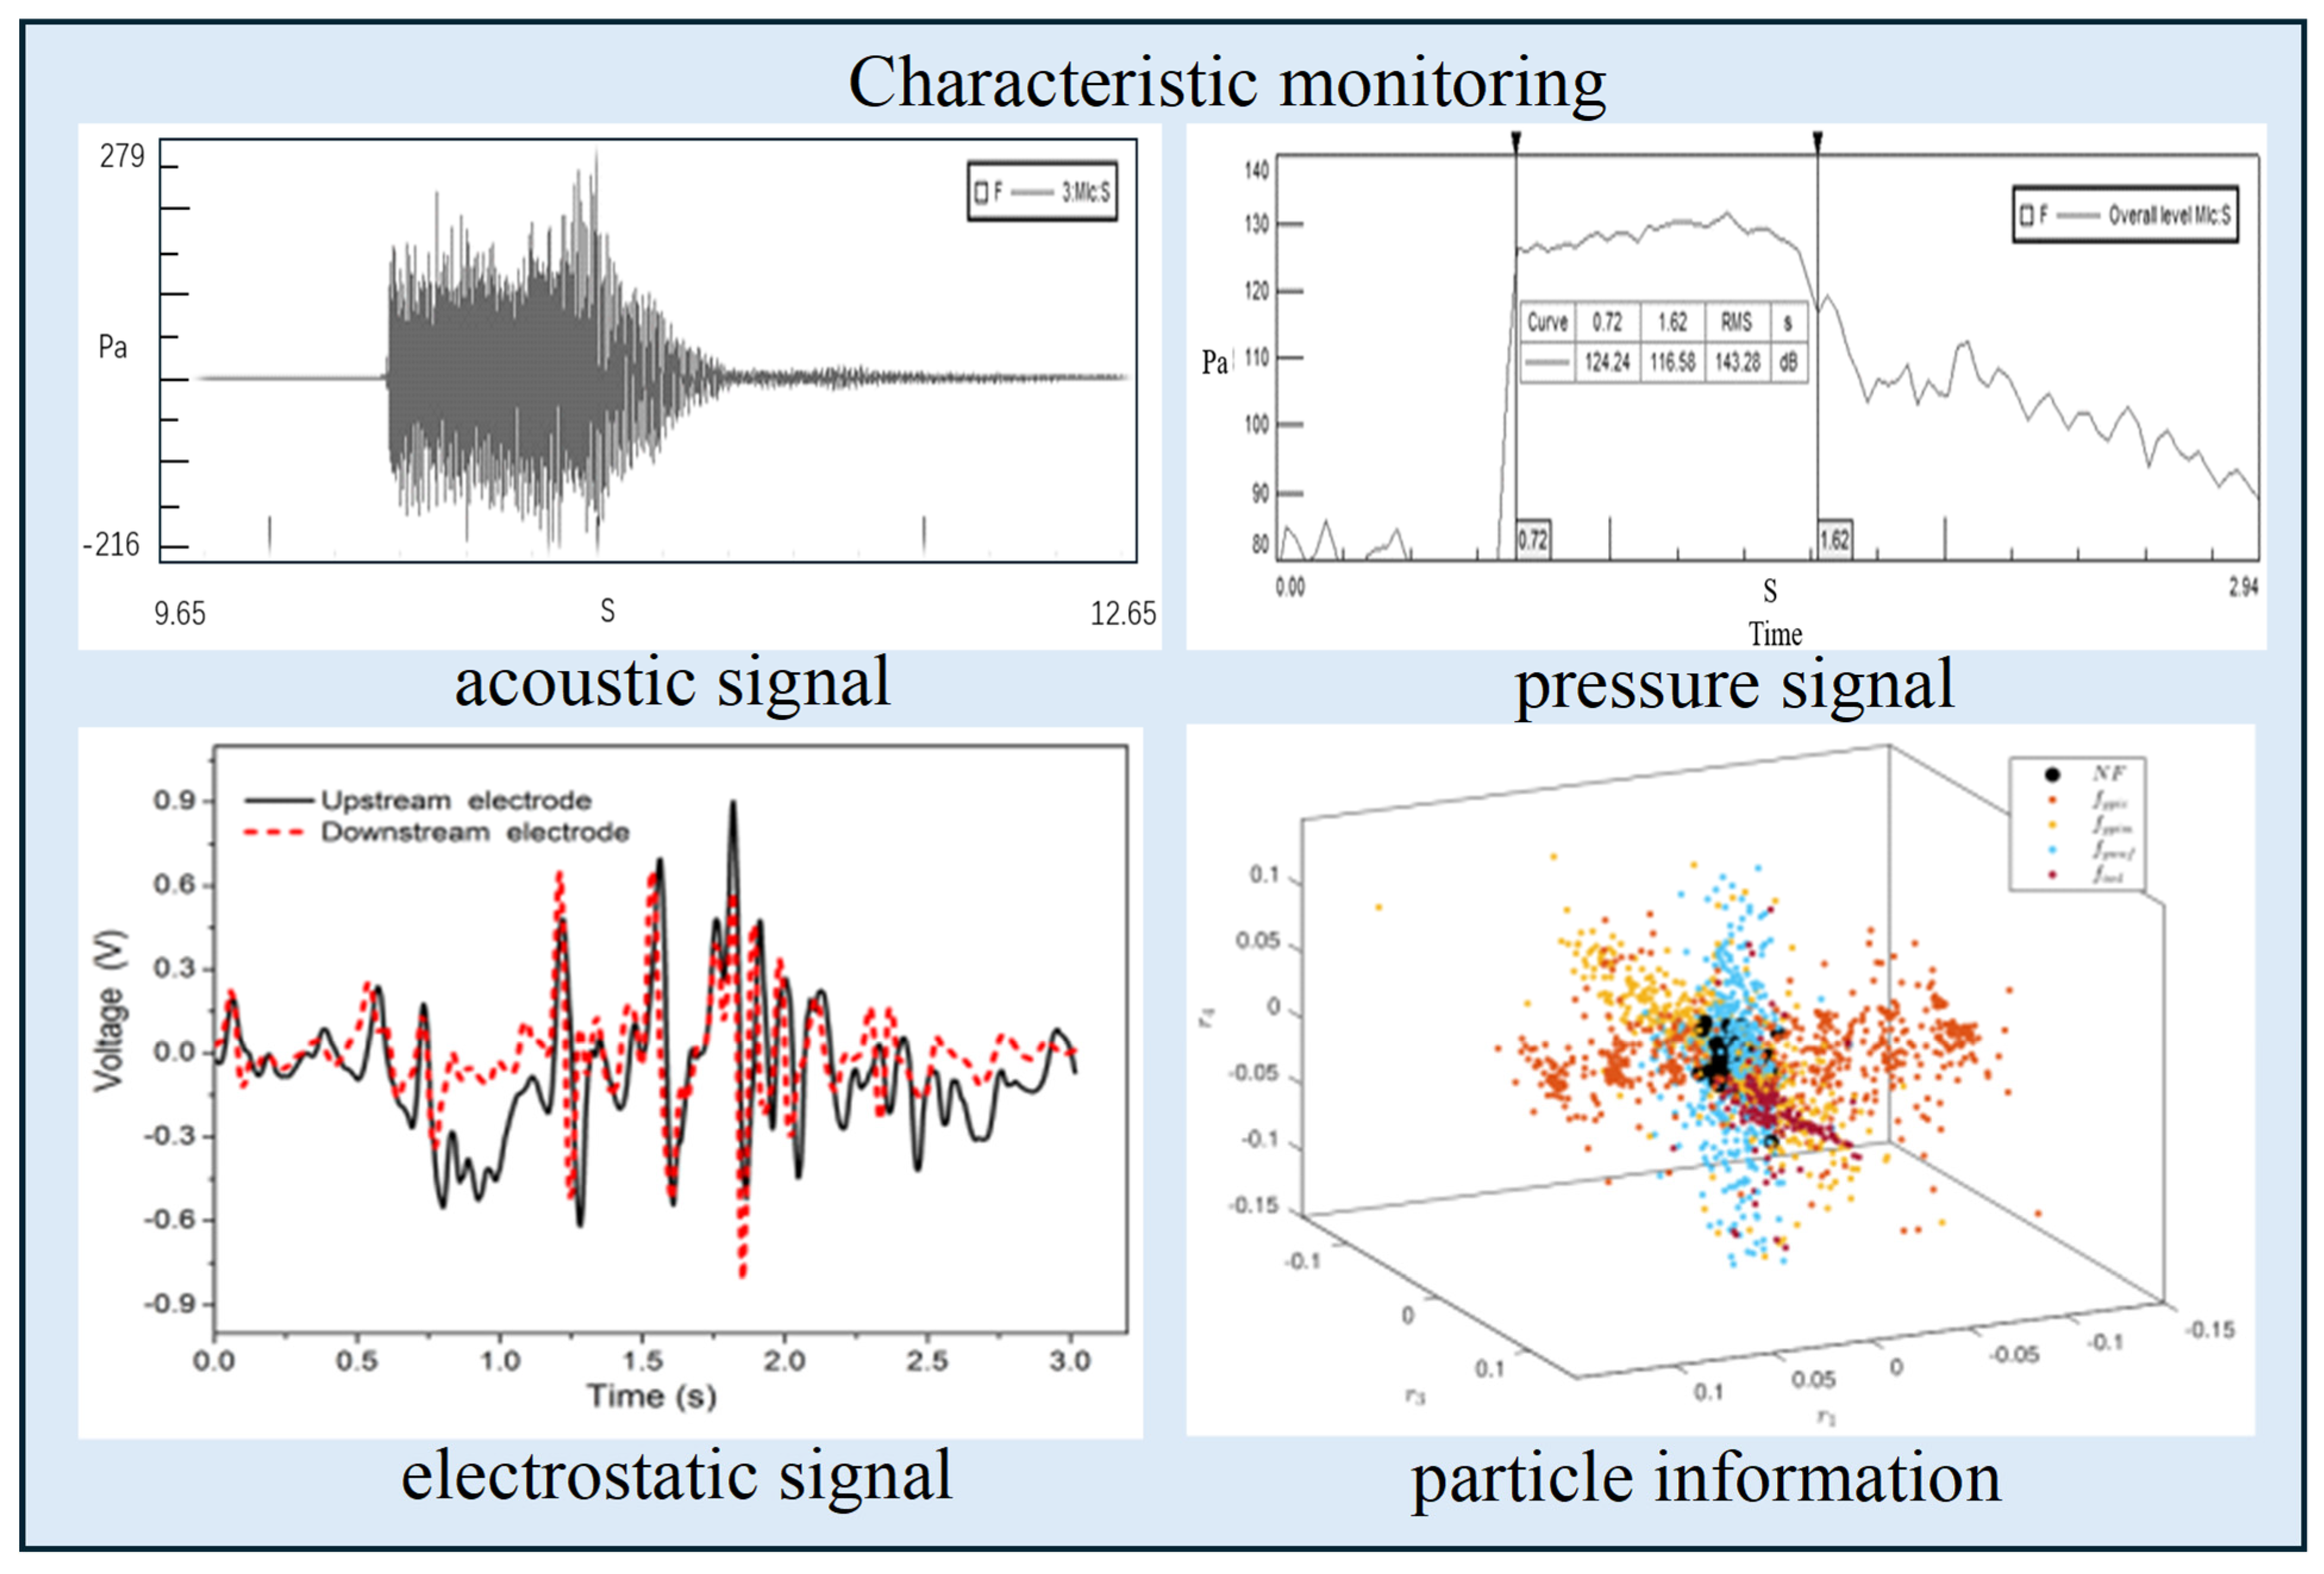
3. Monitoring of CFB Flow State Fault Characteristics

The classification system of fluidized bed fault diagnosis methods proposed in this article is based on the core principles and implementation paths of the methods, systematically dividing existing methods into two fundamental paradigms: parameter-estimation-based methods that rely on physical/statistical models and expert knowledge, and data-driven methods that utilize algorithms to learn patterns from operational data. This dichotomy reflects their distinct knowledge foundations—while parameter estimation methods (further subdivided into statistic-based, model-based, signal-based, and knowledge-based approaches) derive diagnostic logic from first principles and domain expertise, data-driven methods (encompassing both traditional machine learning and deep learning) extract diagnostic rules directly from system behavior data. The classification standard deliberately spans three orthogonal dimensions: (1) dependence on prior knowledge (from complete physical model reliance to purely data-driven), (2) temporal characteristics of detectable faults (from slow-evolving to transient), and (3) implementation complexity (from laboratory-grade to field-deployable). This multidimensional framework not only preserves the methodological distinctions emphasized in the existing literature, but also provides operators with clear guidance for selecting approaches matching their specific fault detection latency requirements and available infrastructure.
CFB is a typical gas–solid reaction system, in which the fluidized state of the particles in the bed exhibits multi-scale inter-phase coupling such as microscale, mesoscale, and macroscale, as well as physical nonlinear coupling. Due to the superposition of time and space, as well as the complex interrelationships between the signals representing a mixed state, it is difficult to accurately characterize the fault information, which affects the accuracy and efficiency of fault diagnosis. The macroscopic fault characteristics are mainly manifested as macroscopic particle flow anomalies caused by many particle pulsations. The main characteristic of mesoscale faults is that due to the interactions and high-speed impacts between particles and the wall, particles reunite and cause local particle flow anomalies. The main characteristic of microscale faults is the high-speed collision between many particles dispersed in the bed, which results in abnormal flow of single particles caused by high-temperature friction. As established in Section 2, different fault types exhibit distinct characteristics. This necessitates targeted monitoring techniques, which we systematically categorize based on their sensing modalities: acoustic, electrostatic, pressure, and particle-level measurements. The summary diagram of CFN fault characteristic monitoring is shown in Figure 3. The resulting multi-source signals serve as the primary input for both the parameter estimation (Section 4) and data-driven (Section 5) fault diagnosis frameworks discussed later.

3.1. Fault Monitoring Based on Acoustic Signals

Regarding acoustic signals, faults are mainly monitored by measuring the acoustic signals of the inner and outer walls of CFB. The principle is to measure the acoustic wave signal based on acoustic emission measurement technology, analyze the acoustic wave signal using a fast Fourier transform, and then establish a measurement model for the main frequency of the acoustic wave. This can then be used to establish a quantitative relationship between the main frequency of the acoustic wave and the particle size. Several studies [18,19] have achieved monitoring of coking faults in CFB layers through the use of acoustic measurement technology. It was found that the main frequency of the acoustic signal decreases when polymer particles agglomerate in the CFB. From this, it can be determined whether particle agglomeration has occurred in the CFB. However, the experiment also showed that the method for monitoring defects in CFB with acoustic signals has poor directionality and a large divergence angle. Due to the tendency of acoustic wave signals to diverge, energy dissipation is severe, which makes it challenging to detect the signal and leads to low resolution and easy misjudgment of faults.

3.2. Fault Monitoring Based on Electrostatic Signal

Regarding electrostatic signals, faults are mainly monitored by installing metal probes in the CFB to measure the electrostatic current inside the CFB. Qi et al. [20] used electrostatic measurements to characterize particle motion in CFB fluidization and investigated the size, shape, rising velocity, and generation frequency of bubbles in a two-dimensional CFB by imaging using a two-dimensional electrostatic sensor array to monitor changes in gas–solid fluidization in the CFB. Yan et al. [21] used electrostatic measurements to monitor the agglomeration phenomenon in the CFB and compared the electrostatic currents of the CFB under normal operating conditions and the CFB under fault conditions. From the study, it was found that the electrostatic currents would change significantly when the CFB malfunctioned. However, the CFB fault-monitoring method by electrostatic measurement requires the insertion of a metal probe into the reactor, which can easily lead to disturbance of the internal flow state in practical industrial devices. It is also difficult in many existing industrial devices because of holes to be drilled in the wall.

3.3. Fault Monitoring Based on Pressure Signals

The pressure signal is mainly monitored for faults by measuring the fluctuation signal of the pressure inside the CFB. Pressure signals can be calculated by conventional instruments, which are easy to operate and can dynamically reflect the fluidization state inside the entire bed, making them widely used. Zhang et al. [22] used pressure fluctuations to characterize coking faults inside CFB and analyzed the signals using statistical averaging, standard deviation, wavelet analysis, and homogeneity index methods. It was detected that blockage of the return channel would cause frequent pressure fluctuations. Gao et al. [23] owed significant fluctuations in the pressure signal inside the bed by changing the different inlet angles of CFB. Jiang et al. [24] used a data-driven model to monitor the production efficiency and expected efficiency of the CFB and believed that changes in the structure of CFB equipment alter the flow and internal pressure signals of the main particles in the bed. Meanwhile, Widuch et al. [25] diagnosed faults such as internal coking in the CFB due to frequent fluctuations in the internal pressure difference. Internal coking in the CFB resulted in particle accumulation, slowed flow rate, and intermittent particle return.
The pressure signal can provide comprehensive feedback on the characteristics of the gas flow state changes in the bed, such as the geometric structure of the bed and control parameters. Compared with other methods, it has obvious advantages and is widely used. However, if the pressure signal has abnormalities, the fault has often already occurred and is not suitable for early fault diagnosis.

3.4. Fault Monitoring Based on Particle Information

The direct characterization of particle size in CFB is highly sensitive to the occurrence of early failures in time or space. Research has shown that particle information in CFB beds is a good “early warning indicator” of changes in the gas–solid flow state of the CFB [25].
Ma et al. [26] established a microscale particle model based on the Reynolds number of particles and the concentrations of dense and dilute phases. The new model effectively captures the changes in particle concentration at different sphere diameters and is an essential basis for characterization of fault characteristics. Kong et al. [27] analyzed the fault signals inside the CFB riser and pointed out that the dynamic behavior of particle agglomeration generates pressure fluctuations, which are early signs of failure. Xia et al. [28] pointed out that particle agglomeration affects the overall distribution and motion state of particles in the bed, which, in turn, affects the fluidization state and internal pressure fluctuations of particles. Large agglomerates are easily formed near the edge of the wall, and the local particle positions are apparent. Lu et al. [29] analyzed the gas–solid two-phase particle flow in CFB based on actual fault types and concluded that the dynamic behavior of gas–solid multi-scale structures is closely related to early faults.
However, there are currently few applications of particle information in monitoring the characteristics of CFB flow faults. On the one hand, the measurement methods are limited; and on the other hand, there is a lack of a theoretical system. It is a challenge to make reasonable predictions for various problems encountered in applications that rely primarily on the accumulation of past experience and have a certain degree of blindness.
It should be noted that Section 3 focuses on the physical perception and primary feature extraction of multi-source signals (sound waves, static electricity, pressure, etc.), providing input data foundation for subsequent diagnostic methods; Section 4 (Parameter Estimation Methods) and Section 5 (Data-Driven Methods), respectively, conduct high-order analysis and decision-making on the features extracted in Section 3 from the perspectives of mechanism modeling and statistical learning.

4. Fault Detection Method Based on Parameter Estimation

Building upon the fault signatures identified through monitoring techniques (Section 3), traditional diagnostic approaches can be classified into four paradigms—statistic-based, model-based, signal-based, and knowledge-based. Each paradigm interprets the multi-source measurements (acoustic, electrostatic, pressure and particle-level signals) at a different level of abstraction: statistical methods extract correlation structures, model-based methods compare against first-principal predictions, signal-based methods leverage time–frequency features, and knowledge-based methods encode expert rules. This taxonomy not only aligns with the sensing modalities of Section 3 but also sets the stage for the data-driven methodologies discussed in Section 5.

4.1. Statistic-Based Method

Statistical methods usually require a large amount of historical data to calculate statistical indicators, then characterize data features through unsupervised multivariate statistical analysis, and finally compare with thresholds to analyze and diagnose results [30]. The specific process of using statistical methods for fault diagnosis is shown in Figure 4.
Common statistical methods for fault diagnosis include principal component analysis (PCA), augmented principal component analysis, partial least squares (PLS), independent component analysis (ICA), etc.

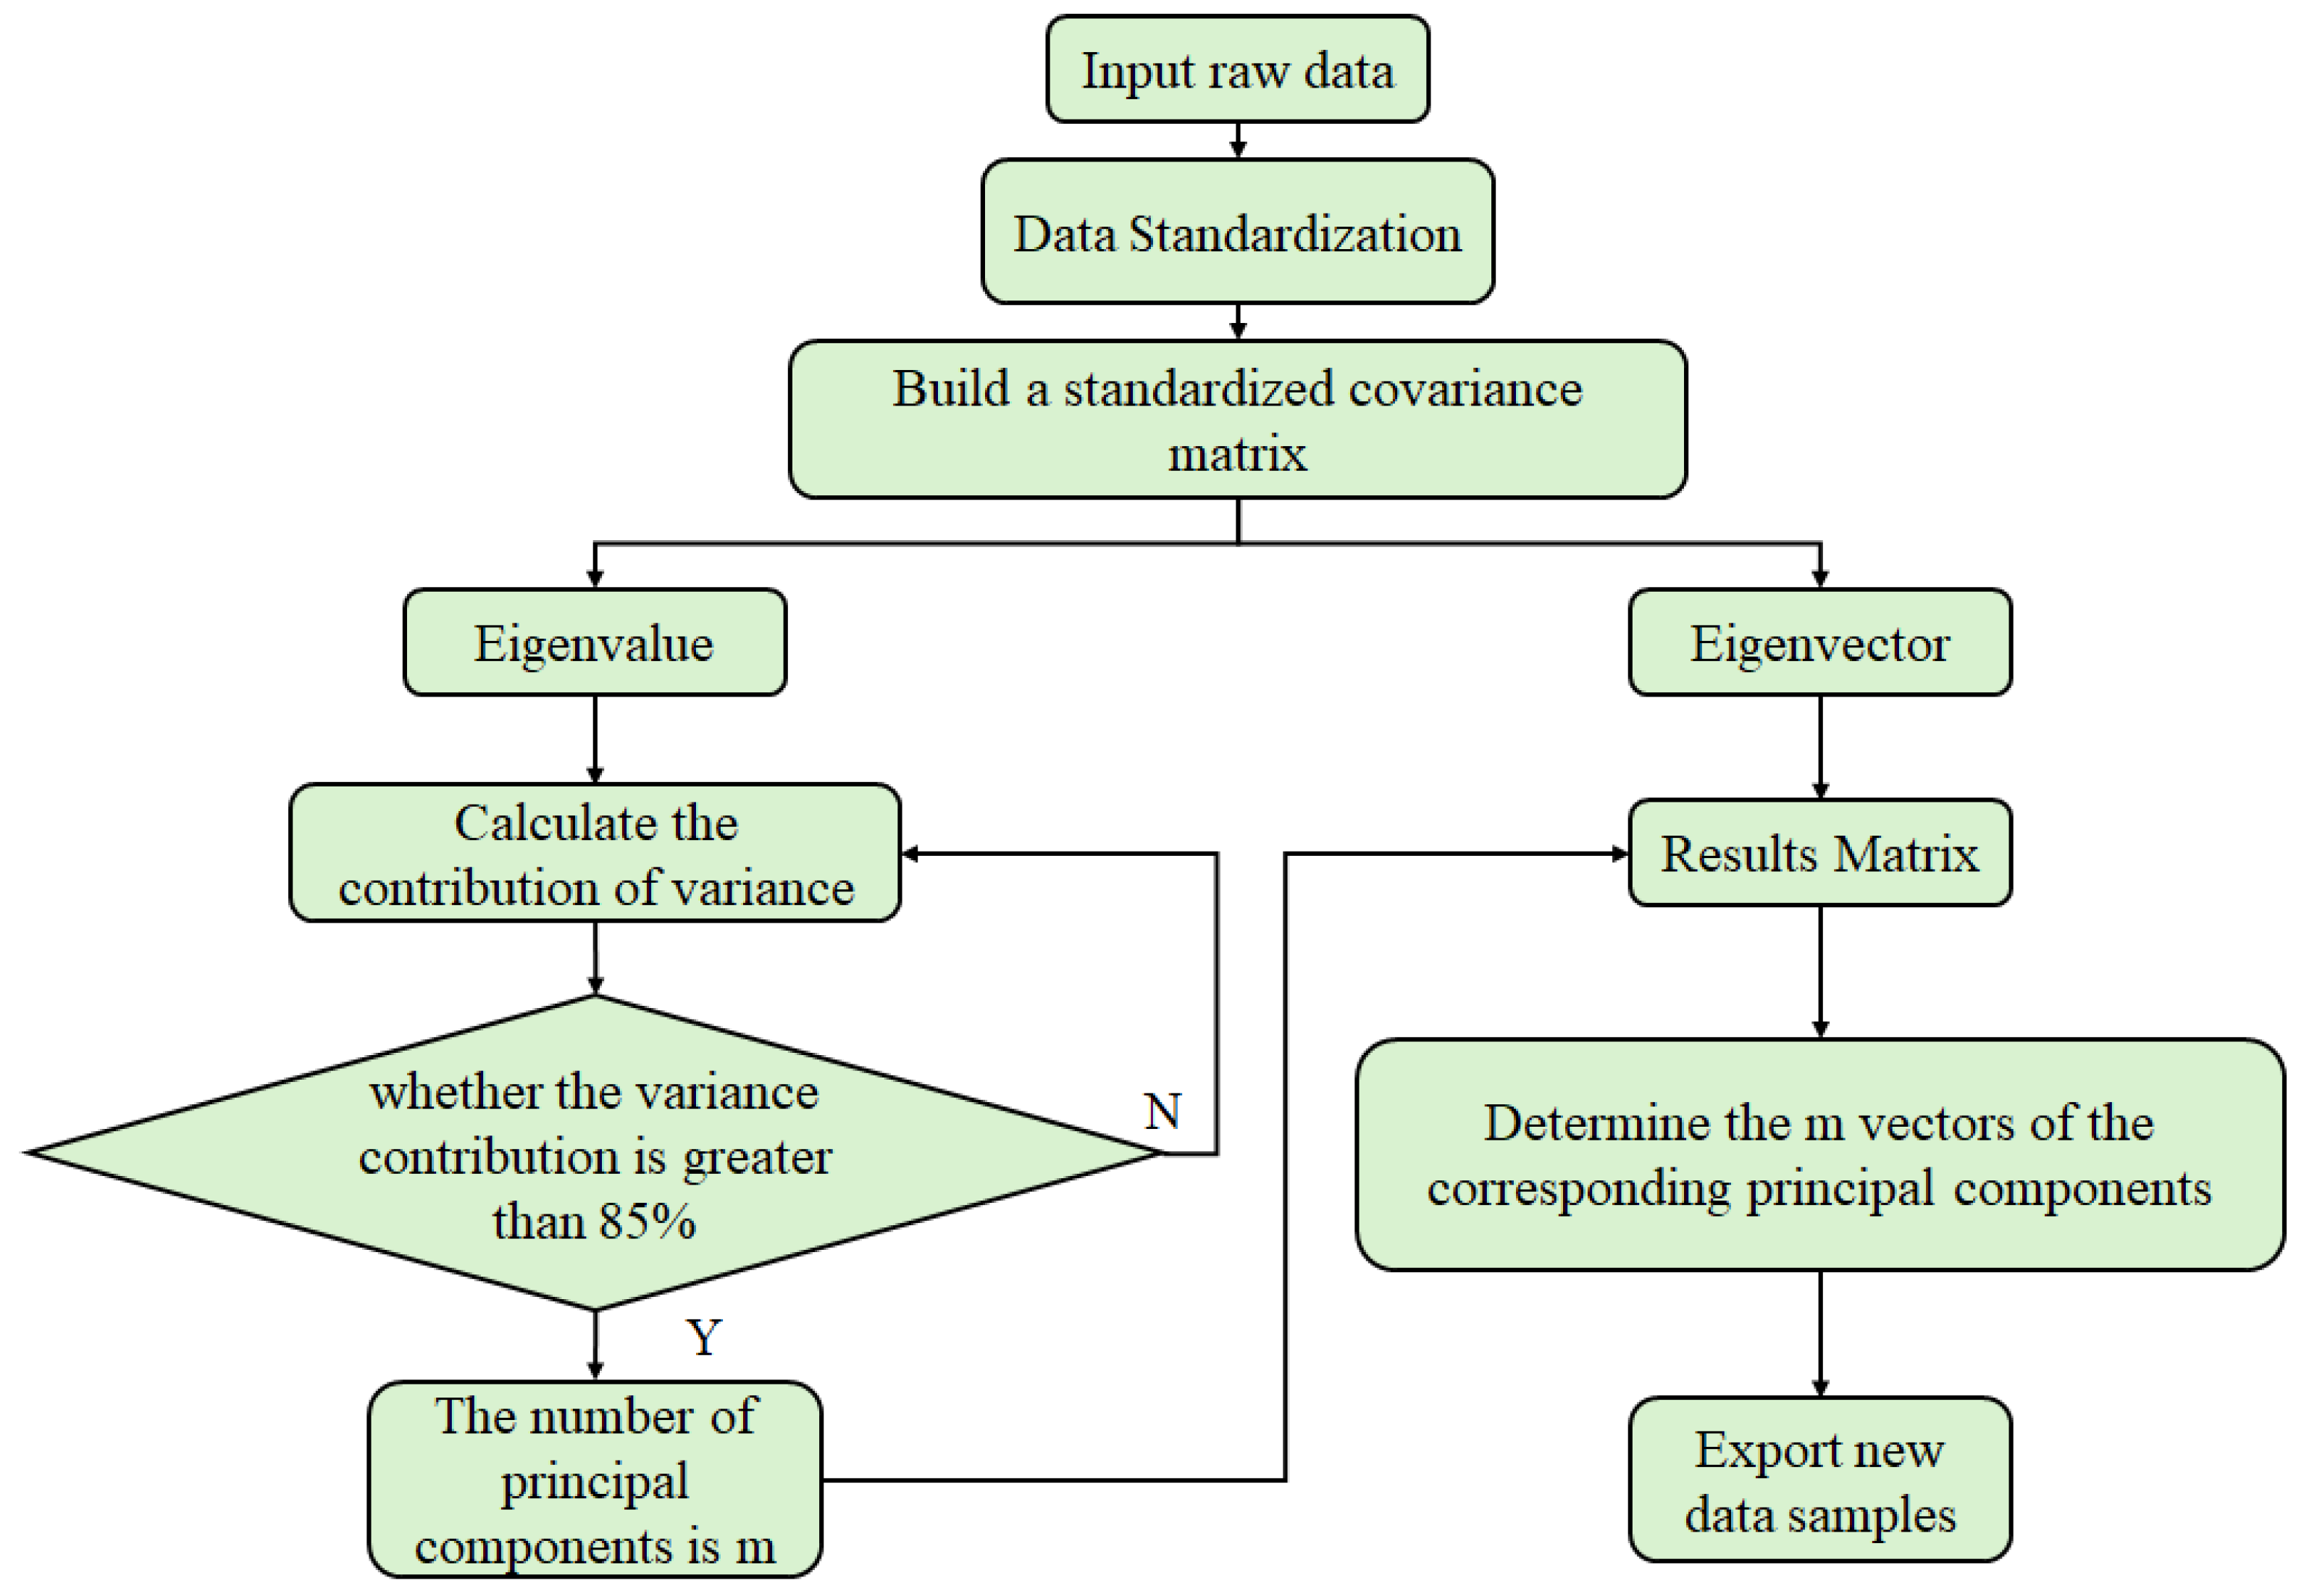
4.1.1. Principal Component Analysis

The principle of principal component analysis (PCA) is to project high-dimensional data onto a low-dimensional space and use the cumulative contribution rate to determine the number of orthogonal bases selected. While preserving the main part of the data as much as possible, the original data is projected onto orthogonal bases to obtain new features of the data [31]. The core calculation formula can be expressed as follows:
T = X P
Among them, X is the original data matrix, P is the eigenvector matrix, and T is the principal component score matrix [32]. The principle is shown in Figure 5.
PCA, as one of the main statistical methods, is widely used in the field of fault diagnosis. In the field of fluidized bed fault diagnosis, PCA can extract key features of multi-sensor data in fluidized beds through dimensionality reduction and combine statistical measures to achieve fault diagnosis and localization. Zhang et al. [33] used the PCA method to process data and determine key input variables for modeling. The comparison showed that the accuracy of fault diagnosis was improved in the model with PCA participation, which can reflect the actual operation of nonlinear systems. Fan [34] further strengthened the data-processing capability of PCA by improving mutual information and combining with principal component analysis, and proposed a new feature extraction method, MIPCA.
PCA has significant implications for linear and steady-state systems, especially under the statistical assumption that variables are independent and normally distributed with no autocorrelation in time. However, in actual dynamic systems, steady-state shifts are often caused by disturbances and the monitoring data may not meet these statistical requirements, such as autocorrelation or no normal distribution. These biases weaken the performance of traditional static PCA algorithms [35].

4.1.2. Extended Principal Component Analysis

The extended PCA method has become an effective solution for improving adaptability and stability of results. The extended PCA method is a general term for advanced methods proposed by studies based on PCA, such as Kernel Principal Component Analysis (KPCA), Dynamic Principal Component Analysis (DPCA), etc. Such methods can adapt to the nonlinear characteristics or dynamic changes in complex systems and improve the ability to detect and diagnose faults. These methods address the limitations of traditional PCA in processing high-dimensional, nonlinear, and time-varying data and meet a broader range of practical needs through various improvements.
(1) KPCA:
KPCA introduces kernel functions based on PCA to reduce the dimensionality of the input data and improve its ability to handle nonlinear data. Experiments have shown that compared to PCA, KPCA is better at removing noise from the raw data and significantly reducing computational complexity for fault detection in chemical processes [36]. Simmini et al. [37] also pointed out that the Gaussian kernel used in KPCA ensures good accuracy attributes while maintaining sufficient generalization properties through a self-adjusting process, making KPCA more effective at dealing with nonlinear phenomena than PCA.
(2) DPCA:
Based on PCA, DPCA also considers the influence of variables on the time series, making DPCA more sensitive to data correlation and more suitable for detecting faults with sequence correlation [38]. Guerfel et al. [39] used an innovative DPCA method to detect and identify specific faults during system operation. This method can generate a concise set of detection indicators that are specifically respond to faults in certain sequences and are insensitive to faults in other types of sequences. The experimental results show that the improved DPCA method is much more efficient at detecting faults in specific sequence than the PCA method.
Through application to practical cases, the improved DPCA and KPCA methods are much more efficient at identifying specific faults than the PCA method.
In the future, the development of PCA in fluidized bed fault diagnosis may focus on nonlinear extension (such as the combination of kernel KPCA and deep autoencoder), dynamic adaptive modeling (such as sliding window PCA and online learning fusion), and multimodal data fusion (such as combining heterogeneous signals such as sound waves and pressure) while enhancing interpretability (such as contribution graph optimization) to meet the real-time requirements of industrial scenarios.

4.1.3. Partial Least Squares

Partial least squares (PLS) is a linear statistical method that combines principal component analysis, correlation analysis, and multiple linear regression functions [40]. The core is to establish a correlation model between the independent variable X and the dependent variable Y through latent variables:
X = T P T + E Y = U Q T + F
where X is the predictor variable matrix; Y is the response variable matrix (dependent variable); T is the score matrix of X (latent variable); U is the score matrix (latent variable) of Y ; P is the load matrix of X ; Q is the load matrix of Y ; E is the residual matrix of X ; and F is the residual matrix of Y [41].
The PLS algorithm establishes a relationship model between the independent and dependent variables and then determines whether a fault has occurred based on the difference between the predicted and actual values of the model. Therefore, PLS mainly achieves early diagnosis of faults and analysis of key variable contributions by establishing latent variable relationship models between fluidized bed process variables and fault indicators.
The limitations of partial least squares regression include the following: the principal components of the model lack clear physical meaning and are difficult to interpret; these are sensitive to noise and outliers, which can affect prediction accuracy; and the selection of the number of latent variables is complex and can easily lead to overfitting or underfitting. In addition, PLS is based on linear assumptions and is difficult to handle in nonlinear problems, resulting in low computational efficiency when analyzing large-scale data analysis. Therefore, studies are committed to coupling PLS with other methods to avoid the limitations of PLS.
(1) MI-PLS:
Aljunaid et al. [42] proposed a method called MI-PLS. This method is based on PLS and decomposes selected parts into quality-related and unrelated components by utilizing mutual information, which is then used to construct quality-related monitoring statistics. In practical application, the proposed MI-PLS method has proven to have a lower computational load compared to PLS and significantly improves diagnostic performance.
(2) IPLS:
Li [43] proposed an Interval Partial Least Squares (IPLS) method based on the coupling of contribution graphs and partial least squares to diagnose faults related to variables, and its effectiveness has been verified by experiments. Experiments have shown that the IPLS-based contribution graph method has better fault detection and diagnosis capabilities compared to PLS due to the ability of IPLS to discriminate quality-related variables.
(3) IEPLS:
Kong [44] proposed an improved quality-related fault diagnosis method based on Efficient Partial Least Squares (EPLS) to enhance its application effectiveness in quality-related fault detection. After verification, IEPLS significantly improved both the detection and false alarm rates, thereby greatly enhancing fault diagnosis accuracy.
However, in PLS-based methods, many impurities remain in the main part when the variables are decomposed. These impurities can interfere with the acquisition of other fault information and affect the safety of the system process. However, the removal of these impurities decreases the detection rate of quality-independent faults, which also limits the adaptability of this method in practical applications. The effective removal of noise while retaining key features that are sensitive to faults has become an important research direction based on PLS methods.
Due to the strong nonlinearity and time-varying nature of multiphase flow in fluidized beds, PLS methods will focus on developing dynamic weighted noise reduction technology in the future. By introducing a flow characteristic adaptive adjustment mechanism, intelligent noise filtering will be achieved while retaining key fault information. Meanwhile, the hybrid modeling method combined with deep learning will enhance the parsing ability of PLS for complex fluidized features.

4.1.4. Independent Component Analysis

The principle of Independent Component Analysis (ICA) is to assume that the captured data during operation is a mixture of multiple independent source signals and then to find an unmixing matrix by calculation. The mixed data is then decomposed to obtain a feature set with independent features. The basic principal formula is as follows:
x = A s
where x is the observed mixed signal (such as sensor data), with a dimension of n ; s is the unknown independent source signal (such as fault characteristics or potential factors); and A is a mixing matrix that describes how signals are linearly mixed [45].
Based on these independent features, different potential factors or fault modes can be diagnosed [46]. This analysis method, which assumes the independence of the signal source, gives ICA significant advantages in dealing with non-Gaussian and multi-source interference problems in complex processes. In the process of fluidized bed fault diagnosis, ICA can effectively identify and locate fault features by separating independent source components from the signals of multiple sensors in the fluidized bed. However, traditional ICA methods exhibit certain limitations in presence of noise interference, dynamic processes, and nonlinear mixed signals, such as high sensitivity to noise and difficulties in handling temporal correlations or nonlinear features. To further improve the adaptability and robustness of ICA, several studies have proposed a series of extension methods based on traditional ICA. These extensions have been enhanced for specific problems, such as introducing kernel functions, dynamic characteristics, adaptability, sparsity or nonlinear modeling techniques into ICA, thereby expanding its application scope and significantly improving diagnostic performance.
(1) KICA:
Kernel Independent Component Analysis (KICA) is a coupled method that introduces kernel functions based on ICA. Chao et al. [16] used the KICA method in their research on fault detection and applied it to capture nonlinear structures in data. The data show that the Kernel Independent Component Analysis (KICA) method can detect slow faults faster than the Independent Component Analysis method, and that the KICA method can significantly improve detection performance on other faults and statistics.
(2) DICA:
Due to the dynamic and nonlinear nature of the observed statistical values in most industrial processes. Guo et al. [47] proposed a method for fault detection and diagnosis based on dynamic independent component analysis (DICA). In this method, an augmented matrix with time-delay variables is constructed to apply independent component analysis to extract statistically independent, non-Gaussian signal sources from the processed data and finally calculate statistics to monitor the sample condition. The simulation results show that DICA can effectively detect faults in multivariate dynamic processes.
(3) AICA:
Lu et al. [48] proposed an adaptive independent component analysis (AICA) method to solve the problem of selecting independent components when using ICA for process detection. This method first uses a separation matrix to establish an association matrix that represents the similarity of the independent components. At the same time, the independent component with the lowest probability density is selected as a particularly independent component (PIC) by kernel density estimation. Then, several ordinary independent components (CICs) with similar mutation characteristics to PIC are selected through the association matrix. Finally, PIC and CICs are used to construct monitoring statistics for process detection. The simulation test results show that the proposed method can better adapt to changing environments than ICA.
In the early days, ICA was widely applied and expanded due to its powerful signal separation ability and wide range of applications. However, with the rapid growth of data scale and the increasing complexity of analysis requirements, the applicability and accuracy of ICA are significantly limited, and therefore the applicable scenarios are also restricted. Zhang et al. [49] pointed out that ICA relies on assumptions such as statistical independence, non-Gaussian distribution, and linear mixing, which are difficult to fully satisfy in practical applications. It is also sensitive to noise and has permutation and scaling ambiguity in solutions, leading to a decrease in performance in high-dimensional data or complex scenes. It is necessary to combine other technologies such as deep learning or physical models to improve robustness.
Due to the strong nonlinearity and time-varying nature of multiphase flow in fluidized beds, the future development of ICA methods will focus on the following directions: the dynamic adaptive ICA algorithm, which solves the problem of arrangement ambiguity by introducing flow characteristic feedback mechanism, and simultaneously physically constraining the ICA model and combining it with the gas–solid two-phase flow dynamics equation to enhance the physical interpretability of feature separation. These improvements will significantly enhance the fault feature extraction capability of ICA under complex fluidized conditions.

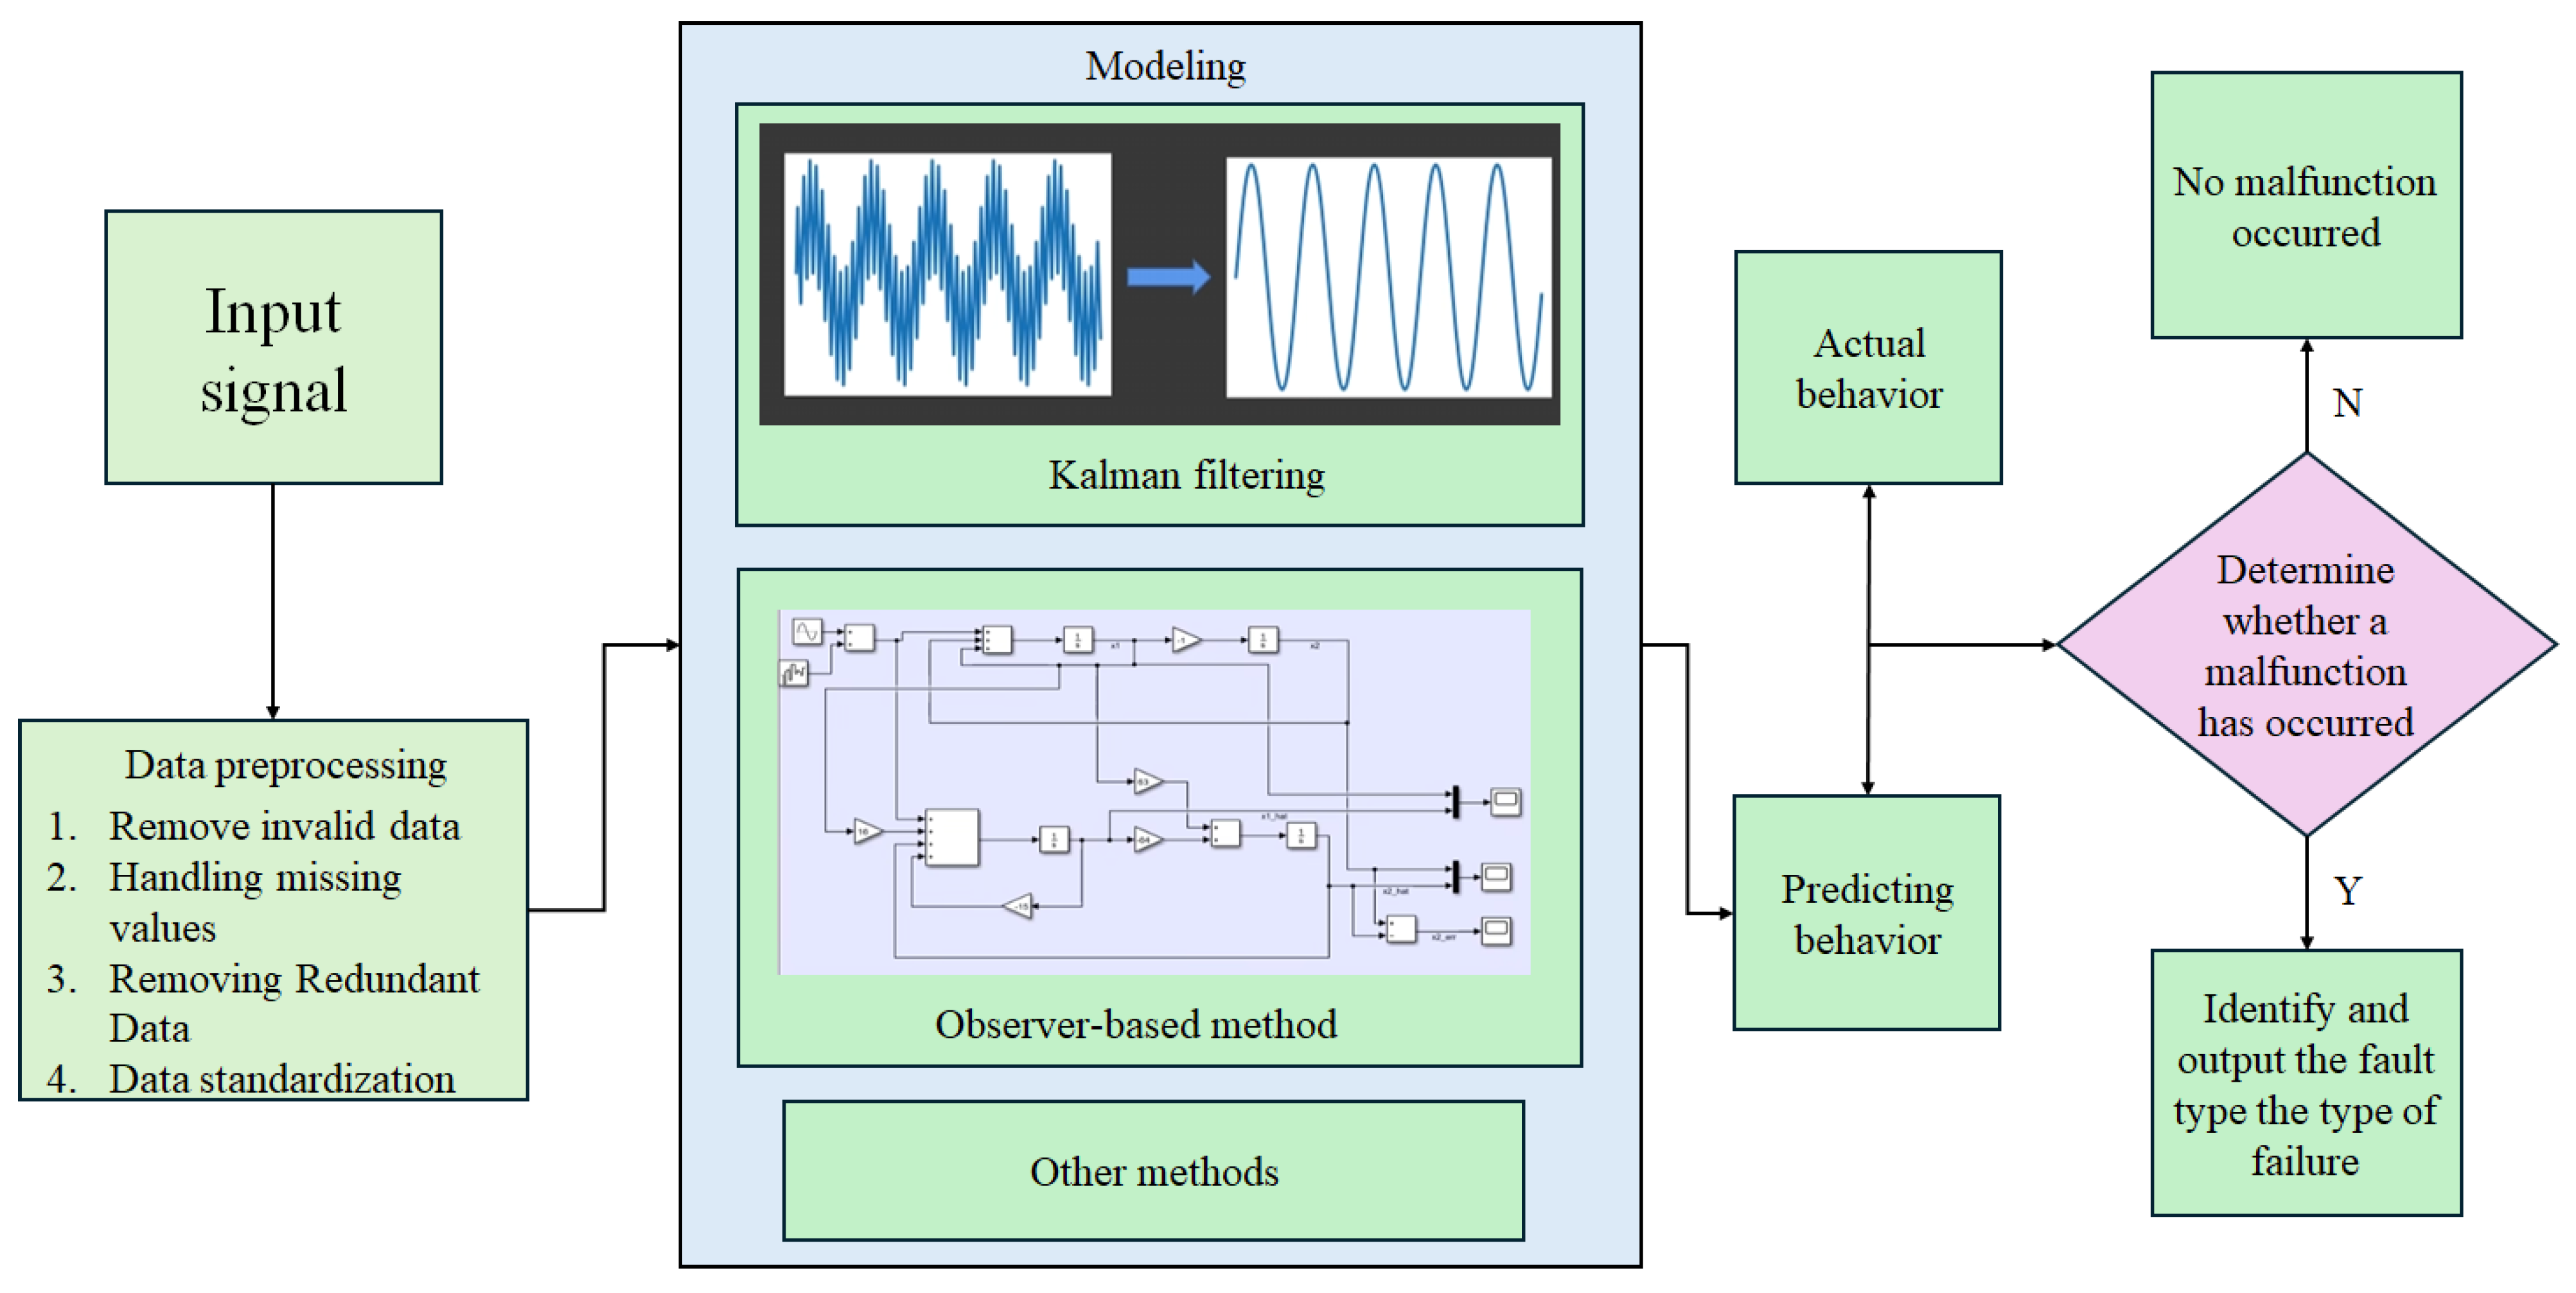
4.2. Model-Based Method

Model-based fault diagnosis methods rely on modeling mathematical models of system behavior. By collecting real-time correlation information between devices in regular operation and abnormal states, analyzing and comparing the differences between the predicted behavior of the model and the actual performance of the device, these can determine whether the device has malfunctioned and locate the type of the fault [50], as shown in Figure 6. These methods rely heavily on mathematical or physical modeling to detect faults by identifying deviations between the actual operating state and the expected state of the model. Model-based methods primarily include Kalman filtering and observer-based methods.

4.2.1. Kalman Filtering

The primary function of the Kalman filtering is to decompose the prediction error to obtain an approximation function when both the initial state vector and the interference term follow a normal distribution, and then use this function to estimate all unknown parameters in the model. The state vector is corrected after obtaining new observed data [51]. The principal formula is as follows:
x ^ k k = x ^ k k 1 + K k z k H k x ^ k k 1
where K k is the Kalman gain and H k is the observation matrix [52].
In complex dynamic systems, Zhou et al. [53] achieved dynamic optimization of task scheduling using a deep reinforcement learning framework. Similarly, Kalman filtering can process system noise and detect faults based on the difference between state prediction and actual measurement. Therefore, it is widely used in state estimation and fault diagnosis, especially for systems with high process noise and dynamic characteristics. In fluidized bed fault diagnosis, Kalman filtering can effectively detect typical faults such as gas–solid flow anomalies and temperature/pressure fluctuations through real-time state estimation and residual analysis. Cho [54] used a Kalman filter to estimate the state variables of the system to detect faults by comparing the residuals between measured and estimated values in the absence of system faults. In addition, once a fault is detected, the Kalman filter can be combined with artificial neural networks for further fault-type diagnosis, to identify specific fault patterns. After actual testing, the proposed method has been shown to be effective and provide good results. Han et al. [55] proposed a method for fault detection based on model-based quadratic Kalman filtering. The model linearizes and discretizes the Kalman filter. Secondly, the first Kalman filter is used for denoising, and the second Kalman filter is used for trend removal and residual calculation for detection. The simulation and experimental results show that the proposed method can accurately detect sudden and initial faults and has advantages such as noise reduction, adaptability, avoidance of divergence, and a high detection rate.
There are currently several extensions of Kalman filtering, including the Extended Kalman Filter (EKF) [56], Unscented Kalman Filter (UKF) [57], and Particle Filter (PF) [58]. Kalman filtering has become the primary technical method for processing state estimation of nonlinear systems due to its excellent ability to handle nonlinear systems. However, the Kalman filter method requires strong linear assumptions for the system and has difficulty in handling complex nonlinear systems.
Therefore, the future development of Kalman filtering will focus on three directions: First, a deep Kalman hybrid architecture is developed to compensate for nonlinear errors through neural networks. Secondly, an adaptive noise covariance mechanism is constructed to track real-time changes in the flow regime. Finally, a multi-scale estimation framework is established to handle the movement of bubbles/particles at different scales in a layered manner. These improvements will significantly enhance its applicability in complex fluidized bed conditions.

4.2.2. Observer-Based Method

The principle of observer-based methods is to construct a state observer, estimate the state variables of the system, and compare them with the actual measurements to detect faults in the system. It is applicable to the process in which the system state can be accurately estimated by some form of observer or estimator. In fluidized bed fault diagnosis, the observer-based method can effectively identify typical faults such as abnormal bubbles and particle agglomeration by constructing a gas–solid flow state observer. Jeong et al. [59] proposed a fault detection method based on observer residuals for diagnosing whether a machine is in normal working condition. This method mainly identifies faults by extracting fault signal information based on the theory of observer-based methods and the defined relationship between fault signals. After simulation, it has been shown that the observer-based method can effectively improve the ability of the method to diagnose faults. Vijay et al. [60] proposed a nonlinear observer-based method for fault diagnosis. This method designs two nonlinear adaptive observers based on input to state stability in cascaded systems, each sensitive to the factors that cause system failures. Experiments have shown that the simultaneous use of two observers can significantly improve fault resolution and has a wide range of application. Bernardi [61] proposed a fault diagnosis scheme based on two types of observers. This scheme consists of two types of observers, both of which are used for fault detection, isolation, and evaluation, where the objects are actuators and sensors. The simulation results have confirmed the performance and effectiveness of the proposed scheme in nonlinear systems with external disturbances. Although observer-based methods can estimate complex system states, it may be difficult to accurately estimate system states in nonlinear or high-noise environments, leading to a decrease in the accuracy of the method.
Therefore, in the future, observer-based methods will focus on developing deep-learning-enhanced nonlinear observers and adaptive multimodal observers to improve their state estimation accuracy and fault diagnosis robustness under strong nonlinear and high-noise conditions in fluidized beds.

4.3. Signal-Based Method

The signal-based method relies mainly on the signal data collected during the acquisition process and does not require the establishment of complex mathematical models for the system. The detection of faults is carried out by analyzing the frequency and time domain characteristics of signals. The basic principle is shown in Figure 7.

4.3.1. Spectral Analysis Method

The method of spectral analysis method can be traced back to the early 19th century, when the French mathematician Fourier proposed the Fourier series while investigating heat conduction problems and later proposed the Fourier transform, thus laying the theoretical foundation for spectral analysis. With the development of computer technology, the fast Fourier transform (FFT) algorithm was developed in the 1960s, which significantly improved the computing power of spectral analysis and promoted its widespread application in signal processing, communication, acoustics, and many other areas. The principle of spectrum analysis is to convert time-domain signals into frequency-domain signals composed of various frequency signals and their strengths and weaknesses through the Fourier transform, to show the energy distribution of signals at different frequencies. The principal formula is as follows:
X f = x t e j 2 π f t d t
where x t represents the time-domain signal; X f represents the frequency-domain representation of signal x t , used to describe the energy distribution of the signal at different frequencies f; and e j 2 π f t is a complex exponential basis function used to project time-domain signals into the frequency domain [62].
In fluidized bed fault diagnosis, spectral analysis can effectively identify key fault signals such as abnormal bubble frequency and particle collision characteristics. By using techniques such as bandpass filters, signal components within the target frequency range can be further extracted, thereby achieving accurate analysis and processing of the signal [63]. This method is therefore more suitable for vibration monitoring and fault detection in rotating machinery. Zhang [64] proposed a fault diagnosis method based on spectral analysis for spiral drum coal washing machines in coal mines to accurately identify faults in these machines. This method analyzes the frequency spectrum of vibration signals to determine their fluctuation in the time domain. This enables more intuitive observation of the frequency spectrum characteristics of vibration signals and accurate diagnosis of faults and vibrations in coal mine spiral drum coal washing machines. The experimental results show that this method has a strong capability of spectral analysis of abnormal vibration signals and can accurately identify fault types. Zou et al. [65] designed a multifunctional signal spectrum analyzer and constructed signal generators and spectrum analysis modules on two PCs connected via Ethernet using the LabVIEW platform. The system can generate waveform signals with noise and analyze the amplitude spectrum and phase spectrum of the signal through low-pass filtering, windowing and smoothing. Ultimately, the spectrum analyzer demonstrated exemplary performance and stability in test operation, proving its suitability for practical use the fault diagnosis and monitoring of chemical plants. These studies provide essential references for the further application of virtual instrument technology in industrial monitoring. Overall, spectrum analysis can effectively identify periodic faults and mechanical vibration faults, but it is less sensitive to nonperiodic faults and is severely affected by noise. Therefore, when diagnosing flow faults in fluidized beds, it is usually necessary to combine other analysis methods to improve diagnostic accuracy.
Therefore, in the future, spectrum analysis methods will focus on developing adaptive noise suppression techniques and time–frequency joint analysis methods to enhance their ability to detect nonperiodic flow faults in fluidized beds.

4.3.2. Wavelet Transform

The wavelet transform (WT) is a multi-resolution analysis method that can simultaneously capture the time and frequency domain information of signals and detect faults by analyzing the characteristic changes in signals at different scales. In fluidized bed fault diagnosis, the wavelet transform can effectively capture transient characteristics such as bubble rupture and particle agglomeration, achieving early warning of faults. It is more suitable for processing non-stationary signals, such as instantaneous faults and sudden abnormal situations in chemical processes. Yu et al. [66] proposed a fault diagnosis system based on the wavelet transform. The principle is to decompose the fault data of equipment using the multidimensional wavelet decomposition method, combined with integrated information processing and hardware integration design, to achieve the development and design of a collaborative remote diagnosis system for equipment faults. The experimental results show that the designed fault diagnosis system based on the wavelet transform has good adaptability and a strong ability of fault reliability detection. In order to improve the expression effect of vibration signal characteristics of traditional one-dimensional bearings, Zhao et al. [67] applied the wavelet transform to the fault diagnosis of bearings. This method converts the one-dimensional vibration time series signal of rolling bearings into a two-dimensional time–frequency map using wavelet transform, allowing for more efficient extraction of fault features in the subsequent steps. The experimental results show that the proposed method can accurately identify different types and severities of faults and extract feature information with high discrimination, excellent generalization ability, and strong robustness. Malla et al. [68] used a discrete wavelet transform (DWT) method based on the wavelet transform for fault detection, classification, and localization. According to the simulation results, this method can effectively handle non-stationary and irregular transient signals, and its fault detection capability is also excellent.
In general, the wavelet transform can analyze non-stationary signals and is more suitable for detecting sudden faults and instantaneous anomalies, but it requires the selection of appropriate wavelet basis functions, and the analysis process is complex. In the future, wavelet transform will focus on developing adaptive wavelet basis selection algorithms and intelligent parameter optimization techniques to simplify its application process in fluidized bed transient fault diagnosis and improve detection accuracy.

4.4. Knowledge-Based Method

Knowledge-based fault diagnosis methods typically use manual experience, expert systems, or integrated knowledge databases in combination with historical data and expert experience to diagnose faults. This type of method is suitable for complex process systems without precise models.

4.4.1. Expert System

The expert system (ES) relies primarily on experts in specific fields to establish a knowledge base for dealing with specific problems based on their long-term accumulated experience and practical knowledge. In fluidized bed fault diagnosis, expert systems can integrate operational experience and process knowledge to achieve intelligent diagnosis of typical faults such as gas–solid flow anomalies and heat transfer deterioration. Rule analysis and reasoning are used to fault diagnosis is carried out, and solutions are found [69]. This method is more suitable for complex and challenging model chemical processes. Expert systems are mainly divided into three types: rule-based expert systems, case-based expert systems, and neural-network-based expert systems [70]. The principle of rule-based expert systems is that the expert system encodes the knowledge and experience of the experts into a set of IF-THEN rules. The system outputs the fault type if the process data conforms to specific rules [71]. In this method, the rules represent the reasoning process of experts; so, the rule-based expert systems will have better interpretability when solving problems. The principle of case-based expert systems is to use historical cases to solve current issues [72]. When a problem arises, the system searches for similar cases in the case library established by the system and applies similar solutions to solve the problem. Therefore, this method relies heavily on the quality and comprehensiveness of the system case library. If the case library is not sufficiently complete, the quality of the solutions offered by the system is usually not high. Due to the rapid development of computer technology, more complex training processes have gradually become feasible. As a result, expert systems based on neural systems are gradually being widely applied. Neural-network-based expert systems typically require a large amount of data for training. Therefore, neural-network-based expert systems have better adaptability and generalization ability [73], and but the decision-making process of neural-network-based expert systems is often more difficult to understand [74]. In the future, expert systems will develop towards the direction of “interpretable deep learning” by integrating symbolic reasoning and neural networks, enhancing decision transparency while maintaining the adaptability of fluidized bed fault diagnosis, and developing a lightweight training framework based on physical constraints to reduce data requirements.

4.4.2. Graph Search

Graph search is a method used for finding paths or nodes in graphically structured data. In fluidized bed fault diagnosis, the graph search method can effectively identify flow anomalies and fault propagation paths by constructing gas–solid flow state transition diagrams. Graph search has a variety of applications in computer science, artificial intelligence, network analysis, and other fields. It is particularly suitable for analyzing social networks, path planning, data structures, and natural language processing. Kranakis et al. [75] explores the application of graph algorithms in distributed systems and evaluates the impact of knowledge graphs on the competitive ratio. In this study, the proposed search algorithm covers distributed computing topics such as stability and security. Zaitsev and Kruchkov [76], in their study, combined the graph search method with the machine learning method for system state monitoring. The principle is to use graph neural networks for predictive diagnosis of inertial navigation systems and classify and diagnose system states through machine learning methods.
In summary, the graph search method is an intuitive, flexible, and suitable algorithm for multi-objective optimization. However, its computational complexity is high, and its efficiency in handling large-scale complex systems is limited. In fluidized bed systems, the graph search method can optimize the particle motion path and gas–solid distribution in fluidized beds, improving accuracy of process control and operational efficiency. However, the complex dynamic characteristics of fluidized beds may lead to slower convergence speed of the algorithm, requiring coupling with other algorithms to improve applicability. In the future, graph search algorithms will focus on developing adaptive path optimization strategies based on reinforcement learning. By combining the multiphase flow dynamics of fluidized beds, heuristic rules will be constructed to reduce computational complexity while improving search efficiency for large-scale complex systems.
To better compare the characteristics of different parameter estimation-based, the advantages and disadvantages of these methods are summarized in Table 2. Table 2 lists the applicable scenarios, advantages, and limitations of each technique, in order to visually understand the performance and applicability of different techniques in practical applications.
From the perspective of accuracy and recall data, traditional parameter estimation methods such as PCA (accuracy 85–92%, recall 78–85%) and PLS (accuracy 80–87%, recall 75–83%) have shown stable performance in some deterministic fault diagnosis, but their overall performance has obvious bottlenecks. This limitation is mainly reflected in three aspects: Firstly, traditional methods have strong assumptions about data distribution (such as PCA requiring Gaussian distribution and linear relationship), and when faced with common non-Gaussian noise and nonlinear features in fluidized bed systems, their accuracy will significantly decrease. Secondly, the recall rates of these methods are generally below 90%, indicating their insufficient ability to detect early weak faults and composite faults- Furthermore, the performance of parameter estimation methods is highly dependent on expert experience (such as PCA principal component selection and PLS latent variable determination), making it difficult to achieve adaptive optimization in practical industrial scenarios.
Overall, statistical methods are heavily influenced by data and have limited ability to process dynamic changes; signal-based methods are only good in their applicable directions and have low universality; model-based methods and knowledge-based methods are difficult to apply to dynamically changing and complex chemical processes due to the challenges of modeling and knowledge accumulation [80]. In the complex, highly nonlinear, and numerous coupled systems of fluidized bed flow, these fault diagnosis methods are challenging to effectively meet their requirements. Therefore, finding a practical and feasible diagnostic method to solve the problem of fluidized bed flow state faults remains an important issue that needs to be addressed urgently.

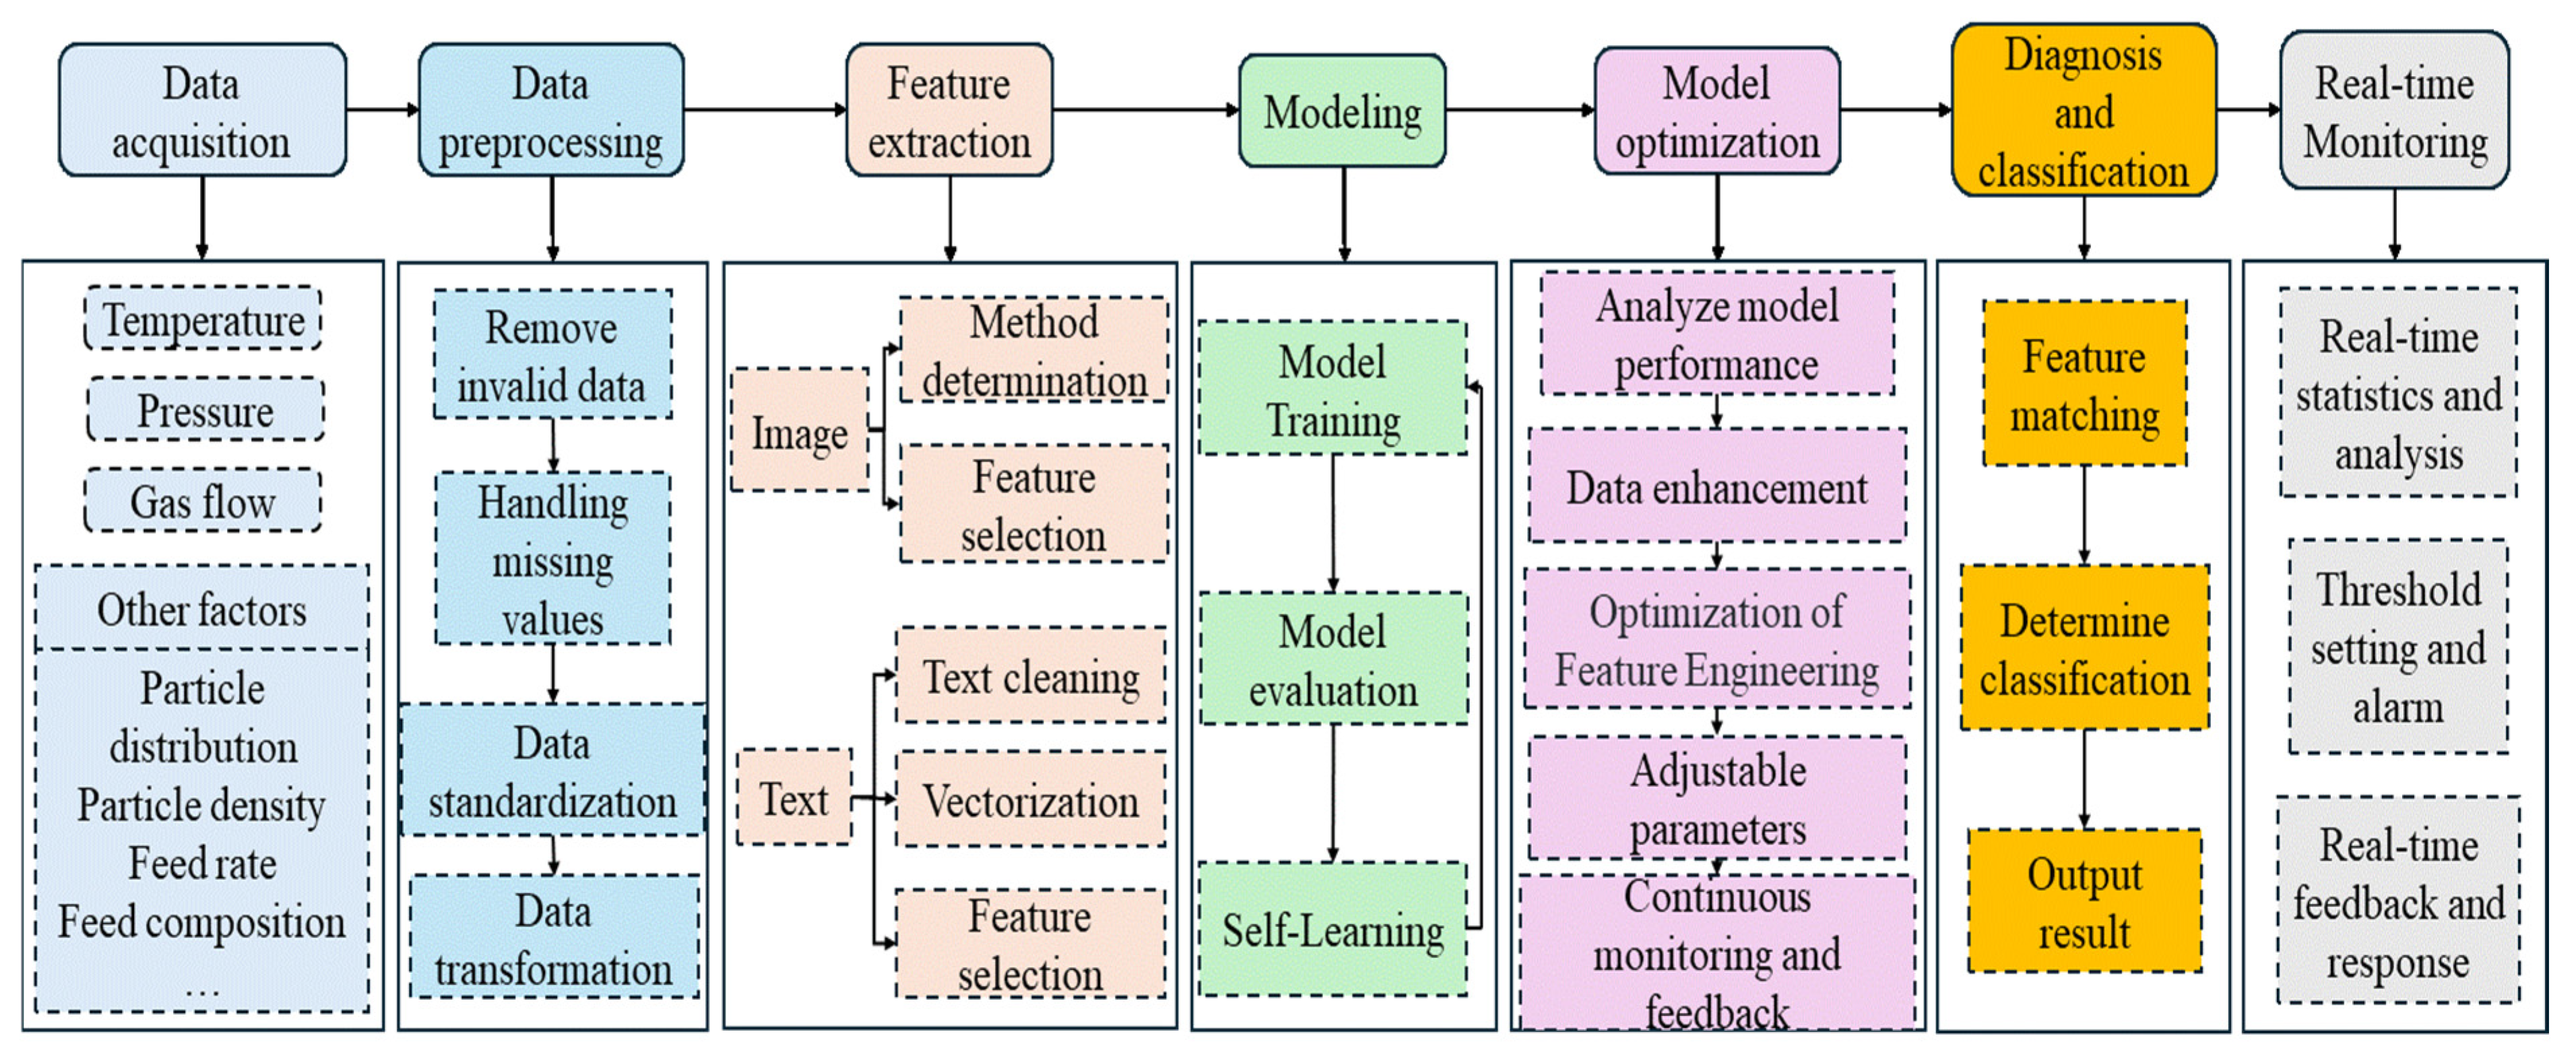
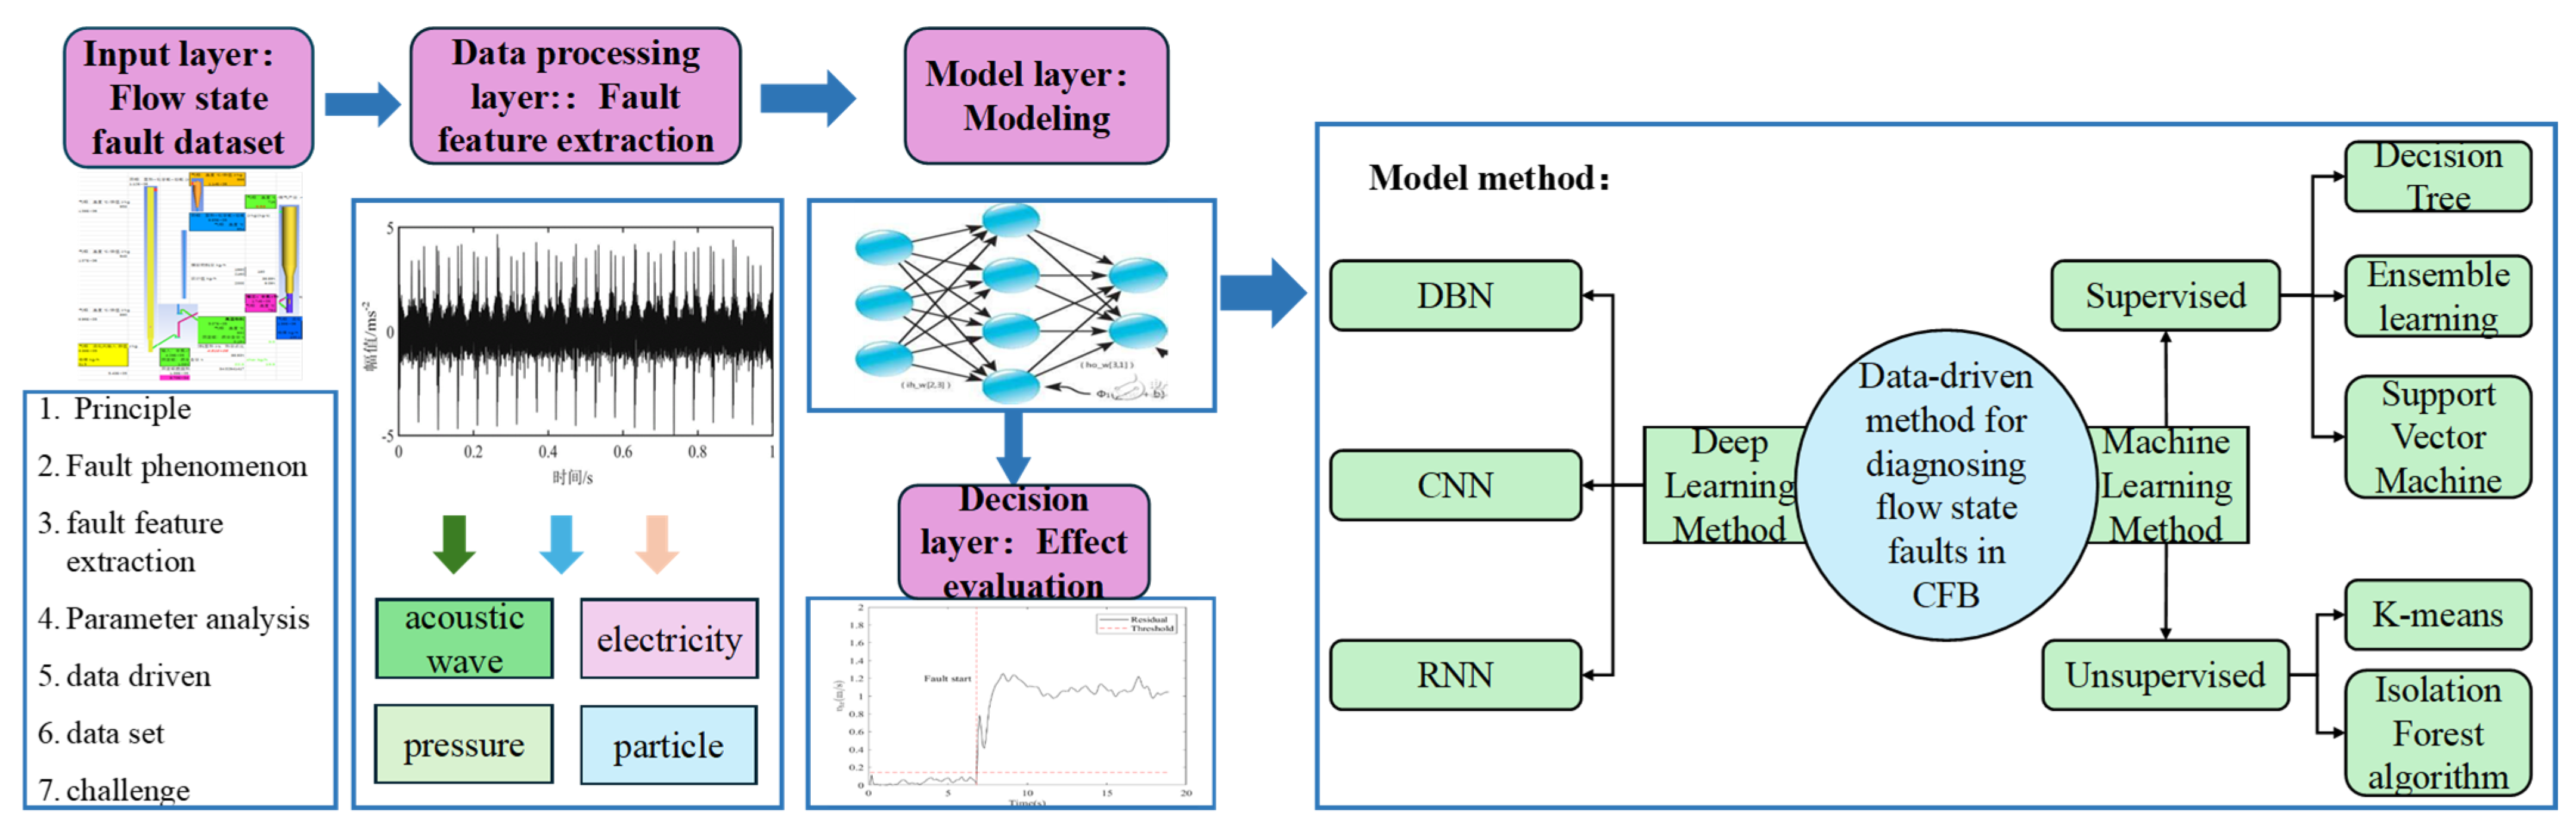
5. Data-Driven Method for Diagnosing Flow State Faults in CFB

In today’s era of rapid technological development, the reliability and security of complex systems are crucial for enterprises and even countries. Therefore, with the continuous advancement of sensor technology and the significant improvement in data storage capabilities, data-driven fault diagnosis methods have emerged, opening up new ways to ensure the stable operation of various systems, including fluidized bed system. In fault diagnosis, early fluidized bed fault diagnosis methods were often limited by model accuracy and complexity. However, with their unique advantages, data-driven fault diagnosis methods provide a more flexible, efficient, and widely applicable solution. They do not rely on precise physical models, but instead mine the inherent features of data from a large amount of measured data and utilize advanced data analysis techniques and algorithms to achieve accurate detection, localization, and diagnosis of system faults [81]. To date, data-driven fault diagnosis methods have achieved significant results in the field of intelligent industrial manufacturing, and with the continuous development of modern industrial technology, data-driven fault diagnosis technology will also be further improved and its application scenarios will become increasingly widespread.
The data-driven fault diagnosis methods are mainly divided into two categories: machine learning methods and deep learning methods. The approximate diagnosis process and method classification diagram of the data-driven fluidized bed flow state fault diagnosis method are shown in Figure 8.

5.1. Machine Learning Method

The machine learning method aims to utilize artificial intelligence technology to enable computer systems to automatically learn patterns from acquired data and diagnose faults. In practical diagnosis, machine-learning-based fault diagnosis methods mainly include steps such as data collection, manual feature extraction, and fault diagnosis [82]. Among them, accurately extracting fault features is related to the accuracy and efficiency of fault recognition. Therefore, training the model to extract fault features more efficiently has always been the top priority of machine learning methods.
Depending on availability of labeled training data, machine learning methods are divided into two types: supervised and unsupervised.

5.1.1. Supervised Learning Method

Supervised learning refers to the method of continuous training with data to minimize the error in the system output. It is mainly used for classification (e.g., to determine the classification of an item) and prediction (e.g., to predict a particular data item for the next year based on previous years’ data). Decision trees, support vector machines, and neural networks are among the supervised learning methods.
(1) Decision Tree:
Decision tree (DT) is a powerful data mining tool that efficiently captures hidden rules in historical fault data through learning [83]. In fluidized bed fault diagnosis, decision trees can quickly classify and locate faults such as abnormal bubbles and particle agglomeration by analyzing multidimensional parameters such as temperature and pressure. The decision tree model consists of nodes and edges, with nodes representing an object and branches representing selection. Its distinctive feature is that it splits to the next branch based on the selected features, and it usually plays a role in fault detection for judgment. Due to its intuitive and easy-to-understand process of fault diagnosis, it greatly improves the accuracy and efficiency of fault diagnosis and has, therefore, received widespread attention and research in the field of fault diagnosis [84]. Also, the fault diagnosis of fluidized bed flow usually involves complex fault types and multivariate features. Decision trees can classify different types of faults layer by layer and quickly localize problems through hierarchical state evaluations (such as temperature, pressure, gas flow rate, etc.). This structured classification method is suitable for fault diagnosis and analysis of complex fluidized bed processes.
Avelin et al. [85] proposed a decision support method based on dynamic data correction and Bayesian networks for CFB boiler fault diagnosis, which is closely related to decision trees in concept and application. The author established a dynamic correlation between sensor data and system process variables by establishing a physical simulation model and developing a causal relationship diagram for early fault diagnosis and decision support in fluidized bed systems. Li et al. [86] proposed an analysis method that combines decision tree classification models and fully connected neural networks, significantly improving the accuracy of fault-type detection and achieving quantitative and qualitative analysis of fault-type features. In this framework, the decision tree model performs preliminary fault screening through classification features in this framework, providing reliable input data for subsequent neural network analysis. The experimental results show that the method performs well in both the training and validation stages, demonstrating good generalization ability and validating the important role of decision trees in feature selection and classification tasks. Mauricio et al. [87] used a specific combination of two decision trees to detect fault and classify monitoring variables. The first decision tree was used to determine whether the system had experienced a fault, while the second decision tree identified the type of fault. This method significantly improves fault diagnosis performance while having excellent comprehensibility. Kherif et al. [88] proposed a diagnosis technique that combines the KNN algorithm and the decision tree principle. This method uses decision trees to optimize the number of neighbors and distance types in the KNN algorithm. This improves the accuracy of the classifier and highlights the important contribution of decision trees in optimizing parameter selection and improving diagnostic accuracy. In the future, decision trees will focus on developing adaptive deep decision forests based on the multiphase flow characteristics of fluidized beds. By integrating physical constraints and dynamic pruning techniques, they will enhance diagnostic robustness for complex operating conditions while maintaining parameter optimization advantages.
(2) Ensemble Learning Method:
The principle of the ensemble learning method is to integrate multiple learners in order to compensate for the shortcomings of a single learner. In fluidized bed fault diagnosis, ensemble learning can significantly improve the diagnostic accuracy of complex faults such as gas–solid flow anomalies and heat transfer deterioration by integrating the advantages of multiple models. Through this integration, an ensemble model can be formed that is more comprehensive and accurate than any single individual learner [89]. In addition, the integrated learning method can reduce the misjudgment rate of a single model by integrating multiple learners and can be applied to processes with high data dimensions, complex structures, and fuzzy features [90]. Various complex variables and nonlinear relationships are usually involved in the fault diagnosis of fluidized bed, and a single model can be challenging to accurately capture all characteristics. However, integrated learning can significantly improve the accuracy and robustness of diagnosis by combining several basic models (such as decision tree, random forest, support vector machine, etc.). The weighted average of various models can reduce the bias of and variance in a single model, allowing for a better fit to the characteristics of diversity of fluidized bed faults.
Ye et al. [91] constructed two integrated models, LeNetU AdaBoost and LeNetU Bagging, to address various fault encountered in offshore wind turbines operations. After a comparative analysis, the diagnostic performance of this research method was found to be superior to any single fault diagnosis model for small fault dataset. Wen et al. [92] combined ensemble learning techniques with optimized base learners using operational data to predict NOx emissions under different conditions in coal-fired boilers. The model achieves high prediction accuracy and generalization performance by integrating feature optimization and advanced learning algorithms. Eskandari et al. [93] developed a probabilistic ensemble learning model that combines multiple algorithms for fault diagnosis. The experimental results have shown that the proposed method has higher diagnosis accuracy even at low mismatch values and high fault impedances. Moreover, the comparative results show that the proposed method outperforms individual machine learning algorithms.
Considering the advantages of ensemble learning in fluidized bed fault diagnosis, future research can further explore the following directions: by introducing a dynamic weight adjustment mechanism and combining it with the multiphase flow characteristics of fluidized beds, an adaptive ensemble learning framework can be developed to achieve more stable and accurate fault diagnosis in complex working conditions.
(3) Support Vector Machine:
The support vector machine (SVM) was first proposed by VAPINK et al. [94] and is a learning strategy based on statistical learning from past statistical data. In fluidized bed fault diagnosis, the support vector machine can effectively identify typical fault modes such as abnormal gas–solid flow state and uneven temperature distribution by constructing the optimal classification hyperplane. Its essence is to discover patterns and learn by examining data. The principal formula of the SVM is as follows:
min w , b 1 2 w 2 + C i = 1 n ξ i
y i ( w T ϕ ( x i ) + b ) 1 ξ i
The function of the first formula is to minimize the objective function, while the second formula is a constraint condition used to ensure that the vast majority of samples are correctly classified and located outside the boundary. These two formulas together form the core mathematical framework of the SVM, which uses convex optimization to find the optimal decision boundary that can maximize the classification interval and tolerate noise.
Support vector machines can effectively solve problems such as overfitting and local minima and have advantages that other machine learning methods cannot match: their computational complexity depends mainly on the number of support vectors rather than the dimensionality of the sample space, avoiding the “curse of dimensionality” problem to a certain extent. Therefore, the SVM has made significant progress in many fields, such as facial recognition, nonlinear function estimation, bioinformatics, handwritten digit recognition, and time series prediction [95].
Guan [96] used support vector machines to model fluidized bed systems, improving the prediction accuracy and generalization ability of the model. The research has shown that the nonlinear modeling ability and strong prediction performance of support vector machines provide new ideas for the optimization design and control strategies of fluidized beds and are effective tools for solving modeling and control problems in fluidized bed systems. Niu et al. [97] have also proposed that support vector machines in fluidized bed systems can predict key factors such as material distribution, airflow patterns, and temperature changes more accurately compared to other methods. Therefore, support vector machines can more sensitively identify and capture the fault characteristics during the operation of fluidized beds. Venkata et al. [98] discussed in detail the advantages of SVM in processing unbalanced datasets, such as improving classification accuracy by the SVM-forest algorithm, and demonstrated its practical application in detecting fluidized bed fault. Zhang [99] analyzed the problem of small sample machine learning in fault diagnosis of mechanical equipment and concluded that traditional methods often have difficulty maintaining high accuracy in the case of insufficient samples, while SVM can better cope with this problem. To this end, he improved the binary tree structure used by SVM in multi-class classification tasks and optimized it by carefully selecting the kernel function and its parameters. The application of the improved algorithm in fault diagnosis experiments shows that the accuracy of fault diagnosis has been significantly improved. In the future, support vector machines may focus on developing adaptive kernel function optimization methods based on the multiphase flow characteristics of fluidized beds, enhancing small sample learning capabilities through the integration of transfer learning frameworks, and improving diagnostic robustness for complex operating conditions while maintaining the advantage of minimizing structural risks.
It is worth mentioning that a key challenge in applying supervised learning to fluidized bed fault diagnosis is the inherent class imbalance, where normal operating data often far exceeds fault samples. But, currently, there are several effective strategies to solve this problem:
(1) Synthetic Minority Oversampling Technique (SMOTE): This algorithm generates synthetic samples for minority classes by interpolating between existing instances in feature space. Unlike simple oversampling, SMOTE creates meaningful new data points along the line segments connecting k-nearest neighbors of minority class samples, effectively expanding the decision regions for rare fault types while avoiding overfitting [100].
(2) Cost-sensitive learning: This approach assigns higher misclassification penalties to minority classes during model training. For support vector machines, this translates to asymmetric penalty parameters C+ and C− for positive and negative classes, respectively, forcing the decision boundary to shift toward the majority class [101].
(3) Focal loss: Originally developed for object detection, focal loss modifies the standard cross-entropy loss by down-weighting well-classified examples 1 p ^ γ and focusing on hard misclassified samples. This is particularly effective for deep learning models handling severe class imbalance as it automatically adjusts the learning focus during training without requiring sample rebalancing [102].
Recent studies have demonstrated the effectiveness of these methods in similar industrial applications. For instance, Zhou et al. [103] achieved a 28% improvement in rare fault detection accuracy by combining SMOTE with ensemble boosting in chemical process monitoring, while Zhang et al. [102] reported focal loss reducing false negatives by 41% in rotating machinery fault diagnosis compared to traditional sampling methods.

5.1.2. Unsupervised Learning Method

In unsupervised learning, machines can autonomously use different measurement methods to classify highly similar data into the same category and explore the structure and patterns of the data. Since the data used for model training is not labeled with pre-defined labels, unsupervised learning methods are gaining popularity in anomaly data recognition [104].
Unsupervised learning methods are mainly used for tasks such as clustering (e.g., clustering different behaviors of people towards something), dimensionality reduction (e.g., principal component analysis to reduce high dimensional data to low dimensions), etc. The k-means method and the Isolation Forest algorithm are typical unsupervised learning methods.
(1) K-means Method:
The K-means clustering algorithm is a clustering analysis method that solves problems through an iterative process. In fluidized bed fault diagnosis, the K-means algorithm can effectively identify abnormal operating conditions and fault modes by clustering analysis of multidimensional operating parameters such as temperature and pressure. It can partition datasets without prior knowledge [105] and is often used in data mining and machine learning. The core idea of this algorithm is to divide data into different clusters based on their similarity. It first assigns the data points to the nearest cluster center and then updates the cluster centers to minimize the sum of distances between data points within each cluster and their centers. Through this process, the algorithm can classify and cluster the data [106].
The simplicity and efficiency of the k-means method makes it suitable for various applications such as customer segmentation, image compression and anomaly detection. For example, in the field of big data analytics, k-means can be applied to group similar user behaviors or network activities, which helps to understand underlying patterns and make informed decisions. Zhou et al. [107] also emphasized the importance of clustering in deep relevance mining research in heterogeneous big data environments. Sun et al. [108] investigated the particle aggregation characteristics of fluidized beds using the K-means-method-assisted image processing, to reveal the distribution pattern of particle aggregation characteristics in circulating fluidized beds. This provides essential data for the development of gas–solid flow models and process detection in circulating fluidized beds. In addition, the data collected during fault diagnosis in industrial processes is mostly normal data and relatively less fault data. This imbalanced data can cause the performance of conventional classifiers to degrade, which can have a negative impact on fault diagnosis. Similar situations also occur in fluidized beds’ flow state fault diagnosis process. To effectively address the impact of imbalanced data on classifier performance, Chen et al. [109] proposed a method that combines K-means and Bayesian theory. By clustering the majority class data into multiple subclasses, the boundaries of the minority class data can be better described, improving the classification ability of scarce fault modes. This method can be directly applied to the fault diagnosis of fluidized beds to enhance the recognition of abnormal operating conditions. In the future, K-means will focus on developing adaptive clustering algorithms based on the dynamic characteristics of fluidized beds. By integrating deep representation learning and multi-scale clustering strategies, it will improve the recognition accuracy of scarce fault patterns while maintaining sensitivity to abnormal operating conditions.
(2) Isolation Forest Algorithm:
The Isolation Forest algorithm is an algorithm that utilizes the isolation of samples in a tree to identify outliers. In fluidized bed fault diagnosis, the Isolation Forest algorithm can efficiently identify abnormal working conditions such as sudden temperature changes and pressure fluctuations without relying on a large amount of prior knowledge of faults. Due to its excellent performance in detecting anomalies, the Isolation Forest algorithm is explicitly used for anomaly detection [110]. Therefore, the Isolation Forest algorithm is highly compatible with the fluidized bed fault diagnosis method: the faults of fluidized bed systems are usually manifested as a small number of abnormal data hidden in a large amount of normal data. By constructing a random split tree, Isolation Forest can not only identify these abnormal points quickly and efficiently without requiring a large amount of prior knowledge about the fault data, but also reduce the computational cost and achieve efficient detection performance with only small data samples [111]. In addition, the fluidized bed system involves multiple variables such as temperature, pressure, flow rate, particle concentration, etc., and the data dimension is relatively high, while the Isolation Forest algorithm performs well on high-dimensional data. In the future, the Isolation Forest algorithm may focus on developing adaptive segmentation strategies based on the multi-variable coupling characteristics of fluidized beds. Introducing deep feature selection and dynamic anomaly scoring mechanisms will further improve the efficiency and accuracy of anomaly detection for high-dimensional operating data.

5.2. Deep Learning Method

Strictly speaking, deep learning is a subfield of machine learning that simulates the structure and function of human brain through neural networks. Deep learning is highly suitable for various application scenarios such as images, speech, and text [112]. In addition, many studies have favored deep learning due to its excellent automatic feature extraction and large-scale data-processing capabilities, making research in deep learning very popular in recent years.
In circulating fluidized bed fault diagnosis, the training and optimization of deep learning models are the key links to achieve accurate fault diagnosis. The deep learning method can effectively capture nonlinear features in fluidized bed operation data by constructing deep neural network models, achieving accurate diagnosis of complex faults such as abnormal bubbles and particle aggregation. Traditional optimization algorithms may have problems such as slow convergence speed and easily fall into local optimization when dealing with the complex loss function of deep learning models. Therefore, it is important to draw on advanced optimization algorithms to improve the performance of deep learning models. For example, the ImCSA algorithm proposed by Kang et al. [113] performs well in photovoltaic model parameter estimation, which effectively avoids local optimal solutions and accelerates the convergence process through the dynamic adjustment strategy and global exploration mechanism. This optimization idea can provide a useful reference for deep learning model training in circulating fluidized bed fault diagnosis.
However, the current application of deep learning in fluidized bed fault diagnosis is still insufficient, which highlights the urgency of further developing this technology. Due to the limited current applications, there is enormous exploration space and potential, which can be seen from deep learning research in other related fields. Therefore, it is imperative and necessary to strengthen the research and development of deep learning in fluidized bed fault diagnosis. Below are several essential methods in deep learning.

5.2.1. Deep Belief Network

A Deep Belief Network (DBN) is a deep learning framework based on probabilistic graph models and is an essential model in deep learning. A deep belief network is a multi-layer neural network, each layer consisting of a restricted Boltzmann machine (RBM). When training a DBN, it is necessary to train each layer of RBN separately to complete the task [114]. The schematic diagram of RBM principle is as follows:
E v , h = i a i v i j b j h j i , j v j w i j h j
Through this energy minimization framework, RBM can automatically discover complex nonlinear relationships between sensor data and fault modes, laying the foundation for deep feature extraction in subsequent DBN.
DBN can effectively solve multiple difficulties in fluidized bed flow state fault diagnosis. In fluidized bed fault diagnosis, DBN can effectively extract nonlinear characteristics of gas–solid flow through the deep network structure, achieving accurate identification of complex faults such as flow anomalies and particle agglomeration. First, due to the highly nonlinear and dynamic characteristics of fluidized bed flow, it is often challenging to collect effective features for fault diagnosis during the fluidized bed operation. DBN can effectively and efficiently extract features of fluidized bed flow processes. This is evident from the study of Zhang et al. [115]. In the field of analog circuit fault diagnosis, extracting effective features from measurement signals has always been a key research area. Zhang et al. [116] proposed an initial fault diagnosis method for analog circuits based on DBN feature extraction to better extract features from signal data. This method effectively extracts advanced and layered features from measured signal data by using DBN, which significantly improves the efficiency of feature extraction. Zhou et al. [117] proposed a deep neural network model, A-YONet, that combines YOLO and MTCNN. This model effectively improves the efficiency and accuracy of feature extraction through a multi-level feature fusion mechanism, providing a reference for optimizing deep learning models in fluidized bed fault diagnosis. From this perspective, the application of DBN in fluidized bed flow state fault diagnosis undoubtedly improves the efficiency of feature extraction dramatically. Secondly, DBN can predict fluidized bed faults in the early stages of occurrence through probabilistic inference, thus providing accurate real-time fault warnings, which further improves the accuracy and timeliness of fluidized bed fault diagnosis. Cui et al. [114] proposed a robust control method based on Q-learning, which utilizes neural networks to estimate the parameters of the Q-function, demonstrating the effectiveness of deep learning in dealing with uncertainty and disturbances. This deep-learning-based control strategy provides a reference for model free methods in fluidized bed fault diagnosis. Yuan et al. [118] proposed a deep network model based on Deep Belief Network Online Adaptive Fine Tuning (OAFDBN) for predicting chemical processes, which is based on the excellent prediction function of DBN. To make predictions, the DBN model selects the most relevant samples from the historically labeled dataset and then dynamically expands the dataset by adding new available labeled data. Practical verification has shown that the prediction performance of the DBN is excellent. This study also demonstrates that the predictive function of the DBN is highly anticipated in the diagnosis of flow state faults in fluidized beds. In the future, the DBN may focus on developing adaptive pre-training mechanisms based on the dynamic characteristics of fluidized beds, by integrating online learning and transfer learning strategies, to enhance the generalization ability to new fault modes while maintaining excellent predictive performance.

5.2.2. Convolutional Neural Network

Convolutional neural networks (CNNs) can extract local features of input data and propagate high-level global information layer by layer. At the same time, pooling layers are used to reduce dimensionality of data, decrease the number of parameters to be learned, and reduce computational complexity. By pooling operations and moving convolution kernels, position invariant features in the image are learned, making system robust to image rotation, translation, and other processes. CNN is widely applied due to its powerful local feature extraction capability and flexible architecture and has achieved good diagnostic performance [119].
Convolutional neural networks can be effectively used for fluidized bed flow state fault diagnosis, mainly because they have unique advantages in processing and analyzing images or data with spatial structure and local features. The fluidized bed is a complex multiphase flow system involving gas and solid particles and their interactions. The changes in the flow state are crucial for fault diagnosis. The following explains why convolutional neural networks can be useful in fault diagnosis of fluidized bed flow state.
First, the flow characteristics of fluidized beds usually exhibit spatial structure and local correlations (e.g., particle motion patterns, changes in airflow, etc.). Convolutional neural networks can automatically learn and extract these local features through convolutional layers without the need for human supervision and without manually designing complex feature extraction methods [120]. A CNN gradually extracts more abstract features from local to global through multi-layer convolution operations, which can capture the microscopic changes in fluidized bed flow state and accurately classify and detect faults in the flow state. Chen et al. [121] proposed an innovative Multi-Center Hierarchical Federated Learning (MCHFL) framework, which is based on convolutional neural networks, and effectively improves the robustness and accuracy of the model in unstable network environments by performing model aggregation and updating parameters. This shows that in unstable environments, the convolutional neural network still has a very good performance in feature extraction. Further innovating on the basis of LSTM (an improved architecture of RNN), Zhou et al. [122] proposed a VLSTM model incorporating variational inference. The model reconstructs the hidden variables through the variational auto-encoder (VAE) framework, which achieves a low-dimensional optimal representation of industrial big data features while retaining the advantages of LSTM time-series modeling, thus significantly reducing the false alarm rate of fault detection. Huang et al. [123] proposed a fault diagnosis method based on a combination of convolutional neural networks and long-short term memory networks (LSTMs) and utilized the superiority of a CNN in feature extraction. Practical applications have shown that a CNN performs feature learning without relying on prior knowledge, and its ability to automatically extract local features from data is excellent, which significantly improves the prediction accuracy and noise sensitivity of fault diagnosis. Secondly, flow faults in fluidized beds are usually detected by visual monitoring, sensor data (such as pressure, temperature, flow rate, etc.), or other forms of time series data. A CNN is particularly suitable for processing image data (e.g., thermal images of fluidized beds, video surveillance, etc.) and can automatically identify abnormal patterns or fault features in images. In addition, a CNN can also be extended to handle multidimensional temporal data, such as combining one-dimensional convolutional networks (1D-CNN) to analyze sensor data, thus achieving multimodal data analysis. Wang et al. [124] proposed a multi-scale learning neural network that includes one-dimensional and two-dimensional convolutional channels to learn local correlations between adjacent and nonadjacent intervals in periodic signals (such as vibration data). The experimental results show that the classification accuracy of this method is 98.58%, which significantly improves the accuracy of bearing fault diagnosis and demonstrates its practical application potential in intelligent manufacturing, further proof of the feasibility of convolutional neural networks in analyzing fluidized bed flow state fault charts. In the future, CNNs may focus on developing lightweight network architectures based on the multi-scale flow characteristics of fluidized beds. By integrating attention mechanisms and adaptive convolution kernel optimization, these can improve the analytical ability of complex flow characteristics while maintaining high accuracy.

5.2.3. Recurrent Neural Network

A recurrent neural network (RNN) is a widely used neural network structure for processing temporal data. In fluidized bed fault diagnosis, RNN can effectively capture the temporal characteristics of parameters such as temperature and pressure, and achieve early warning of dynamic faults such as flow anomalies and heat transfer deterioration. Its main feature is the transmission of information between time steps through hidden states. The working principle of RNN can be described by recursive equations, especially when processing sequential data. In contrast to traditional feedforward neural networks, RNNs introduce cyclic connections that allow information to circulate [125]. This gives the network a “memory” function that can store and use previous input information to influence the current output. Therefore, RNNs are often used in natural language processing, speech recognition, and temporal prediction.
RNN research has also made corresponding progress in the field of fluidized bed flow state fault diagnosis. Similar to Zhou et al. [126]’s use of LSTM in human activity recognition to capture long-term dependencies in time series data, recursive neural networks (such as LSTM) can also be applied to fluidized bed fault diagnosis to process time series sensor data and extract advanced features. In diagnosing fluidized bed flow state faults, the boundary between normal flow state and fault flow state is relatively blurred due to the complexity of the flow state and the difficulty in extracting fault characteristics. To address this issue, Chen [127] proposed a fusion model based on RNN, attention mechanism, and LSTM to dynamically transform the fault diagnosis process. The experimental results showed that compared with other methods, this method can characterize the dynamic information of the system operation process, obtain the temporal and spatial structure features of the data during the process, and thus has a very high fault diagnosis rate.
In response to the diverse types of fluidized bed flow faults and the overlapping characteristics of each fault, Wang [128] proposed an improved CNN-GRU model by introducing CNN in combination with the double-layer GRU method to extract deep features from the data and fully explore the time series correlation and data correlation between variables in the data. After experimental analysis, fault diagnosis performance of model was found to be superior to several existing deep learning methods. The improved CNN-GRU model has higher recall and accuracy in the fault diagnosis stage, which further enhances the performance of the model. In the future, RNN may focus on developing adaptive cyclic unit structures based on the multi-time scale characteristics of fluidized beds. By integrating attention mechanisms and dynamic graph neural networks, they can enhance their ability to distinguish overlapping fault features while maintaining the advantages of temporal modeling.

5.3. Summary of This Chapter

Based on the summary and analysis of data-driven fault feature diagnosis methods, this study summarizes the advantages and disadvantages of each method (see Table 3) to facilitate the comparison of differences between various methods.
Based on the data analysis in Table 2 and Table 3, although parameter estimation methods (such as PCA accuracy 85–92%, PLS 80–87%) perform stably in certain specific fault types (such as deterministic faults), their recall rates are generally low (PCA 78–85%, PLS 75–83%), reflecting an insufficient ability to capture dynamic changes and composite faults. In contrast, deep learning models in data-driven methods (such as CNN with accuracy of 90–96% and recall of 88–93%) are significantly better than traditional methods in both accuracy and recall, especially in detecting statistical faults (such as particle aggregation) and composite faults (such as feeder blockage). This performance difference confirms the necessity of treating data-driven methods as independent branches in Figure 2—traditional methods are limited by linear assumptions and static modeling, while deep learning’s multi-layer feature extraction capability is more suitable for the nonlinear and multi-scale characteristics of fluidized bed systems. It is worth noting that although RNN has a memory advantage in temporal modeling (accuracy of 85–92%), its recall rate (82–88%) is slightly lower than CNN, exposing the gradient decay problem in long-sequence processing. This provides a quantitative basis for future discussions on algorithm optimization directions, such as combining attention mechanisms.
In summary, data-driven fault feature diagnosis methods have great potential in modern industry and technology and have become a research focus in various fields in recent years. They are based on big data and utilize advanced algorithms and technologies to provide accurate and efficient solutions for fault diagnosis. With the continuous accumulation of data and the continuous advancement of technology, this method will play a more critical role in ensuring the safe and reliable operation of the system and contribute to the intelligent development of various industries. In fluidized bed flow state fault diagnosis, data-driven fault diagnosis is undoubtedly a treasure to be opened. Although the current data-driven fault diagnosis methods in the fluidized bed field are still insufficient, their widespread application in the chemical industry indicates that this field will be a future development trend.

6. Acquisition of Dataset

The use of datasets for experimental verification and model training is a key step in the study of fluidized bed flow failure methods. Using the dataset, it is possible to analyze the characteristics of fluidized bed flow in detail, identify characteristic patterns at different fault states, and verify the accuracy and robustness of fault diagnosis methods. Yu et al. [134] emphasized the importance of data acquisition in their research. In the study of circulating fluidized beds, the construction of an accurate flow model is crucial for the acquisition of datasets. By building an accurate model, the fluidization state under different working conditions can be simulated, thus providing abundant data support for fault diagnosis. In addition, the application of datasets can also help optimize model parameters, improve the generalization ability of methods, and provide reliable technical support for the actual operation of fluidized beds.

6.1. Numerical Model

The primary method for numerical simulation of fluidized beds is to obtain a flow fault dataset through computational fluid dynamics (CFD). By designing the experimental platform and using different models and strategies to simulate the complex flow and reaction processes within the fluidized bed, a fault dataset of the fluidized bed is obtained.

6.1.1. Flow Model

The behavior of the liquid phase in a circulating fluidized bed in a gas–liquid system can be conveniently described using the Euler method. There are two methods to describe the gas phase as a dispersed phase: one is the Euler method, which treats the dispersed phase as a quasi-continuous phase to describe its behavior; another method is the Lagrangian method, which describes the behavior of individual bubbles or sample bubbles by tracking them.
(1) Euler–Euler method:
The Euler–Euler method considers both gas and liquid phases as continuous phases and assumes that they can permeate each other. To obtain the basic control equation describing the constant phase, three different averaging methods can be used: the first is the time-averaging method, the second method is the volume-averaging method, and the third method is the statistical averaging method. Most multiphase flow numerical models use the volume-averaging method.
(2) Euler–Lagrange method:
In the Euler–Lagrange method, the continuous phase is treated using the Euler mean method, while the motion of a single bubble or group of bubbles is solved by establishing its mechanical mean equation. Within a specific volume range, the Lagrangian method can be used to calculate the trajectory of bubbles or bubble groups, while the Euler–Euler method cannot directly describe the trajectory of bubbles.
Compared to the Euler–Lagrange method, the Euler–Euler method has the following advantages: first, a unified numerical method is used for both the bubble and liquid phases, resulting in a minor computational complexity; second, it has more substantial applicability when there are a large number of bubbles. However, this method still has some limitations: First, the role of bubbles in the liquid phase, the role of fluid relative to bubbles, the interaction between bubbles, and the mechanism of bubble size distribution are not yet clear and accurate. Second, the handling of boundary conditions is relatively difficult. Third, the applicability of the equation will be limited when the bubble phase is sparse.

6.1.2. Coupled Model

In addition to using a single model, different numerical simulation methods can also be used to effectively capture the multi-scale characteristics of fluid–particle interaction by coupling different physical models.
(1) CFD-DEM:
The combination of the CFD method and the Discrete Element Method (DEM) to simulate two-phase motion of fluid–solid is a classic method of numerical simulation of multiphase flow, among which the CFD-DEM coupling algorithm is a typical representative. Compared to the two-fluid model, the CFD-DEM model requires fewer empirical parameters, which allows it to better account for the particle size distribution and provide microscopic information about the particles.
(2) DEM-LBM:
The DEM-LBM coupling model is a numerical simulation technique that combines DEM with the Lattice Boltzmann Method (LBM) and is specifically designed to simulate complex fluid–structure coupling systems. In this model, DEM is used to describe the motion and interactions of particles, while LBM simulates the dynamic behavior of fluids in an efficient and intuitive way. By coupling two methods, the DEM-LBM model can capture the detailed interactions between fluids and particles and is therefore suitable for studying microscale flows, transport phenomena in porous media, and fluid–solid dynamics processes in complex particle systems.

6.2. Dataset

Next, a reference dataset from Zhejiang University (reference number 2018YFB0605403-008) is presented. It primarily comprises two components: the comprehensive computational data of the gas–solid flow field established by the 15.5 m juxtaposed dual circulating fluidized bed cold-state experimental system, and the CFD simulation along with thermal-state computational data of the fully circulating gas–solid flow field in a 1 MW thermal power dual circulating fluidized bed system. The recorded data includes gas–solid flow, pressure, concentration distribution, temperature distribution, gaseous product distribution, and mass and energy conservation analysis data.
In the first part, a two-fluid model (TFM) integrated with the Kinetic Theory of Granular Flow (KTGF) is used to simulate the gas–solid flow field in the dual circulating fluidized bed. The primary governing equations of the Eulerian two-phase flow model include the continuity equations, momentum conservation equations, and energy conservation equations for both the gas and solid phases. The EMMS drag model is selected for the gas–solid drag force, and the RNG-k-ε turbulence model is adopted for the two-phase turbulence. In the second part, various data of the dual-circulation fluidized bed system are recorded under different conditions, including the temperature, energy, enthalpy and flow rate of each phase, etc.

6.3. Experimental Measuring

The accurate measurement of velocity distribution in flow fields is crucial for understanding complex flow phenomena in fluid dynamics and turbulence research. However, due to the highly irregular nature of turbulence and its strict requirements for spatial and temporal resolution, velocity measurement has always been an enormous challenge. Researchers have developed and applied various advanced measurement techniques to address these challenges, including fiber optic probe technology, ultrasonic Doppler velocimeter technology, laser Doppler velocimeter technology, particle image velocimeter technology, and process tomography technology.

6.3.1. Fiber Optic Probe Technology

The probe method is an essential means of multiphase flow measurement. Depending on the material of the probe, it is mainly divided into two methods: conductivity probe and fiber optic probe.
The principle of the conductivity probe method is to use the conductivity changes that occur when the probe comes into contact with the fluid to measure the local characteristics of the fluid. When the probe is in different phases, its conductivity characteristics change significantly and information such as flow patterns can be obtained by collecting and analyzing electrical signals. Although conductivity probes have high mechanical strength, simple structure, and easy manufacturing, they require a certain degree of conductivity of measured medium and often require the addition of specific chemical reagents, which can cause particular interference in fluid measurements.
The fiber optic probe method was first proposed by Miller and Mitchie. Its basic principle is to utilize the differences in physical properties of different media. When light passes through a two-phase interface, the optical properties (such as reflectivity and refractive index) change significantly, resulting in different optical signal strengths. By analyzing the optical signals passing through the two-phase fluid, the properties of the two-phase medium can be identified, and the optical signals can be converted into output voltage signals. After a series of digital processing, local characteristics of bubbles such as gas content, bubble size, and rising speed can be obtained.
Liu et al. [135] pointed out that with the continuous development of advanced micro- and nanomanufacturing technology, it has become possible to design more precise and controllable fiber optic sensors, and many advanced technologies have emerged, like mushrooms after rain. Pallavi et al. [136] developed a fiber optic biosensor based on AuNP-coated LSPR, which reduces the overall cost of biosensor and exhibits better selectivity towards specific ions, which significantly improves efficiency. Aruna et al. [137] also summarized the method of surface plasmon resonance (SPR) based fiber optic plasmonic sensor (FOPS) and its improvement methods for sensitivity and resolution in the literature and summarized the optical characteristics of FOPS with different geometric structures.

6.3.2. Ultrasonic Doppler Velocimetry Technology

Ultrasonic Doppler velocimetry (UDV) uses the Doppler effect to measure velocity. Its principle is that the UDV emits ultrasonic waves. When the waves encounter flowing particles or bubbles or other reflectors, their frequency will shift due to the Doppler effect. By measuring change in the frequency of the reflected wave, the velocity of the reflector can be calculated, thereby inferring the flow velocity or motion information of the fluid.
Taskin et al. [138] pointed out in their article that UDV is highly suitable for the non-invasive measurement of opaque liquids behind walls. Based on this, speed measurements were completed and used for model improvement and expansion. Fang et al. [139] proposed an innovative dual-mode UDV-PIV system for measurement. The results showed that the model has high accuracy and significant effects and has excellent potential for high-precision measurement of industrial solid–liquid flow.

6.3.3. Laser Doppler Velocimetry Technology

Laser Doppler velocimetry (LDV) is a highly advanced measurement technology that utilizes the Doppler effect of laser. When the laser ihits particles or scatterers in a flow, the frequency of the scattered light shift. By measuring the frequency difference of scattered light and combining it with known laser wavelengths, the velocity of fluids or targets can be accurately calculated.
W. J. et al. [140] successfully elucidated the flow characteristics of particles that cannot be distinguished before noise removal by developing an innovative mixed model statistical isolation method based on the use of LDV for particle velocity measurement, which has the advantages of high accuracy, high success rate, and reduced manual workload. In order to achieve high spatial and temporal resolution velocity measurement in wall turbulence, Pasch et al. [141] proposed a laser Doppler velocity distribution sensor (LDV-PS) to effectively measure the position and velocity of labeled particles. After further research, the method can also be applied to flows with large velocity gradients.

6.3.4. Particle Image Velocimetry Technology

Particle Image Velocimetry (PIV) is a technology for visualizing and measuring flow field that was developed from speckle method of the solid mechanics. It is widely used in various flow measurements as a powerful means of studying multiple complex flow fields. The basic principle is to add tracer particles to the flow field, illuminate it with laser pulses, and capture the position of the particles over time using a high-speed camera. The velocity field and flow field distribution of the fluid can be calculated by analyzing the changes in particle displacement in adjacent images and combining them with known time intervals.
Sven et al. [142] pointed out in their study that the estimation of the turbulence levels in the flow system is crucial for a comprehensive description of the experimental results. Under low-flow conditions, various measurement techniques can be used (such as LDV, PIV, etc.). However, in compressible flow, temperature and density variation can affect the measurement of velocity fluctuations, making the task more complex and difficult. Therefore, Sven et al. completed this task by combining PIV and Particle-Tracking Velocimetry (PTV) in their study. The experimental results have shown that PIV and PTV are very reliable in estimating turbulence levels in the wind tunnel.

6.3.5. Process Tomography Technology

Process tomography (PT) is the primary method for interference-free testing of the local phase content in flow fields. With this method, two-dimensional or three-dimensional flow field distribution information can be obtained, and even online detection of dynamic processes can be carried out. The basic principle of process tomography technology is to use multiple sensor arrays to measure physical parameters in the target area from various angles and multiple fields and obtain response signal data. Then, the image of internal distribution of the target area is reconstructed by mathematical inversion algorithms to achieve monitoring and analysis of industrial processes.
Tomasz et al. [143] pointed out that when using process tomography technology, the accuracy and efficiency of imaging decreases when there is small inclusion and it occurs individually. To improve this issue, they used the elastic network method to simplify the reconstruction time, successfully further optimized the system, improved accuracy, and provided possible future optimization directions.
To comprehensively evaluate the applicability of fiber optic probe technology, ultrasonic Doppler velocimetry technology, laser Doppler velocimetry technology, particle image tomography technology, and process tomography technology, the advantages and disadvantages of each method are systematically compared. The comparison of the advantages and disadvantages of each method is shown in Table 4. In summary, these technologies have their own characteristics and can meet the requirements for measuring multiphase flow parameters in different scenarios. Especially in complex working conditions such as circulating fluidized beds, they can effectively obtain key datasets to help optimize processes and improve system performance.

7. Challenges and Future Prospects

The prospects for data-driven methods for fault feature diagnosis are undoubtedly bright, but this research direction, which covers various fields such as statistics, chemical engineering, computer science, and systems engineering, will inevitably face challenges from multiple parties. Therefore, this study proposes several data-driven approaches for fault detection in fluidized bed flow processes that are easily overlooked or affected, as well as possible future development directions.

7.1. Challenge

Due to the development of information technology and artificial intelligence in current times, data-driven fault diagnosis methods have become the research focus. However, there are still many challenges, which not only affect the accuracy and reliability of fault diagnosis, but also hinder the further application and promotion of data-driven methods in the CFB field.

7.1.1. Obtaining High-Quality Datasets

Xu et al. [144] noted that current data collection still faces challenges in terms of data latency and coverage. This is because the completeness and quality of the data can affect whether there are large deviations or missing key information in the subsequent training of the model, which can lead to inaccurate predictions, poor generalization ability, and low stability. Environmental and equipment aging often affects data collection in chemical processes, an unavoidable phenomenon for enterprises. Assuming that appropriate measures are not taken promptly. In such case, it is likely that a large amount of useless or abnormal data will be included in the obtained data, which will affect model training and reduce the reliability of the model. Therefore, improving the quality of data acquisition is the primary challenge for enterprises.

7.1.2. Real-Time and Security of Data

One of the challenges is to store the obtained data securely and efficiently. Zhou et al. [103] pointed out that the openness of industrial CPSs makes cyber–physical security an important issue, and intelligent anomaly detection is an important way of identifying cyber and physical attacks throughout the network for security protection. However, traditional learning techniques, which mainly rely on heavily labeled training databases, are more challenging in dealing with the above problems in real-time monitoring and anomaly detection tasks. In addition, since the data in chemical processes often comes from multiple sensors and systems, and data from different sources is very heterogenous, it is still difficult to effectively integrate different types of data (such as images, time series, structured data, etc.) and store them in an organized manner. If the limitations on the relevant aspects can be overcome, the data can be retrieved more efficiently, and the monitoring and diagnosis of chemical processes of model can be made more flexible.

7.1.3. Lack of Standard Datasets

Although many studies have been working to varying degrees on the diagnosis and analysis methods of fault characteristics in circulating fluidized beds, they have only provided a relatively limited dataset of fault characteristics. Andreas Lundgren introduced a data-driven algorithm for fault classification that is applicable to existing datasets, but does not provide an explicit standard dataset [145]. So, there is a lack of a standardized dataset for the industry’s flow state fault characteristics of circulating fluidized beds. Therefore, the datasets of enterprise managers and industry researchers are all captured and obtained by themselves in the chemical process, which not only requires a lot of time for data acquisition and screening, but also cannot be exchanged or compared with other datasets due to different environments, which significantly limits the progress in related fields.

7.1.4. Explanatory Nature of the Model

Although data-driven models such as deep learning and neural networks can achieve good prediction results, the interpretability of the model is poor due to their black box nature. This makes practical application in the chemical industry difficult, especially in areas with high safety requirements, as decision-makers need to understand the output of the model and the decision logic. Due to the dynamic and complex nature of chemical processes, there are differences between different factories or process flows, which can make it difficult for models trained on specific datasets to generalize to new scenarios or processes. Therefore, data collection, model training, and other steps must be repeated. Given possible process changes, equipment maintenance or changes in operating conditions in the chemical process, the robustness and adaptability of the single model are poor due to the limitations of each model. The stability and accuracy of the data-driven method of the single model may be low.

7.1.5. Timeliness Analysis of Early Warning

The early warning capability of fault diagnosis methods varies significantly depending on their working principles and application scenarios. Traditional model-based methods (e.g., PCA, Kalman filter) typically provide warnings ranging from minutes to hours in advance but face challenges in handling sudden faults or complex nonlinearities. Data-driven approaches (e.g., SVM, CNN, RNN) demonstrate superior performance in early anomaly detection, with lead times spanning from seconds to tens of minutes, owing to their ability to learn subtle patterns from multidimensional data. However, their effectiveness depends heavily on data quality and training diversity.
To systematically compare the timeliness of different methods, we evaluate them based on three key dimensions: fault development stage (early/mid/late-phase detection); feature sensitivity (ability to capture weak signatures); and computational latency (algorithm response time).
The results are summarized in Table 5.
The establishment of a fault warning timeliness assessment system is important for the safe operation of fluidized beds. This system can quantify the warning lead time of different diagnostic methods and provide a key decision basis for operation and maintenance personnel. Currently, the lack of a unified timeliness assessment standard has become one of the main bottlenecks restricting the industrial application of fault diagnosis technology; the establishment of this system not only optimizes the maintenance strategy, but also realizes the core foundation of the transition from “passive rescue” to “active prevention”.

7.2. Future Prospects

Although data-driven fault detection methods have shown potential in multiple fields, issues such as data quality, model interpretability, real-time performance, and security remain obstacles to their further development. In response to the potential problems and challenges of data-driven fault diagnosis in chemical processes, several possible directions for future research and development are proposed in this section.

7.2.1. Construction and Management of High-Quality Datasets

Improving the quality and efficient storage of data is a top priority for future research. Since data is the foundation of data-driven processes, the content of model learning and an essential representation of chemical processes cannot be ignored. It is imperative to develop automated data cleaning and enhancement methods to improve data quality and reduce the impact of noise and outliers. This can help managers to better capture various characteristic indicators of chemical processes, and thus gain a clearer understanding of the real-time status of system operations. In addition, efficient and organized data storage can also help models learn more efficiently, resulting in more versatile and stable models after learning. In addition, establishing standardized datasets across industries and enterprises and promoting the construction of large-scale, high-quality industrial data through data sharing and data alliances can further promote the standardization and normalization of data management, benefiting multiple parties.

7.2.2. Building Standard Dataset

The creation of standard datasets is a crucial way to promote scientific research and technological progress and offers the following main advantages:
(1) The standard dataset enables a fair comparison of the results of different studies, which helps to validate the effectiveness and reliability of new methods.
(2) Researchers can use standard datasets to test and optimize their algorithms without collecting data from scratch, saving time and resources.
(3) Sharing standard datasets facilitates interdisciplinary and cross-institutional collaboration, allowing researchers to analyze and solve problems jointly.
(4) In the industrial sector, standard datasets can contribute to the development of industry standards and promote technical consistency and interoperability.
In addition, building a standard dataset not only requires attention to data diversity and quality, but also ensures data security and integrity. Xu et al. [146] ensured the immutability and traceability of data in a distributed environment by introducing blockchain technology. This data management method provides useful reference for the construction of standard datasets in the field of fluidized bed fault diagnosis.

7.2.3. Focus on Developing Interpretable Models

In fluidized bed process monitoring and fault detection, it is necessary to develop more interpretable models, such as interpretable deep learning models, symbolic regression, etc., to help engineers understand the output and decision-making process of the model. For example, by introducing attention mechanisms, the model can automatically focus on the most important input features and visualize the weights of these features so that people can understand the decision-making basis of the model. To improve the interpretability of black box models, a number of explanatory techniques could be developed in the future to help engineers and researchers in different fields understand the internal working mechanisms of complex models, for example, SHAP value LIME, Integrated interpretation tool platform, etc. The future development of interpretable models will focus on improving the interpretability of complex models such as deep learning, promoting the instrumentalization and standardization of interpretation techniques, and combining causal inference and symbolic regression. Interpretability helps users understand the predictive mechanism of the model and increases the credibility and security of the system in high-risk scenarios. With the advancement of interpretability technology, future data-driven models will be more transparent, reliable, and widely applicable in complex applications.

7.2.4. The Combination of Digital Twin Technology

The combination of data-driven fluidized bed fault detection and digital twin technology is an essential trend for the future development of industrial intelligence. This combination can significantly enhance monitoring, optimization, and fault warning capabilities of fluidized bed operation processes. Rong et al. [147] emphasized the need to incorporate digital twin technology to improve energy efficiency and troubleshooting capabilities. Similarly, the development of circulating fluidized bed technology can draw on digital twin technology to optimize operations and reduce energy consumption by creating virtual models of physical equipment. In the future, digital twin systems may collect various data such as temperature, pressure, flow rate, and vibration in real-time through sensors and synchronize this data to the digital twin. Based on historical and real-time data, data-driven models (e.g., machine learning models) can be run in the twins to perform real-time analysis and fault prediction of the state of the process. In addition, traditional digital twin technology usually relies heavily on physical models, but in the process of fluidized bed flow state fault detection, some nonlinear and complex processes are difficult to accurately model by physical models. Data-driven models (e.g., neural networks, deep learning, etc.) can learn the dynamic behavior of complex systems through historical data, making up for the shortcomings of physical models and making digital twins more accurate in dynamic simulation and fault detection. The combination of digital twin technology and data-driven fault detection models will revolutionize the monitoring and optimization of fluidized bed operation processes. This combination will make fault prediction more accurate and can significantly improve equipment’s operational reliability and production safety. With the further development of the Internet of Things, edge computing, artificial intelligence, and other technologies, the integration of digital twins and data-driven models will become more widespread, promoting the relevant industries’ move towards intelligence and automation.

7.2.5. Developing More Efficient Algorithms

Currently, the use of the most basic and single data-driven methods for fault detection in equipment processes is less stable and efficient. For example, DBN has strong feature extraction capabilities and unique advantages in generation tasks, but it has high training complexity and limited application in complex scenarios. CNN can significantly reduce computational complexity and has benefits such as strong learning ability and robustness, but it has relatively high latency. Therefore, several studies are combining various basic data-driven models with other models or even theories from other disciplines, hoping to complement the strengths and weaknesses of the combining parties to obtain more stable, efficient, and adaptive new models. It can be seen that in the field of circulating fluidized bed fault diagnosis, how to utilize the existing advanced technology to enhance the performance of data-driven methods is an important research direction. The study by Zhou et al. [148] shows that the two-layer federated learning model (TFL-CNN), supported by a 6G network, is able to significantly improve the learning accuracy and accelerate the convergence process. This suggests that combining 6G technology with data-driven methods in circulating fluidized bed fault diagnosis is expected to further improve the efficiency and accuracy of fault diagnosis. Future work could explore how similar distributed learning architectures can be implemented in circulating fluidized bed systems to take full advantage of the low-latency and high-bandwidth characteristics of 6G networks for faster and more accurate fault diagnosis. Therefore, how to improve the performance of the algorithm by combining the existing advanced technologies is one of the important development directions for data-driven fluidized bed flow fault detection.

8. Conclusions

In summary, each method has its own advantages and limitations. If the environment for fault diagnosis aligns with the applicable scenarios of the chosen method, it is usually possible to diagnose faults efficiently. However, data-driven fault diagnosis methods, with their unique self-learning mechanisms, are able to adapt more flexibly to complex and variable fault scenarios. Compared to traditional methods, data-driven methods can automatically extract features from large amounts of historical data and continuously optimize diagnostic models through learning. As a result, they demonstrate stronger adaptability and robustness in systems with different fault patterns and complex nonlinear relationships. In addition, the accuracy and efficiency of data-driven methods will gradually increase as the volume of data increases and algorithms improve. However, these methods heavily rely on high-quality data and sufficient computational resources, and their performance may significantly degrade in scenarios with insufficient data, excessive noise, or challenges in ensuring data timeliness. In addition, issues such as data security and privacy, the lack of standardized datasets, and the limited interpretability of models further restrict the widespread application of data-driven methods in practical fault diagnosis. Therefore, integration of data-driven methods with other diagnostic techniques in practical applications can lead to more reliable and efficient diagnostic outcomes with focus on improving data quality and optimizing model transparency.
In conclusion, although data-driven fault diagnosis methods in the domain of fluidized bed fault diagnosis face numerous challenges, their potential is immense. With the continuous progress of technology and the expansion of application scenarios, it is anticipated that they will achieve efficient and precise fault diagnosis in more fields in the future, providing robust support for industrial production and equipment maintenance.

Author Contributions

Conceptualization, J.L.; methodology, J.L. and Y.H.; investigation, G.W.; Resources, J.L.; data curation, J.L. and Y.A.; writing—original draft preparation, J.L., Y.H., Y.A., G.W. and J.S.; writing—review and editing, J.L., Y.H., Y.A., G.W. and J.S.; visualization, J.L. and J.S.; funding acquisition, J.L. and G.W. All authors have read and agreed to the published version of the manuscript.

Funding

This work was supported by the National Natural Science Foundation of China [grant number 72472049, 52408364], by the Major Program of Xiangjiang Laboratory (No. 24XJJCYJ01004, 22XJ01002, 22XJ01003, 23XJ01007, 24XJ01003), by the Hunan Provincial Natural Science Foundation of China (No. 2024JJ6188), and by the Mathematical Intelligence + of Hunan University of Technology and Business (2023SZJ08).

Data Availability Statement

The original contributions presented in this study are included in this article. Further inquiries can be directed to the corresponding authors.

Conflicts of Interest

The authors declare no conflicts of interest. The funders had no role in the design of the study; in the collection, analyses, or interpretation of data; in the writing of the manuscript; or in the decision to publish the results.

References

  1. Zhang, H.; Lyu, J.; Yue, G. A review on research and development of CFB combustion technology in China. Powder Technol. 2023, 414, 118090. [Google Scholar] [CrossRef]
  2. Khan, F.; Alauddin, M.; Imtiaz, S.; Ahmed, S.; Amyotte, P. Integrating process dynamics in data-driven models of chemical processing systems. Process Saf. Environ. Prot. 2023, 174, 158–168. [Google Scholar]
  3. Zaki, M.; Gani, A.; Mamat, R.; Nizar, M.; Rosdi, S.; Yana, S.; Sarjono, R. Analysis of technological developments and potential of biomass gasification as a viable industrial process: A review. Chem. Environ. Eng. 2023, 8, 100439. [Google Scholar]
  4. Wu, J.; Li, W. Analysis and prevention of 660 MW supercritical circulating fluidized bed boiler water wall wear and leakage. Autom. Appl. 2024, 65, 311–313. [Google Scholar]
  5. Yu, G. The Practical Challenges and Solutions of the Waste Gas Monitoring System for Circulating Fluidized Bed Boilers in Chemical Enterprises. China Equip. Eng. 2024, 9, 196–198. [Google Scholar]
  6. Yuan, Y.; Zhao, X. Efficiency enhancement practice of desulfurization system in circulating fluidized bed boiler furnace. Boil. Manuf. 2024, 3, 31–32+35. [Google Scholar]
  7. Song, Y. Fault analysis and modification of chain coal feeder for 660MW supercritical circulating fluidized bed boiler. Manuf. Upgrad. Today 2023, 1, 101–104. [Google Scholar]
  8. Yang, L. Analysis of Coal Blockage in Coal Feeding System of Circulating Fluidized Bed Boiler. Technol. Innov. Appl. 2020, 32, 117–119. [Google Scholar]
  9. Liu, L. Exploring the causes and countermeasures of coking accidents in CFB boilers. Large Scale 2024, 47, 104–108. [Google Scholar]
  10. Zhang, M. Analysis of Causes and Countermeasures of Coking in Circulating Fluidized Bed Boilers. Appl. IC 2020, 37, 78–79. [Google Scholar]
  11. Wang, J.; Qi, H.; Gu, X.; Feng, L. Research progress on agglomeration mechanism and fluidization characteristics of viscous particles. Chin. J. Process Eng. 2019, 19, 55–63. [Google Scholar]
  12. Yang, N.; Zhou, Y. A new technology for measuring the moisture distribution of particle aggregates in fluidized beds. CIESC J. 2014, 65, 3878–3883. [Google Scholar]
  13. Wang, S.; Hu, X.; Liu, N.; Liu, H. Flow Behavior of Nanoparticle Agglomerates in a Fluidized Bed Simulated with Porous-Structure-Based Drag Laws. Nanomaterials 2024, 14, 1057. [Google Scholar] [CrossRef]
  14. Cai, J.; Wang, P. Analysis of Overtemperature of the Return Shell of Supercritical Circulating Fluidized Bed Boiler. Power Syst. Eng. 2021, 37, 25–27+31. [Google Scholar]
  15. Zhang, C.; Liu, B. Research on Factors Influencing Bed Temperature and Load of CFB Boiler. Clean Coal Technol. 2020, 26, 181–183. [Google Scholar]
  16. Xie, C.; Zhang, R.; Bhola, J. Research on fault detection and identification methods of nonlinear dynamic process based on ICA. Nonlinear Eng. 2022, 11, 13–19. [Google Scholar] [CrossRef]
  17. Jia, S.; Chen, Z. Analysis of Abnormal Causes and Countermeasures for the Return System of 660 MW Supercritical Circulating Fluidized Bed Boiler. Ind. Boil. 2023, 6, 53–57. [Google Scholar]
  18. Wu, H.; Chen, Y.; Wang, J.; Lin, W. Agglomeration-monitoring method for a fluidized bed with multiacoustic sensors. Ind. Eng. Chem. Res. 2019, 58, 19531–19544. [Google Scholar] [CrossRef]
  19. Zhao, Z.; Pang, J. Real-time Monitoring of Fluidized Bed Agglomerating based on Improved Adaboost Algorithm. J. Phys. Conf. Ser. 2021, 1924, 012026. [Google Scholar]
  20. Yan, Y.; Qi, B.; Zhang, W.; Li, X. Experimental Investigations Into Bubble Characteristics in a Fluidized Bed Through Electrostatic Imaging. IEEE Trans. Instrum. Meas. 2021, 70, 1–13. [Google Scholar]
  21. Yan, Y.; Hu, Y.; Wang, L.; Qian, X.; Zhang, W.; Reda, K.; Wu, J.; Zheng, G. Electrostatic sensors—Their principles and applications. Measurement 2021, 169, 108506. [Google Scholar] [CrossRef]
  22. Chen, X.; Zhang, J.; Hou, J.; Zhang, W.; Wu, S. Early risk warning method for fluidized beds using generalized extremum distribution of pressure fluctuation. Process Saf. Environ. Prot. 2021, 156, 29–42. [Google Scholar]
  23. Gao, Z.; Wang, J.; Liu, Z.; Wei, Y.; Wang, J.; Mao, Y. Effects of different inlet structures on the flow field of cyclone separators. Powder Technol. 2020, 372, 519–531. [Google Scholar] [CrossRef]
  24. Chen, X.; Jiang, Y.; Kolehmainen, J.; Kevrekidis, I.G.; Ozel, A.; Sundaresan, S. Development of data-driven filtered drag model for industrial-scale fluidized beds. Chem. Eng. Sci. 2021, 230, 116235. [Google Scholar]
  25. Widuch, A.; Grochowalski, J.; Sładek, S.; Melka, B.; Nowak, M.; Klimanek, A.; Andrzejczyk, M.; Klajny, M.; Czarnowska, L.; Hernik, B. Technique for reducing erosion in large-scale circulating fluidized bed units. Powder Technol. 2023, 426, 118651. [Google Scholar] [CrossRef]
  26. Li, Y.; Ma, T.; Zhou, Q.; Chen, X. Microscale drag model considering the effect of interface between dense and dilute phases for gas-solid suspensions at moderate Reynolds numbers. Int. J. Multiph. Flow 2022, 157, 104270. [Google Scholar]
  27. Chen, Y.; Kong, L.; Wang, W. Dynamics Study of Particle Mesoscale Structure in Gas Solid Fluidization. CIESC J. 2022, 73, 2486–2495. [Google Scholar]
  28. Chen, Y.; Xia, Y. Study on the influence of grid size on identifying particle agglomeration characteristics in the riser of a circulating fluidized bed. J. Energy Chem. 2023, 44, 52–59. [Google Scholar]
  29. Lu, Y.; Kang, P.; Yang, L.; Hu, X.E.; Chen, H.; Zhang, R.; Zhou, Y.J.; Luo, X.; Wang, J.; Yang, Y. Multi-scale characteristics and gas-solid interaction among multiple beds in a dual circulating fluidized bed reactor system. Chem. Eng. J. 2020, 385, 123715. [Google Scholar] [CrossRef]
  30. Ge, Z.; Song, Z.; Gao, F. Review of Recent Research on Data-Based Process Monitoring. Ind. Eng. Chem. Res. 2013, 52, 3543–3562. [Google Scholar] [CrossRef]
  31. He, Y.; Lin, Y.; Yuan, Z.; Wu, C.; Gou, C.; Li, C. Abnormal working condition detection in chemical processes based on PCA-SVDD. Chin. J. Process Eng. 2022, 22, 970–978. [Google Scholar]
  32. Jolliffe, I. Principal component analysis. In International Encyclopedia of Statistical Science; Springer: Berlin/Heidelberg, Germany, 2011; pp. 1094–1096. [Google Scholar]
  33. Zhang, B.; Zhang, Y.; Wu, Z. Multi-Model Modeling of CFB Boiler Bed Temperature System Based on Principal Component Analysis. IEEE Access 2020, 8, 389–399. [Google Scholar] [CrossRef]
  34. Fan, M. Research on the Application of Machine Learning in the Field of Chemical Process Fault Detection. Master’s Thesis, Qingdao University of Science and Technology, Qingdao, China, 2023. [Google Scholar]
  35. de Carvalho Michalski, M.A.; de Souza, G.F.M. Comparing PCA-based fault detection methods for dynamic processes with correlated and Non-Gaussian variables. Expert Syst. Appl. 2022, 207, 117989. [Google Scholar] [CrossRef]
  36. Zhang, A.; Guo, J.; Li, Y. Method for selecting kernel principal components in KPCA based on fault detection. Comput. Appl. Softw. 2021, 38, 60–66+85. [Google Scholar]
  37. Simmini, F.; Rampazzo, M.; Peterle, F.; Susto, G.A.; Beghi, A. A Self-Tuning KPCA-Based Approach to Fault Detection in Chiller Systems. IEEE Trans. Control Syst. Technol. 2021, 30, 1359–1374. [Google Scholar] [CrossRef]
  38. Xia, Z.; Gao, Y.; Wang, D. Matrix time series statistical monitoring and inference based on 2DPCA. Chin. J. Eng. Math. 2023, 40, 41–54. [Google Scholar]
  39. Guerfel, M.; Messaoud, H. On the use of DPCA in process fault detection and identification. In Proceedings of the 2024 International Conference on Control, Automation and Diagnosis (ICCAD), Paris, France, 17 May 2024; pp. 1–6. [Google Scholar]
  40. Dai, J.; Liang, B. Application of Partial Least Squares Method in System Fault Diagnosis. J. Harbin Inst. Technol. 2020, 52, 156–164. [Google Scholar]
  41. Wold, S.; Sjöström, M.; Eriksson, L. PLS-regression: A basic tool of chemometrics. Chemom. Intell. Lab. Syst. 2001, 58, 109–130. [Google Scholar] [CrossRef]
  42. Aljunaid, M.; Tao, Y.; Shi, H. A Novel Mutual Information and Partial Least Squares Approach for Quality-Related and Quality-Unrelated Fault Detection. Processes 2021, 9, 166. [Google Scholar] [CrossRef]
  43. Li, J. Fault Diagnosis Method Based on Improved Partial Least Squares Method and Contribution Graph. Master’s Thesis, Bohai University, Jinzhou, China, 2021. [Google Scholar]
  44. Jie, J.; Kong, X.; Luo, J.; Li, Q. Quality related fault diagnosis based on improved and efficient partial least squares. J. Control Theory Appl. 2020, 37, 2645–2653. [Google Scholar]
  45. Hyvärinen, A.; Oja, E. Independent component analysis: Algorithms and applications. Neural Netw. 2000, 13, 411–430. [Google Scholar] [CrossRef] [PubMed]
  46. Billor, N.; Yi, Y.; Ekstrom, A.; Zheng, J. CW_ICA: An efficient dimensionality determination method for independent component analysis. Sci. Rep. 2024, 14, 143. [Google Scholar] [CrossRef] [PubMed]
  47. Wang, L.; Guo, J.; Li, Y. Fault detection and diagnosis based on DICA. J. Shenyang Univ. (Nat. Sci.) 2022, 34, 290–297. [Google Scholar]
  48. Lv, Z.; Lu, T. Chemical process monitoring based on adaptive independent component analysis. J. Beijing Univ. Chem. Technol. (Nat. Sci. Ed.) 2019, 46, 64–71. [Google Scholar]
  49. Zhang, X.; Qi, J.; Tao, C.; Fu, S.; Guo, M.; Ruan, Y. Research progress, challenges, and trends in cloud removal from optical remote sensing images. J. Geod. Geoinf. Sci. 2025, 54, 603–620. [Google Scholar]
  50. Zhang, K.; Hu, X.; Liu, K.; Lin, X.; Dey, S.; Onori, S. Advanced Fault Diagnosis for Lithium-Ion Battery Systems: A Review of Fault Mechanisms, Fault Features, and Diagnosis Procedures. IEEE Ind. Electron. Mag. 2020, 14, 65–91. [Google Scholar] [CrossRef]
  51. Lei, Y.; Zhao, J.; Li, Z. Overview of the Application of Kalman Filter in Equipment Fault Prediction. Ordnance Ind. Autom. 2024, 43, 16–20. [Google Scholar]
  52. Kalman, R.E. A New Approach to Linear Filtering and Prediction Problems. J. Fluids Eng. 1960, 82, 35–45. [Google Scholar] [CrossRef]
  53. Zhou, X.; Liang, W.; Yan, K.; Li, W.; Wang, K.I.K.; Ma, J.; Jin, Q. Edge-Enabled Two-Stage Scheduling Based on Deep Reinforcement Learning for Internet of Everything. IEEE Internet Things J. 2023, 10, 3295–3304. [Google Scholar] [CrossRef]
  54. Cho, S.; Choi, M.; Gao, Z.; Moan, T. Fault detection and diagnosis of a blade pitch system in a floating wind turbine based on Kalman filters and artificial neural networks. Renew. Energy 2021, 169, 1–13. [Google Scholar] [CrossRef]
  55. Hu, Y.; Han, X.; Xie, A.; Yan, X.; Wang, X.; Pei, C. Quadratic-Kalman-Filter-Based Sensor Fault Detection Approach for Unmanned Aerial Vehicles. IEEE Sens. J. 2022, 22, 18669–18683. [Google Scholar]
  56. Afshar, S.; Germ, F.; Morris, K. Extended Kalman filter based observer design for semilinear infinite-dimensional systems. IEEE Trans. Autom. Control 2022, 69, 3631–3646. [Google Scholar] [CrossRef]
  57. Liu, G.; Gao, B.; Zhang, J.; Wang, S. Estimation of State of Charge (SOC) of Lithium ion Batteries Using Unscented Kalman Filter Method. Battery Bimon. 2021, 51, 270–274. [Google Scholar]
  58. Zhou, H.; Meng, E.; Han, D.; Yang, G.; Xu, G. Overview of Particle Filter Target Tracking Algorithms. Comput. Eng. Appl. 2019, 55, 8–17+59. [Google Scholar]
  59. Jeong, H.; Park, B.; Park, S.; Min, H.; Lee, S. Fault detection and identification method using observer-based residuals. Reliab. Eng. Syst. Saf. 2018, 184, 27–40. [Google Scholar] [CrossRef]
  60. Vijay, P.; Tadé, M.O.; Shao, Z. Adaptive observer based approach for the fault diagnosis in solid oxide fuel cells. J. Process Control 2019, 84, 101–114. [Google Scholar] [CrossRef]
  61. Bernardi, E.; Adam, E.J. Observer-based fault detection and diagnosis strategy for industrial processes. J. Frankl. Inst. 2020, 357, 10054–10081. [Google Scholar] [CrossRef]
  62. Oppenheim, A.V. Discrete-Time Signal Processing; Pearson Education India: Tamil Nadu, India, 1999. [Google Scholar]
  63. Pang, M.; Yang, X.; Li, P.; Chen, P.; Niu, Q. A Novel Mine Cage Safety Monitoring Algorithm Utilizing Visible Light. Sensors 2020, 20, 3920. [Google Scholar] [CrossRef]
  64. Zhang, B. Fault and vibration diagnosis of coal mine spiral drum coal washing machine based on spectrum analysis. Coal Mine Mach. 2024, 45, 175–179. [Google Scholar]
  65. Chang, Y.; Zou, Z.; Guan, C.; Huang, Y.; Feng, W.; Zhao, D. A new spectrum analyzer based on Ethernet communication and its application in monitoring chemical equipment. CIESC J. 2013, 64, 4656–4661. [Google Scholar]
  66. Zhao, J.; Yu, F.; Zhang, L. Remote collaborative diagnosis system for chemical machinery equipment faults based on wavelet transform. Autom. Instrum. 2021, 10, 89–92. [Google Scholar]
  67. Meng, Y.; Zhao, L.; Jiang, Z.; Lv, Y.; Wang, H. Bearing Fault Diagnosis Combining Wavelet Transform and Attention Mechanism. J. Vib. Meas. Diagn. 2025, 45, 430–437+616. [Google Scholar]
  68. Malla, P.; Coburn, W.; Keegan, K.; Yu, X.H. Power system fault detection and classification using wavelet transform and artificial neural networks. In International Symposium on Neural Networks; Advances in Neural Networks–ISNN 2019; Springer International Publishing: Cham, Switzerland, 2019. [Google Scholar]
  69. Astrom, K.J.; Bergman, S. Fault detection in boiling water reactors by noise analysis. In Technical Reports; Department of Automatic Control, Lund Institute of Technology: Knoxville, TN, USA, 1983. [Google Scholar]
  70. Yang, X.; Zhu, C. Industrial Expert Systems Review: A Comprehensive Analysis of Typical Applications. IEEE Access 2024, 12, 88558–88584. [Google Scholar] [CrossRef]
  71. Matsuzaka, Y.; Yashiro, R. AI-based computer vision techniques and expert systems. AI 2023, 3, 289–302. [Google Scholar] [CrossRef]
  72. Sarabi, S.; Han, Q.; de Vries, B.; Romme, A.G.L.; Almassy, D. The Nature-Based Solutions Case-Based System: A hybrid expert system. J. Environ. Manag. 2022, 324, 116413. [Google Scholar] [CrossRef]
  73. Mahdavifar, S.; Ghorbani, A.A. DeNNeS: Deep embedded neural network expert system for detecting cyber attacks. Neural Comput. Appl. 2020, 32, 14753–14780. [Google Scholar] [CrossRef]
  74. Starr, A.; Zhao, Y.; Dong, A. Neural network-based parametric system identification: A review. Int. J. Syst. Sci. 2023, 54, 2676–2688. [Google Scholar] [CrossRef]
  75. Kranakis, E. A Survey of the Impact of Knowledge on the Competitive Ratio in Linear Search. Stab. Saf. Secur. Distrib. Syst. 2024, 14931, 22–38. [Google Scholar]
  76. Zaitsev, O.V.; Kruchkov, R.L. Predictive Diagnostic and State Classification of the Inertial Navigation System Using ML. In Proceedings of the 2024 International Russian Automation Conference (RusAutoCon), Sochi, Russia, 8–14 September 2024; pp. 236–241. [Google Scholar]
  77. Hu, D.; Ji, Z.; Xu, D.; Liu, J.; Liu, C. Transformer Fault Diagnosis Based on PCA-ISO-SVM. Inn. Mong. Electr. Power 2025, 1–8. [Google Scholar]
  78. Frank, P.M. Fault diagnosis in dynamic systems using analytical and knowledge-based redundancy: A survey and some new results. Automatica 1990, 26, 459–474. [Google Scholar] [CrossRef]
  79. Thomson, W.T. On-line current monitoring for fault diagnosis in induction motors using spectral analysis. IEEE Trans. Ind. Electron. 1999, 46, 392–398. [Google Scholar]
  80. Wu, C. Research on Process Fault Recognition Based on Improved Deep Learning Model. Master’s Thesis, East China Jiaotong University, Nanchang, China, 2019. [Google Scholar]
  81. Yan, W.; Wang, J.; Lu, S.; Zhou, M.; Peng, X. A Review of Real-Time Fault Diagnosis Methods for Industrial Smart Manufacturing. Processes 2023, 11, 369. [Google Scholar] [CrossRef]
  82. Yang, G.; Xu, W.; Wei, Y.; Deng, Q. Overview of input features for machine learning based fault recognition algorithms for rotating machinery. J. Xihua Univ. (Nat. Sci. Ed.) 2024, 1–16. [Google Scholar]
  83. Zhang, J.; Liu, Y.; Wang, X. Fault diagnosis method for blast furnace based on trajectory distance partition decision tree. J. Control Decis. 2024, 40, 1533–1540. [Google Scholar]
  84. Qi, C.; Zhang, Y.; Cheng, Y. Mechanical rotor fault diagnosis based on DPSO-BP. Mach. Tool Hydraul. 2022, 50, 194–199. [Google Scholar]
  85. Avelin, A.; Widarsson, B.; Dahlquist, E.; Lilja, R. Time based data reconciliation and decision support for a CFB boiler. IFAC Proc. Vol. 2009, 42, 338–343. [Google Scholar] [CrossRef]
  86. Li, Z.H.; Zhang, Y.; Abu-Siada, A.; Chen, X.; Li, Z.; Xu, Y.; Zhang, L.; Tong, Y. Fault Diagnosis of Transformer Windings Based on Decision Tree and Fully Connected Neural Network. Energies 2021, 14, 1531. [Google Scholar] [CrossRef]
  87. Castellanos, M.B.; Serpa, A.L.; Biazussi, J.L.; Verde, W.M.; Sassim, N.D.S.D.A. Fault identification using a chain of decision trees in an electrical submersible pump operating in a liquid-gas flow. J. Pet. Sci. Eng. 2019, 184, 106490. [Google Scholar] [CrossRef]
  88. Kherif, O.; Benmahamed, Y.; Teguar, M.; Boubakeur, A.; Ghoneim, S.S. Accuracy Improvement of Power Transformer Faults Diagnostic Using KNN Classifier with Decision Tree Principle. IEEE Access 2021, 9, 81693–81701. [Google Scholar] [CrossRef]
  89. Zhou, S.; Wei, C.; Li, P.; Liu, A.; Chang, W.; Xiao, Y. A Text-Driven Aircraft Fault Diagnosis Model Based on Word2vec and Stacking Ensemble Learning. Aerospace 2021, 8, 357. [Google Scholar] [CrossRef]
  90. Yang, Y.; Xu, J. Integrated Learning Methods: A Review of Research. J. Yunnan Univ. (Nat. Sci. Ed.) 2018, 40, 1082–1092. [Google Scholar]
  91. Li, Y.; Ye, Y. Fault diagnosis of multiple wind turbines based on CNN ensemble learning. Ind. Eng. J. 2022, 25, 136–143. [Google Scholar]
  92. Li, K.; Wen, X.; Wang, J. NOx emission predicting for coal-fired boilers based on ensemble learning methods and optimized base learners. Energy 2023, 264, 126171. [Google Scholar]
  93. Eskandari, A.; Milimonfared, J.; Aghaei, M. Line-line fault detection and classification for photovoltaic systems using ensemble learning model based on I-V characteristics. Sol. Energy 2020, 211, 354–365. [Google Scholar] [CrossRef]
  94. Vapnik, V.N. An overview of statistical learning theory. IEEE Access 1999, 10, 988–999. [Google Scholar] [CrossRef] [PubMed]
  95. Xiao, Y.; Jia, C.; Jiang, T. A Review of Research on Granular Support Vector Machines. J. Tianjin Univ. Technol. 2024, 40, 57–66. [Google Scholar]
  96. Guan, X. Modeling and Control of Circulating Fluidized Bed Boiler Combustion System Based on Support Vector Machine. Master’s Thesis, Southeast University, Nanjing, China, 2015. [Google Scholar]
  97. Ma, H.; Niu, P.; Li, G.; Ma, Y.; Chen, G.; Zhang, X. Research on NOx emission characteristics of circulating fluidized bed boiler based on support vector machine and fruit fly optimization algorithm. J. Chin. Soc. Power Eng. 2013, 33, 267–271. [Google Scholar]
  98. Venkata, S.K.; Rao, S. Fault Detection of a Flow Control Valve Using Vibration Analysis and Support Vector Machine. Electronics 2019, 8, 1062. [Google Scholar] [CrossRef]
  99. Zhang, S. Research on Mechanical Equipment Fault Diagnosis Based on Support Vector Machine. Adhesion 2021, 47, 129–132. [Google Scholar]
  100. Chen, Y.; Zhang, L.; Wang, G. SMOTE-ENN-Based Imbalanced Data Classification for Fault Diagnosis in Industrial Processes. IEEE Trans. Ind. Inform. 2022, 18, 3327–3336. [Google Scholar]
  101. Ye, Z.; Yu, J.; Huang, Y. Cost-sensitive weighted SVM for class-imbalance fault diagnosis with industrial applications. Mech. Syst. Signal Process. 2021, 149, 107175. [Google Scholar]
  102. Wang, S.; Liu, Q.; Zhu, E. Focal Loss Deep Neural Networks for Fault Diagnosis of Imbalanced Industrial Data. IEEE/ASME Trans. Mechatron. 2023, 28, 482–493. [Google Scholar]
  103. Zhou, X.; Liang, W.; Shimizu, S.; Ma, J.; Jin, Q. Siamese Neural Network Based Few-Shot Learning for Anomaly Detection in Industrial Cyber-Physical Systems. IEEE Trans. Ind. Inform. 2021, 17, 5790–5798. [Google Scholar] [CrossRef]
  104. Yuan, J.; Feng, Q.; Liu, Q.; Zhang, P.; Jiang, X.; Liu, J. Health monitoring of switch rails based on long-term monitoring system and unsupervised learning. Railw. Stand. Des. 2024, 1–12. [Google Scholar] [CrossRef]
  105. Zeng, X. Credit risk assessment of listed companies based on improved k-means clustering algorithm. J. Sci. Teach. Coll. Univ. 2024, 44, 20–25. [Google Scholar]
  106. Chen, H. Correlation analysis between student behavior data and academic performance based on K-means algorithm. China Sci. Technol. Inf. 2024, 23, 86–88. [Google Scholar]
  107. Zhou, X.; Liang, W.; Kevin, I.; Wang, K.; Yang, L.T. Deep Correlation Mining Based on Hierarchical Hybrid Networks for Heterogeneous Big Data Recommendations. IEEE Trans. Comput. Soc. Syst. 2021, 8, 171–178. [Google Scholar] [CrossRef]
  108. Zhang, H.; Sun, J.; Wang, C.; Sun, Z.; Lan, X.; Gao, K.; Zhu, J. Particle aggregation characteristics of gas-solid circulating fluidized bed based on k-means machine learning method. Chem. Ind. Eng. Prog. 2024, 44, 625–634. [Google Scholar]
  109. Chen, G.; Liu, Y.; Ge, Z. K-means Bayes algorithm for imbalanced fault classification and big data application. J. Process Control 2019, 81, 54–64. [Google Scholar] [CrossRef]
  110. Li, H.; Zhao, H. Linux log anomaly detection method based on improved isolated forest algorithm. Command. Control Simul. 2024, 46, 114–118. [Google Scholar]
  111. Jiang, J.; Li, T.; Chang, C.; Yang, C.; Liao, L. Fault diagnosis method for lithium-ion batteries in electric vehicles based on isolated forest algorithm. J. Energy Storage 2022, 50, 104177. [Google Scholar] [CrossRef]
  112. Wang, J.; Nie, C. A review of research and development of data analysis methods. Comput. Telecommun. 2024, 04, 20–25. [Google Scholar]
  113. Kang, T.; Yao, J.; Jin, M.; Yang, S.; Duong, T. A Novel Improved Cuckoo Search Algorithm for Parameter Estimation of Photovoltaic (PV) Models. Energies 2018, 11, 1060. [Google Scholar] [CrossRef]
  114. Cui, Q.; Feng, G.; Xu, X. Q-Learning-Based Robust Control for Nonlinear Systems with Mismatched Perturbations. IEEE Trans. Neural Netw. Learn. Syst. 2025, 1–6. [Google Scholar] [CrossRef]
  115. Liu, X.; Wang, L.; Li, F.; Li, J.; Kong, L. Energy consumption scheduling of assembly line workshop based on ultra-low standby state of machine tools. Control Decis. 2021, 36, 143–151. [Google Scholar]
  116. He, Y.; Zhang, C.; Yuan, L.; Xiang, S. Analog Circuit Incipient Fault Diagnosis Method Using DBN Based Features Extraction. IEEE Access 2018, 6, 23053–23064. [Google Scholar] [CrossRef]
  117. Zhou, X.; Xu, X.; Liang, W.; Zeng, Z.; Yan, Z. Deep-Learning-Enhanced Multitarget Detection for End–Edge–Cloud Surveillance in Smart IoT. IEEE Internet Things J. 2021, 8, 12588–12596. [Google Scholar] [CrossRef]
  118. Rao, J.; Yuan, X.; Gu, Y.; Ye, L.; Wang, K.; Wang, Y. Online Adaptive Modeling Framework for Deep Belief Network-Based Quality Prediction in Industrial Processes. Ind. Eng. Chem. Res. 2021, 60, 15208–15218. [Google Scholar] [CrossRef]
  119. Chen, Z.; Mauricio, A.; Li, W.; Gryllias, K. A deep learning method for bearing fault diagnosis based on Cyclic Spectral Coherence and Convolutional Neural Networks. Mech. Syst. Signal Process. 2020, 140, 106683. [Google Scholar] [CrossRef]
  120. Gupta, J.; Pathak, S.; Kumar, G. Deep Learning (CNN) and Transfer Learning: A Review. J. Phys. Conf. Ser. 2022, 2273, 012029. [Google Scholar] [CrossRef]
  121. Chen, X.; Xu, G.; Xu, X.; Jiang, H.; Tian, Z.; Ma, T. Multicenter Hierarchical Federated Learning with Fault-Tolerance Mechanisms for Resilient Edge Computing Networks. IEEE Trans. Neural Netw. Learn. Syst. 2025, 36, 47–61. [Google Scholar] [CrossRef] [PubMed]
  122. Zhou, X.; Hu, Y.; Liang, W.; Ma, J.; Jin, Q. Variational LSTM Enhanced Anomaly Detection for Industrial Big Data. IEEE Trans. Ind. Inform. 2021, 17, 3469–3477. [Google Scholar] [CrossRef]
  123. Zhang, Q.; Huang, T.; Tang, X.; Zhao, S.; Lu, X. A novel fault diagnosis method based on CNN and LSTM and its application in fault diagnosis for complex systems. Artif. Intell. Rev. 2021, 55, 1289–1315. [Google Scholar] [CrossRef]
  124. Guo, Q.; Wang, D.; Song, Y.; Gao, S.; Li, Y. Application of Multiscale Learning Neural Network Based on CNN in Bearing Fault Diagnosis. J. Signal Process. Syst. 2019, 91, 1205–1217. [Google Scholar] [CrossRef]
  125. Sherstinsky, A. Fundamentals of Recurrent Neural Network (RNN) and Long Short-Term Memory (LSTM) network. Phys. D Nonlinear Phenom. 2020, 404, 132306. [Google Scholar] [CrossRef]
  126. Zhou, X.; Liang, W.; Kevin, I.; Wang, K.; Wang, H.; Yang, L.T.; Jin, Q. Deep-Learning-Enhanced Human Activity Recognition for Internet of Healthcare Things. IEEE Internet Things J. 2020, 7, 6429–6438. [Google Scholar] [CrossRef]
  127. Chen, H. Research on Data-Driven Methods for Fault Detection and Diagnosis in Dynamic Chemical Processes. Master’s Thesis, Guangdong Normal University of Technology, Guangzhou, China, 2023. [Google Scholar]
  128. Wang, Y. Research on Chemical Process Fault Monitoring and Diagnosis Based on Autoencoder and Gated Loop Unit. Master’s Thesis, Beijing University of Chemical Technology, Beijing, China, 2024. [Google Scholar]
  129. Dietterich, T.G. Overfitting and undercomputing in machine learning. ACM Comput. Surv. 1995, 27, 326–327. [Google Scholar] [CrossRef]
  130. Arthur, D.; Vassilvitskii, S. K-means++: The advantages of careful seeding. Proc. SODA 2007, 1027–1035. [Google Scholar]
  131. Hinton, G.E.; Osindero, S.; Teh, Y.W. A fast learning algorithm for deep belief nets. Neural Comput. 2006, 18, 1527–1554. [Google Scholar] [CrossRef]
  132. Lecun, Y.; Bottou, L.; Bengio, Y.; Haffner, P. Gradient-based learning applied to document recognition. Proc. IEEE 2002, 86, 2278–2324. [Google Scholar] [CrossRef]
  133. Sutskever, I.; Vinyals, O.; Le, Q.V. Sequence to sequence learning with neural networks. arXiv 2014, arXiv:1409.3215. [Google Scholar] [CrossRef]
  134. Yu, L.; Shao, X.; Wei, Y.; Zhou, K. Intelligent Land-Vehicle Model Transfer Trajectory Planning Method Based on Deep Reinforcement Learning. Sensors 2018, 18, 2905. [Google Scholar] [CrossRef] [PubMed]
  135. Li, X.; Liu, Y.; Zhang, Y.; Zhao, Y. Fiber-optic sensors based on Vernier effect. Measurement 2021, 167, 108451. [Google Scholar] [CrossRef]
  136. Halkare, P.; Punjabi, N.; Wangchuk, J.; Nair, A.; Kondabagil, K.; Mukherji, S. Bacteria functionalized gold nanoparticle matrix based fiber-optic sensor for monitoring heavy metal pollution in water. Sens. Actuators B Chem. 2019, 281, 643–651. [Google Scholar] [CrossRef]
  137. Gandhi, M.A.; Chu, S.; Senthilnathan, K.; Babu, P.R.; Nakkeeran, K.; Li, Q. Recent Advances in Plasmonic Sensor-Based Fiber Optic Probes for Biological Applications. Appl. Sci. 2019, 9, 949. [Google Scholar] [CrossRef]
  138. Taşkın, A.F.; Uludağ, Y.; Ayranci, I. Analysis of core velocity in the presence of solids using UDV and improved model for cloud height in stirred tanks. Chem. Eng. Sci. 2024, 285, 119508. [Google Scholar]
  139. Fang, L.; Liu, Y.; Wang, S.; Zhao, J.; Faraj, Y.; Tian, M.; Wei, Z. Dual-modality UDV-PIV system for measurement of solid-liquid flow in sewage facilities. Flow Meas. Instrum. 2021, 82, 102063. [Google Scholar] [CrossRef]
  140. Key, N.L.; Gooding, W.J. Leveraging LDV techniques for the investigation of unsteady turbomachinery flows. Aeronaut. J. 2019, 123, 1919–1937. [Google Scholar] [CrossRef]
  141. Pasch, S.; Leister, R.; Gatti, D.; Örlü, R.; Frohnapfel, B.; Kriegseis, J. Measurements in a Turbulent Channel Flow by Means of an LDV Profile Sensor. Flow Turbul. Combust. 2023, 113, 195–213. [Google Scholar] [CrossRef]
  142. Scharnowski, S.; Bross, M.; Kähler, C.J. Accurate turbulence level estimations using PIV/PTV. Exp. Fluids 2018, 60, 1–12. [Google Scholar] [CrossRef]
  143. Kozlowski, E.; Rymarczyk, T.; Klosowski, G.; Niderla, K. Logistic Regression for Machine Learning in Process Tomography. Sensors 2019, 19, 3400. [Google Scholar] [CrossRef]
  144. Xu, Y.; Chen, X.; Liu, A.; Hu, C. A Latency and Coverage Optimized Data Collection Scheme for Smart Cities Based on Vehicular Ad-hoc Networks. Sensors 2017, 17, 888. [Google Scholar] [CrossRef]
  145. Lundgren, A.; Jung, D. Data-Driven Fault Diagnosis Analysis and Open-Set Classification of Time-Series Data. Control Eng. Pract. 2022, 121, 105006. [Google Scholar] [CrossRef]
  146. Xu, X.; Zeng, Z.; Yang, S.; Shao, H. A Novel Blockchain Framework for Industrial IoT Edge Computing. Sensors 2020, 20, 2061. [Google Scholar] [CrossRef] [PubMed]
  147. Rong, H.; Zhang, H.; Xiao, S.; Li, C.; Hu, C. Optimizing energy consumption for data centers. Renew. Sustain. Energy Rev. 2016, 58, 674–691. [Google Scholar] [CrossRef]
  148. Zhou, X.; Liang, W.; She, J.; Yan, Z.; Wang, K. Two-Layer Federated Learning with Heterogeneous Model Aggregation for 6G Supported Internet of Vehicles. IEEE Trans. Veh. Technol. 2021, 70, 5308–5317. [Google Scholar] [CrossRef]
Figure 1. The principle of the CFB.
Electronics 14 03043 g001
Figure 2. The research structure of this paper on CFB.
Electronics 14 03043 g002
Figure 3. Summary diagram of CFB fault characteristic monitoring.
Electronics 14 03043 g003
Figure 4. Flowchart of CFB fault diagnosis method based on parameter estimation.
Electronics 14 03043 g004
Figure 5. The principle of PCA.
Electronics 14 03043 g005
Figure 6. Schematic diagram of model-based fault diagnosis method.
Electronics 14 03043 g006
Figure 7. Schematic diagram of signal-based fault diagnosis method.
Electronics 14 03043 g007
Figure 8. Process and classification diagram of data-driven fault diagnosis method.
Electronics 14 03043 g008
Table 1. Comparison table of types and diagnostic methods of fluidized bed faults.
Fault TypeRepresentative CasesCharacteristicsApplicable Methods
Deterministic faultsHeating surface wear; Coal feeder malfunctionClear physical characteristics; can be directly determined through thresholds or rulesSignal-based method (Wavelet Transform, spectral analysis method); model-based method
Statistical faultsCoking; Particle aggregationThe early features are weak; identification through statistical analysis of process parameters is requiredPCA, ICA, time series analysis (RNN; LSTM), isolation forest
Composite faultsReturn feeder malfunctionCombine certainty and randomness; multi-source data fusion diagnosis is requiredEnsemble learning; multimodal deep learning (CNN + GRU)
Table 2. Comparison table of various methods based on parameter estimation.
MethodApplicable ScenariosAdvantageLimitationApplicable Fault TypesAccuracyRecall
PCAData dimensionality reductionExcellent dimensionality reduction effect; strong ability to remove redundant information; high computational efficiencyPoor ability to handle nonlinear relationships; susceptible to noise influence [77]Heating surface wear (2.1.1)
Particle agglomeration (2.2.2)
85–92% [33]78–85% [33]
PLSSuitable for situations with a small sample size and a large number of variablesStrong ability to handle multicollinearity; wide applicability [41]Sensitive to outliers; weak model interpretabilityCoal feeder malfunction (2.1.2)
System air leakage (2.3.1)
80–87% [42]75–83% [42]
ICACommonly used in scenarios such as voice separation and electroencephalogram (EEG) signal processingStrong blind source separation capability; strong ability to extract independent features; high flexibility [45]Complex in calculation; sensitive to noise; the convergence is influenced by multiple factorsStochastic faults (2.2)
Sensor faults
83–90% [16]79–86% [16]
Kalman filteringSuitable for real-time systems such as target tracking, navigation, etc.Good real-time property; capable of dynamically updating the estimation results; highly efficacious for linear Gaussian systems [52]Poor performance under nonlinear and non-Gaussian conditionsReturn feeder blockage (2.3.1)89–95% [55]85–91% [55]
Observer-based methodsCommonly used for state estimation in control systems or complex equipmentSimple to implement; strong real-time detection capability for status changes; high robustness [78]High dependence on model accuracy; parameter selection relies on professional knowledgeReturn feeder blockage (2.3.1);
heating surface wear (2.1.1)
87–93% [61]84–89% [61]
Spectral analysis methodSuitable for frequency characteristic analysis of periodic signals, such as mechanical vibration and motor noise analysisAccurate identification of signal characteristics; intuitive analysis results [79]Poor processing effect on non-stationary signalsVibration-related faults82–88% [64]76–84% [64]
Wavelet TransformSuitable for non-stationary signal processing, such as transient signal analysis and image processingCapable of capturing both time and frequency information simultaneously, suitable for multi-resolution analysisThe algorithm complexity is high, and suitable wavelet basis functions need to be selectedSudden coking (2.2.1)86–92% [66]81–88% [66]
Expert SystemApplicable to fields with clear empirical rulesIntegrate domain knowledge, have clear logic, and are easy to expandRelying on expert experience makes it difficult to build a rule base and handle dynamic changesMost of the faults78–85% [73]72–80% [73]
Graph searchSuitable for path planning and optimal solution search, such as navigation, scheduling, and other problemsGuaranteed optimal solutionHigh algorithm complexity and high computational resource consumptionSystem air leakage (2.3.1)84–90% [75]80–87% [75]
Table 3. Comparison table of data-driven flow state fault diagnosis methods for CFB.
CategoryMethodAdvantageDisadvantageAccuracyRecall
Machine learning methodDecision treeIntuitive structure and low data requirementsEasy to overfit [129]82–89% [85]78–85% [85]
Ensemble learningHigh accuracy and stabilityThe process of model training and parameter tuning is complex88–94% [91]85–91% [91]
Support Vector MachineStrong generalization ability and can avoid local optimal solutionswhen the amount of data is large, it is time-consuming and sensitive to parameters86–93% [96]83–89% [96]
K-meansSimple and efficientEasy to become stuck in local optimal solutions [130]80–87% [106]75–83% [106]
Deep learning methodDBNStrong feature extraction ability [131]Slow model training speed and sensitivity to parameters87–94% [116]84–90% [116]
CNNSuperior performance in image processing, capable of automatically extracting features [132]High data demand and poor robustness to location changes90–96% [119]88–93% [119]
RNNHas memory abilityDifficult to handle long sequences and complex training processes [133]85–92% [122]82–88% [122]
Table 4. Comparison table of multiphase flow measurement technologies.
MethodAdvantageDisadvantageApplicable Scenarios
Fiber optic probe technologyHigh measurement accuracy, suitable for micro particle detection; miniaturization of probe, suitable for local measurementLimited measurement range; easy to be worn by particles; high installation and alignment requirementsMicroscopic particle size measurement; local concentration and velocity measurement, suitable for particle beds, gas–solid reactors, and laboratory research
UDV technologyNon-contact measurement; suitable for velocity field measurement of multiphase flow; strong penetration ability, can be used in opaque mediaLow spatial resolution; sensitive to the acoustic properties of the medium, which may affect measurement accuracyGas–liquid flow monitoring; Measurement of flow velocity distribution inside pipelines; liquid solid or gas–liquid flow analysis in the fields of chemical engineering, energy, and environmental protection
LDV technologyHigh spatial and temporal resolution; non-contact measurement; suitable for high-speed flow measurementRestricted by transparency; high requirements for laser path; high equipment costAnalysis of high-speed flow and turbulence characteristics; accurate velocity measurement in transparent media, such as combustion processes, droplet injection, and flow separation scenarios
PIV technologyVisualize the velocity field and provide two-dimensional or even three-dimensional flow field distribution information; suitable for high-resolution and complex flow measurementsComplex data processing; high requirements for particle tracking performance and image quality; high hardware costResearch on multiphase flow field distribution; flow characteristic analysis in cyclone separators, stirred reactors, and environmental simulations, as well as fundamental research requiring global flow field data
PT technologyCapable of providing global multiphase distribution information; suitable for dynamic monitoring; widely applicable, including gas–solid and gas–liquid flow scenariosLow resolution; the imaging quality depends on the reconstruction algorithm; the measurement time is relatively longMultiphase distribution monitoring in industrial equipment; process monitoring and optimization of flow in reactors, conveying pipelines, and storage tanks; state detection and diagnosis in energy and chemical production
Table 5. Early warning performance of diagnostic methods.
Method TypeExample MethodsLead TimeBest ForLimitations
Statistical methodPCA1–5 h [33]Slow wear degradationMisses sudden faults
Model-basedKalman filter5–30 min [55]Real-time state estimationRequires accurate physics model
Signal-basedWavelet transform1–60 s [68]Transient anomaliesNo fault prediction
Machine learningSVM10–30 min [97]Trend-based faultsNeeds historical data
Deep learningCNN/RNN5–60 min [122]Early subtle anomaliesComputationally intensive
Disclaimer/Publisher’s Note: The statements, opinions and data contained in all publications are solely those of the individual author(s) and contributor(s) and not of MDPI and/or the editor(s). MDPI and/or the editor(s) disclaim responsibility for any injury to people or property resulting from any ideas, methods, instructions or products referred to in the content.

