Abstract
Falls are a major safety concern in physically demanding occupations such as roofing, where workers operate on inclined surfaces under unstable postures. While inertial measurement units (IMUs) are widely used in wearable fall detection systems, they often fail to capture early indicators of instability related to foot–ground interactions. This study evaluates the effectiveness of plantar pressure sensors, alone and combined with IMUs, for fall detection on sloped surfaces. We collected data in a controlled laboratory environment using a custom-built roof mockup with incline angles of 0°, 15°, and 30°. Participants performed roofing-relevant activities, including standing, walking, stooping, kneeling, and simulated fall events. Statistical features were extracted from synchronized IMU and plantar pressure data, and multiple machine learning models were trained and evaluated, including traditional classifiers and deep learning architectures, such as MLP and CNN. Our results show that integrating plantar pressure sensors significantly improves fall detection. A CNN using just three IMUs and two plantar pressure sensors achieved the highest F1 score of 0.88, outperforming the full 17-sensor IMU setup. These findings support the use of multimodal sensor fusion for developing efficient and accurate wearable systems for fall detection and physical health monitoring.
1. Introduction
Falls are the second leading cause of unintentional injury deaths globally, with adults over the age of 60 accounting for the majority of fatal incidents [1]. In occupational settings such as construction, the risk is further elevated due to the physical demands and hazardous environments involved. Among construction tasks, roofing is particularly high-risk because it requires workers to maintain unstable postures on inclined surfaces. The impact of falls extends beyond immediate injury; prolonged inactivity caused by falls often leads to secondary health issues such as social isolation, infections, and deep vein thrombosis [2,3,4,5].
Wearable fall detection systems have emerged as promising tools for mitigating fall-related risks, particularly in aging populations and high-risk occupations. These systems typically rely on inertial measurement units (IMUs), such as accelerometers and gyroscopes, to detect abrupt motion changes associated with falls [6,7]. For instance, spikes in acceleration data can effectively differentiate falls from ordinary movements, as demonstrated in smartwatch-based systems like SmartFall [8].
However, IMU-based methods face several critical limitations. They are prone to false positives when users perform sudden but non-harmful movements, such as sitting down quickly or stumbling without falling [8,9,10]. More fundamentally, IMUs primarily capture internal body dynamics and do not directly measure external interactions with the ground—such as loss of foot pressure or shifts in weight distribution—that often precede an actual fall. Additionally, existing IMU-based fall detection systems have rarely been tested on sloped surfaces, which present unique balance challenges common in construction and roofing environments. To overcome the limitations of simple threshold-based detection, recent research has shifted toward machine learning and deep learning models, including Long Short-Term Memory (LSTM) networks [11,12], CNN-LSTM hybrids [13], and Transformer-based architectures [14,15,16]. These approaches achieve high accuracy in controlled settings but still rely exclusively on motion data. They are rarely evaluated in real time or under conditions that replicate occupational environments, such as sloped surfaces.
In contrast, plantar pressure sensors offer a valuable yet underutilized sensing modality. By capturing foot–ground interactions, including dynamic pressure shifts, asymmetries, and unloading patterns, they can provide early indicators of instability that IMUs may miss [17]. Despite their potential, these sensors have seen limited adoption in fall detection systems, and, to our knowledge, no prior studies have evaluated their integration with IMUs for fall detection on inclined surfaces. This represents a critical research gap, particularly in high-risk contexts like roofing, where balance disruptions are more likely, and ground interaction is a key biomechanical factor.
Therefore, the purpose of this study is to evaluate the effectiveness of plantar pressure sensors—both alone and in combination with inertial measurement units—for detecting falls on sloped surfaces. We hypothesize that integrating plantar pressure data with a reduced set of IMUs will significantly improve fall detection performance compared to IMU-only configurations, including those with a full sensor array.
This study evaluates the effectiveness of plantar pressure sensors, both independently and in combination with IMUs, for fall detection on inclined surfaces. We conducted a controlled laboratory experiment using a custom-built roof mockup with slopes of 0, 15, and 30 degrees. Participants engaged in roofing-relevant activities such as stooping, kneeling, walking, and simulated falls. Using synchronized sensor data, we extracted statistical features and trained various machine learning and deep learning models. Our results show that integrating plantar pressure data significantly improves fall detection accuracy. A Convolutional Neural Network (CNN) trained on only three IMUs and two plantar pressure insoles achieved the highest F1 score of 0.88, outperforming even a full 17-sensor IMU configuration.
These findings underscore the value of multimodal sensor fusion in building lightweight, accurate, and real-time wearable fall detection systems for occupational environments.
2. Related Work
Early developments in fall detection primarily focused on wearable or environmental hardware to detect abrupt orientation changes following significant negative accelerations [18]. While effective at detecting sudden impacts, these devices were typically bulky, uncomfortable, and not well-received by older adults. Modern advances, notably smartphones and smartwatches, have introduced widely available sensors (accelerometers, gyroscopes, magnetometers) that enable more convenient and practical solutions for fall detection [19].
Numerous existing studies utilize inertial sensors, particularly accelerometers, to detect characteristic motion patterns associated with falls. Threshold-based methods are simple yet limited due to variability among individual fall dynamics, failing to distinguish between “soft” falls typical among older adults and more abrupt “hard” falls. This limitation prompted the shift towards machine learning-based approaches.
A large body of work has employed multiple IMUs positioned at various body locations such as the pelvis, trunk, ankle, and wrist to improve detection accuracy. While such systems can achieve high performance in offline testing, their practicality is limited due to discomfort, power constraints, and computational overhead on mobile or embedded devices.
In the deep learning domain, Recurrent Neural Networks (RNNs) and Long Short-Term Memory (LSTM) models have been widely used with IMU data to detect falls. For example, Theodoridis et al. [11] and Musci et al. [12] demonstrated high offline accuracy using LSTM models trained on pelvic sensor data from the URFD and SisFall datasets, respectively. However, these studies used high sampling rates (e.g., 200 Hz) and have not been validated in real-world deployments, making them unsuitable for energy-constrained wearable devices.
Other research has explored hybrid architectures like CNN-LSTM [13], which combine spatial feature extraction with temporal modeling. These models have shown strong results on benchmark datasets but typically use sensor arrays placed on multiple body parts, limiting real-world applicability. Similarly, Ordóñez et al. [20] proposed DeepConvLSTM models for activity recognition using dense sensor networks, which may be impractical for deployment due to their size and complexity.
More recently, Transformer-based models have gained attention for fall detection due to their ability to handle long sequences and parallel processing [10]. Several studies [14,15,16] have demonstrated high offline accuracy using accelerometer data from IMUs. However, none of these models have been evaluated in real time on wearable devices. Moreover, these works also rely exclusively on motion data and overlook other biomechanical signals that could improve robustness.
Several previous works [6,7,8] evaluated various LSTM and CNN-based models using wrist-worn smartwatches. Despite promising offline accuracy, these systems experienced high false positive rates during real-world testing due to limitations in sensor modality and placement. While we also explored the Transformer architecture [8] and demonstrated its potential in real-time fall detection, the input remained restricted to inertial data.
In construction environments, several recent studies have explored wearable solutions specifically tailored for occupational safety. Lee et al. [21] employed deep learning models (1D-CNN, Conv-LSTM) on wearable IMU data, achieving 97.6% accuracy in classifying high-risk falls simulated at construction sites. Similarly, Bhattacharya et al. [22] deployed wearable accelerometer-based sensors with machine learning algorithms, successfully demonstrating reliable fall detection and timely alerts during actual construction site operations.
Further advancements have integrated smart helmets equipped with accelerometers and physiological sensors, providing real-time fall detection and emergency alerts directly at construction sites. Kim et al. [23] and Wong et al. [24] reported robust field results, emphasizing immediate emergency response and worker localization following falls.
Alternative sensing modalities have also been explored. Antwi-Afari et al. [17] evaluated smart insoles with plantar pressure sensors to identify loss-of-balance events, demonstrating that Random Forest classifiers could accurately detect these precursors with over 97% accuracy. Hu et al. [25] presented a novel vision-free, non-wearable Wi-Fi Channel State Information-based method, reaching approximately 93.8% accuracy, offering promising implications for unobtrusive fall detection solutions.
Additionally, hybrid IoT systems have been developed for pre-impact fall detection and injury mitigation. For instance, Kim et al. [26] used IMU sensors in controlled simulations to achieve pre-impact fall detection with sufficient lead time (200–300 ms) for activating protective measures, demonstrating practical potential for reducing injury severity. Dogan et al. [27] similarly demonstrated that wearable sensors integrated within IoT frameworks could effectively estimate fall height, triggering timely emergency responses.
Across the literature, plantar pressure data remains largely absent. Existing works do not leverage the unique insights offered by foot–ground interactions, which are particularly relevant during balance shifts and posture transitions—conditions where IMUs alone may be insufficient. Furthermore, none of the cited studies investigate fall detection on sloped surfaces, where instability is more likely and where pressure dynamics play a more critical role.
This gap motivates our current study, which is one of the first to evaluate the integration of plantar pressure sensors with IMUs for fall detection in sloped environments, using both traditional and deep learning models. Our findings provide strong evidence that multimodal sensing, particularly pressure-based features, can substantially enhance fall detection accuracy and real-world applicability.
3. Data Collection and Preprocessing
To explore the effectiveness of plantar pressure sensors in detecting falls on sloped surfaces, we designed and conducted a controlled laboratory study that simulated realistic residential roofing conditions. Falls during roofing tasks often occur under complex body postures and on uneven, sloped surfaces, making it critical to evaluate sensor technologies that can capture early indicators of instability and imbalance in such environments.
The experimental setup was refined through consultations with professional roofers from two construction companies. Their practical feedback was instrumental in ensuring the ecological validity of the simulated tasks, helping us replicate realistic working postures, movements, and surface conditions encountered during typical roofing activities. The study protocols were approved by the university’s Institutional Review Board (IRB), with protocol number #9613 for the movement study.
A custom-built roof mockup (Figure 1) was constructed in the laboratory to safely replicate residential slope conditions. The structure supported three inclined angles commonly seen in roofing: 0°, 15°, and 30°. The mock-up roof consisted of two opposing sloped surfaces, each measuring 8 feet by 8 feet, with the peak reaching 6 feet in height, corresponding to a 30-degree incline. The modular platform allowed us to adjust the slope angle for each trial while ensuring safety and repeatability in the experimental design. A pilot study was conducted to validate the setup, confirming that participants could perform tasks safely and consistently under each slope condition.
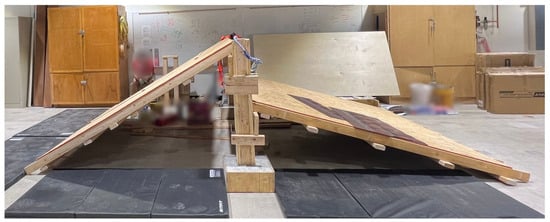
Figure 1.
Roof setup (30 degree (left) and 15 degree (right)).
Our goal was to examine how fall-related cues manifest in plantar pressure data across varying inclines and to determine how such data, alone or in combination with inertial motion data, could be used to improve the robustness and accuracy of fall detection algorithms.
3.1. Sensors
We employed two types of wearable sensor systems:
- Plantar Pressure Sensors: The XSensor Wearable Insole System captured detailed plantar pressure distributions, offering insights into center of pressure movement, asymmetry, and abrupt changes associated with fall onset. Figure 2 shows the insoles and their positions in the shoes.
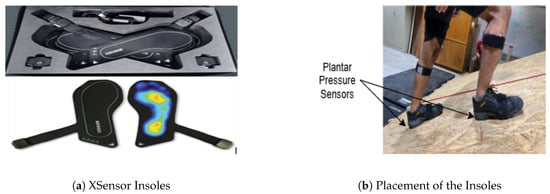 Figure 2. Placement of plantar pressure insole system.
 - Inertial Measurement Units (IMUs): The Movella Xsens MVN system recorded full-body kinematics using up to 17 IMUs, enabling the measurement of body orientation, acceleration, and angular motion. Figure 3 shows the positions of each IMU sensor.
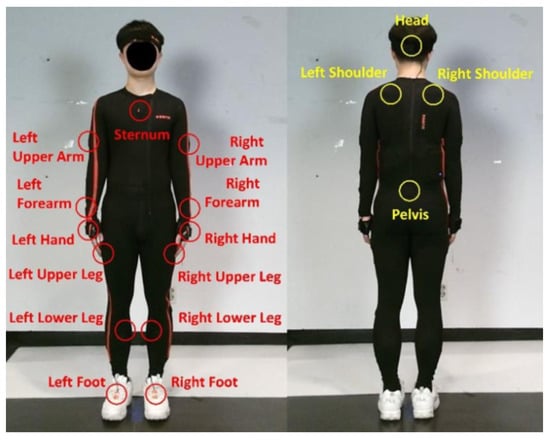 Figure 3. Placement of 17 IMU sensors of the Xsens system.
Table 1 summarizes the specifications of the wearable sensors used in this study. These devices were chosen based on their high temporal resolution and accuracy for motion and load detection under dynamic movement conditions.

Table 1.
Technical specifications of sensors used in the study.
3.2. Data Collection
Participants performed one-minute trials of four different roofing-relevant postures (standing, stooping, kneeling, and walking) at each of the three slope angles (0°, 15°, and 30°). These postures, which involve varying levels of balance and movement, were selected to replicate typical roofing activities (as shown in Figure 4). They are also known to produce distinct pressure distribution patterns across the foot’s anatomical regions, offering a meaningful context to evaluate pressure dynamics related to balance and instability.
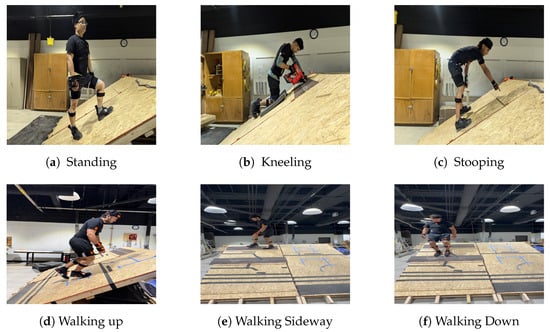
Figure 4.
Standing, kneeling, stooping, and walking posture used in the preliminary data collection.
Each participant completed three trials per posture, one at each slope condition, while wearing both the plantar pressure sensors and IMU sensors. This system recorded bilateral plantar pressure data from both feet with high spatial and temporal resolution. The resulting data captured dynamic load patterns, pressure shifts, and balance changes, which are critical indicators for identifying fall risks.
To complement the activity trial data, we also collected simulated fall events from five participants under controlled experimental conditions. These simulated falls were staged on slopes of both 0° and 30°, encompassing multiple fall directions, including forward, backward, and sideways. Strict safety protocols were enforced throughout to protect participants and to ensure realistic fall dynamics were captured. Each fall event was carefully labeled to support supervised fall detection models, with labels starting from 1 s before the initiation of each fall and continuing until 2 s after the fall.
The data from all posture trials and simulated falls were merged into a unified dataset focused entirely on fall detection. This combined dataset enables comparative evaluation of fall detection models across different sensor configurations.
Demographics
A total of eight participants (8 male) were recruited for the activity trials, and five of these participants also completed the simulated fall events. Participants were healthy adults with no musculoskeletal disorders. Their age ranged from 22 to 37 years (mean = 27 years), experience in the construction industry ranged from 0 to 5 years, heights ranged from 157.4 to 182.9 cm (mean = 167.64 cm), and weights ranged from 60.0 to 96.2 kg (mean = 72 kg). The sample reflects typical body types and mobility patterns found in construction-related occupations, such as roofing, which was the targeted use case in this study.
All participants provided informed consent prior to participation and were briefed on the study procedures and safety protocols.
3.3. Data Processing and Analysis Pipeline
To ensure compatibility between sensor streams and to generate meaningful input for machine learning models, we applied a structured preprocessing pipeline to the raw data collected from the IMU and plantar pressure sensors. This process involved signal synchronization, feature extraction, and time-windowing, designed to preserve relevant temporal and statistical patterns associated with fall events. Figure 5 illustrates the complete data processing and modeling pipeline.
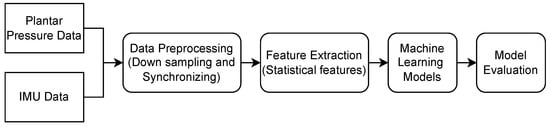
Figure 5.
End-to-end analysis pipeline used in the study.
Coordinate Frames: IMU sensors in the Movella Xsens MVN system report acceleration in the local coordinate frame of each sensor unit. For this study, we used the raw acceleration magnitude () from each IMU, which is invariant to orientation and does not require coordinate transformation. No global reference frame transformation was applied to the IMU signals prior to feature extraction.
The plantar pressure sensors from the XSensor insole system operate in a local 2D coordinate grid fixed to each foot. Pressure values represent local foot–ground interactions and were used without transformation. Consequently, all input features used in machine learning models were derived from local coordinate systems specific to each sensor.
3.3.1. Sensor Synchronization and Merging
The IMU data were collected using the Xsens MVN system at a sampling rate of 60 Hz, while the plantar pressure data from the XSensor insoles were recorded at 60 Hz as well. Synchronization between the two systems was achieved using a manual timestamp alignment procedure. A simultaneous start trigger was recorded for both systems via a synchronized software marker and verified by performing a distinct motion (e.g., foot stomp) at the beginning of each trial.
To ensure alignment throughout the trial duration, both data streams were resampled to a common time base using linear interpolation. Time-series windows were then extracted using synchronized timestamps to ensure that each sensor modality contributed to the same temporal event during feature extraction. The effective temporal alignment error was within ±16 ms, which is acceptable for the time scale of gait and fall dynamics observed in this study. Figure 6 and Figure 7 illustrates representative IMU acceleration and plantar pressure signals across different activities. These figures demonstrate the distinct signal patterns captured by each sensing modality.
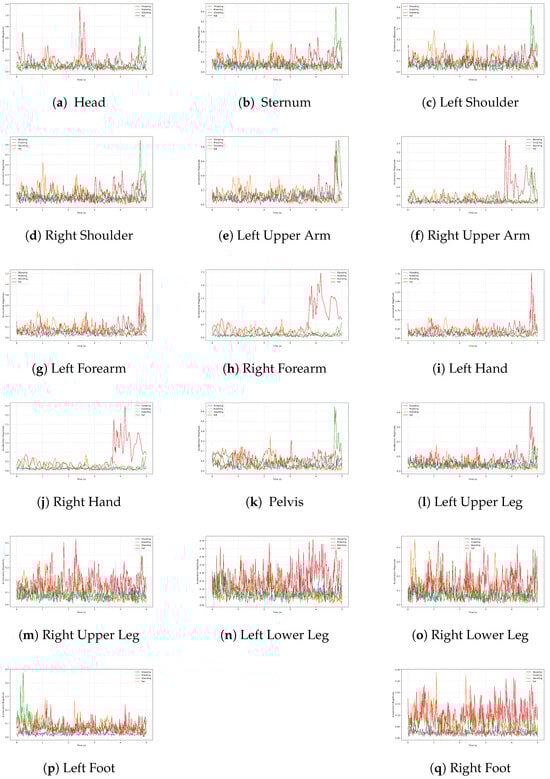
Figure 6.
Acceleration magnitude signals from all 17 IMU sensors during a 5 s interval for four activity types: stooping, kneeling, standing, and simulated falls.
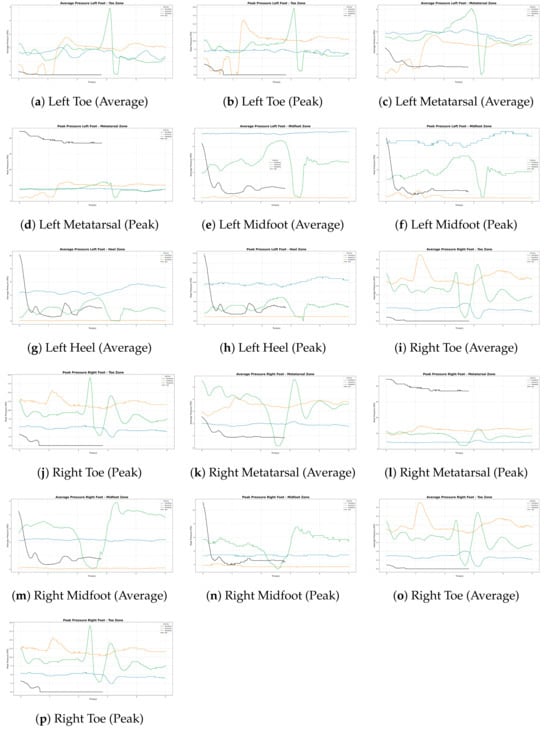
Figure 7.
Average and peak pressure signals from each of four zones of the plantar pressure sensor during a 5 s interval for four activity types: stooping, kneeling, standing, and simulated falls.
3.3.2. Signal Processing and Feature Extraction
For this analysis, we utilized a carefully selected subset of sensor data to optimize informativeness while maintaining computational efficiency. From the inertial measurement units (IMUs), only acceleration data (for x, y, z axis) from each of the 17 sensors were used. Specifically, we computed the magnitude of acceleration from the x, y, and z axes, resulting in 17 channels that represent overall body movement dynamics. Additionally, from the plantar pressure insoles, we extracted peak and average pressures for both the left and right feet, contributing four additional channels that capture foot–ground interactions and load distributions. Consequently, we obtained a total of 21 synchronized feature channels at each time point.
To convert continuous sensor streams into inputs suitable for supervised classification, we applied a sliding window approach. Each window contained 3 s of data, corresponding to 180 samples at 60 Hz. For simulated fall events, the sliding window advanced by three samples (approximately 0.05 s), generating a higher number of overlapping windows to balance the dataset. For other daily activity tasks, the window slid forward by 60 samples (1 s) to reduce redundancy.
Specifically, for the simulated fall data, each of the five participants performed 12 falls per slope angle (0° and 30°), totaling 24 falls per participant. With each fall event lasting around 5 s, 24,261 fall samples were collected across all five participants. The smaller sliding increment (2 samples) for fall events significantly increased the number of windows, ensuring a balanced representation between fall and non-fall events. In contrast, the other tasks comprised eight participants, resulting in a total of 27,937 samples of non-fall data, totaling 52,198 samples across all eight participants. We used a 60-sample sliding window for these activities generated fewer, less redundant windows. Table 2 shows the distribution of fall and non-fall samples across activities.
Table 2.
Distribution of data samples across activities, slope conditions, and class labels.
Within each sliding window, four statistical features, minimum, maximum, mean, and standard deviation, were computed for each of the 21 channels. This resulted in a fixed-length feature vector of 84 values per window (4 features × 21 channels), effectively capturing essential statistics that reflect both the intensity and variability of motion and pressure over time. Each feature vector derived from the sliding windows was labeled as either a fall or non-fall event, forming the dataset used for supervised classification. By standardizing this representation, we facilitated a fair and robust comparison across different models and sensor configurations.
4. Machine Learning Algorithms
To evaluate the effect of plantar pressure sensors on fall detection performance, we conducted an initial exploration using a suite of traditional machine learning algorithms and foundational deep learning architectures. Rather than processing raw sensor data directly, we focused on feature extraction from time-windowed IMU and plantar pressure signals. This approach enables efficient comparison across models and sensor configurations while maintaining interpretability. Although recent advances in deep learning, such as LSTM, Transformers, and other end-to-end time-series models, have shown strong performance in sequential data tasks, our study prioritizes a feature-based framework to assess the feasibility and impact of integrating plantar pressure data into fall detection systems.
4.1. Naive Bayes
Naive Bayes is a generative probabilistic classifier that applies Bayes’ Theorem under the assumption that input features are conditionally independent given the class label. In our implementation, we assume a Gaussian distribution for each feature and estimate the parameters (mean and variance) directly from the training data. Despite its simplicity, Naive Bayes is computationally efficient and serves as a lightweight baseline for real-time or resource-constrained applications.
4.2. Hidden Markov Model (HMM)
HMMs are state-space models that represent observed data as emissions from a sequence of hidden (unobserved) states. Each state transition and emission is governed by a probability distribution. We used a discrete HMM model with multivariate Gaussian emission probabilities to model transitions between latent movement phases (e.g., stable, unstable, fall). The Baum–Welch algorithm was employed for parameter estimation, and Viterbi decoding was used for sequence classification. HMMs are particularly suitable for modeling the temporal evolution of sensor data, making them relevant for fall detection where dynamic transitions are key indicators.
4.3. Decision Tree (DT)
A decision tree constructs a hierarchy of if–then rules by recursively partitioning the feature space based on criteria such as Gini impurity or information gain. For this study, we used the CART (Classification and Regression Trees) algorithm to build binary trees with a maximum depth constraint to avoid overfitting. Decision trees offer full interpretability and allow for straightforward visualization of decision boundaries, although their performance tends to be lower compared to ensemble methods on complex datasets.
4.4. Support Vector Machine (SVM)
SVMs are large-margin classifiers that seek to maximize the margin between decision boundaries and data points in the feature space. We used the radial basis function (RBF) kernel to enable nonlinear classification, which maps the input features into a higher-dimensional space where a linear separator can be found. Hyperparameters such as the regularization coefficient and the kernel width were optimized using grid search and cross-validation. SVMs are effective for small-to-moderate-sized datasets with well-separated classes.
4.5. AdaBoost
AdaBoost (Adaptive Boosting) is an ensemble technique that sequentially combines multiple weak learners, typically decision stumps or shallow trees. During training, each learner focuses more on the samples that were misclassified by previous models. We used the SAMME.R algorithm for real-valued boosting, where the final prediction is a weighted combination of the individual learners. AdaBoost improves classification in cases where fall events are subtle and may be underrepresented in the dataset.
4.6. Random Forest (RF)
Random Forest is an ensemble of decision trees trained on bootstrapped samples of the dataset and random subsets of features at each split. This process introduces diversity and reduces variance, making the model robust to overfitting and noisy data. In our implementation, we used 100 trees with a maximum depth tuned through cross-validation. Random Forest also provides feature importance scores, which were used to evaluate the relative contribution of IMU and plantar pressure features.
4.7. XGBoost
XGBoost is an optimized and regularized implementation of gradient boosting that incorporates additional features like sparsity-aware learning, L1/L2 regularization, parallel tree construction, and early stopping. We used a binary logistic objective for classification and employed both cross-validation and early stopping to prevent overfitting. XGBoost’s speed and ability to model complex interactions made it one of the most competitive models in our evaluation.
4.8. Convolutional Neural Network (CNN)
To explore the effectiveness of deep learning on structured feature representations, we implemented a 1D Convolutional Neural Network (CNN) that operates on statistical summaries extracted from synchronized IMU and plantar pressure sensor data. Although CNNs are commonly used with raw time-series input, in this study, we adapted the architecture to work with fixed-length feature vectors for direct comparison with traditional machine learning models.
Each input sample consists of an 84-dimensional feature vector derived from a 3 s sliding window of sensor data. This vector is constructed by computing four statistical features, minimum, maximum, mean, and standard deviation, for each of the 21 sensor channels (17 IMU acceleration magnitudes and 4 plantar pressure metrics).
The adapted CNN architecture treats this 1D feature vector as a sequence along the spatial dimension and consists of the following components:
- Convolutional layers: One-dimensional convolutional layers apply temporal filters over the 84-feature vector, allowing the model to learn spatial feature interactions such as co-occurrence or sudden shifts in sensor values. ReLU activation is used after each convolution.
- Pooling layers: MaxPooling1D layers follow the convolutional layers to downsample feature maps, reduce dimensionality, and retain dominant activations.
- Flatten and dense layers: The pooled feature maps are flattened and passed through a fully connected dense layer to model higher-level combinations. Dropout is applied to reduce overfitting.
- Output layer: A single neuron with sigmoid activation outputs the probability that the input window corresponds to a fall.
The network is trained using the Binary Cross Entropy (BCE) loss function and optimized with the Adam optimizer. A batch size of 64 is used during training, with early stopping based on validation loss. All hyperparameters, including filter size, number of filters, pooling strategy, and dropout rate, were empirically tuned.
By operating on engineered statistical features, this CNN model leverages local feature relationships within the fixed-length input vector, offering an alternative to fully connected networks while maintaining comparability with other models in the study.
4.9. Multilayer Perceptron (MLP)
The MLP is a fully connected feedforward neural network suitable for tabular input data, such as the fixed-size statistical feature vectors extracted from our 3 s sliding windows.
Each input vector consists of 84 features, derived by computing four statistical descriptors, minimum, maximum, mean, and standard deviation, for each of the 21 sensor channels (17 IMU acceleration magnitudes and 4 plantar pressure signals). These features encapsulate the temporal characteristics of sensor signals within each window and serve as compact, high-level descriptors for classification.
The MLP architecture consists of the following components:
- Input Layer: Accepts a flattened 84-dimensional feature vector.
- Hidden Layers: The network includes two fully connected hidden layers. The first layer contains 128 neurons, and the second contains 64 neurons. Both layers use the ReLU activation function to introduce non-linearity and allow the model to learn complex feature interactions.
- Batch Normalization and Dropout: Batch normalization is applied after the first hidden layer to stabilize training by normalizing activations. Dropout with a rate of 0.3 is included after both hidden layers to reduce overfitting by randomly deactivating neurons during training.
- Output Layer: A final dense layer with a single neuron and a sigmoid activation function outputs the predicted probability that the current window corresponds to a fall event.
The model is trained using the Binary Cross Entropy (BCE) loss function and optimized with the Adam optimizer. A batch size of 64 is used during training, and early stopping based on validation loss is employed to prevent overfitting. The network was trained and evaluated using stratified 5-fold cross-validation to ensure robustness across varying data splits.
4.10. Hyperparameter Tuning and Optimization
To ensure fair and optimal performance comparisons across models, we conducted systematic hyperparameter tuning for each machine learning algorithm. For traditional classifiers such as SVM, Decision Tree, Random Forest, AdaBoost, and XGBoost, grid search with 5-fold cross-validation was employed to identify the best combination of parameters (e.g., depth, number of estimators, kernel parameters). Class weights were balanced to address the inherent class imbalance in the dataset.
For deep learning models (CNN and MLP), we empirically tuned key parameters, including learning rate, batch size, dropout rates, number of neurons/layers, and early stopping criteria. The selection was guided by performance on validation folds and based on minimizing validation loss. All models were evaluated under consistent preprocessing, windowing, and normalization pipelines to maintain a fair comparison.
This tuning strategy ensures that each model is evaluated under its best-found configuration, allowing for a fair assessment of their relative strengths across the four sensor configurations.
5. Experimental Setup
5.1. Training and Evaluation
The dataset was composed of overlapping 3 s sliding windows labeled as fall or non-fall, as described in the preprocessing section. To ensure balanced evaluation, we used stratified 5-fold cross-validation, maintaining the class distribution in each fold. For each model, training was conducted on four folds, while the remaining fold was used for testing. This process was repeated five times, and the final results were reported as the mean and standard deviation of the evaluation metrics across all folds.
No subject-level split was enforced due to the limited number of fall samples per participant. However, we ensured that overlapping windows from the same event were not split across training and test sets to avoid data leakage.
All models were trained using the preprocessed feature vectors generated from synchronized IMU and plantar pressure signals. For deep learning models (e.g., CNN, MLP), the training data were normalized using z-score normalization, and applied independently to each sensor channel using the training set statistics.
- Loss Function: All binary classifiers were trained using the Binary Cross Entropy (BCE) loss function.
- Optimizer: Deep learning models were optimized using the Adam optimizer with learning rates and other hyperparameters tuned through grid search or cross-validation.
- Batch Size: For neural network models, a batch size of 64 was used, with early stopping applied based on validation loss to avoid overfitting.
- Tree-based models (e.g., Random Forest, XGBoost, Gradient Boosting) were trained using default or tuned hyperparameters with balanced class weights to address any class imbalance.
The final dataset consisted of 24,261 fall windows and 27,937 non-fall windows, created using a sliding window approach with different strides for fall and ADL activities (as described in Section 3.3). To maintain fair model evaluation and prevent data leakage, we used stratified 5-fold cross-validation. This ensured that the class distribution was preserved across all folds. Importantly, overlapping windows from the same event were kept within the same fold to avoid contamination between training and testing sets.
5.2. Evaluation Metric
To evaluate and compare the performance of the machine learning algorithms for fall detection, we look at the F1_score. The F1 score is defined as:
A True Positive (TP) occurs when the model correctly predicts a positive instance, such as accurately detecting a fall. True Negative (TN) is when the model correctly predicts a negative instance (ADL for our case). False Positive is the case when the model erroneously predicts a negative data sample as positive, and False Negative is the opposite case. While Precision assesses the accuracy of positive prediction, Recall quantifies the correct identification of real positives. F1-Score is a harmonic mean of precision and recall to provide a balanced measure of model performance.
5.3. Input Sensor for Machine Learning Models
To evaluate the contribution of different sensor types to fall detection performance, we compared models trained under four distinct sensor configurations. Each configuration represents a specific combination of inertial and plantar pressure sensors, enabling us to assess the trade-offs among sensor coverage, data richness, and classification accuracy.
- IMU Only (17 Sensors): This configuration utilizes the complete set of 17 IMUs from the Movella Xsens MVN system. From each IMU, we extracted the magnitude of acceleration by combining the three-axis acceleration readings. With four statistical features (minimum, maximum, mean, standard deviation) computed for each magnitude signal, this configuration yields a total of 68 input features per window (17 sensors × 1 channel × 4 features).
- IMU Only (3 Best Sensors): To reduce system complexity while retaining the most informative signals, we identified a subset of three IMU sensors that were most correlated with fall events. Specifically, we calculated the Pearson correlation coefficient between each IMU’s acceleration magnitude and the binary fall labels across the dataset. The three sensors with the highest absolute correlation values were selected for this configuration. Each sensor contributes 4 features, resulting in a total of 12 features per window (3 sensors × 1 channel × 4 features).
- Plantar Pressure Only (2 Sensors): This configuration uses only the Xsensor plantar pressure insoles. From each foot, we extracted two summary metrics—peak pressure and average pressure—aggregated across the insole surface. This results in 4 channels total, and after computing four statistical descriptors for each, a 16-dimensional feature vector is obtained per window.
- IMU (3 Sensors) + Plantar Pressure (2 Sensors): This hybrid configuration combines the three most correlated IMUs (as described above) with the plantar pressure insoles. It includes 3 acceleration magnitude channels and 4 plantar pressure channels, totaling 7 channels. With four statistical features computed per channel, this configuration yields 28 features per window.
These configurations allow us to systematically investigate the effect of sensor reduction and modality combination on fall detection performance. All preprocessing and feature extraction procedures were applied uniformly across configurations to ensure fair comparison. By evaluating both full and reduced sensor sets, we aim to identify a configuration that balances model performance with practical deployment constraints such as wearability, cost, and power consumption.
6. Results
6.1. IMU Sensors and Fall Correlation Analysis
To determine which IMU sensors were most informative for fall detection, we performed a feature-wise correlation analysis using the Pearson correlation coefficient between each sensor’s mean acceleration magnitude and the binary fall labels. Each sensor’s time-series data was summarized using four statistical descriptors (minimum, maximum, mean, standard deviation) over 3 s sliding windows, and the mean feature was found to be most strongly associated with fall events.
The results of this analysis are presented in Table 3, which lists the correlation coefficient for each of the 17 IMU sensor locations. The sensors located at the Pelvis, Left hand, and Right hand exhibited the highest positive correlations, with values ranging from approximately 0.51 to 0.58. These findings are biomechanically meaningful, as these body regions are highly responsive to whole-body acceleration changes and impact during falls.
Table 3.
Pearson correlation coefficients between mean acceleration magnitude of each IMU sensor location and fall labels. Top three sensors selected for reduced configurations are highlighted in bold.
Sensors on the head, hands, forearms, and shoulders showed considerably lower correlations, suggesting limited relevance for fall detection based on acceleration magnitude alone. Based on these results, the three most correlated sensors: Pelvis, Left Hand, and Right Hand were selected for use in the reduced-sensor configurations: IMU Only (3 Sensors) and IMU (3 Sensors) + Plantar Pressure.
6.2. Fall Detection Performance
To assess the performance of various machine learning models in fall detection, we compared the F1 scores across four sensor configurations using stratified 5-fold cross-validation. The F1 score provides a balanced evaluation of both precision and recall, making it particularly relevant in fall detection tasks where class imbalance and false negatives are critical concerns.
As shown in Table 4, the Convolutional Neural Network (CNN) achieved the highest F1 scores across all configurations, peaking at 0.88 in the IMU (3) + Plantar Pressure configuration. Its ability to extract local relationships among engineered features contributed to superior classification performance. For this top-performing model, the accuracy was 0.90, precision was 0.87, and recall was 0.89, indicating strong and balanced detection capabilities across fall and non-fall classes.
Table 4.
F1 scores (in fractions) for all models across four sensor configurations. The best result for each model is shown in bold. CNN achieved the highest overall F1 score.
The Multilayer Perceptron (MLP) also performed strongly, achieving an F1 score of 0.87, precision of 0.87, and recall of 0.86 in the combined sensor setup. Despite its simpler structure, the MLP was effective at learning non-linear patterns from the statistical features and consistently outperformed most traditional models.
Among conventional machine learning algorithms, XGBoost and Random Forest were the top performers, reaching F1 scores of 0.86 and 0.85, respectively, in the combined IMU and plantar pressure configuration. Support Vector Machine (SVM) and AdaBoost also delivered competitive results, particularly when foot pressure data was included.
Models such as Naive Bayes, Hidden Markov Model (HMM), and Decision Tree showed lower F1 scores overall, ranging from 0.73 to 0.78, but provided useful insights for baseline comparison and interpretable model behavior.
Additional experiments using only one (pelvis) or two IMUs (pelvis and left hand) in combination with plantar pressure sensors revealed a modest reduction in F1 score (e.g., CNN: from 0.88 to 0.86 for both one and two IMUs with plantar pressure sensors; XGBoost: from 0.88 to 0.85 for two IMUs and 0.84 for one IMU with plantar pressure sensors), suggesting a potential trade-off between wearability and accuracy. However, even the reduced configurations outperformed the full IMU-only setup, reinforcing the benefit of plantar pressure sensing.
Overall, the results confirm that both sensor configuration and model selection play critical roles in optimizing fall detection performance. Deep learning models, especially the adapted CNN, offer a clear advantage when applied to well-engineered features, even without access to raw sequential inputs.
7. Discussion
The results of this study clearly demonstrate the value of integrating plantar pressure sensors into wearable fall detection systems, particularly in sloped environments. Across all tested configurations and models, systems that included plantar pressure data consistently outperformed those relying solely on IMU inputs. This improvement was most notable in the combined sensor setup, using only three IMUs and two plantar pressure insoles, which achieved the highest F1 scores across nearly all models, outperforming even the full 17-IMU configuration.
This performance boost can be attributed to the unique contribution of plantar pressure sensors, which capture information that IMUs cannot directly measure. While IMUs estimate movement through acceleration and orientation, they provide limited insight into how the body interacts with the ground. In contrast, plantar pressure sensors record dynamic changes in weight distribution, force asymmetry, and foot contact patterns, key indicators of instability, especially relevant when a fall is imminent. These features are particularly valuable during slow or partial falls, or when posture transitions mimic fall-like movements, where IMU data alone may be ambiguous or insufficient.
The results also reveal that plantar pressure data, even when used alone, can rival or exceed the performance of reduced IMU configurations. Models such as XGBoost and Random Forest achieved F1 scores above 0.82 in the plantar pressure-only configuration, which is a compelling finding given the reduced sensor count and complexity. This supports the idea that high-quality, low-noise signals from fewer but more informative sensors can sometimes be more effective than larger, redundant arrays of inertial data.
Furthermore, the success of the hybrid IMU + plantar pressure configuration illustrates the power of sensor fusion. By combining internal body dynamics with external support feedback, models were able to capture both the cause and consequence of instability, improving classification of subtle and varied fall scenarios. Importantly, this was achieved using only five sensors, three strategically selected IMUs (pelvis, left hand, right hand) and two plantar pressure insoles, highlighting the potential for developing compact, lightweight systems suitable for real-world deployment.
Our findings align with prior research showing that deep learning models (CNN in this paper) can effectively model temporal patterns in wearable sensor data for fall detection [11,12,13]. However, most of these studies relied on multiple body-worn IMUs and evaluated performance on level ground or in simulated environments. For example, Lee et al. [21] achieved 97.6% accuracy using multiple IMUs in simulated construction environments, but did not evaluate performance on inclined surfaces. In contrast, our model achieved an F1 score of 0.88 using just three IMUs and two plantar pressure insoles on 15° and 30° slopes—indicating high performance in more challenging real-world conditions.
In summary, the integration of plantar pressure sensors significantly enhances fall detection performance, offering critical complementary information to motion-based inputs. These findings underscore the importance of sensor modality diversity and suggest that future wearable systems should prioritize not just the quantity of sensors, but the quality and complementarity of the data they provide.
Although our study focused on model performance in an offline setting, the practicality of real-time fall detection in wearable systems also depends on computational complexity and resource constraints. The top-performing CNN model used in this study has relatively shallow convolutional layers, making it lightweight compared to standard deep learning architectures. Preliminary profiling on a standard CPU suggests inference times around 40 ms per window, which supports real-time applicability. While we did not deploy the models on embedded hardware, prior studies [8] have shown that compact deep learning models can run efficiently on wearable processors.
Limitations
While this study focused on data-driven machine learning models to classify fall events, we did not explicitly incorporate predefined kinematic hypotheses (e.g., thresholds on acceleration peaks, foot unloading duration, or body segment angular velocity) into our detection pipeline. Although such rules are commonly used in threshold-based systems, our aim was to evaluate the discriminative potential of multimodal sensor data through learned representations rather than handcrafted logic. This lack of explicit kinematic modeling may limit interpretability. Future work could integrate hybrid approaches that combine learned models with biomechanical priors, such as recognizing a fall by rapid trunk descent combined with foot pressure unloading or non-recovery of stance post-impact.
8. Conclusions
This study examined the effectiveness of plantar pressure sensors in fall detection on sloped surfaces and evaluated how their integration with inertial measurement units (IMUs) affects model performance. Using data collected from controlled trials on a sloped roof mockup, we compared four sensor configurations across multiple machine learning algorithms, including traditional models and deep learning architectures.
Our findings demonstrate that plantar pressure sensors significantly enhance fall detection performance, both when used alone and when combined with a minimal subset of IMUs. The highest F1 score (0.88) was achieved using a CNN model trained on data from only three IMUs and two foot pressure sensors, outperforming even the full 17-sensor IMU configuration. This highlights the complementary value of pressure data in capturing stability loss and weight-shifting behaviors that are often missed by IMUs alone.
These results have important implications for the future of wearable systems aimed at physical health monitoring. They suggest that fall detection technologies can be made more accurate, efficient, and user-friendly by strategically combining sensor modalities rather than increasing sensor count. In high-risk occupational settings such as roofing, where usability and comfort are critical, such reduced yet effective systems could significantly improve worker safety and health outcomes.
Future work will explore real-time deployment, long-term wearability, and the potential of plantar pressure sensing in broader health monitoring applications, including fatigue, gait disorders, and postural instability. Also, we plan to investigate fall forecasting by analyzing pre-fall movement patterns and instability cues extracted from IMU and plantar pressure data. This could enable early identification of high-risk postures or behaviors, forming the basis for real-time feedback and fall prevention strategies.
Author Contributions
Conceptualization, T.M.; methodology, T.M., K.K. and A.H.N.; data collection: T.M., R.K. and K.K.; software, T.M.; validation, T.M., R.K. and S.A.; writing—original draft preparation, T.M. and R.K.; writing—review and editing, K.K., A.H.N. and S.A. All authors have read and agreed to the published version of the manuscript.
Funding
The materials for roof setup and experiment accessories for participant preparation such as hydrogel, shoes, and PPE was supported by Translation Health Research Center, Texas State University. This work is also partially supported by the USA National Science Foundation (NSF-SCH 21223749).
Institutional Review Board Statement
The study protocols were approved by the Texas State University’s Institutional Review Board (IRB), with protocol number #9613 for the movement study.
Informed Consent Statement
Informed consent was obtained from all subjects involved in this study.
Data Availability Statement
This study did not report any open-source data.
Acknowledgments
We would like to express our sincere gratitude to all the anonymous participants who generously contributed their time and effort to this research. Their contribution was essential for this workplace safety research.
Conflicts of Interest
The authors declare no conflicts of interest.
References
- World Health Organization. Falls. Available online: https://www.who.int/news-room/fact-sheets/detail/falls (accessed on 13 June 2023).
- Tacconi, C.; Mellone, S.; Chiari, L. Smartphone-based applications for investigating falls and mobility. In Proceedings of the 2011 5th International Conference on Pervasive Computing Technologies for Healthcare (PervasiveHealth) and Workshops, Dublin, Ireland, 26 May 2011; pp. 258–261. [Google Scholar] [CrossRef]
- Chen, L.; Li, R.; Zhang, H.; Tian, L.; Chen, N. Intelligent fall detection method based on accelerometer data from a wrist-worn smart watch. Measurement 2019, 140, 215–226. [Google Scholar] [CrossRef]
- Medical Life Alert Systems. Available online: http://www.lifealert.com (accessed on 10 July 2025).
- Mobilehelp Smart. Available online: https://www.mobilehelp.com/pages/smart (accessed on 18 November 2019).
- Mauldin, T.R.; Canby, M.E.; Metsis, V.; Ngu, A.H.; Rivera, C.C. SmartFall: A Smartwatch-Based Fall Detection System Using Deep Learning. Sensors 2018, 18, 3363. [Google Scholar] [CrossRef] [PubMed]
- Mauldin, T.R.; Ngu, A.H.; Metsis, V.; Canby, M.E. Ensemble Deep Learning on Wearables Using Small Datasets. ACM Trans. Comput. Healthc. 2021, 2, 1–30. [Google Scholar] [CrossRef]
- Ngu, A.H.; Metsis, V.; Coyne, S.; Srinivas, P.; Mahmud, T.; Chee, K.H. Personalized Watch-Based Fall Detection Using a Collaborative Edge-Cloud Framework. Int. J. Neural Syst. 2022, 32, 2250048. [Google Scholar] [CrossRef] [PubMed]
- Guan, Y.; Plötz, T. Ensembles of Deep LSTM Learners for Activity Recognition Using Wearables. Proc. ACM Interact. Mob. Wearable Ubiquitous Technol. 2017, 1, 1–28. [Google Scholar] [CrossRef]
- Vaswani, A.; Shazeer, N.; Parmar, N.; Uszkoreit, J.; Jones, L.; Gomez, A.N.; Kaiser, L.U.; Polosukhin, I. Attention is All you Need. In Proceedings of the Advances in Neural Information Processing Systems, New Orleans, LA, USA, 10–16 December 2023; Guyon, I., Luxburg, U.V., Bengio, S., Wallach, H., Fergus, R., Vishwanathan, S., Garnett, R., Eds.; Curran Associates, Inc.: Red Hook, NY, USA, 2017; Volume 30. [Google Scholar]
- Theodoridis, T.; Solachidis, V.; Vretos, N.; Daras, P. Human fall detection from acceleration measurements using a Recurrent Neural Network. In Precision Medicine Powered by pHealth and Connected Health; Springer: Berlin/Heidelberg, Germany, 2018; pp. 145–149. [Google Scholar]
- Musci, M.; De Martini, D.; Blago, N.; Facchinetti, T.; Piastra, M. Online Fall Detection using Recurrent Neural Networks. arXiv 2018, arXiv:1804.04976. [Google Scholar] [CrossRef]
- Yu, X.; Qiu, H.; Xiong, S. A Novel Hybrid Deep Neural Network to Predict Pre-impact Fall for Older People Based on Wearable Inertial Sensors. Front. Bioeng. Biotechnol. 2020, 8, 63. [Google Scholar] [CrossRef] [PubMed]
- Mohammed Sharook, K.; Premkumar, A.; Aishwaryaa, R.; Amrutha, J.M.; Deepthi, L.R. Fall Detection Using Transformer Model. In ICT Infrastructure and Computing; Tuba, M., Akashe, S., Joshi, A., Eds.; Springer: Singapore, 2023; pp. 29–37. [Google Scholar]
- Fall Detection Using a Transformer. Available online: https://www.edgeimpulse.com/blog/save-yourself-a-trip-fall-detect-using-a-transformer-model (accessed on 14 August 2023).
- Wang, S.; Wu, J. Patch-Transformer Network: A Wearable-Sensor-Based Fall Detection Method. Sensors 2023, 23, 6360. [Google Scholar] [CrossRef] [PubMed]
- Antwi-Afari, M.F.; Li, H.; Seo, J.; Wong, A.Y.L. Automated Detection and Classification of Construction Workers’ Loss-of-Balance Events Using Wearable Insole Pressure Sensors. Autom. Constr. 2018, 96, 881–889. [Google Scholar] [CrossRef]
- Nahian, M.J.A.; Raju, M.H.; Tasnim, Z.; Mahmud, M.; Ahad, M.A.R.; Kaiser, M.S. Contactless fall detection for the elderly. In Contactless Human Activity Analysis; Springer: Cham, Switzerland, 2021; pp. 203–235. [Google Scholar]
- Habib, M.A.; Mohktar, M.S.; Kamaruzzaman, S.B.; Lim, K.S.; Pin, T.M.; Ibrahim, F. Smartphone-based solutions for fall detection and prevention: Challenges and open issues. Sensors 2014, 14, 7181–7208. [Google Scholar] [CrossRef] [PubMed]
- Ordóñez, F.J.; Roggen, D. Deep Convolutional and LSTM Recurrent Neural Networks for Multimodal Wearable Activity Recognition. Sensors 2016, 16, 115. [Google Scholar] [CrossRef]
- Lee, S.; Koo, B.; Yang, S.; Kim, J.; Nam, Y.; Kim, Y. Fall-from-Height Detection Using Deep Learning Based on IMU Sensor Data for Accident Prevention at Construction Sites. Sensors 2022, 22, 6107. [Google Scholar] [CrossRef]
- Bhattacharya, A.; Kumar, R.; Kumar, A. Fall Detection in Construction Sites Using Wearable Sensors and Machine Learning Algorithms. Autom. Constr. 2019, 100, 103–111. [Google Scholar]
- Kim, S.; Wang, C.; Min, S.; Lee, S. Safety helmet wearing management system for construction workers using three-axis accelerometer sensor. Appl. Sci. 2018, 8, 2400. [Google Scholar] [CrossRef]
- Wong, G.; Anizam, N.; Nasruddin, N.; Hasan, C. An IoT-Enabled Smart Safety Helmet for Enhancing Worker Protection on Construction Sites. Politek. Kolej Komuniti J. Eng. Technol. 2025, 10, 105–116. [Google Scholar]
- Hu, Y.; Li, H.; Cheng, M.; Zhang, M.; Fang, X.; Han, S. Fall Detection for Construction Workers with Wi-Fi Channel State Information Using Smartphones. Autom. Constr. 2024, 154, 63–72. [Google Scholar]
- Kim, Y.; Jung, H.; Koo, B.; Kim, J.; Kim, T.; Nam, Y. Detection of Pre-Impact Falls from Heights Using an IMU Sensor. J. Saf. Res. 2020, 72, 55–63. [Google Scholar]
- Dogan, E.; Akcamete, A. Detecting Falls-from-Height with Wearable Sensors and Reducing Consequences via IoT. In Advances in Informatics and Computing in Civil and Construction Engineering: Proceedings of the 35th CIB W78 2018 Conference: IT in Design, Construction, and Management, Chicago, IL, USA, 9 October 2018; Springer: Cham, Switzerland, 2019; Volume 99, pp. 1–9. [Google Scholar]
Disclaimer/Publisher’s Note: The statements, opinions and data contained in all publications are solely those of the individual author(s) and contributor(s) and not of MDPI and/or the editor(s). MDPI and/or the editor(s) disclaim responsibility for any injury to people or property resulting from any ideas, methods, instructions or products referred to in the content. |
© 2025 by the authors. Licensee MDPI, Basel, Switzerland. This article is an open access article distributed under the terms and conditions of the Creative Commons Attribution (CC BY) license (https://creativecommons.org/licenses/by/4.0/).