

A Hybrid Transformer–Mamba Model for Multivariate Metro Energy Consumption Forecasting

 , , , , , and
Abstract
1. Introduction
2. Related Work
2.1. Statistical-Based Energy Consumption Prediction
2.2. Machine Learning-Based Energy Consumption Prediction
2.3. Deep Learning-Based Energy Consumption Prediction
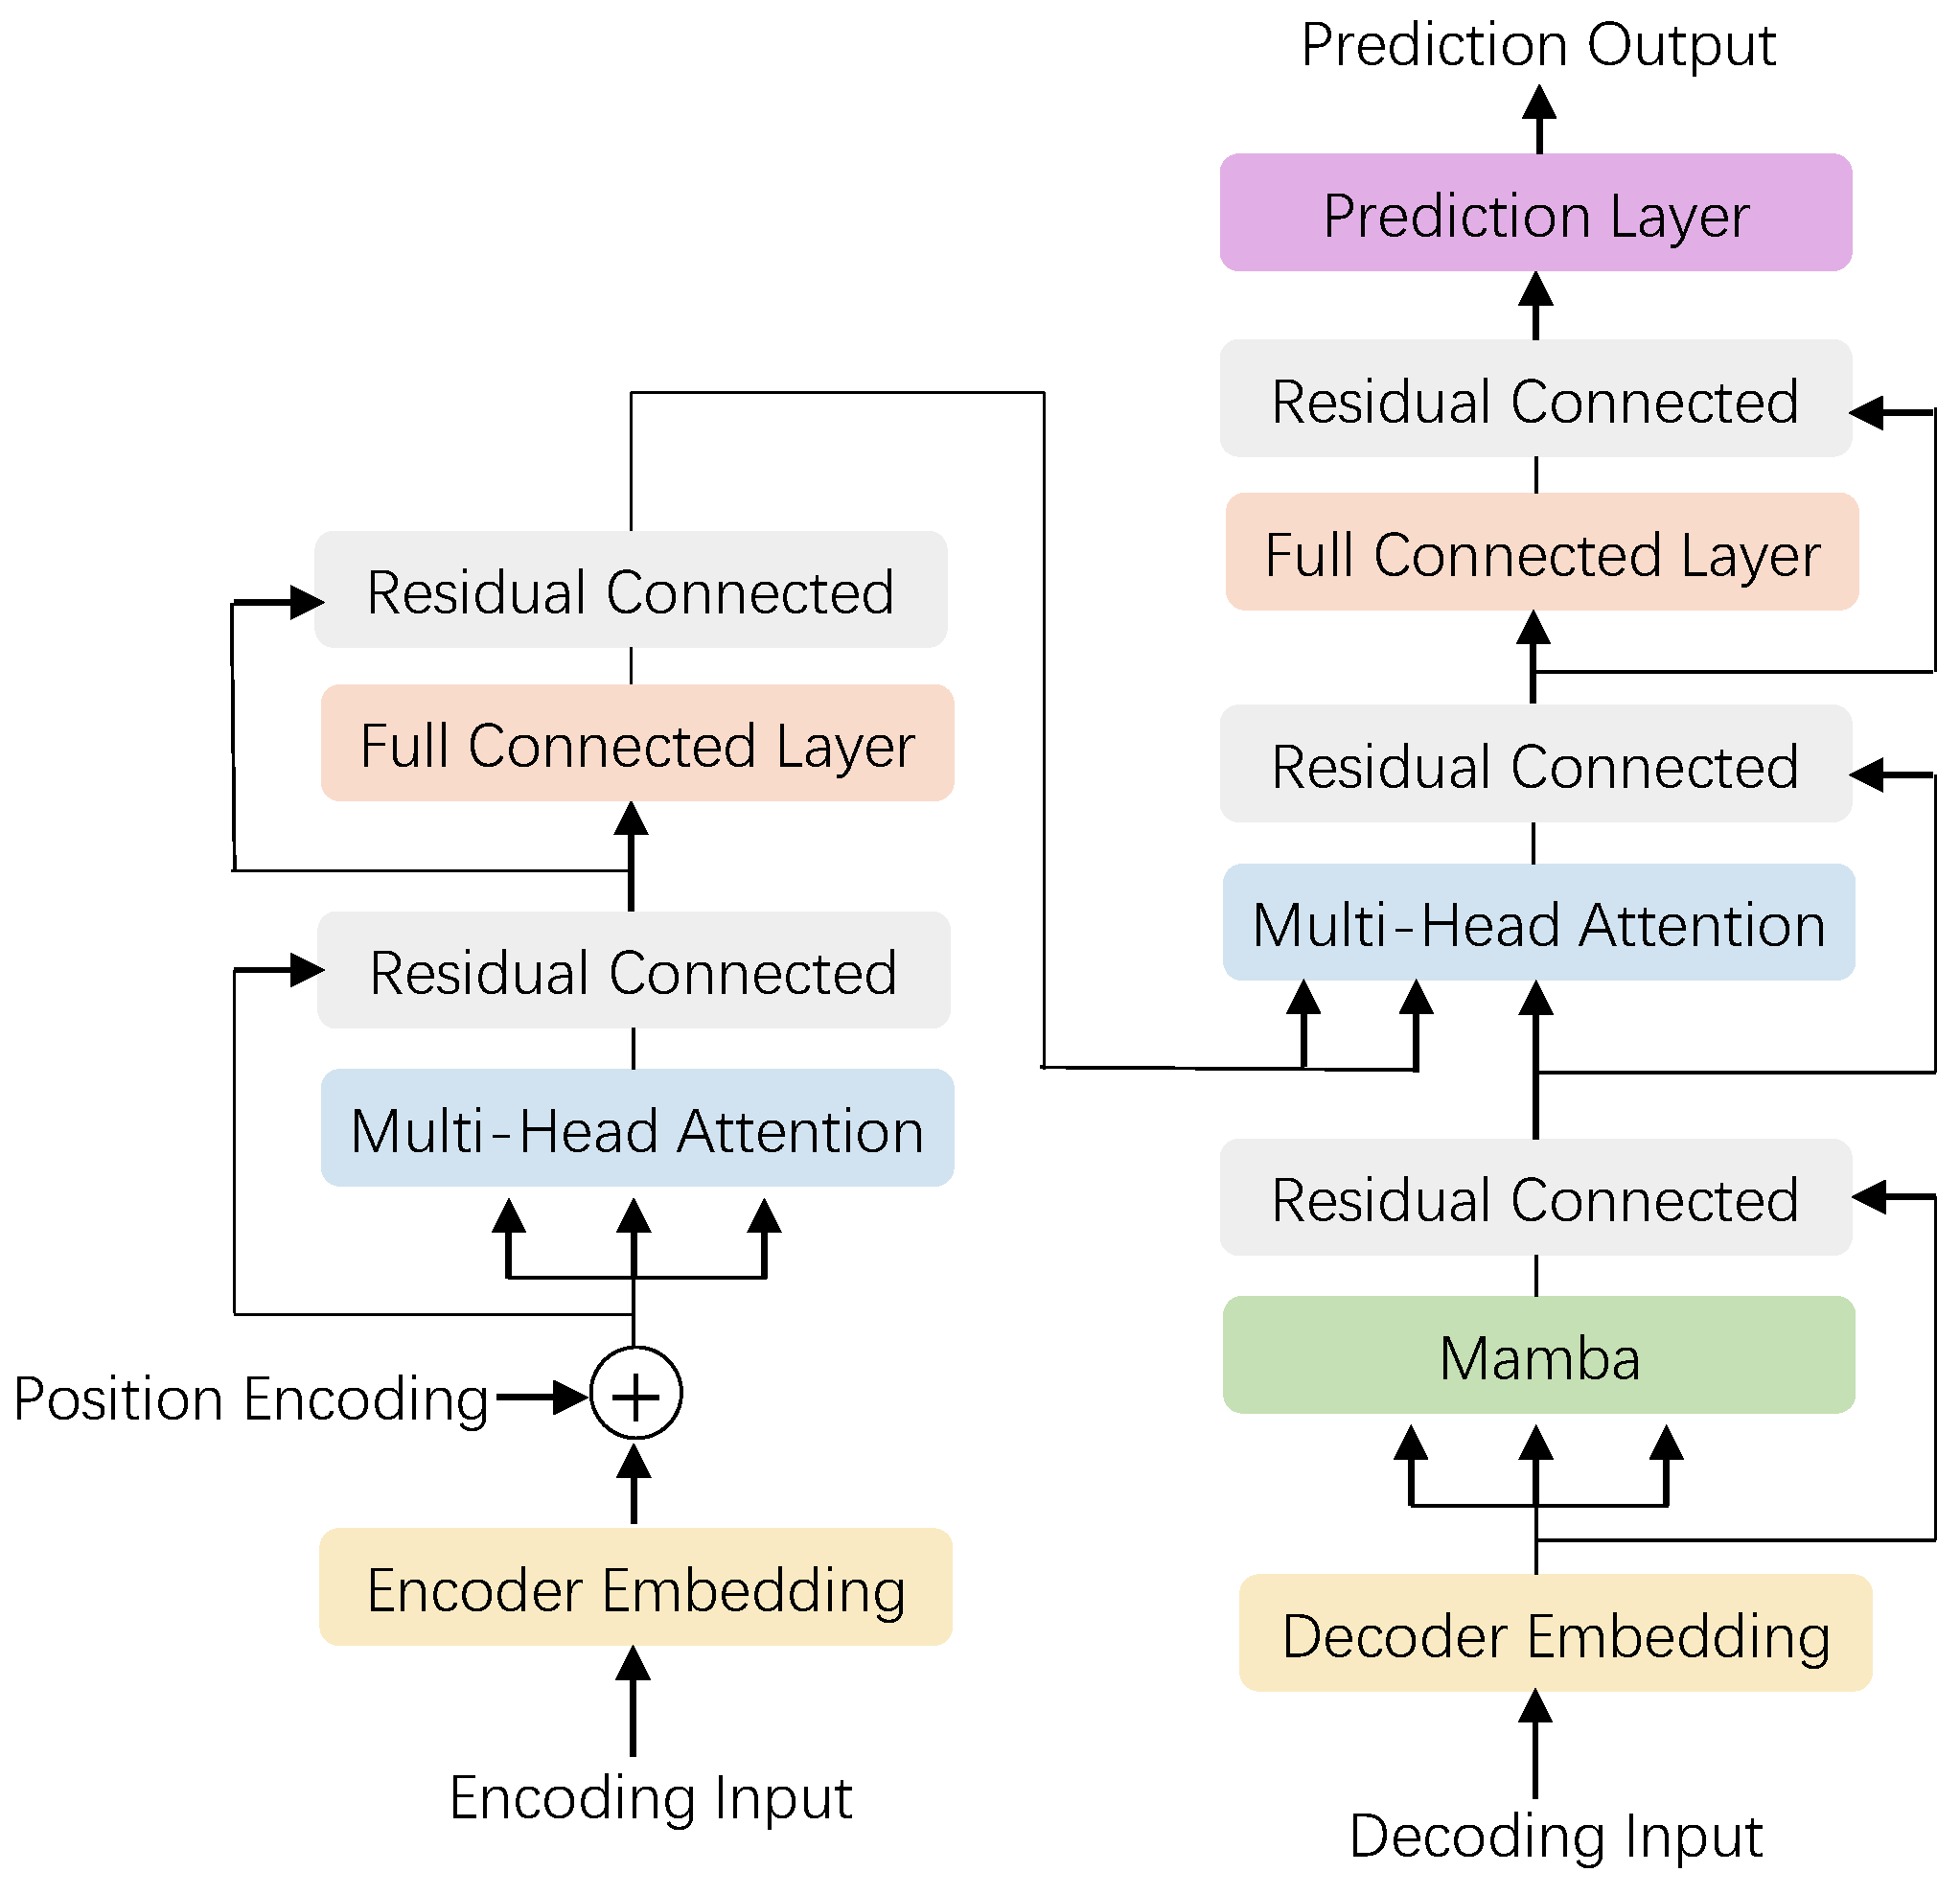
3. Method
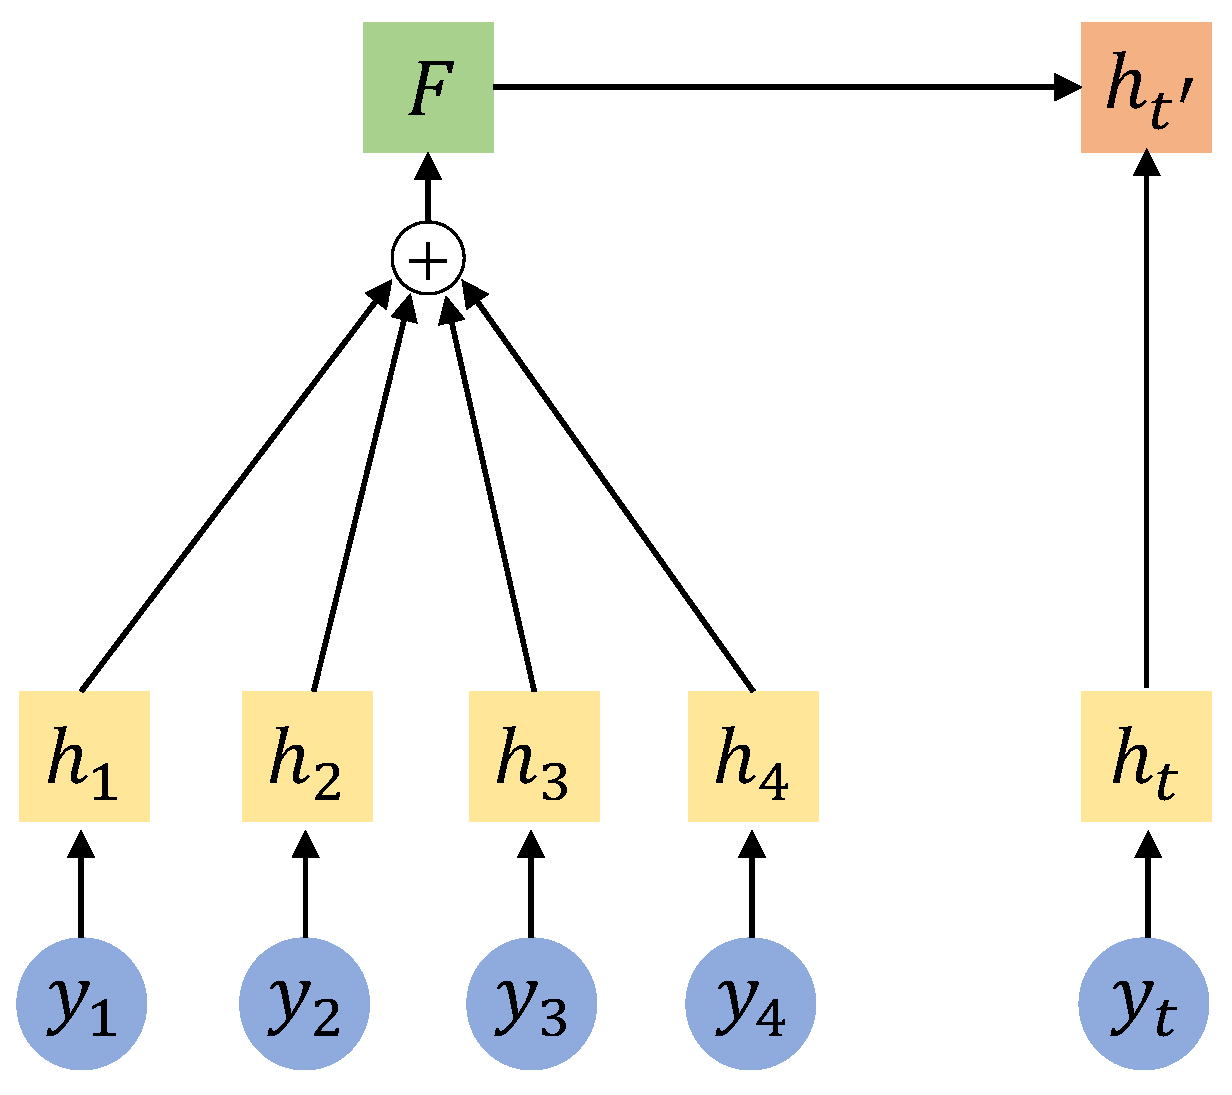
3.1. Transformer Attention
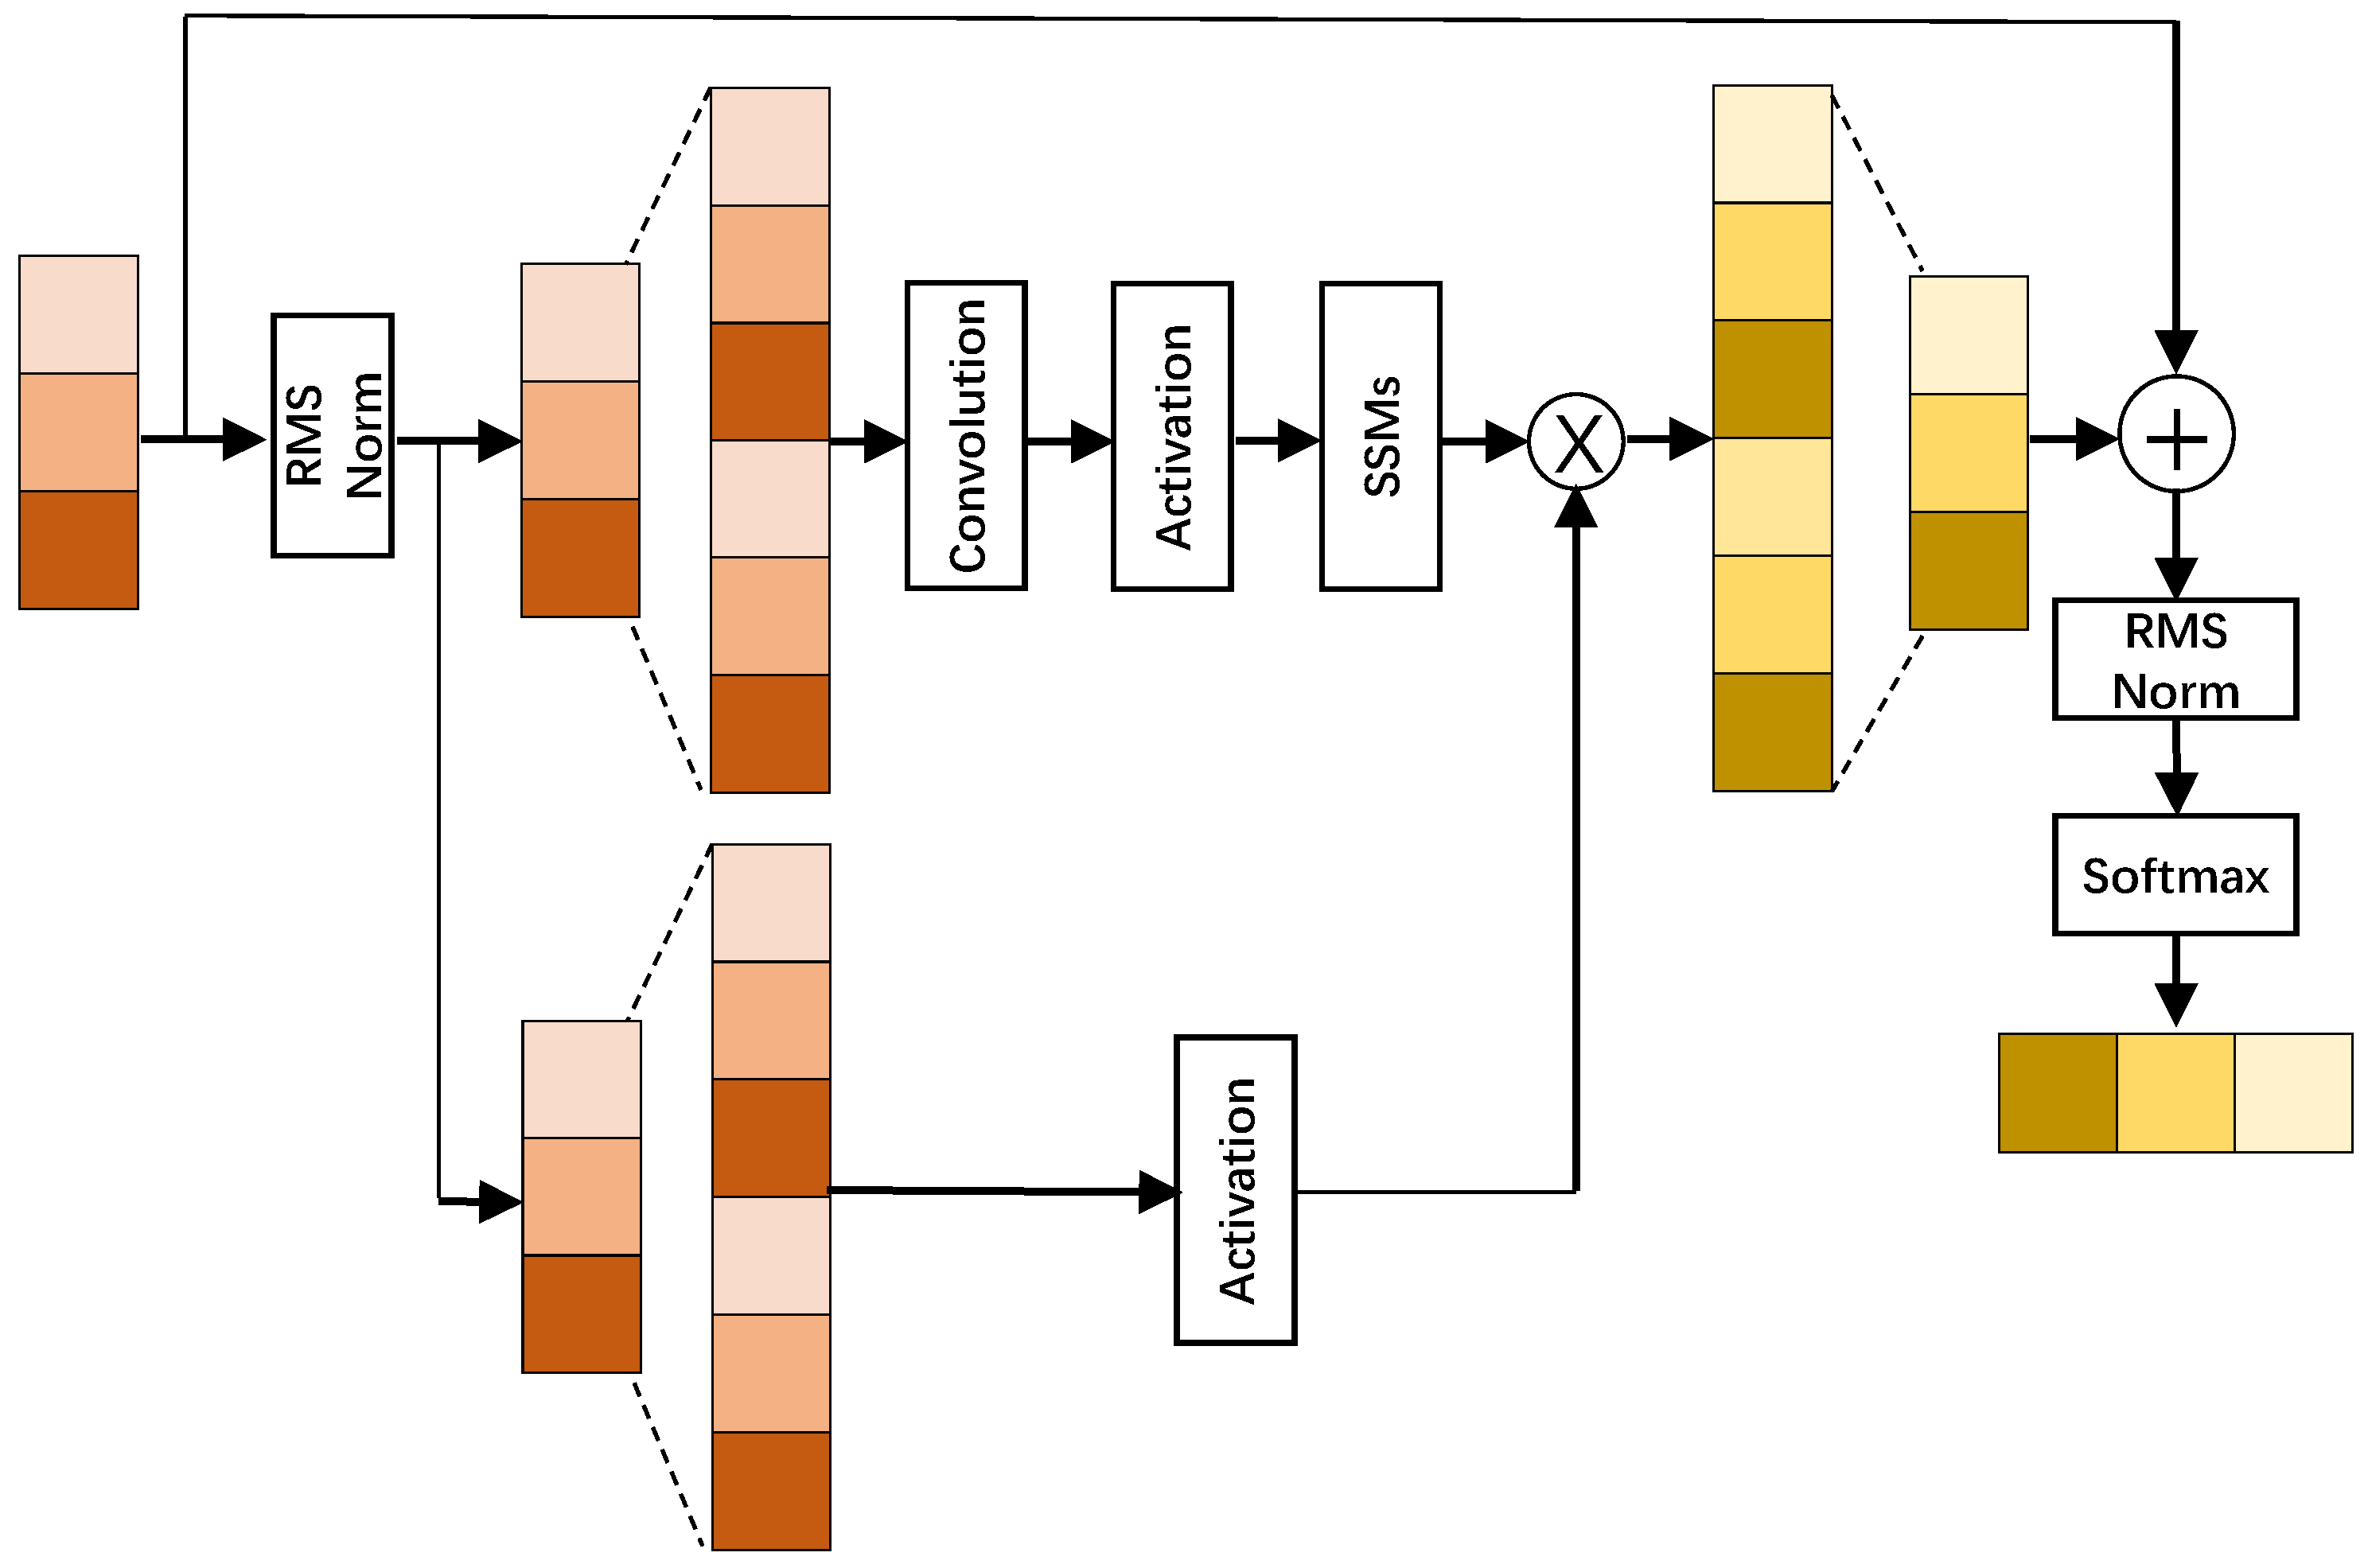
3.2. Mamba Attention
4. Experiment
4.1. Implementation Details
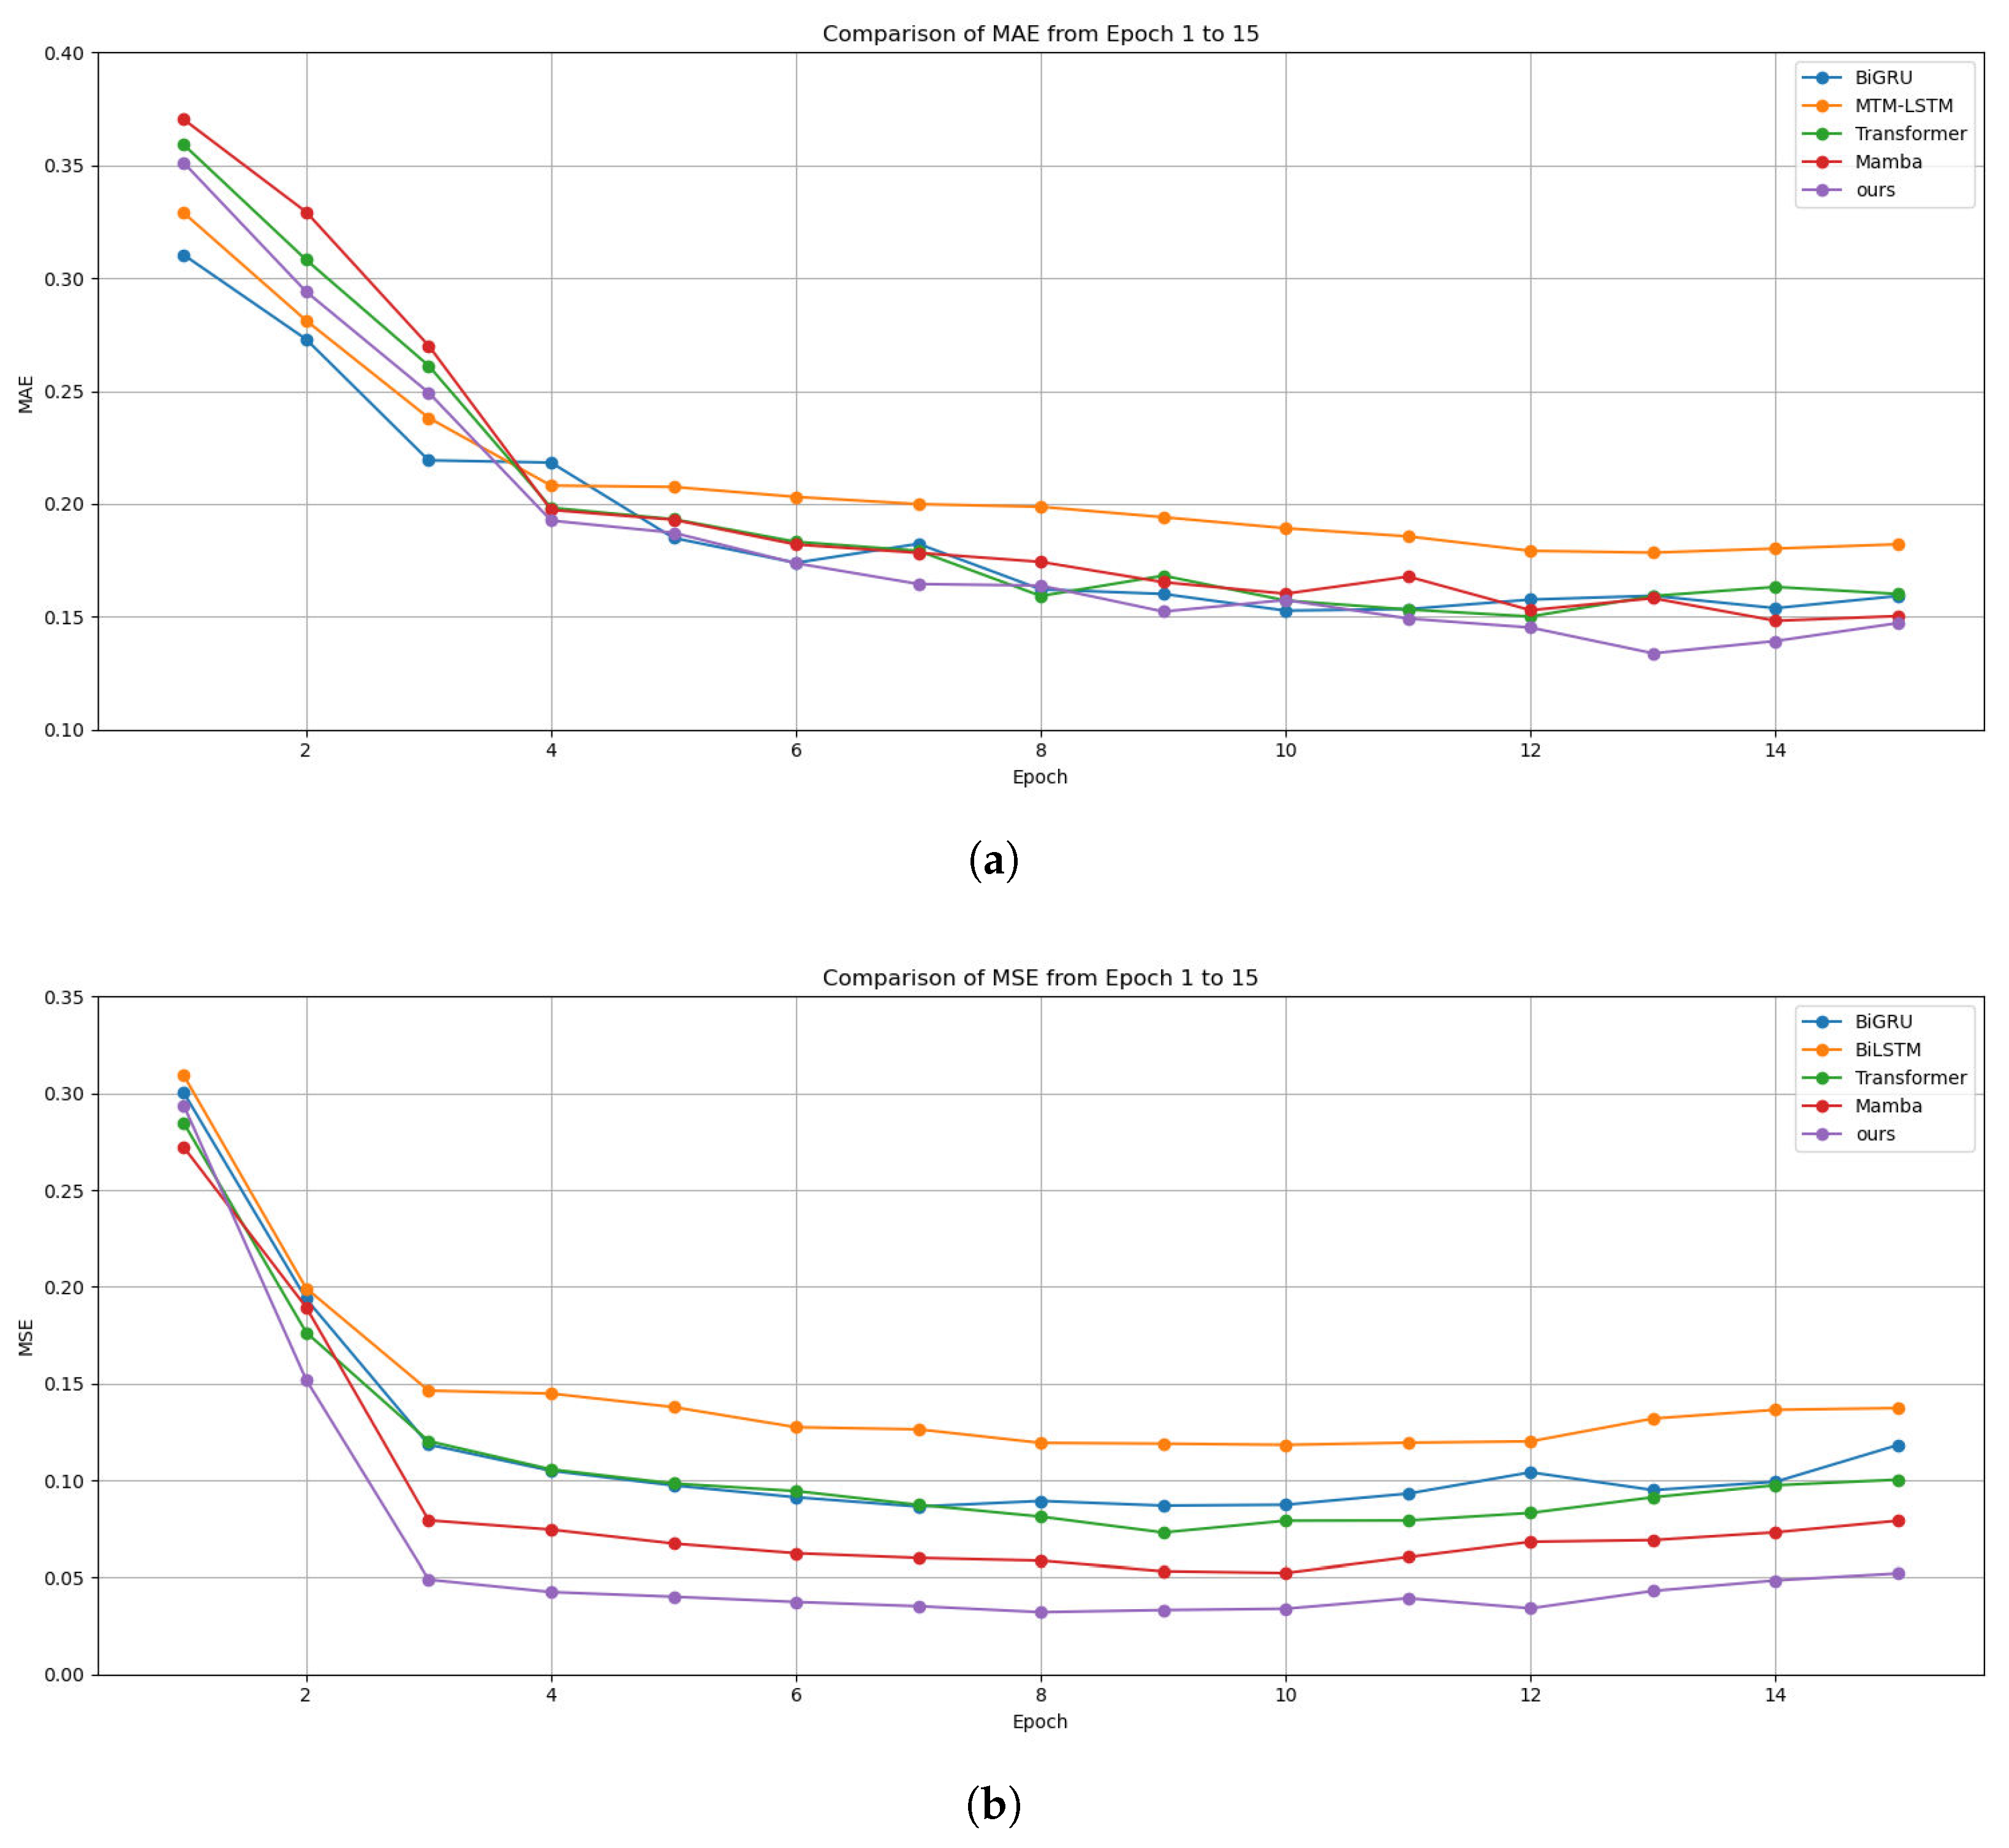
4.2. Results
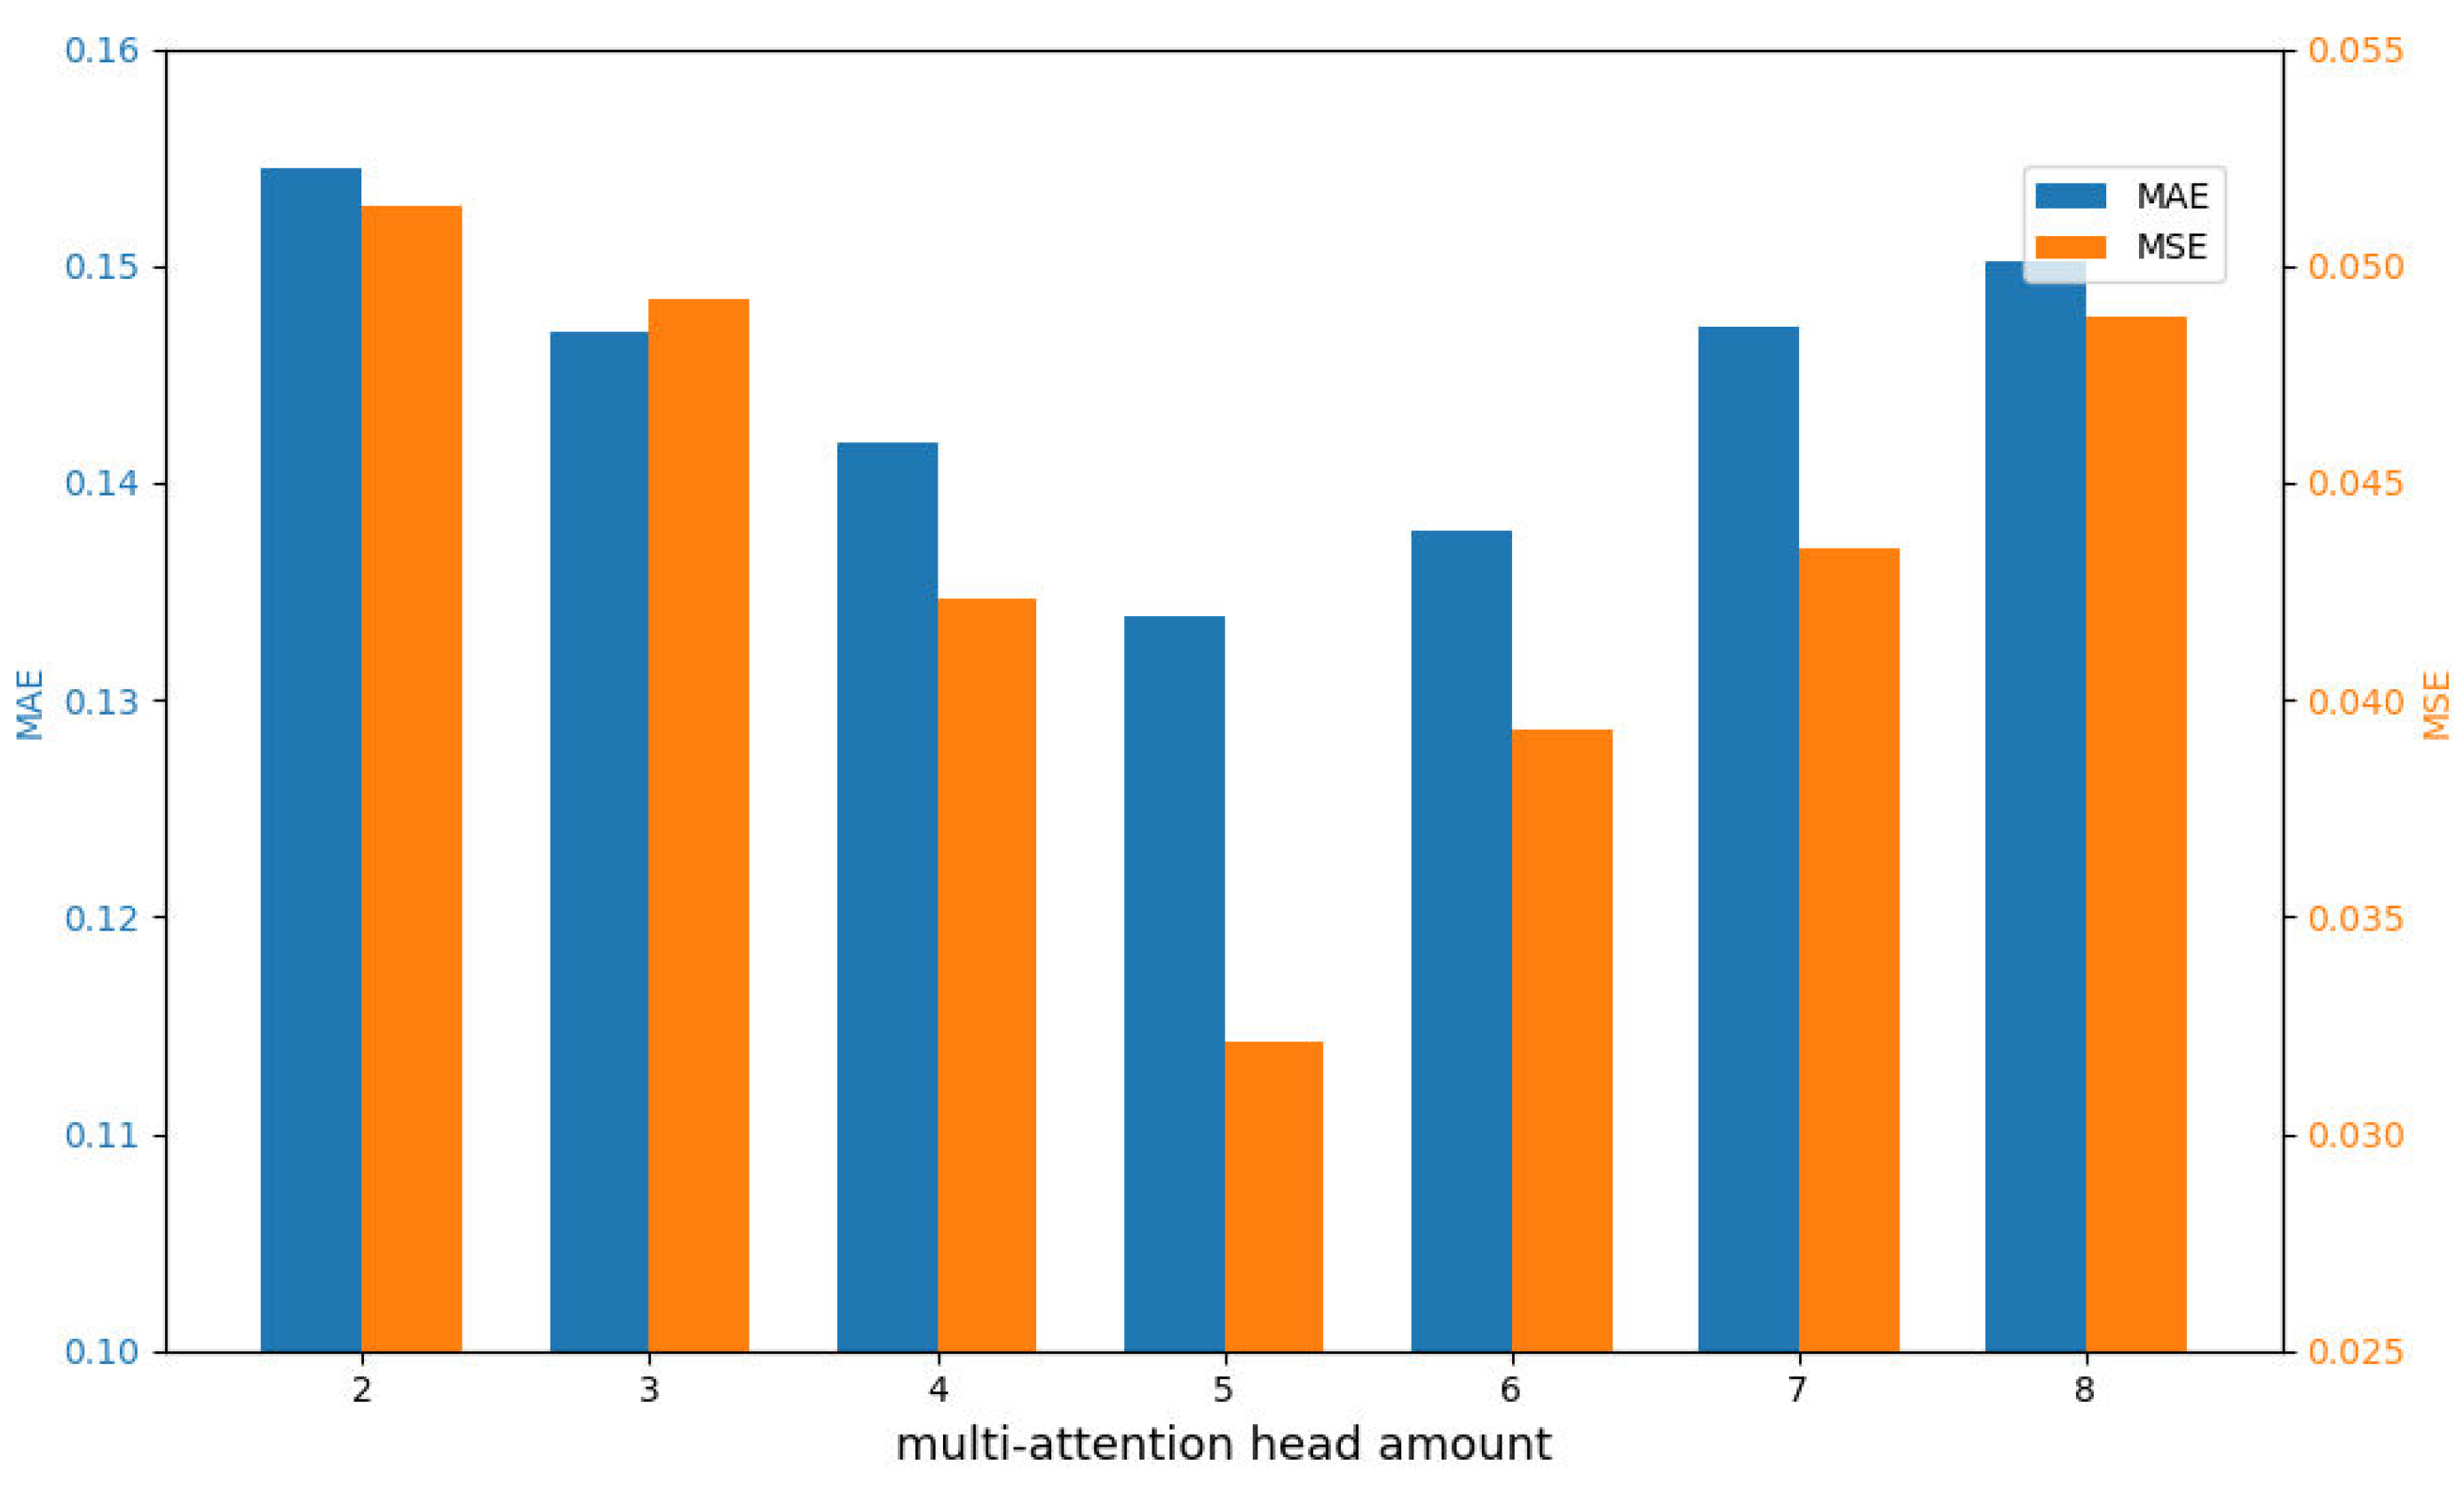
4.3. Discussion
5. Conclusions
- IEA: International Energy Agency
- ARFIMA: Fractional ARIMA
- LSSVMs: Least Squares Support Vector Machines
- SVR: Support Vector Regression
- RFR: Random Forest Regression
- CEEMDAN: Complete Ensemble Empirical Mode Decomposition with Adaptive Noise
- ANN: Artificial Neural Network
- MARS: Multivariate Adaptive Regression Splines
- MTMM: Hybrid Mamba–Transformer Metro Energy Consumption Prediction Model
- FFN: Feedforward Neural Network
- SSMs: State Space Modeling
- S6: Selective State Space
- MAE: Mean Absolute Error
- MSE: Mean Squared Error
Author Contributions
Funding
Data Availability Statement
Conflicts of Interest
References
- Han, D.; Wu, S. The capitalization and urbanization effect of subway stations: A network centrality perspective. Transp. Res. Part A Policy Pract. 2023, 176, 103815. [Google Scholar] [CrossRef]
- Su, W.; Li, X.; Zhang, Y.; Zhang, Q.; Wang, T.; Magdziarczyk, M.; Smolinski, A. High-speed rail, technological improvement, and carbon emission efficiency. Transp. Res. Part D Transp. Environ. 2025, 142, 104685. [Google Scholar] [CrossRef]
- Zhang, Y.; Zhao, N.; Li, M.; Xu, Z.; Wu, D.; Hillmansen, S.; Tsolakis, A.; Blacktop, K.; Roberts, C. A techno-economic analysis of ammonia-fuelled powertrain systems for rail freight. Transp. Res. Part D Transp. Environ. 2023, 119, 103739. [Google Scholar] [CrossRef]
- Feng, Z.; Chen, W.; Liu, Y.; Chen, H.; Skibniewski, M.J. Long-term equilibrium relationship analysis and energy-saving measures of metro energy consumption and its influencing factors based on cointegration theory and an ARDL model. Energy 2023, 263 Pt D, 125965. [Google Scholar] [CrossRef]
- Guan, B.; Liu, X.; Zhang, T.; Wang, X. Hourly energy consumption characteristics of metro rail transit: Train traction versus station operation. Energy Built Environ. 2023, 4, 568–575. [Google Scholar] [CrossRef]
- Li, H.; Fu, W.; Zhang, H.; Liu, W.; Sun, S.; Zhang, T. Spatio-temporal graph hierarchical learning framework for metro passenger flow prediction across stations and lines. Knowl.-Based Syst. 2025, 311, 113132. [Google Scholar] [CrossRef]
- Kong, G.; Hu, S.; Yang, Q. Uncertainty method and sensitivity analysis for assessment of energy consumption of underground metro station. Sustain. Cities Soc. 2023, 92, 104504. [Google Scholar] [CrossRef]
- Zheng, S.; Liu, Y.; Xia, W.; Cai, W.; Liud, H. Energy Consumption Optimization through Prediction Models in Buildings using Deep Belief Networks and a modified version of Big Bang-Big Crunch Theory. Build. Environ. 2025, 279, 112973. [Google Scholar] [CrossRef]
- Singh, S.K.; Das, A.K.; Singh, S.R.; Racherla, V. Prediction of rail-wheel contact parameters for a metro coach using machine learning. Expert Syst. Appl. 2023, 215, 119343. [Google Scholar] [CrossRef]
- Domala, V.; Kim, T. Application of Empirical Mode Decomposition and Hodrick Prescot filter for the prediction single step and multistep significant wave height with LSTM. Ocean Eng. 2023, 285 Pt 1, 115229. [Google Scholar] [CrossRef]
- Cao, W.; Yu, J.; Chao, M.; Wang, J.; Yang, S.; Zhou, M.; Wang, M. Short-term energy consumption prediction method for educational buildings based on model integration. Energy 2023, 283, 128580. [Google Scholar] [CrossRef]
- Gu, A.; Dao, T. Mamba: Linear-time sequence modeling with selective state spaces. arXiv 2023, arXiv:2312.00752. [Google Scholar]
- Huang, S.; Huang, H. AMFFNet: Adaptive Multi-Scale Feature Fusion Network for Urban Image Semantic Segmentation. Electronics 2025, 14, 2344. [Google Scholar] [CrossRef]
- Gao, Z.; Yang, N.; Huang, P.; Xu, W.; Tan, W.; Wu, Z. Self-Calibrating STAP Algorithm for Dictionary Dimensionality Reduction Based on Sparse Bayesian Learning. Electronics 2025, 14, 2350. [Google Scholar] [CrossRef]
- Kao, H.-Y.; Su, L.-Y.; Huang, S.-H.; Cheng, W.-K. A Neural Network Compiler for Efficient Data Storage Optimization in ReRAM-Based DNN Accelerators. Electronics 2025, 14, 2352. [Google Scholar] [CrossRef]
- Fonseca, G.; Marques, G.; Santos, P.A.; Jesus, R. Real-Time Mobile Application for Translating Portuguese Sign Language to Text Using Machine Learning. Electronics 2025, 14, 2351. [Google Scholar] [CrossRef]
- Chen, J.; Zhang, Z.; Yu, J.; Huang, H.; Zhang, R.; Xu, X.; Sheng, B.; Yan, H. DSDformer: An Innovative Transformer-Mamba Framework for Robust High-Precision Driver Distraction Identification. arXiv 2024, arXiv:2409.05587. [Google Scholar]
- Liu, P.; Zhao, J. Part-Attention-Based Pseudo-Label Refinement Reciprocal Compact Loss for Unsupervised Cattle Face Recognition. Electronics 2025, 14, 2343. [Google Scholar] [CrossRef]
- Zhang, Z.; Wu, J.; Huang, H.; Chen, J.; Hu, H.; Zhang, R. RNBformer: A High-Performance Roadside Noise Barriers Recognition Algorithm. In Proceedings of the 2024 3rd Asia Conference on Algorithms, Computing and Machine Learning, Shanghai, China, 22–24 March 2024. [Google Scholar]
- Zhao, Y.; Chen, J.; Zhang, Z.; Zhang, R. BA-Net: Bridge Attention for Deep Convolutional Neural Networks. In Proceedings of the European Conference on Computer Vision, Tel Aviv, Israel, 23 October 2022; pp. 297–312. [Google Scholar]
- Zhang, R.; Zou, R.; Zhao, Y.; Zhang, Z.; Chen, J.; Cao, Y.; Hu, C.; Song, H. BA-Net: Bridge Attention in Deep Neural Networks. Expert Syst. Appl. 2025, 292, 128525. [Google Scholar] [CrossRef]
- Cristino, T.M.; Neto, A.F.; Wurtz, F.; Delinchant, B. The evolution of knowledge and trends within the building energy efficiency field of knowledge. Energies 2022, 15, 691. [Google Scholar] [CrossRef]
- Zhang, L.; Wen, J.; Li, Y.; Chen, J.; Ye, Y.; Fu, Y.; Livingood, W. A review of machine learning in building load prediction. Appl. Energy 2021, 285, 116452. [Google Scholar] [CrossRef]
- Wang, Z.; Srinivasan, R.S. A review of artificial intelligence based building energy use prediction: Contrasting the capabilities of single and ensemble prediction models. Renew. Sustain. Energy Rev. 2017, 75, 796–808. [Google Scholar] [CrossRef]
- Ye, Y.; Zuo, W.; Wang, G. A comprehensive review of energy-related data for US commercial buildings. Energy Build. 2019, 186, 126–137. [Google Scholar] [CrossRef]
- Baldacci, L.; Golfarelli, M.; Lombardi, D.; Sami, F. Natural gas consumption forecasting for anomaly detection. Expert Syst. Appl. 2016, 62, 190–201. [Google Scholar] [CrossRef]
- Bilgili, M.; Sahin, B.; Yasar, A.; Simsek, E. Electric energy demands of Turkey in residential and industrial sectors. Renew. Sustain. Energy Rev. 2012, 16, 404–414. [Google Scholar] [CrossRef]
- Shaikh, F.; Ji, Q. Forecasting natural gas demand in China: Logistic modelling analysis. Int. J. Electr. Power Energy Syst. 2016, 77, 25–32. [Google Scholar] [CrossRef]
- Soldo, B.; Potočnik, P.; Šimunović, G.; Šarić, T.; Govekar, E. Improving the residential natural gas consumption forecasting models by using solar radiation. Energy Build. 2014, 69, 498–506. [Google Scholar] [CrossRef]
- Yuan, X.; Tan, Q.; Lei, X.; Yuan, Y.; Wu, X. Wind power prediction using hybrid autoregressive fractionally integrated moving average and least square support vector machine. Energy 2017, 129, 122–137. [Google Scholar] [CrossRef]
- Fang, T.; Lahdelma, R. Evaluation of a multiple linear regression model and SARIMA model in forecasting heat demand for district heating system. Appl. Energy 2016, 179, 544–552. [Google Scholar] [CrossRef]
- Divina, F.; García Torres, M.; Goméz Vela, F.A.; Vázquez Noguera, J.L. A comparative study of time series forecasting methods for short term electric energy consumption prediction in smart buildings. Energies 2019, 12, 1934. [Google Scholar] [CrossRef]
- Chen, Y.; Xu, P.; Chu, Y.; Li, W.; Wu, Y.; Ni, L.; Bao, Y.; Wang, K. Short-term electrical load forecasting using the Support Vector Regression (SVR) model to calculate the demand response baseline for office buildings. Appl. Energy 2017, 195, 659–670. [Google Scholar] [CrossRef]
- Bogomolov, A.; Lepri, B.; Larcher, R.; Antonelli, F.; Pianesi, F.; Pentland, A. Energy consumption prediction using people dynamics derived from cellular network data. EPJ Data Sci. 2016, 5, 1–15. [Google Scholar] [CrossRef]
- Ronao, C.A.; Cho, S.B. Anomalous query access detection in RBAC-administered databases with random forest and PCA. Inf. Sci. 2016, 369, 238–250. [Google Scholar] [CrossRef]
- Karijadi, I.; Chou, S.Y. A hybrid RF-LSTM based on CEEMDAN for improving the accuracy of building energy consumption prediction. Energy Build. 2022, 259, 111908. [Google Scholar] [CrossRef]
- Zheng, H.; Yuan, J.; Chen, L. Short-term load forecasting using EMD-LSTM neural networks with a Xgboost algorithm for feature importance evaluation. Energies 2017, 10, 1168. [Google Scholar] [CrossRef]
- Zhang, J.; Mao, S.; Yang, L.; Ma, W.; Li, S.; Gao, Z. Physics-Informed Deep Learning for Traffic State Estimation Based on the Traffic Flow Model and Computational Graph Method. Inf. Fusion 2024, 101, 101971. [Google Scholar] [CrossRef]
- Zhang, J.; Mao, S.; Zhang, S.; Yin, J.; Yang, L.; Gao, Z. EF-Former for Short-Term Passenger Flow Prediction During Large-Scale Events in Urban Rail Transit Systems. Inf. Fusion 2025, 117, 102916. [Google Scholar] [CrossRef]
- Qiu, H.; Zhang, J.; Yang, L.; Han, K.; Yang, X.; Gao, Z. Spatial–temporal multi-task learning for short-term passenger inflow and outflow prediction on holidays in urban rail transit systems. Transportation 2025. [Google Scholar] [CrossRef]
- Fernandes, T.; Magalhães, J.P.; Alves, W. Cybersecurity in Smart Railways: Exploring Risks, Vulnerabilities and Mitigation in the Data Communication Services. Green Energy Intell. Transp. 2025, 4, 100305. [Google Scholar] [CrossRef]
- Ray, S.; Kasturi, K.; Nayak, M.R. Multi-Objective Electric Vehicle Charge Scheduling for Photovoltaic and Battery Energy Storage Based Electric Vehicle Charging Stations in Distribution Network. Green Energy Intell. Transp. 2025, 4, 100296. [Google Scholar] [CrossRef]
- Cicek, D.; Kantarci, B.; Schillo, S. A Comparative Review of User Acceptance Factors for Drones and Sidewalk Robots in Autonomous Last Mile Delivery. Green Energy Intell. Transp. 2025, 4, 100310. [Google Scholar] [CrossRef]
- Wang, J.; Zhang, W.; Li, Y.; Wang, J.; Dang, Z. Forecasting wind speed using empirical mode decomposition and Elman neural network. Appl. Soft Comput. 2014, 23, 452–459. [Google Scholar] [CrossRef]
- Mao, Y.; Yu, J.; Zhang, N.; Dong, F.; Wang, M.; Li, X. A hybrid model of commercial building cooling load prediction based on the improved NCHHO-FENN algorithm. J. Build. Eng. 2023, 78, 107660. [Google Scholar] [CrossRef]
- Torres, M.E.; Colominas, M.A.; Schlotthauer, G.; Flandrin, P. A complete ensemble empirical mode decomposition with adaptive noise. In Proceedings of the 2011 IEEE International Conference on Acoustics, Speech and Signal Processing (ICASSP), Prague, Czech Republic, 22–27 May 2011; pp. 4144–4147. [Google Scholar]
- Lin, Z. Short-term prediction of building sub-item energy consumption based on the CEEMDAN-BiLSTM method. Front. Energy Res. 2022, 10, 908544. [Google Scholar] [CrossRef]
- Vaswani, A.; Shazeer, N.; Parmar, N.; Uszkoreit, J.; Jones, L.; Gomez, A.N.; Kaiser, Ł.; Polosukhin, I. Attention is all you need. Adv. Neural Inf. Process. Syst. 2017, 30, 1–11. [Google Scholar]
- Tay, Y.; Dehghani, M.; Bahri, D.; Metzler, D. Efficient transformers: A survey. ACM Comput. Surv. 2022, 55, 1–28. [Google Scholar] [CrossRef]
- Guo, S.; Lin, Y.; Wan, H.; Li, X.; Cong, G. Learning dynamics and heterogeneity of spatial-temporal graph data for traffic forecasting. IEEE Trans. Knowl. Data Eng. 2021, 34, 5415–5428. [Google Scholar] [CrossRef]
- Xu, M.; Dai, W.; Liu, C.; Gao, X.; Lin, W.; Qi, G.; Xiong, H. Spatial-temporal transformer networks for traffic flow forecasting. arXiv 2020, arXiv:2001.02908. [Google Scholar]
- Lei, H.; Guo, Y.; Khan, N. Forecasting energy use and efficiency in transportation: Predictive scenarios from ANN models. Int. J. Hydrogen Energy 2025, 106, 1373–1384. [Google Scholar] [CrossRef]
- Sahraei, M.A.; Duman, H.; Çodur, M.Y.; Eyduran, E. Prediction of transportation energy demand: Multivariate adaptive regression splines. Energy 2021, 224, 120090. [Google Scholar] [CrossRef]
- Hoxha, J.; Çodur, M.Y.; Mustafaraj, E.; Kanj, H.; El Masri, A. Prediction of transportation energy demand in Türkiye using stacking ensemble models: Methodology and comparative analysis. Appl. Energy 2023, 350, 121765. [Google Scholar] [CrossRef]
- Hochreiter, S.; Schmidhuber, J. Long short-term memory. Neural Comput. 1997, 9, 1735–1780. [Google Scholar] [CrossRef]
- Cho, K.; Van Merriënboer, B.; Gulcehre, C.; Bahdanau, D.; Bougares, F.; Schwenk, H.; Bengio, Y. Learning phrase representations using RNN encoder-decoder for statistical machine translation. arXiv 2014, arXiv:1406.1078. [Google Scholar]
- He, K.; Yang, Q.; Ji, L.; Zhang, X.; Liu, S. Financial time series forecasting with the deep learning ensemble model. Mathematics 2023, 11, 1054. [Google Scholar] [CrossRef]
- Mohammadi, M.; Jamshidi, S.; Rezvanian, A.; Sadeghi-Niaraki, A. Advanced fusion of MTM-LSTM and MLP models for time series forecasting: An application for forecasting the solar radiation. Meas. Sens. 2024, 33, 101179. [Google Scholar] [CrossRef]


| Method | Venue | MSE↓ | MAE↓ |
|---|---|---|---|
| LSTM [55] | 1997 | 0.1452 | 0.2811 |
| BiLSTM [55] | 1997 | 0.1183 | 0.2453 |
| GRU [56] | 2014 | 0.1392 | 0.2689 |
| BiGRU [56] | 2014 | 0.0864 | 0.1527 |
| Transformer [48] | 2017 | 0.0730 | 0.1501 |
| ARMA-CNNLSTM [57] | 2023 | 0.1257 | 0.2617 |
| Mamba [12] | 2023 | 0.0523 | 0.1482 |
| MTM-LSTM [58] | 2024 | 0.0930 | 0.1784 |
| Authors | - | 0.0321 | 0.1338 |
| Method | Prediction Type | MSE↓ | MAE↓ |
|---|---|---|---|
| ARMA-CNNLSTM | univariate | 0.1389 | 0.2724 |
| multivariate | 0.1257 | 0.2617 | |
| MTM-LSTMM | univariate | 0.1045 | 0.1864 |
| multivariate | 0.0930 | 0.1784 | |
| Authors | univariate | 0.0432 | 0.1465 |
| multivariate | 0.0321 | 0.1338 |
| Prediction Length | Time Step 20 | Time Step 30 | Time Step 40 | |||
|---|---|---|---|---|---|---|
| MSE | MAE | MSE | MAE | MSE | MAE | |
| 5 | 0.0429 | 0.1437 | 0.0311 | 0.1331 | 0.0264 | 0.1296 |
| 10 | 0.0448 | 0.1463 | 0.0321 | 0.1338 | 0.0296 | 0.1303 |
| 15 | 0.0519 | 0.1582 | 0.0492 | 0.1529 | 0.0382 | 0.1473 |
| Model | Params (M) | FLOPs (G) |
|---|---|---|
| LSTM | 12.6 | 19.7 |
| BiLSTM | 25.2 | 39.4 |
| GRU | 9.1 | 14.8 |
| BiGRU | 18.2 | 29.6 |
| Transformer | 24.9 | 35.3 |
| ARMA-CNNLSTM | 6.1 | 12.7 |
| Mamba | 15.4 | 26.5 |
| MTM-LSTM | 27.3 | 45.9 |
| MTMM | 14.6 | 35.8 |
Disclaimer/Publisher’s Note: The statements, opinions and data contained in all publications are solely those of the individual author(s) and contributor(s) and not of MDPI and/or the editor(s). MDPI and/or the editor(s) disclaim responsibility for any injury to people or property resulting from any ideas, methods, instructions or products referred to in the content. |
© 2025 by the authors. Licensee MDPI, Basel, Switzerland. This article is an open access article distributed under the terms and conditions of the Creative Commons Attribution (CC BY) license (https://creativecommons.org/licenses/by/4.0/).
Share and Cite
Long, L.; Chen, Z.; Wu, J.; Fu, Q.; Zhang, Z.; Feng, F.; Zhang, R. A Hybrid Transformer–Mamba Model for Multivariate Metro Energy Consumption Forecasting. Electronics 2025, 14, 2986. https://doi.org/10.3390/electronics14152986
Long L, Chen Z, Wu J, Fu Q, Zhang Z, Feng F, Zhang R. A Hybrid Transformer–Mamba Model for Multivariate Metro Energy Consumption Forecasting. Electronics. 2025; 14(15):2986. https://doi.org/10.3390/electronics14152986
Chicago/Turabian StyleLong, Liheng, Zhiyao Chen, Junqian Wu, Qing Fu, Zirui Zhang, Fan Feng, and Ronghui Zhang. 2025. "A Hybrid Transformer–Mamba Model for Multivariate Metro Energy Consumption Forecasting" Electronics 14, no. 15: 2986. https://doi.org/10.3390/electronics14152986
APA StyleLong, L., Chen, Z., Wu, J., Fu, Q., Zhang, Z., Feng, F., & Zhang, R. (2025). A Hybrid Transformer–Mamba Model for Multivariate Metro Energy Consumption Forecasting. Electronics, 14(15), 2986. https://doi.org/10.3390/electronics14152986