1. Introduction
With the gradual commercialization of 5G-A, more reliable communication support is being provided for emerging applications such as the industrial Internet of Things and autonomous driving [
1]. This development signals an accelerated transition of the global telecommunications industry toward an intelligent era characterized by higher data rates, lower latency, and massive connectivity [
2], as well as more accurate and timely sensing of the environment and targets [
3]. However, the increasing diversity of service requirements and the growing complexity of application scenarios are imposing more stringent demands on communication performance, while further intensifying the scarcity of available spectrum resources [
4]. To mitigate the increasingly severe spectrum congestion problem, ISAC technology has been proposed and extensively studied in 5G-A and the upcoming 6G. Researchers have explored various approaches, such as time-division [
5] and frequency-division methods, which are simple to implement but inevitably both communication and sensing [
6]. Consequently, the research on integrated waveforms has become the focal point for future advancements in ISAC technology [
7], which can not only improve the efficiency of resource utilization but also enhance communication reliability and sensing accuracy, further reducing hardware deployment costs [
8,
9,
10].
At present, research on ISAC waveform design is predominantly centered around communication-centric approaches [
11], most notably by adapting and extending the widely adopted OFDM waveform to support joint sensing capabilities. The OFDM signals exhibit excellent performance, offering high data rates, strong interference resistance, and flexible parameter configurations [
12]. Moreover, the ambiguity function of OFDM signals exhibits a thumbtack-like shape, with its continuity facilitating coherent accumulation [
13]. As a result, numerous radar algorithms based on OFDM have been proposed in the academic community [
14,
15,
16,
17]. However, the implementation of sensing functions using OFDM is subject to range limitations [
18]. Specifically, the maximum sensing range is constrained by the CP duration, which is typically longer than the maximum delay spread. When the echo delay exceeds the CP duration, inter-symbol interference occurs, leading to significant degradation in detection performance [
19].
To address the issue of long-range sensing, Tang et al. utilized pilot signals or existing reference signals for long-range sensing [
20,
21]. However, due to the limited proportion of pilot signals, the accumulated energy from the target echoes is insufficient, making it difficult to detect distant targets. P.Yuan et al. proposed to extend the CP length by adding extra CP to the transmitted signal, which enhances the sensing range while mitigating the impact of high-speed scenarios [
22]. Hakobyan et al. proposed ensuring consistency between consecutive OFDM symbols so that correct signals can still be demodulated even when the echo delay exceeds the CP duration [
23].
However, most of these approaches achieve long-range sensing by modifying the OFDM signal structure or adjusting the CP length. While such modifications can enhance sensing capabilities, they inevitably change the signal structure, which increases hardware deployment complexity and computational costs. Nevertheless, a simple and practical algorithm capable of extending the sensing range without altering the signal structure is still lacking. Moreover, the challenge of ambiguous targets, which is widely recognized in radar systems, has not yet been sufficiently addressed in the context of CP-OFDM. In this paper, we propose a series of solutions to extend the sensing range of CP-OFDM systems. The main contributions of this paper are summarized as follows:
To address the degradation of range-Doppler processing gain caused by delays associated with long-range targets, we propose a delay compensation-based sensing algorithm. The algorithm continuously compensates for the delay and restores the integrity of the received CP-OFDM signal, then processes each delay-compensated signal to obtain partial results, which are combined into a complete range-Doppler map;
We analyze the problem of ambiguous targets in CP-OFDM systems caused by phase periodicity due to excessive echo delay. Specifically, we investigate the impact of ambiguous targets on true target detection in single-target scenarios, conduct a theoretical analysis of the detection probability, and propose a detection strategy to distinguish between ambiguous and true targets. Furthermore, we extend the analysis to multi-target scenarios and theoretically demonstrate that the correlation between adjacent symbols affects both the accuracy of the detection strategy and the accumulated echo energy corresponding to ambiguous targets;
To reduce the correlation between adjacent symbols, thereby improving the correct detection probability and suppressing the accumulated echo energy corresponding to ambiguous targets, we investigate the reduction of inter-symbol correlation by selectively replacing portions of the symbol data, and propose a sequence design scheme. A Simulated Annealing algorithm is employed for sequence optimization;
Simulation results demonstrate that when the echo delay exceeds the CP duration, the proposed delay compensation algorithm provides up to 20 dB gain. In addition, Monte Carlo experiments show that the sequence design can suppress the accumulated echo energy corresponding to ambiguous targets by up to 15 dB. A higher redundancy ratio results in stronger suppression, highlighting the inherent trade-off between communication and sensing performance in practical ISAC system deployments.
The subsequent sections of this paper are structured as follows.
Section 2 presents the system model of this paper.
Section 3 presents a delay compensation-based sensing algorithm.
Section 4 analyzes the ambiguous target problem and introduces the detection strategy along with sequence design.
Section 5 validates the effectiveness of the proposed algorithm through extensive simulations, while
Section 6 serves as the conclusion of the paper.
3. Sensing Algorithm with Delay Compensation
In this section, we briefly analyze the reasons behind the detection range limitations of CP-OFDM signals. Then, we propose a sensing algorithm with delay compensation to detect targets beyond the CP duration.
As shown in the original sensing algorithm, its performance largely depends on the ability to remove communication information, which in turn relies on the completeness of the received signal. As demonstrated in
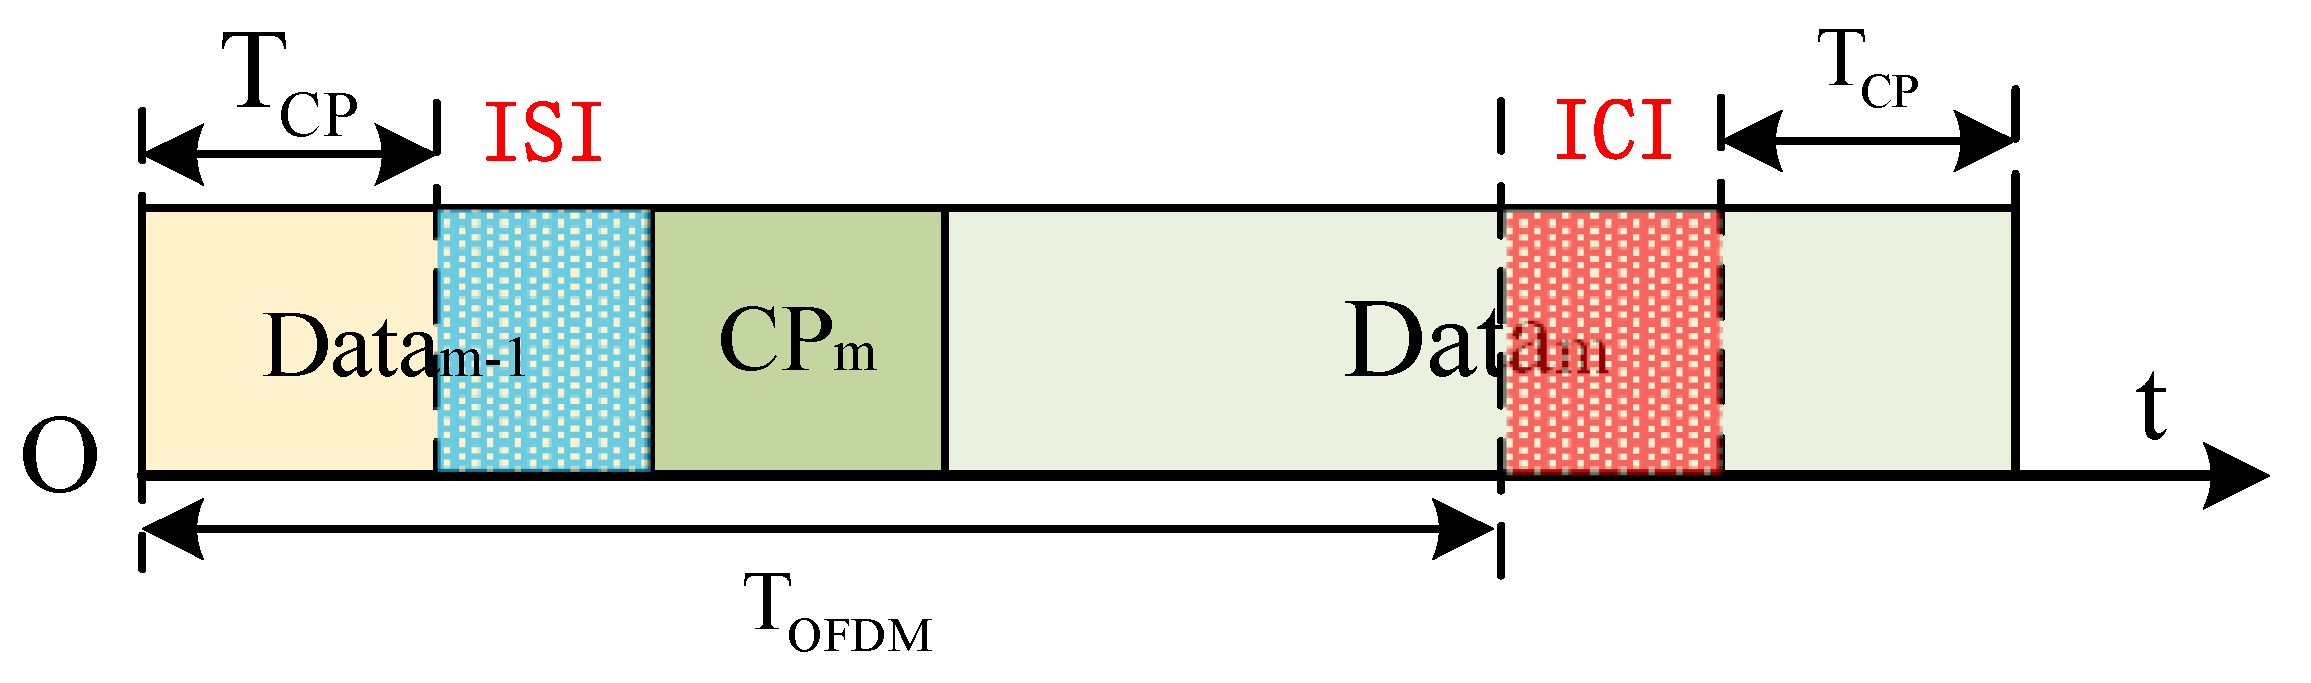
Figure 3, when the reception delay exceeds the CP duration, the received signal includes components from the preceding OFDM symbol (
), resulting in ISI. Simultaneously, the current symbol (
) is only partially received, disrupting the orthogonality of the OFDM waveform and introducing ICI. These two forms of interference hinder the accurate removal of communication content and significantly degrade the algorithm’s overall sensing performance. The detailed derivation of interference can be found in [
19] and is not repeated here.
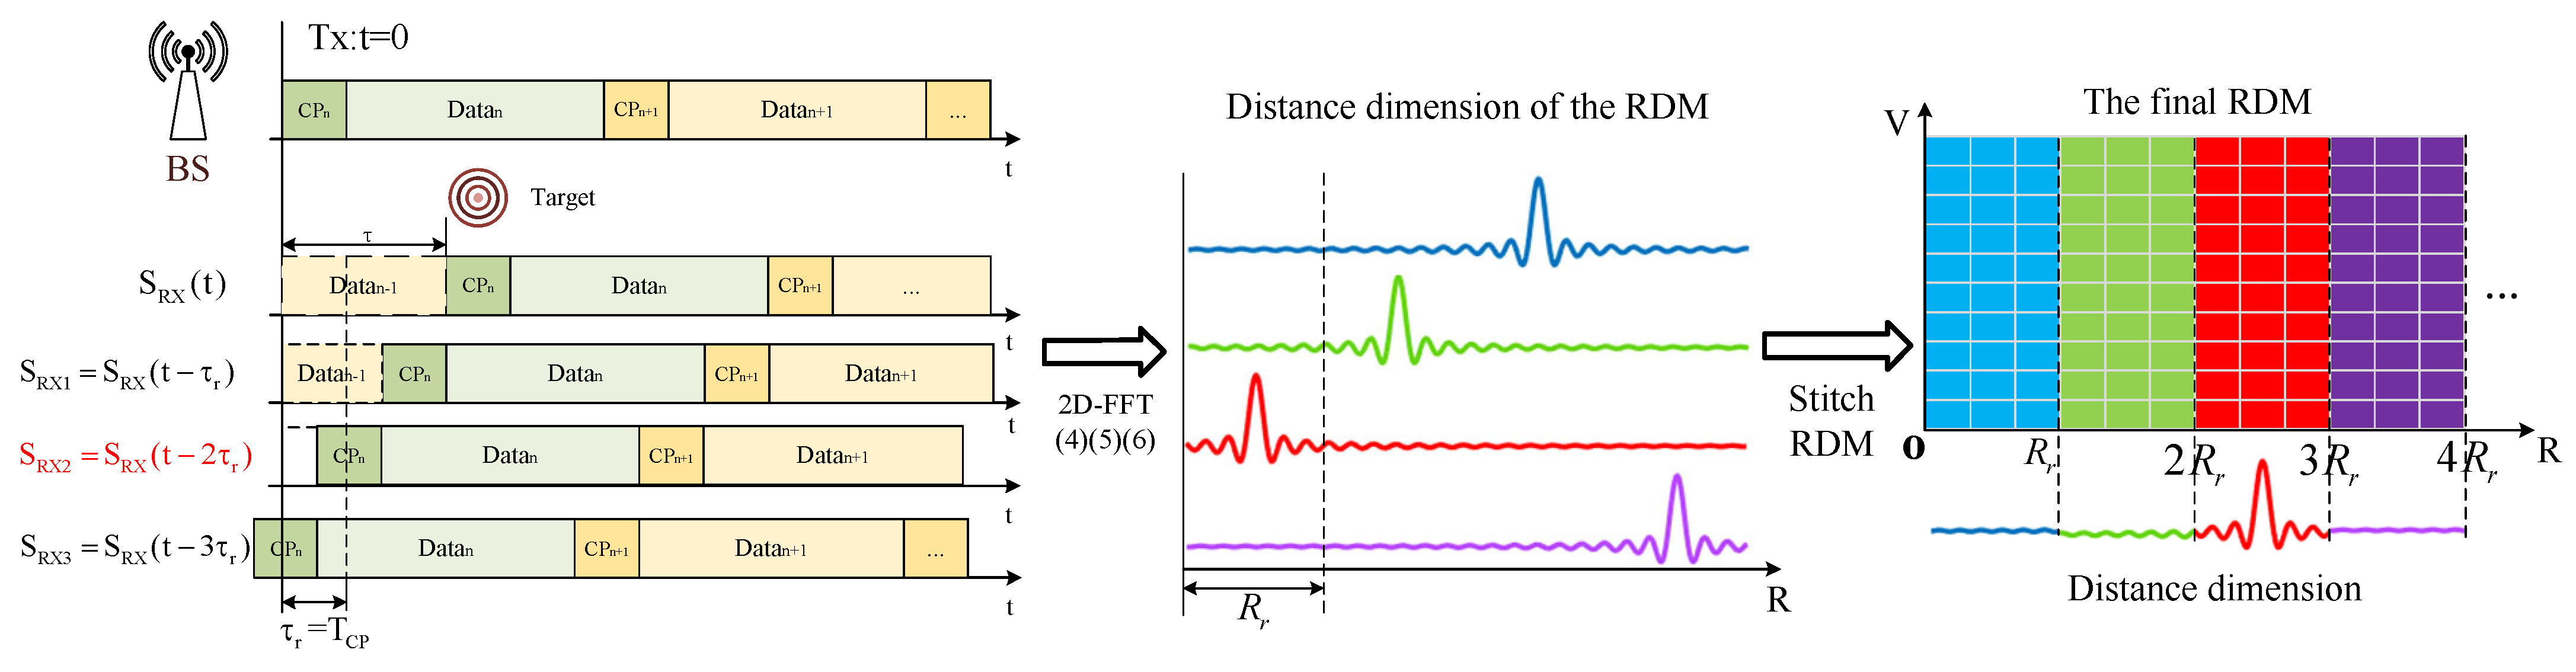
Based on the above analysis, the remaining part after removing the ISI is used to recover the communication information and is defined as the effective signal. To improve the proportion of effective signals, a delay compensation-based sensing algorithm is proposed, as shown in
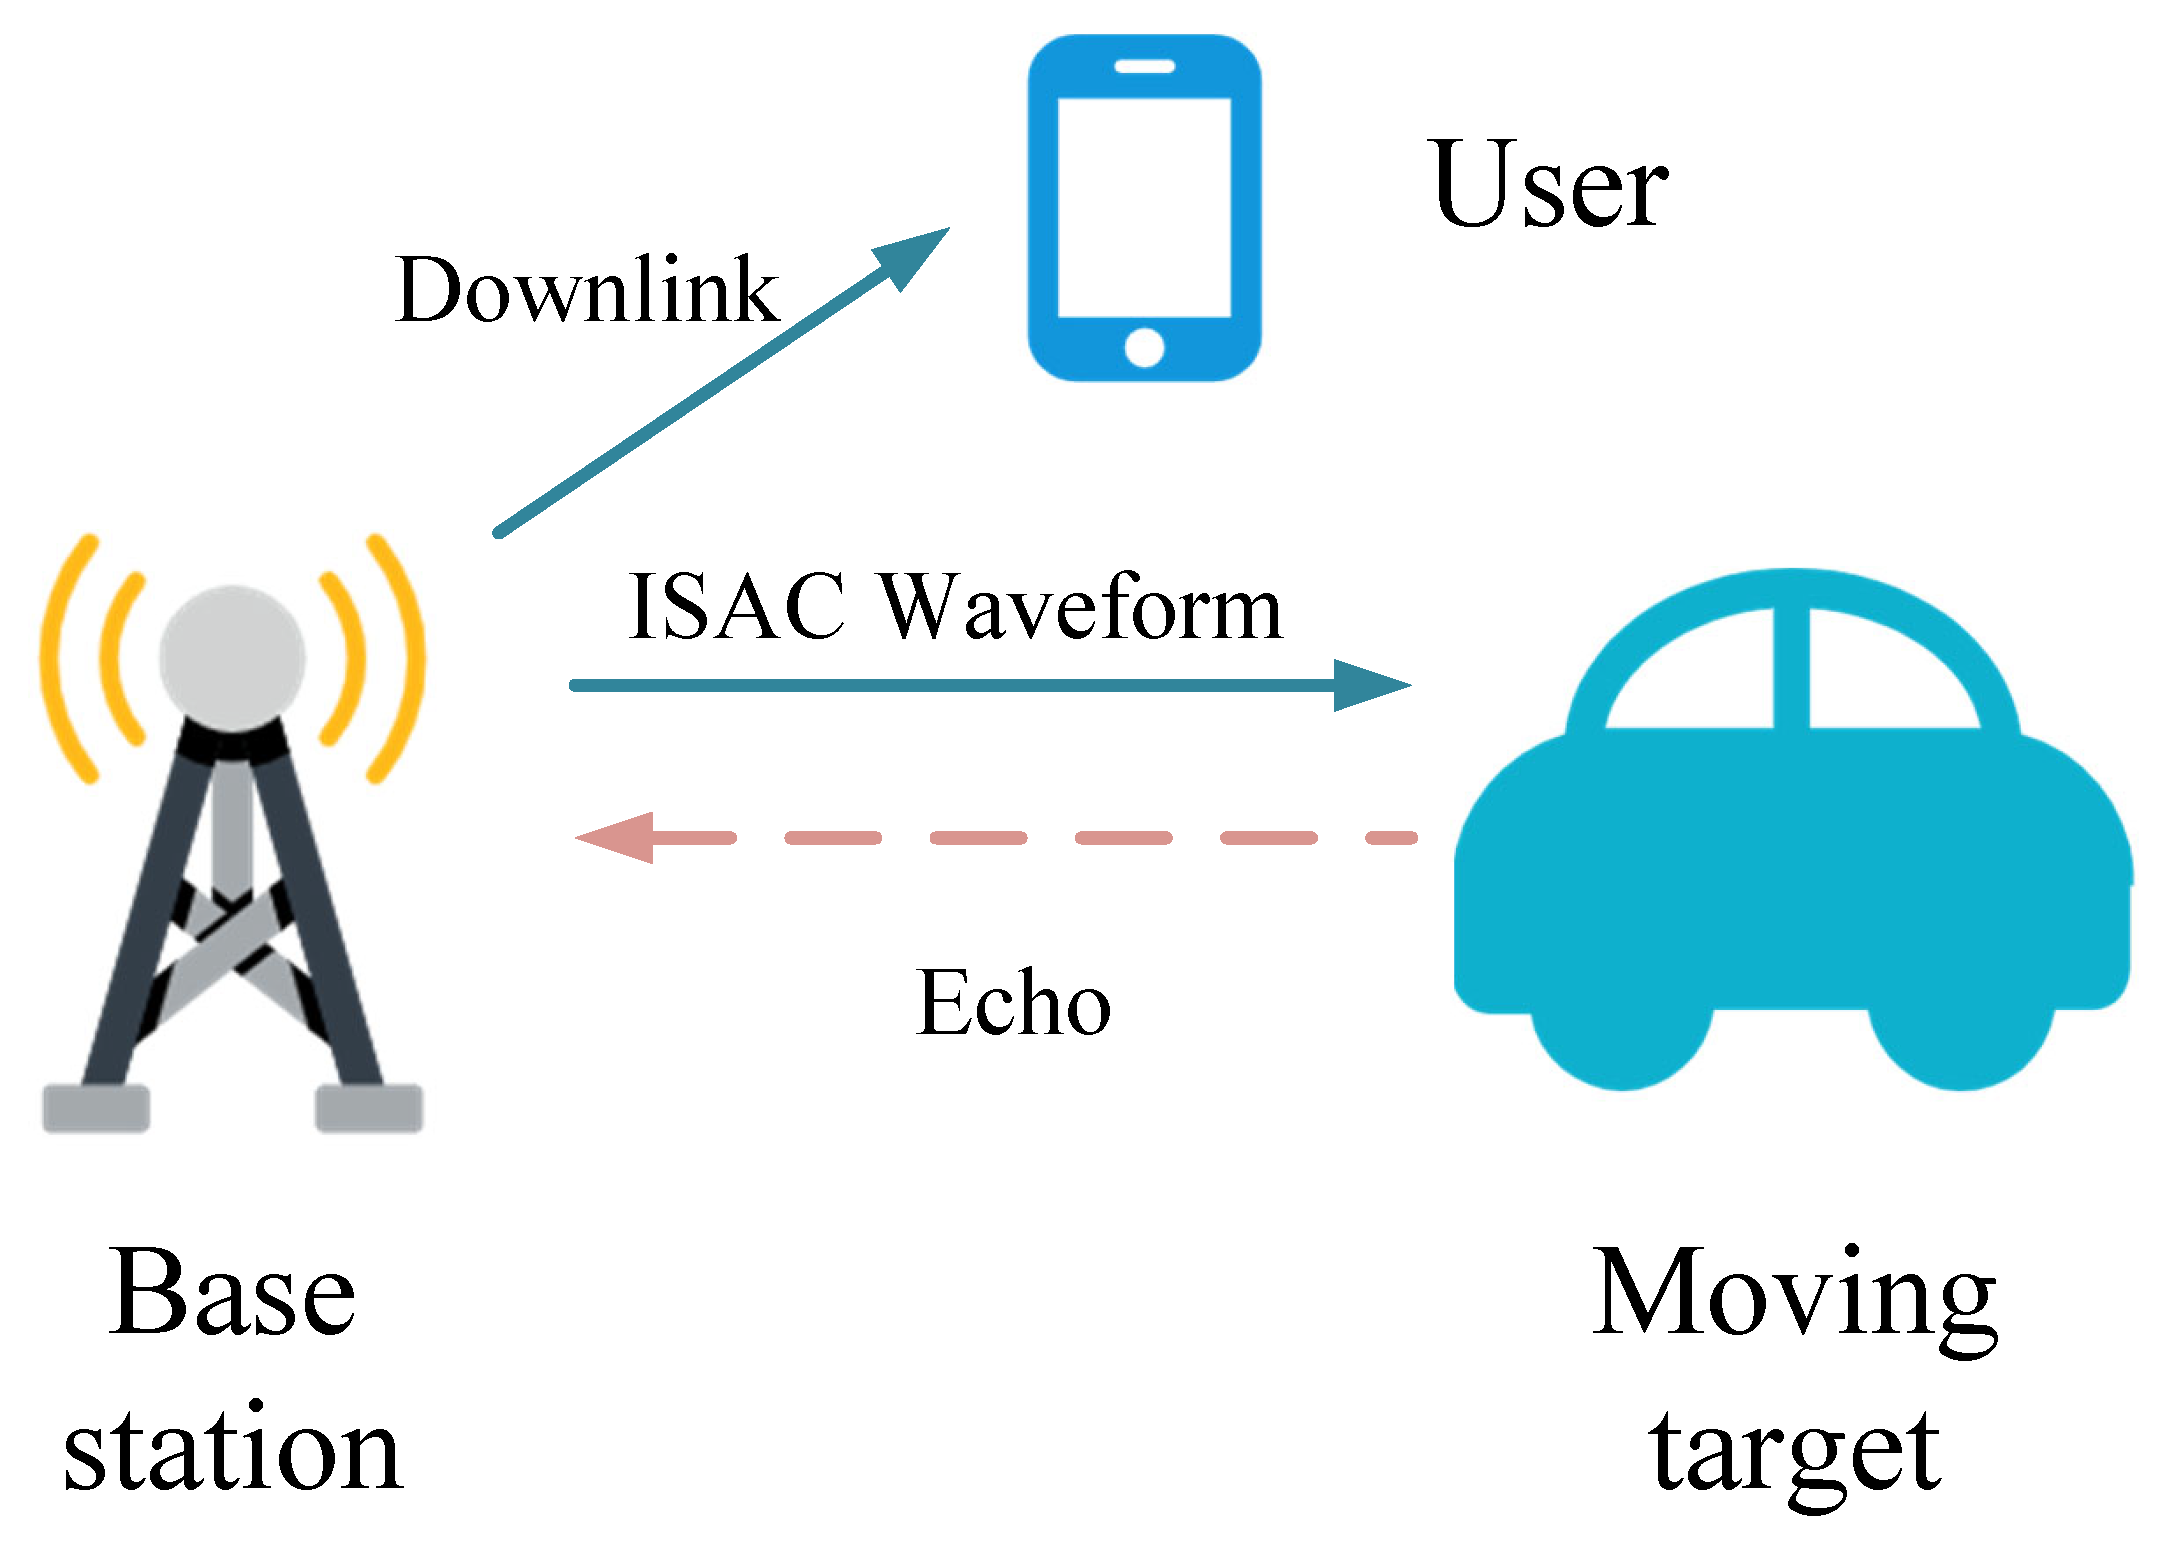
Figure 4. Specifically, in the BS monostatic sensing model, the receiver of the BS introduces a fixed time offset, changes the fixed delay, and performs reception in segments. The received signal for each segment
is as follows:
where the delay step size is
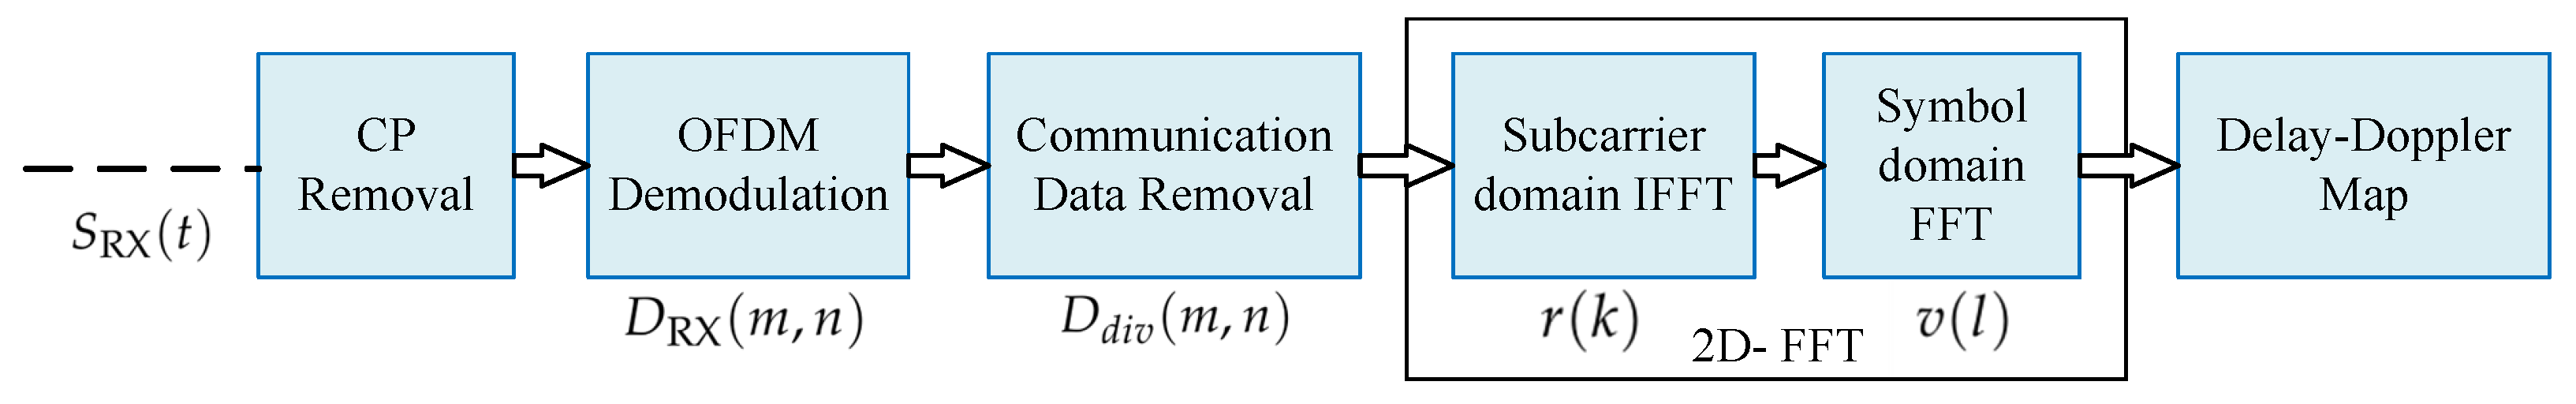
. Then, the received signal is processed using the algorithm from
Section 2, as shown in (
5)–(
7). The above process is iteratively performed until the observation distance covers the maximum sensing range. Obtain multiple segments of RDMs, whose range dimension
can be expressed as
For each RDM, one segment corresponding to the compensated time delay is extracted in terms of the number of range bins. These segments are subsequently concatenated along the range dimension to construct the following complete RDM:
where
denotes the distance dimension in the RDM calculated by each receiver
, and
represents the floor function. After delay compensation, only the compensated portion is extracted as part of the final RDM, i.e., each observation contains only a fixed compensated offset. According to (
8), the observation range for each compensation, denoted as
, can be calculated as
Consequently, the complete sensing algorithm with delay compensation is summarized in Algorithm 1, with its effectiveness of addressing echo delay exceeding CP duration demonstrated in
Section 5. In practical applications, the compensation delay can be flexibly adjusted, enabling continuous extension of the maximum observable range of the stitched RDM.
| Algorithm 1 Sensing Algorithm with Delay Compensation |
- 1:
Initialize: Set the compensation delay - 2:
Set maximum sensing range . - 3:
Set iteration number - 4:
repeat - 5:
- 6:
Removal of CP and demodulation using FFT. - 7:
- 8:
Extract and store the data of RDM. - 9:
Update . - 10:
until - 11:
Output the final concatenated RDM via ( 12).
|
4. Sensing Performance Analysis and Improvement
In this section, we analyze the system’s long-range sensing performance and investigate the impact of ambiguous targets in both single-target and multi-target scenarios. Furthermore, we propose a sequential design scheme to enhance the accuracy of the true-versus-ambiguous target discrimination strategy and improve the suppression performance for ambiguous targets.
4.1. Analysis of the Single-Target Scenario
If the compensation delay exceeds the duration of one OFDM symbol, the periodicity of the delay phase implies that the accumulated range-Doppler points remain unchanged before stitching. However, after RDM stitching, an additional target appears at a range offset equivalent to the propagation distance of one OFDM symbol from the true target. This additional response is defined as an ambiguous target. Meanwhile, since the received signal contains contributions from both the preceding and succeeding symbols, the inability to distinguish between them leads to ambiguity in target detection. Therefore, to accurately separate true targets from ambiguous ones, it is necessary to incorporate a symbol-decision mechanism into the algorithm that can identify whether the received data originates from the preceding or succeeding symbol, thereby enabling effective discrimination between true and ambiguous targets.
Assuming that the maximum allowable round-trip delay of the target is
, we only need to determine which of the first two symbols corresponds to the true target and which one is the ambiguous target. Before proceeding, we first define
With reference to (
3), where the target scattering coefficient is substituted accordingly, the resulting binary hypothesis testing problem is then formulated as follows:
where
denotes Gaussian white noise with mean 0 and variance
, namely
. Assume that all samples are irrelevant and independent. By applying GLRT, when
should be declared as true, where
denotes the decision threshold. We apply the minimum error probability criterion for decision-making, assuming equal prior probabilities, i.e.,
. In this case,
. Equation (
18) can be simplified as
Since the phase
is unknown, the magnitude can be decomposed as
where
denotes taking the real part of the sequence elements, and
denotes taking the conjugate of the sequence elements. Since the magnitudes of
and
are fixed, to minimize the above expression, the subsequent terms should be maximized. From the assumption (
17), the maximum value of their conjugate multiplication is the magnitude. Thus, we have
where
, then substitute (
21) in to (
19), resulting in:
which is the detection strategy, that is, to determine which symbol
is closer to. Next, we further derive the probability of error associated with this detection strategy. Assume that the test statistic is
,
and hypothesis
holds, then:
where
E denote the symbol energy, and
represent the correlation between adjacent symbols, then
It can be shown that the distribution of the test statistic follows a non-central chi-square distribution with 2 degrees of freedom:
Similarly, under the hypothesis
that holds, the test statistic
,
still follows the aforementioned distribution. According to the test statistic (
27), the theoretical corresponding error probability
can be expressed as
where
is the first-order Marcum Q-function, which is a special function commonly used in radar signal processing, wireless communications, and statistical detection theory:
where
is the modified Bessel function of the first kind and order zero. where
is the modified Bessel function of the first kind and order zero. Since the value of the
function increases with
a and decreases with
b, under the condition of constant symbol energy, the error probability of the detection strategy depends on the correlation between adjacent symbols. The higher the correlation, the higher the error probability.
4.2. Analysis of Multi-Target Scenarios
In practical scenarios, the presence of multiple and more complex targets is common. Therefore, we consider the impact of ambiguous targets in the multi-target case.
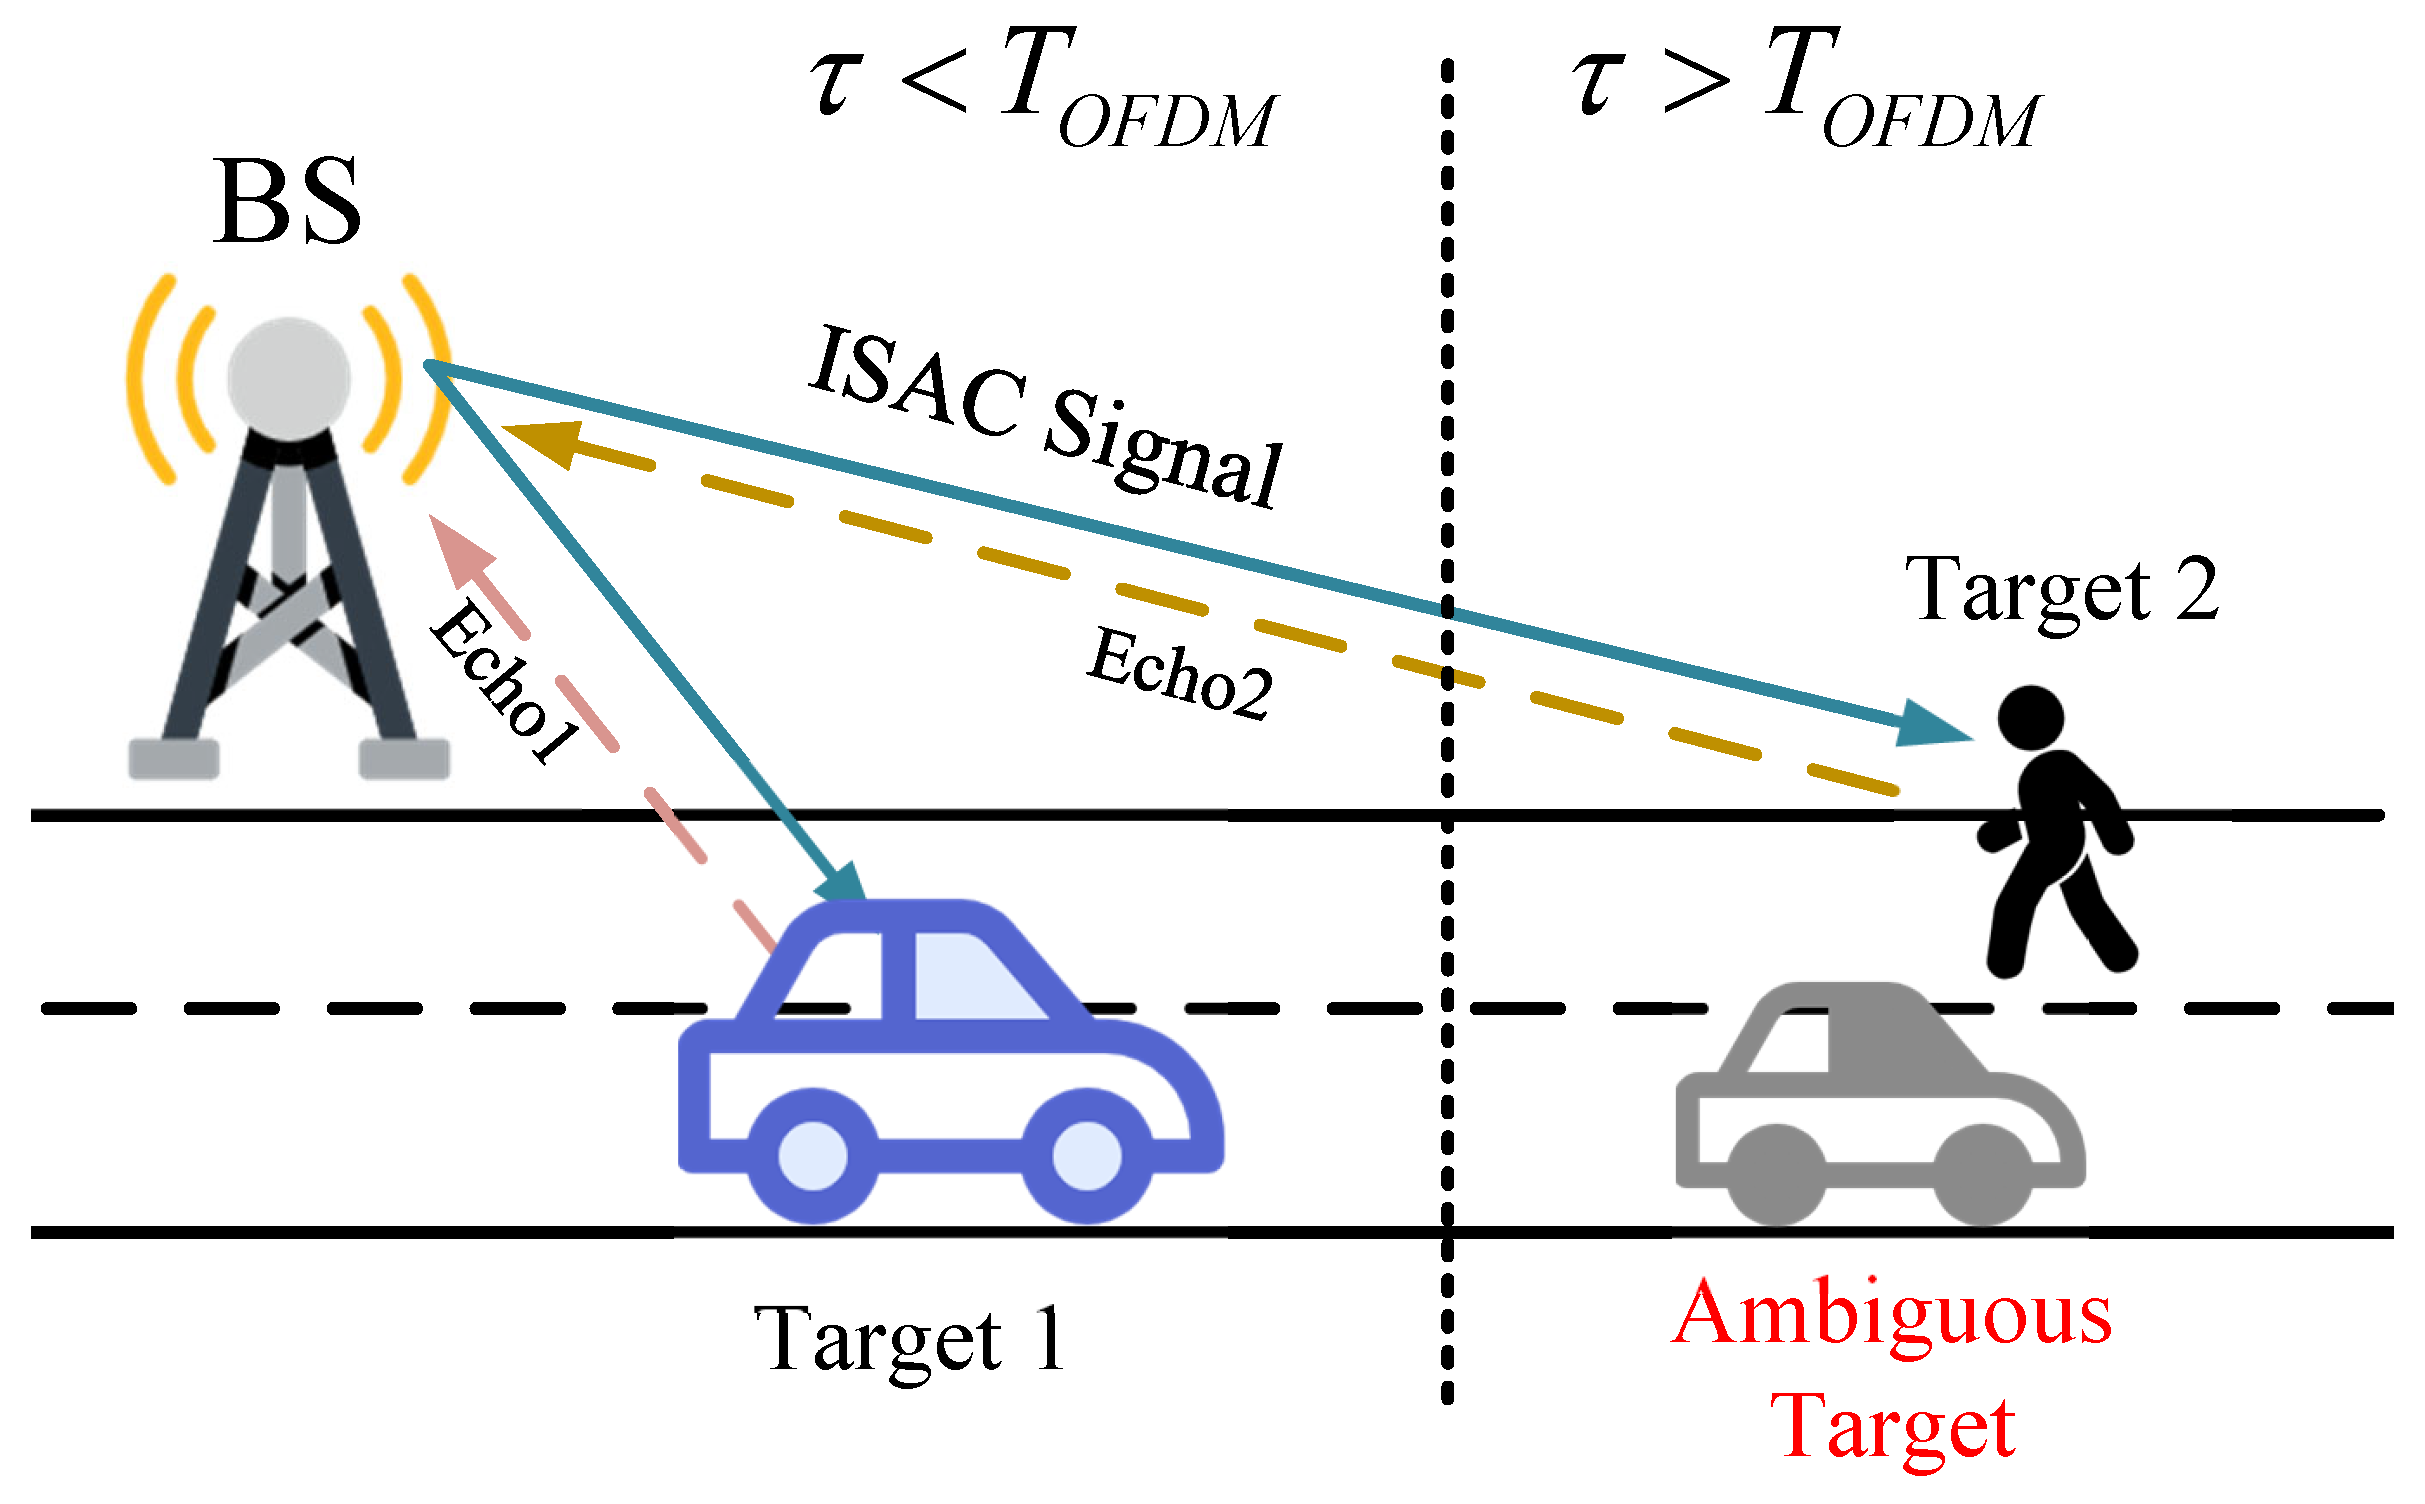
As shown in
Figure 5, assume there are two targets: a vehicle (Target 1) at a closer distance with a high RCS and a pedestrian (Target 2) at a farther distance with a low RCS. In this scenario, due to the proximity and high RCS of Target 1, its echo signal strength is also high. Although the ambiguous target undergoes some attenuation, its energy may still be significantly higher than that of Target 2, potentially affecting or even completely obscuring the detection of Target 2. Based on the car’s and pedestrian’s RCS and radar equations mentioned in the paper [
24], we refer to the representative RCS values of vehicles and pedestrians provided therein, namely
[
24], the echo SNR ratio of the two targets can be obtained as:
where
,
represents the distance between the two targets and the BS. The echo SNR undergoes the same processing, resulting in an equal accumulation gain. Consequently, the final ratio mapped onto the RDM remains the same as the echo SNR ratio. When two targets differ by one symbol length, the distance difference is often more than twice, so the SNR of the final obtained RDM differs by more than 30dB. Therefore, the amplitude of the ambiguous target induced by Target 1 must be sufficiently low in order to enable the detection of Target 2. To facilitate further analysis, we assume that a portion of the data between adjacent symbols is identical, that is:
After time delay compensation, the signal of the ambiguous target, with communication information removed, can be expressed as:
where
denotes the signal component with residual communication information, including variations in amplitude and phase. The portions of adjacent symbols that are identical can be coherently accumulated after removing the data information, leading to the formation of ambiguous targets. In contrast, the non-identical parts, due to their amplitude and phase mismatches, fail to coherently align at the original target’s delay-Doppler location, and their energy is ultimately manifested as noise or interference. In the presence of multiple nearby targets and a complex environment, the range and energy of ambiguous targets can increase significantly, degrading the overall sensing performance of the system.
4.3. Sequence Design for Suppressing the Energy of Ambiguous Targets
As analyzed in the previous two sections, the inter-symbol correlation affects both the effectiveness of the detection strategy and the energy level of the ambiguous targets. In a source where the probabilities of ‘0’ and ‘1’ bits are equal (P(0) = P(1) = 0.5), the correlation between consecutive symbols is relatively low, making it easier to distinguish between true and ambiguous targets while keeping the energy of ambiguous targets low. However, in practical scenarios, the probabilities of 0 and 1 are often not perfectly balanced. For example, in text data, varying frequencies of letter occurrences, or in image data, the predominance of black or white regions can lead to an imbalance in the 0/1 ratio. Although some source coding techniques can be applied to correct this, achieving a perfectly balanced 0/1 bit stream is challenging.
Moreover, the correlation between adjacent symbols is influenced by other factors and may still exist even when the probabilities of ‘0’ and ‘1’ are equal. Under such conditions, ambiguous targets continue to present a significant threat to multi-target detection. Therefore, a dedicated sequence is designed to replace the communication data, specifically aiming to reduce the inter-symbol correlation.
The substituted portion of the symbol information is referred to as redundancy, and the replacement sequence is defined as the redundant sequence. Let
denote the set of redundancy insertion positions. This section focuses on the impact of the redundancy ratio, determines the positions where redundancy is added to the signal and defines the redundancy length as
K. The redundancy ratio can be expressed as:
and we consider interleaving redundancy by inserting one OFDM symbol for every two OFDM symbols. The symbol representation is as follows:
where
represents the
nth sub-carrier of the
mth symbol, and
denotes the sequence after inserting redundancy. The design of the redundancy sequence needs to consider the correlation with adjacent symbols after insertion. The problem can be expressed as follows:
To address the aforementioned optimization problem, we employ the SA algorithm. SA is a probabilistic optimization algorithm inspired by the physical process of annealing, where materials are slowly cooled to reach a state of minimum energy. The complete algorithmic process is described in detail in [
25] and will not be further explained here. The perturbation method used in this paper is random phase perturbation, which ensures that the amplitude of the constellation diagram is not disrupted. The overall algorithm is shown in Algorithm 2, where
T represents the temperature, which is gradually reduced in each iteration. The cooling factor is denoted as
.
| Algorithm 2 Simulated Annealing for Design Sequence |
- 1:
Initialize the sequence randomly, set minimum temperature and maximum iterations . - 2:
Set cooling factor , current temperature , optimal solution . - 3:
Compute initial symbol via ( 35). - 4:
Compute initial correlation via ( 36). - 5:
repeat - 6:
Generate random phase . - 7:
Update the redundancy sequence . - 8:
Update a new symbol via ( 35) - 9:
Compute the correlation via ( 36). - 10:
if then - 11:
Update - 12:
Update - 13:
else - 14:
if random number then - 15:
Update - 16:
end if - 17:
end if - 18:
Decrease temperature: - 19:
until or The number of iterations exceeds the maximum iteration limit. - 20:
Output the final symbol .
|
As shown in
Table 1, the primary computational burden lies in the correlation function calculations. In practical applications, after obtaining a sequence with reduced correlation, the issue of communication rate must also be taken into account. A more detailed discussion of this will be provided in the simulation in the
Section 5.
5. Simulation Results
In this section, we first simulate the performance of the algorithm proposed in
Section 3, comparing it with both the original and extra-CP algorithm in [
22]. Next, the sequences were constructed according to the design criteria proposed in
Section 4, and then simulations were performed to evaluate their impact on ambiguous targets. Finally, we simulate both the relationship between the designed sequences and the associated computational time, as well as the overall algorithm’s impact on perception performance, thereby revealing the trade-off between communication and sensing. We adopt the CP-OFDM parameters under the IEEE 802.11 standard [
26], as shown in
Table 2, and the 4-QAM modulation scheme is adopted, which avoids attenuation caused by amplitude inconsistency [
27]. All simulations are implemented using Python 3.9, running on a system equipped with a 12th Gen Intel Core i7-12700 processor (Intel Corporation, Santa Clara, CA, USA).
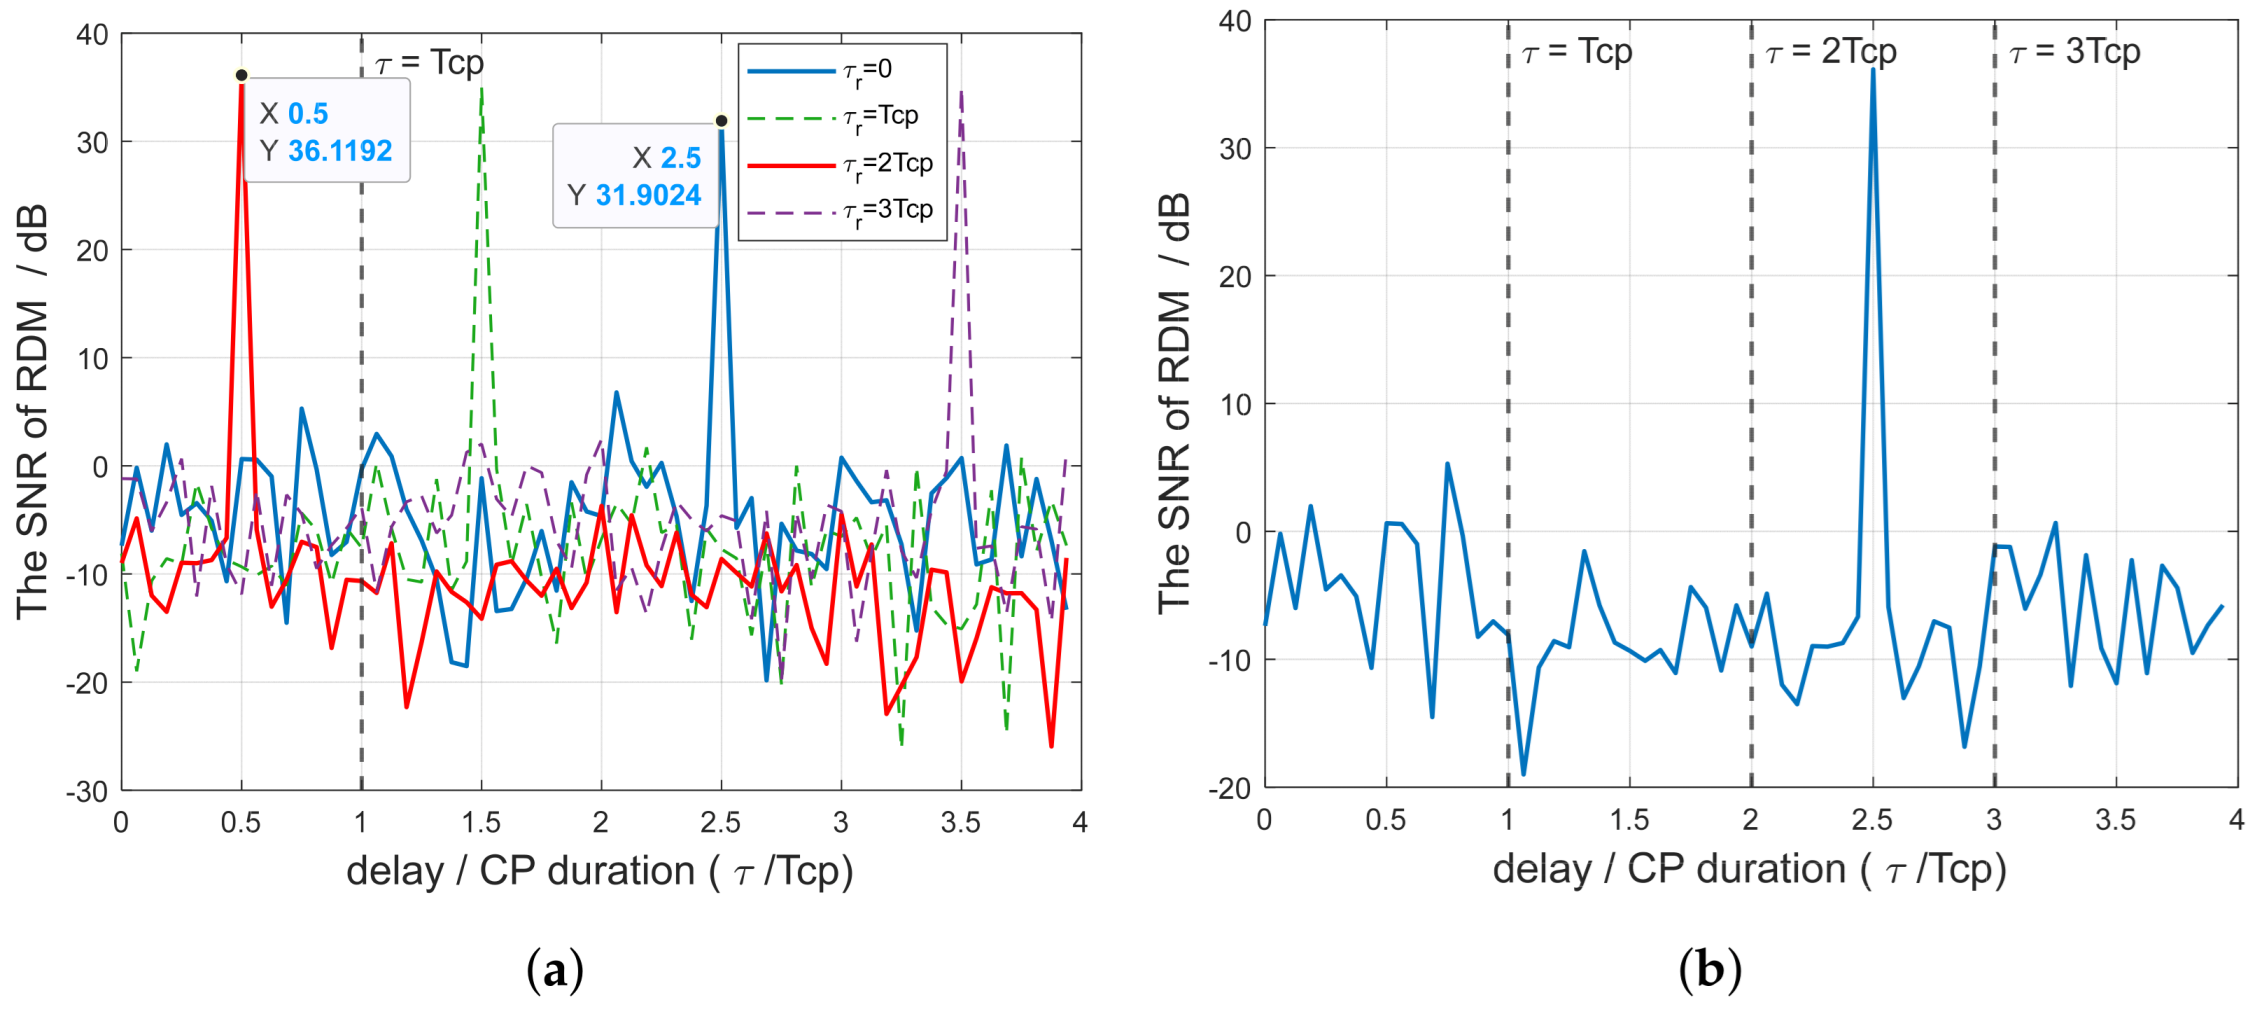
In
Figure 6, the delay compensation-based sensing algorithm described in
Section 3 is compared with the traditional algorithm. Set the target delay as
, with the receiver compensating for a delay of
at each iteration. Set the number of iterations to 4. The zero-velocity dimension data extracted from these RDMs is shown in
Figure 6a. By extracting the data before
and concatenating them, the final RDM is obtained, as shown in
Figure 6b. The x-axis represents the ratio of the delay caused by the target to the CP duration, while the y-axis represents the ratio of the accumulated target energy to the noise energy after the original signal is processed using (
5)–(
7), which corresponds to the SNR after range-Doppler processing. The simulation does not account for the attenuation caused by the target’s distance and RCS, and the original SNR of the echo signal is 10 dB.
As the delay compensation progresses and the target delay becomes smaller than the CP length, the target falls within
, as indicated by the red line in
Figure 6a. The red line has a lower noise level compared to the other lines, and the target exhibits a high amplitude.
Figure 6b shows the result after stitching the RDMs, which demonstrates that delay compensation can effectively reduce interference and enhance the SNR of the target.
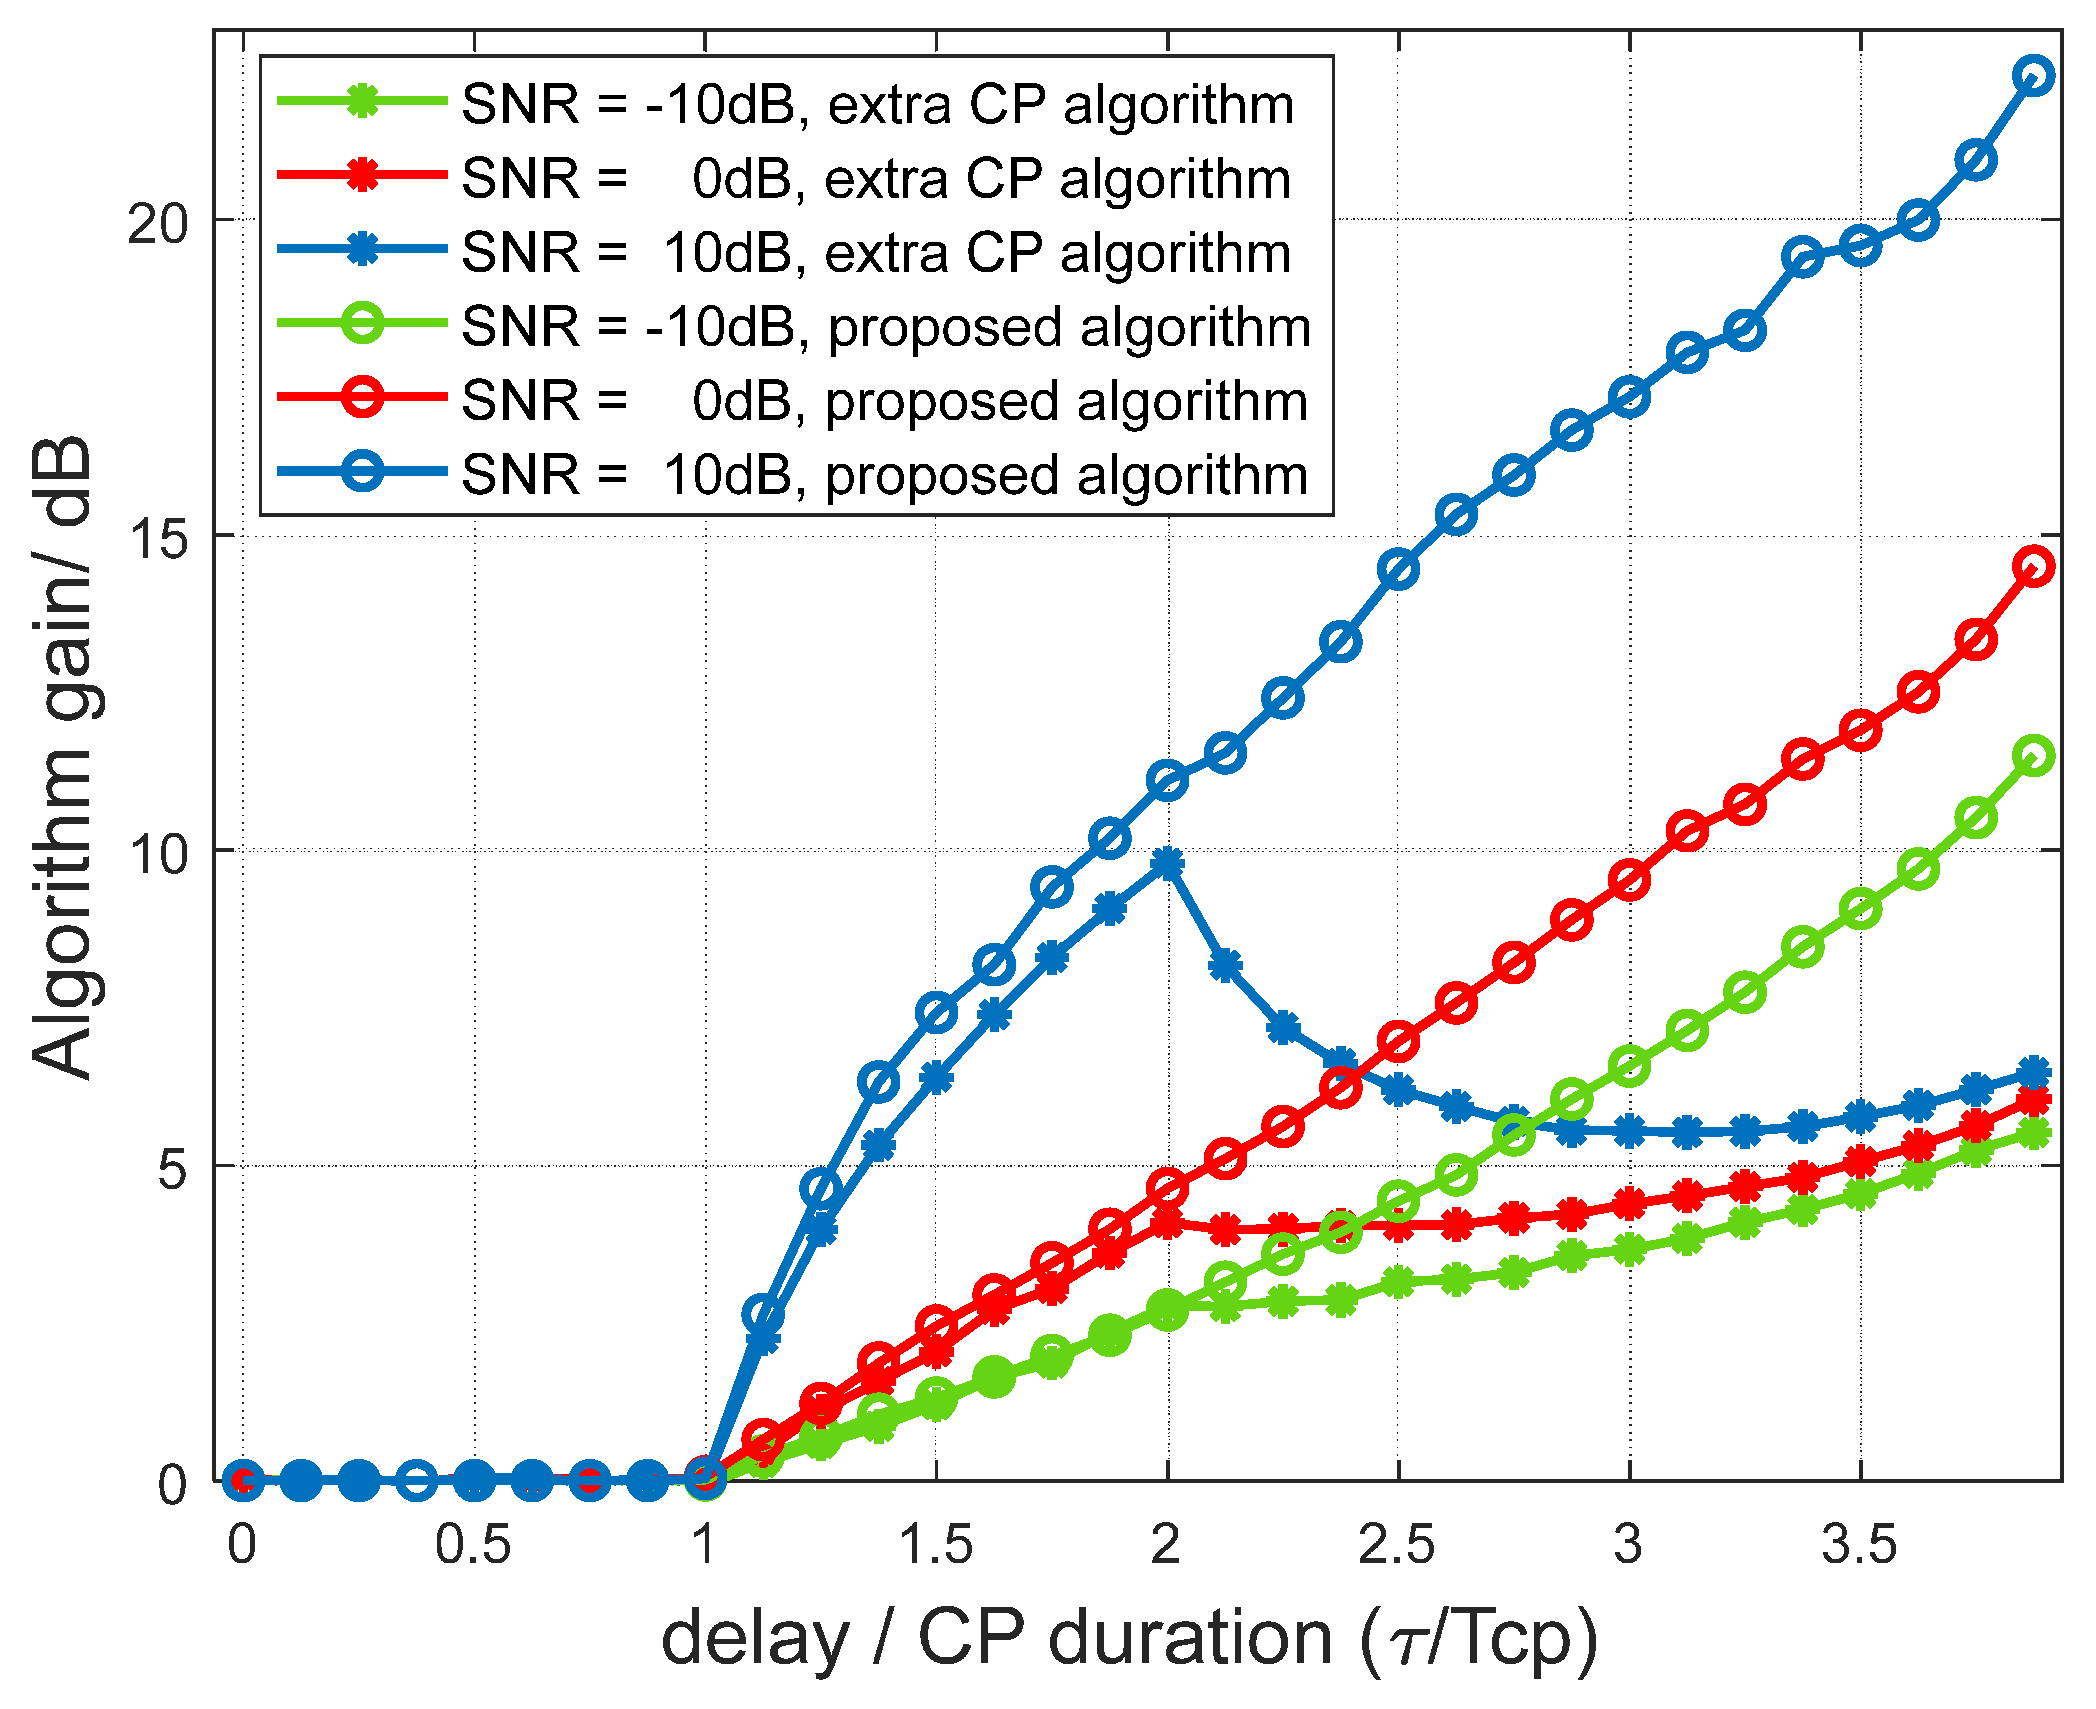
Figure 7 illustrates the relationship between algorithmic gain and the echo delay under different SNRs for various algorithms, comparing both the extra-CP algorithm [
22] and the proposed algorithm in this paper. Define the algorithm gain as the improvement in target accumulated echo SNR when using the delay compensation algorithm compared to the original algorithm. When
, both enhanced algorithms offer no gain over the original one. In the range
, the two enhanced algorithms achieve nearly identical gains compared to the original algorithm, and the gain increases with delay. When
, the gain of the extended CP algorithm decreases due to exceeding the CP duration, whereas the delay compensation algorithm continues to yield increasing gain, indicating that mainstream CP extension approaches merely postpone the degradation caused by CP overflow without achieving any fundamental breakthrough. On the contrary, since the delay compensation algorithm reduces ISI and ICI, and interference effects increase with higher SNR, the improvement brought by delay compensation is also enhanced. High SNR offers greater performance improvement compared to low SNR, which is a maximum of 20 dB performance gain. In addition, the proposed algorithm does not possess a theoretical upper bound in terms of sensing range if SNR or accumulation time is sufficient. However, in practical applications, its performance may be affected by transmission power limitations and the ambiguous target issue discussed in
Section 4.
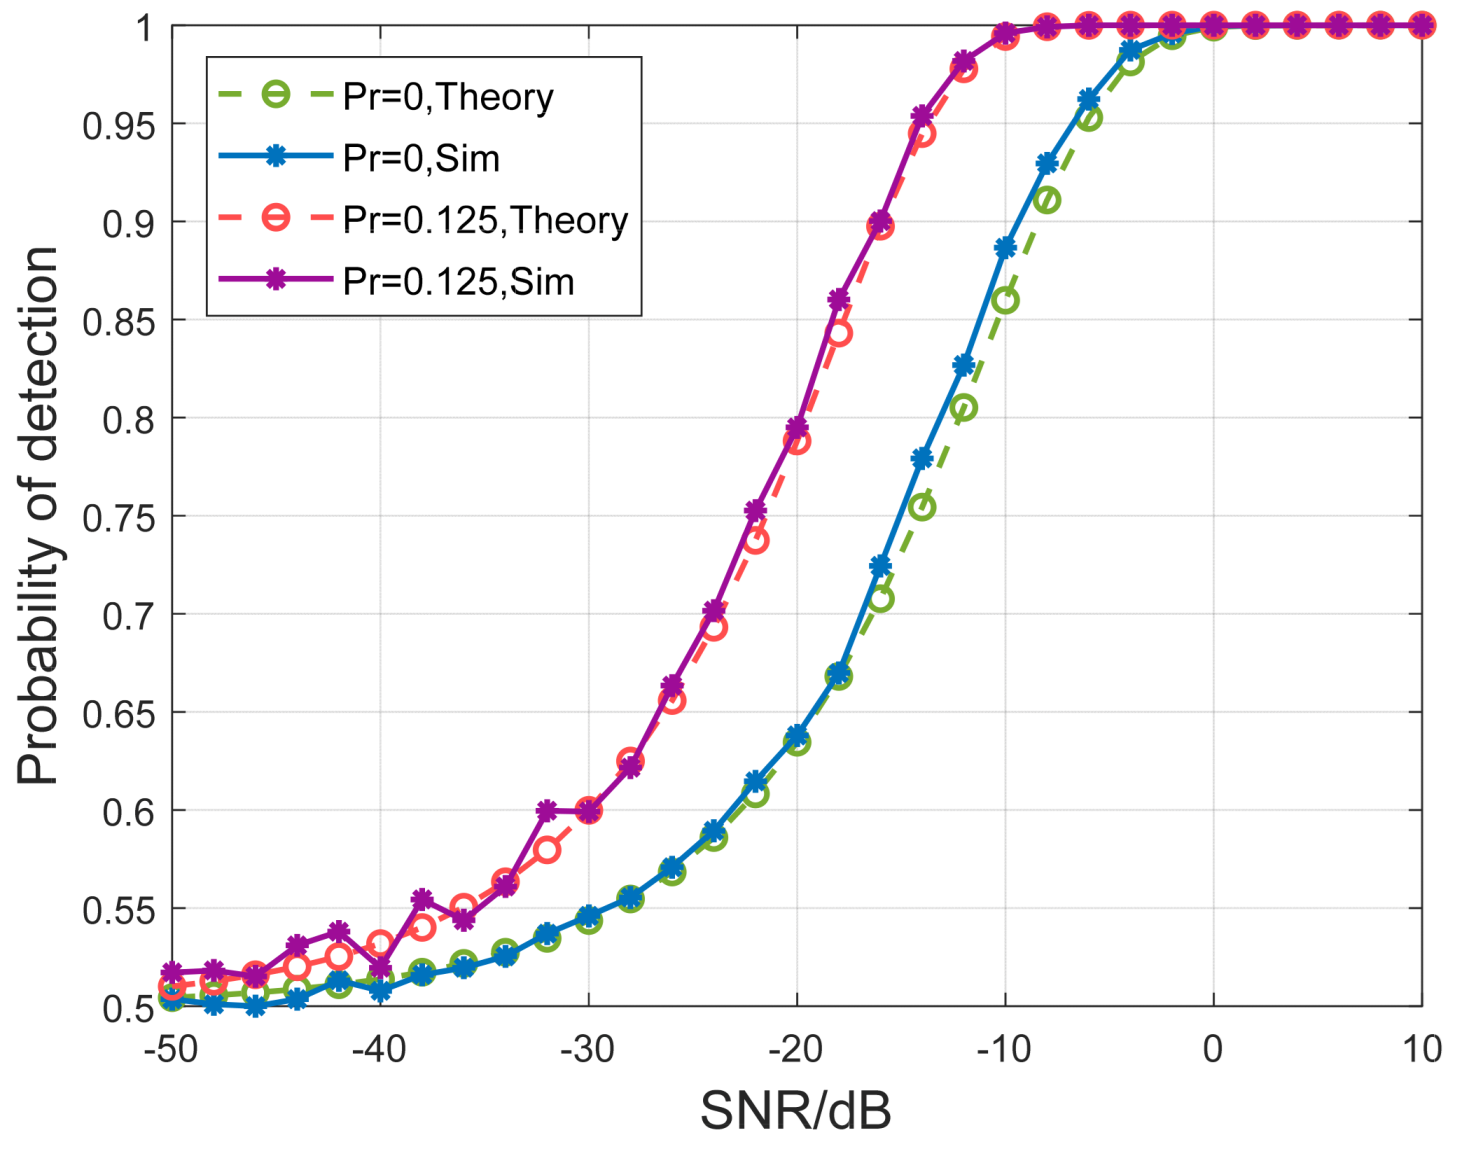
Figure 8 illustrates the comparison of detection probability under different redundancy ratios. As observed from the figure, the simulation results closely match the theoretical values. With the addition of redundancy, the correlation between adjacent symbols is reduced, making it easier to distinguish between true and ambiguous targets. Moreover, as the noise power decreases, the probability of correct detection also increases. Due to the differences between consecutive symbols, distinguishing between true and ambiguous targets is not difficult under a certain SNR. The focus of the simulation is to investigate the impact of inter-symbol correlation on sensing in multi-target scenarios.
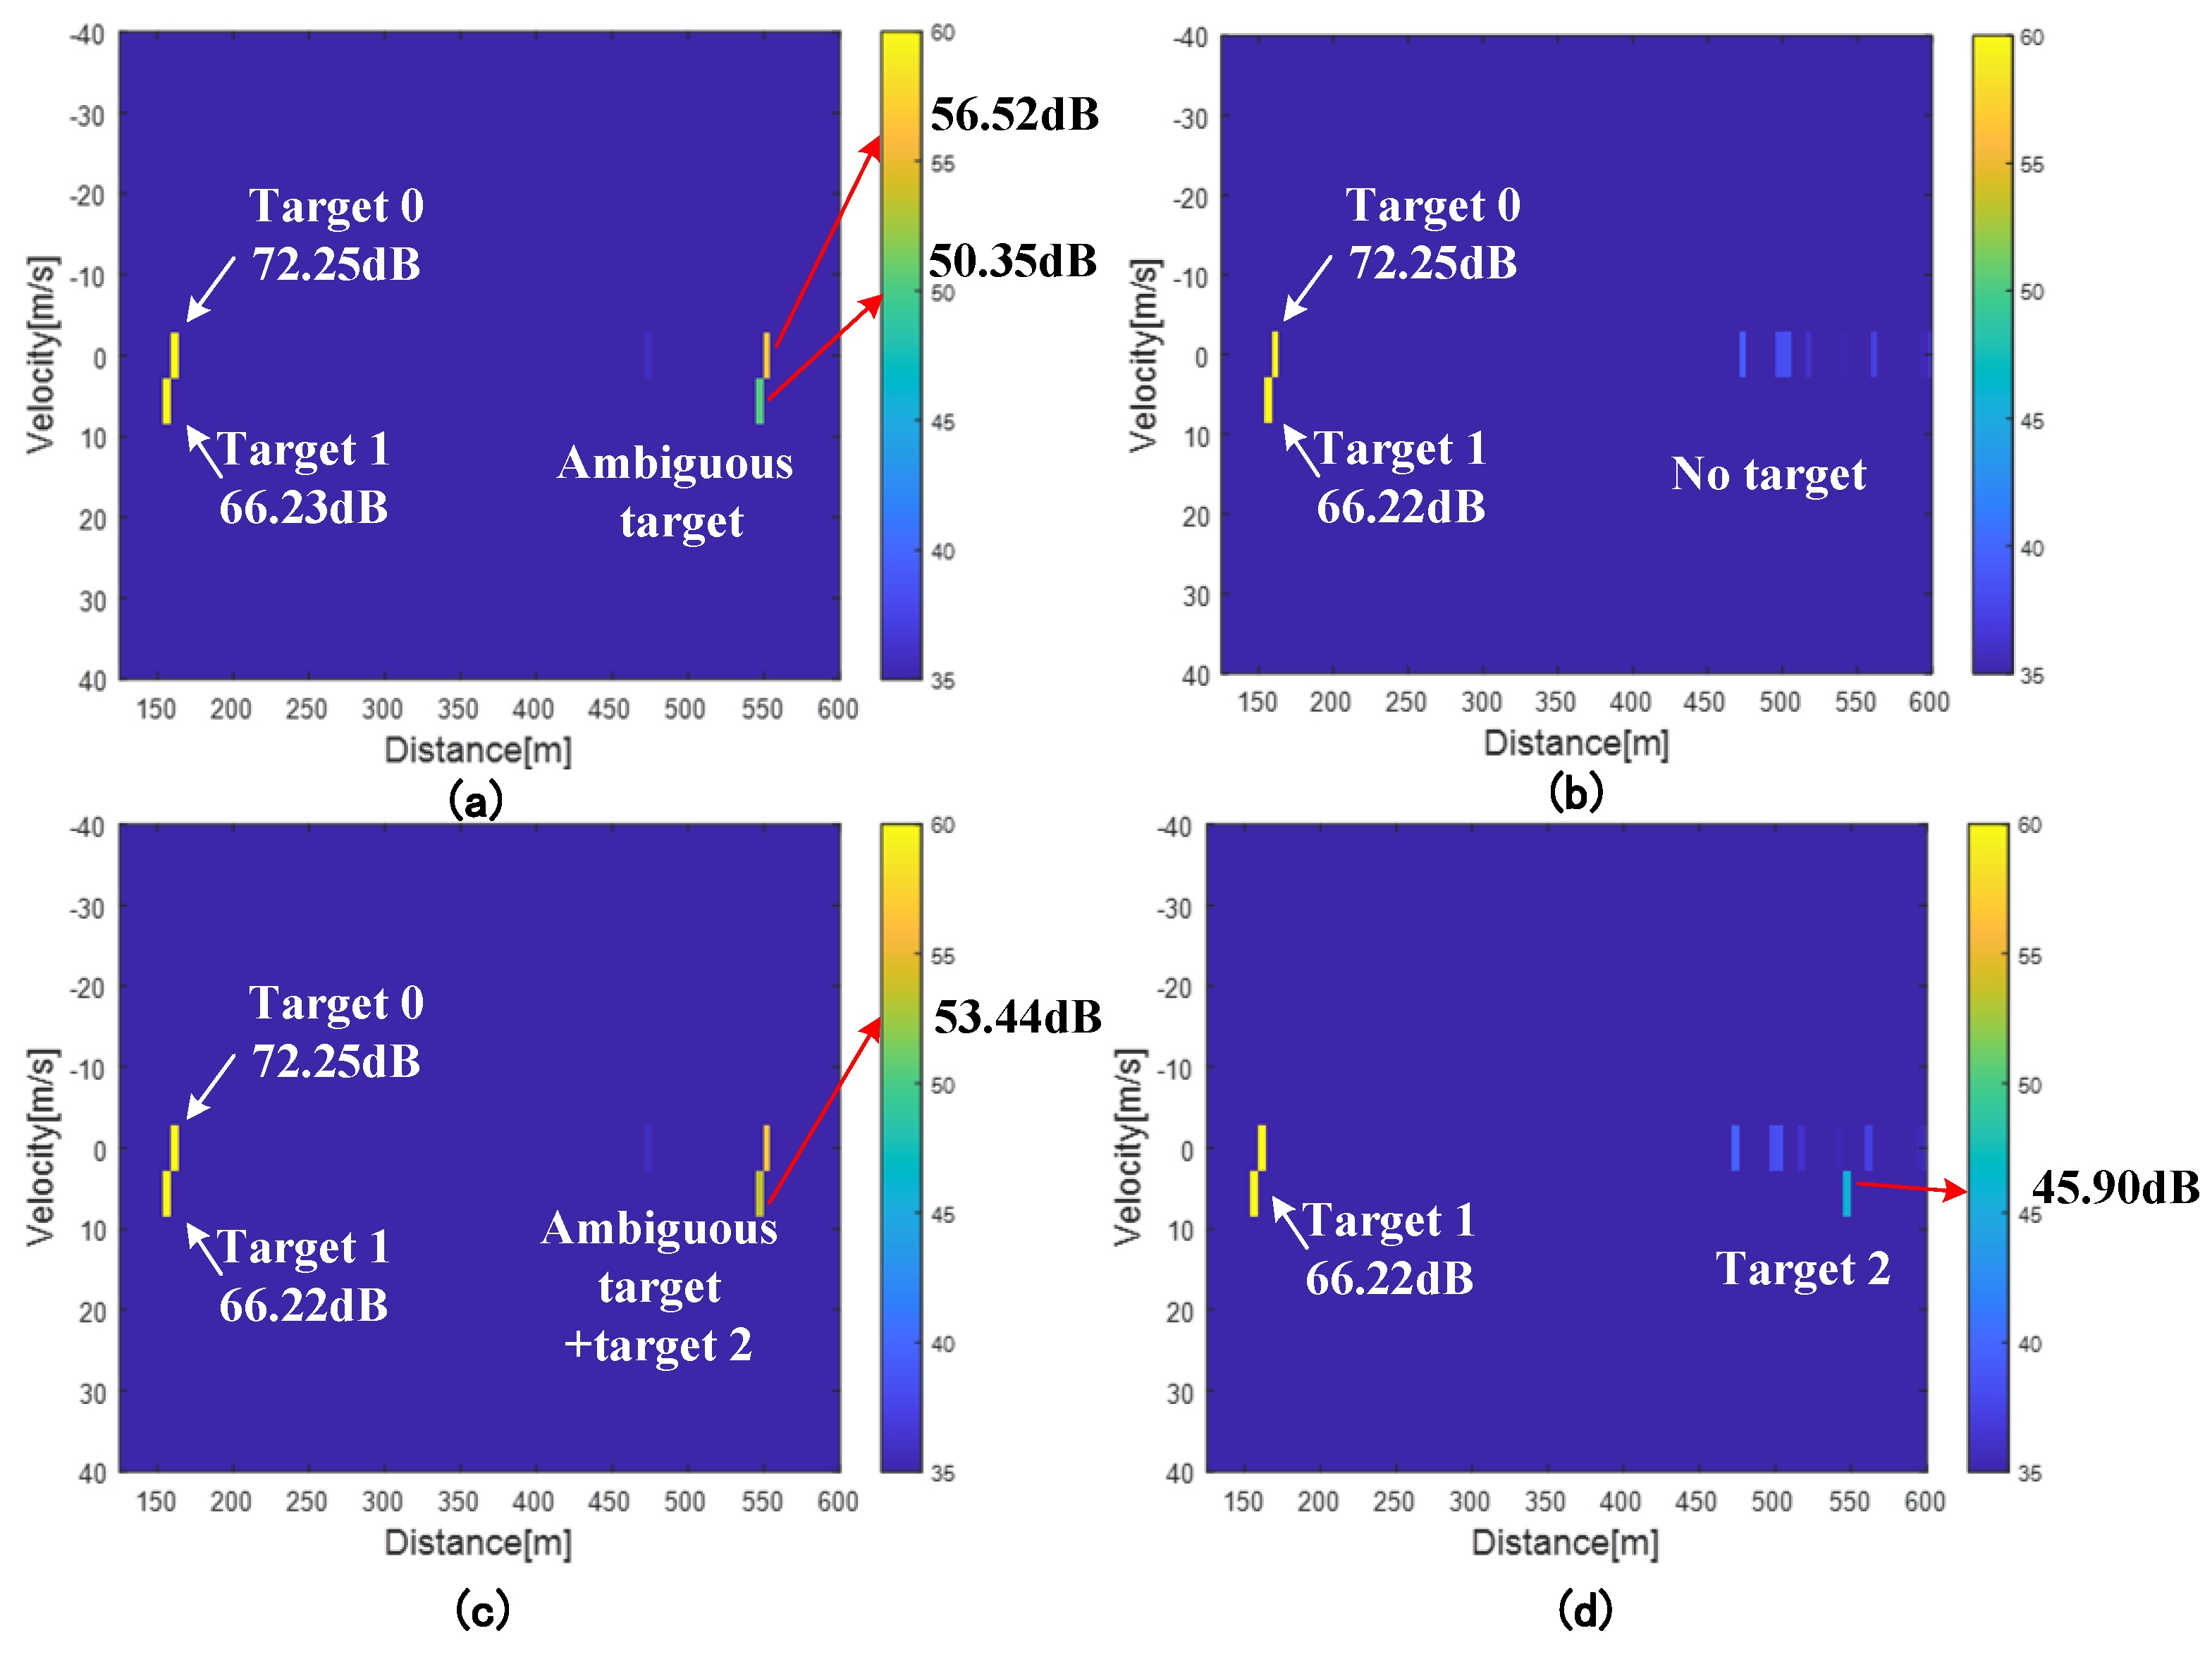
Figure 9 shows the processing results of the multi-target scenario under different conditions, and the simulation scenario model is illustrated in
Figure 5, including stationary buildings (Target 0) and dynamic targets (Target 1 and Target 2). Assume that P(1) = 0.7, the redundancy
, and the original SNR of the echo signal is 10 dB. Subfigure (a), without any ambiguity suppression, target 1 is clearly detected with a peak amplitude of 66.23 dB, while an ambiguous target appears at a coupled delay-Doppler location with a significant energy level of 50.35 dB. Due to the removal of communication information, as analyzed in (
32), the noise floor differs between the true target and ambiguous targets across different range intervals. Consequently, the SNR observed in the resulting RDMs are 58.03 dB and 29.78 dB. In subfigure (b), by reducing the similarity between adjacent symbols, the ambiguous target is effectively suppressed. Target 1 remains detectable (63.22 dB), and the ambiguous region shows minimal residual energy at 23.25 dB. After evaluation, it is determined that the noise floor increases by only 3 dB, resulting in a final SNR difference of 52.22 dB between the true target and the ambiguous target. Subfigure (c) and (d) show the RDM results for the two-target scenario illustrated in
Figure 5. Due to range and RCS limitations, target 2 is 35 dB weaker than target 1. In the absence of ambiguity suppression, the ambiguous target induced by target 1 may obscure target 2 in the RDM, making its detection challenging. In subfigure (d), by introducing a redundant sequence, the ambiguous target energy is reduced, similar to the effect observed in subfigure (b), thereby enabling the detection of target 2.
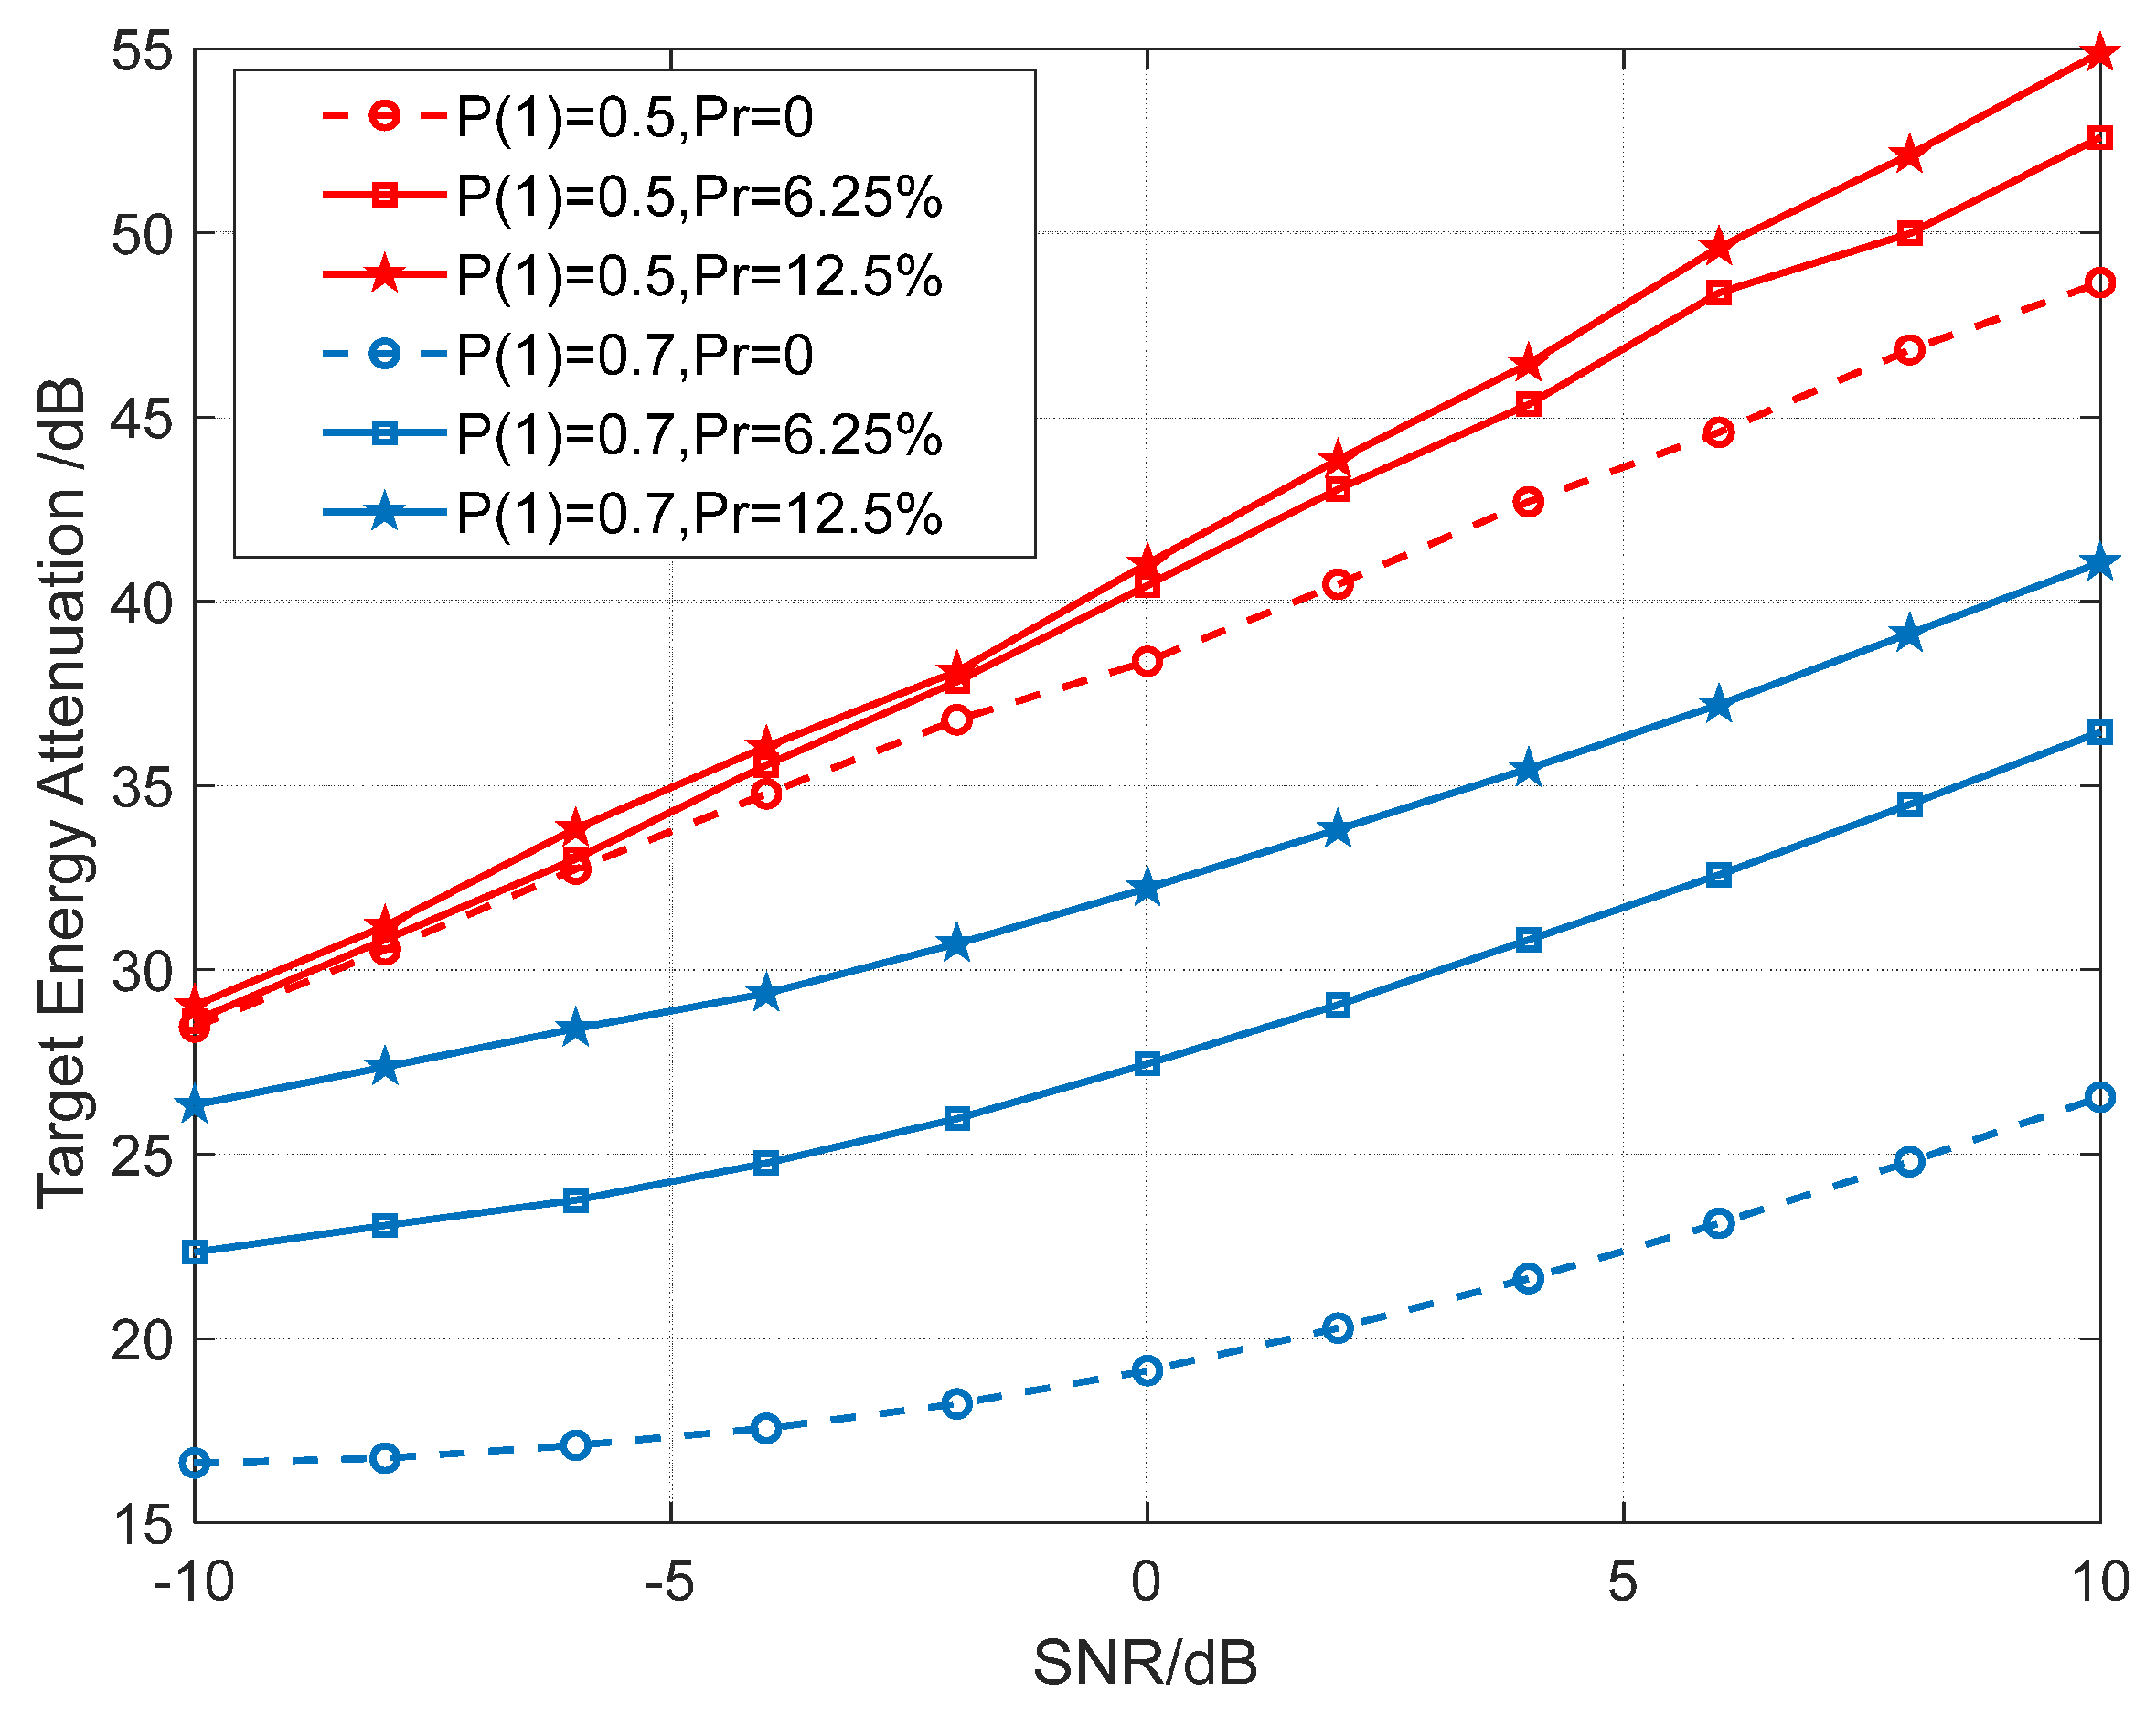
The energy attenuation of the target is defined as the difference between the SNR of the true target and that of the ambiguous target in the final obtained RDM.
Figure 10 illustrates the relationship between the received SNR and the target energy attenuation under different conditions. The overall trend shows that the energy attenuation increases with the original SNR. This is because as the received SNR increases, the energy of the true target rises, while for ambiguous targets, it is primarily the noise floor that increases, thereby enlarging the difference between the two. On the other hand, under the condition of p(1) = 0.7, where the inter-symbol correlation is high, the energy of the ambiguous targets is relatively strong, resulting in lower energy attenuation. However, after introducing redundancy, there is a significant suppression effect on the energy of the ambiguous targets, with a maximum improvement of up to 15 dB. In the case of p(1) = 0.5, the suppression effect can reach up to 7 dB. Therefore, different redundancy ratios can be selected based on the target characteristics under different scenarios and different source characteristics.
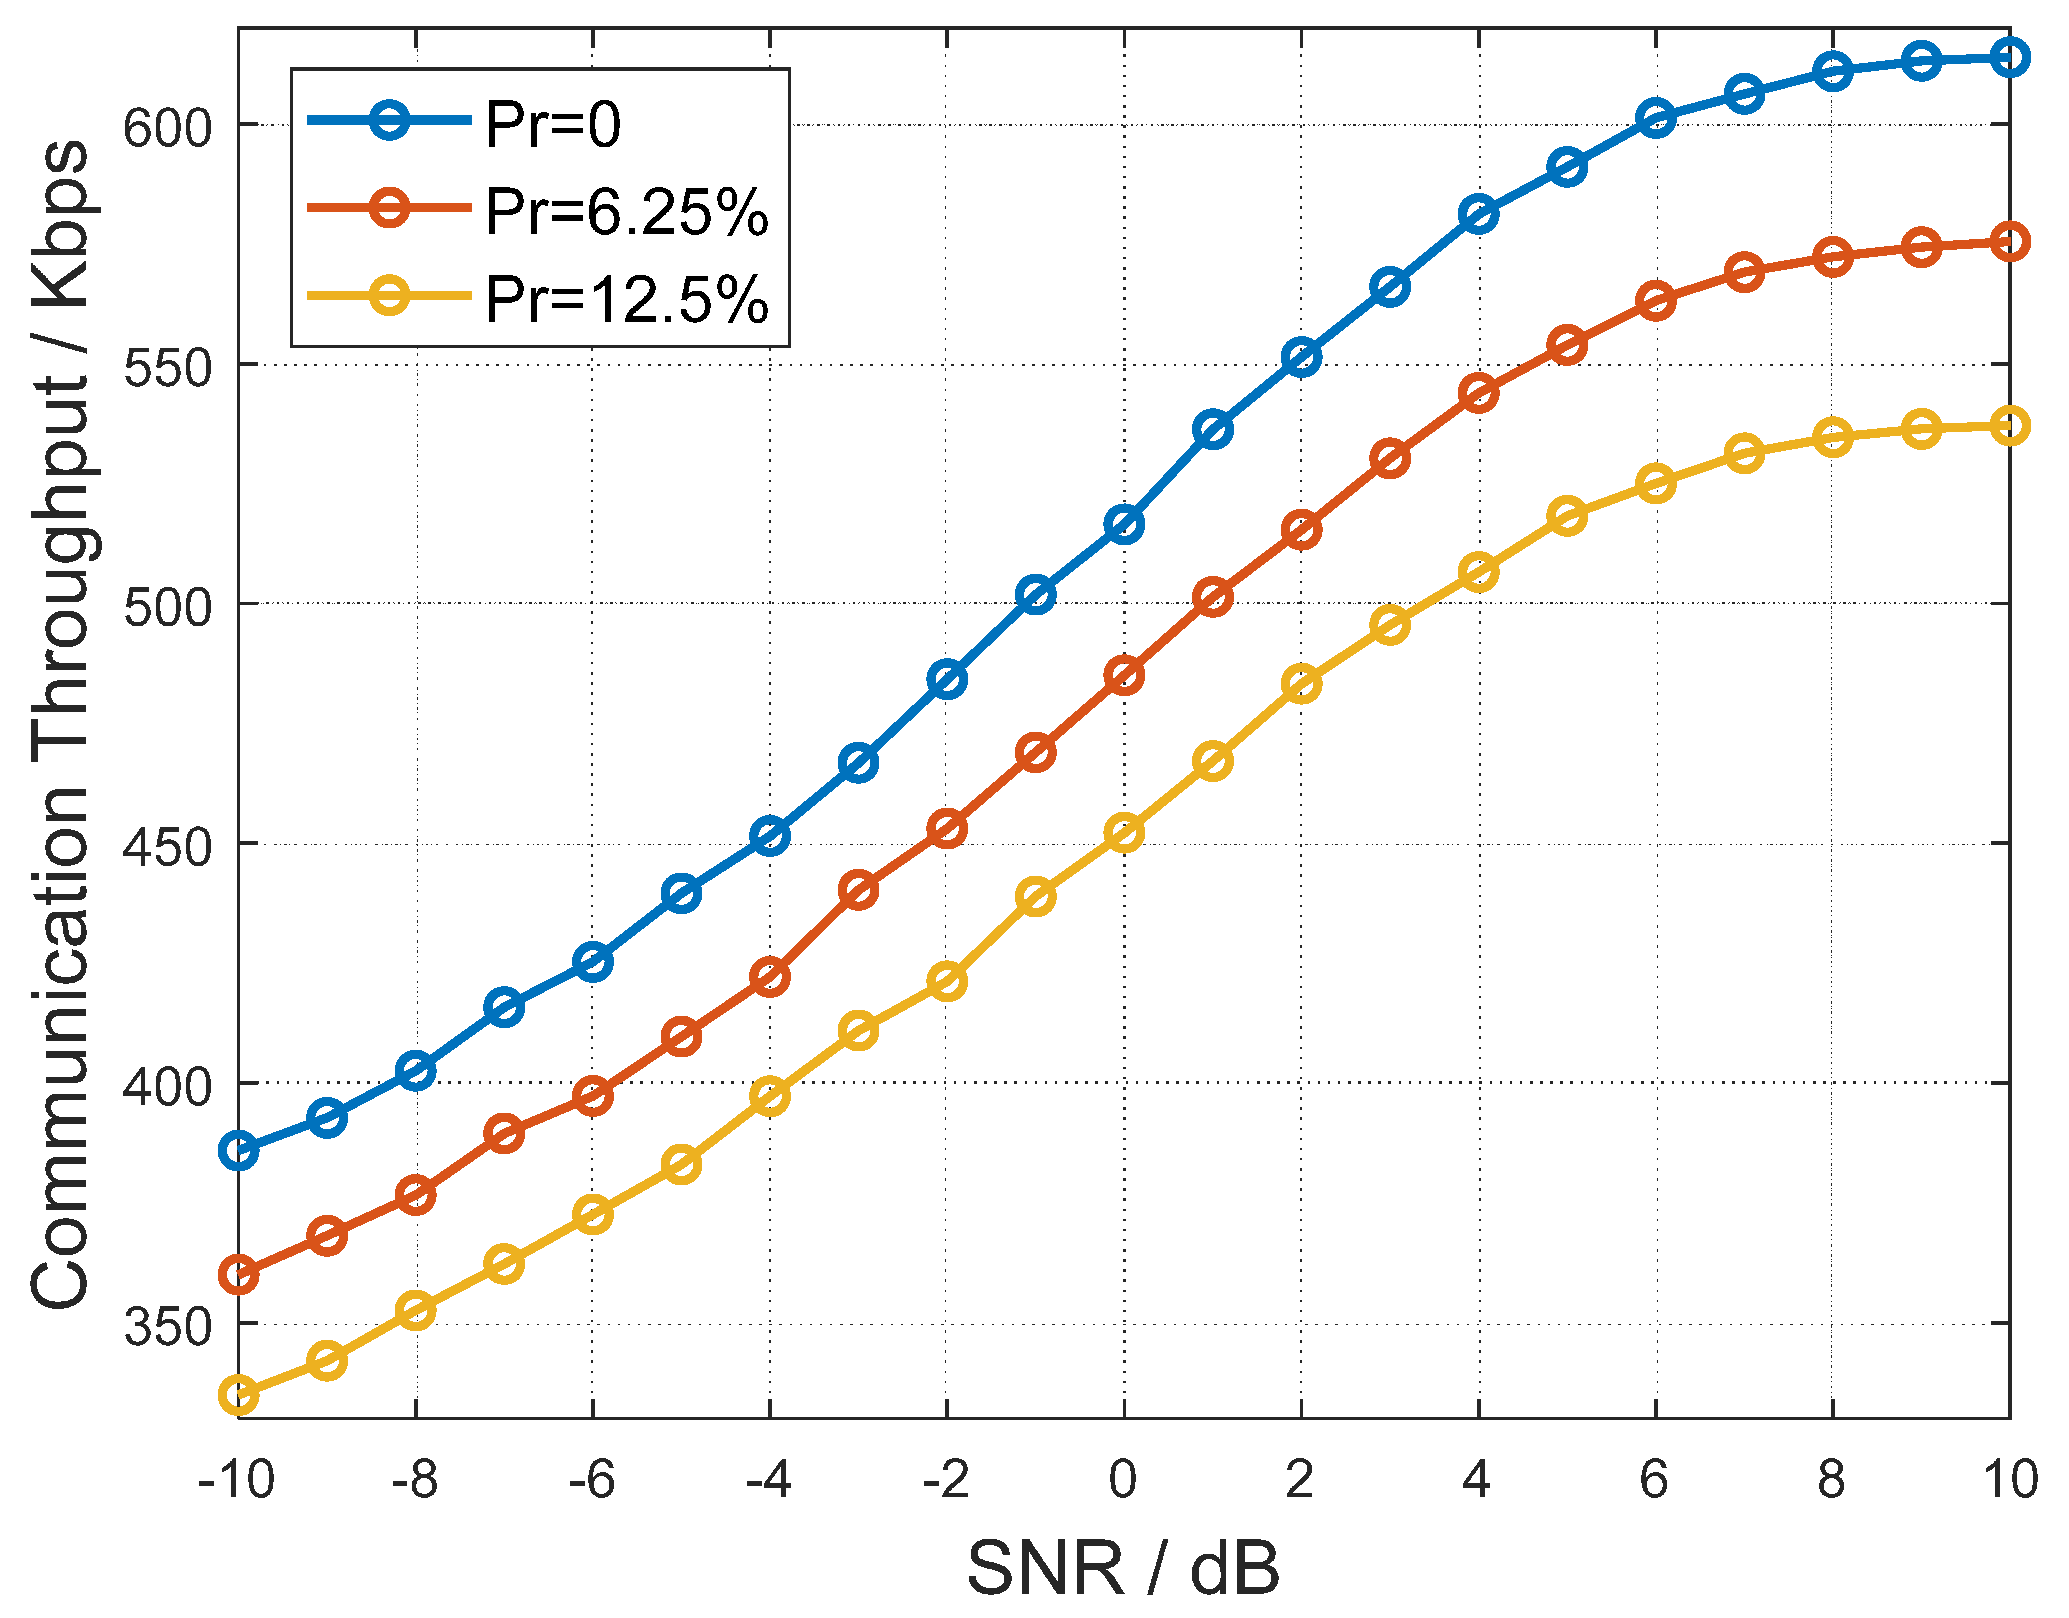
Figure 11 illustrates the relationship between communication rate and SNR under different redundancy ratios. The SNR curves remain identical across different redundancy ratios, indicating that redundancy does not affect the BER performance of communication but only reduces throughput. Moreover, the reduction in throughput is directly related to the redundancy ratio. In practical applications, a trade-off between communication rate and detection performance should be considered to achieve optimal performance in different scenarios.
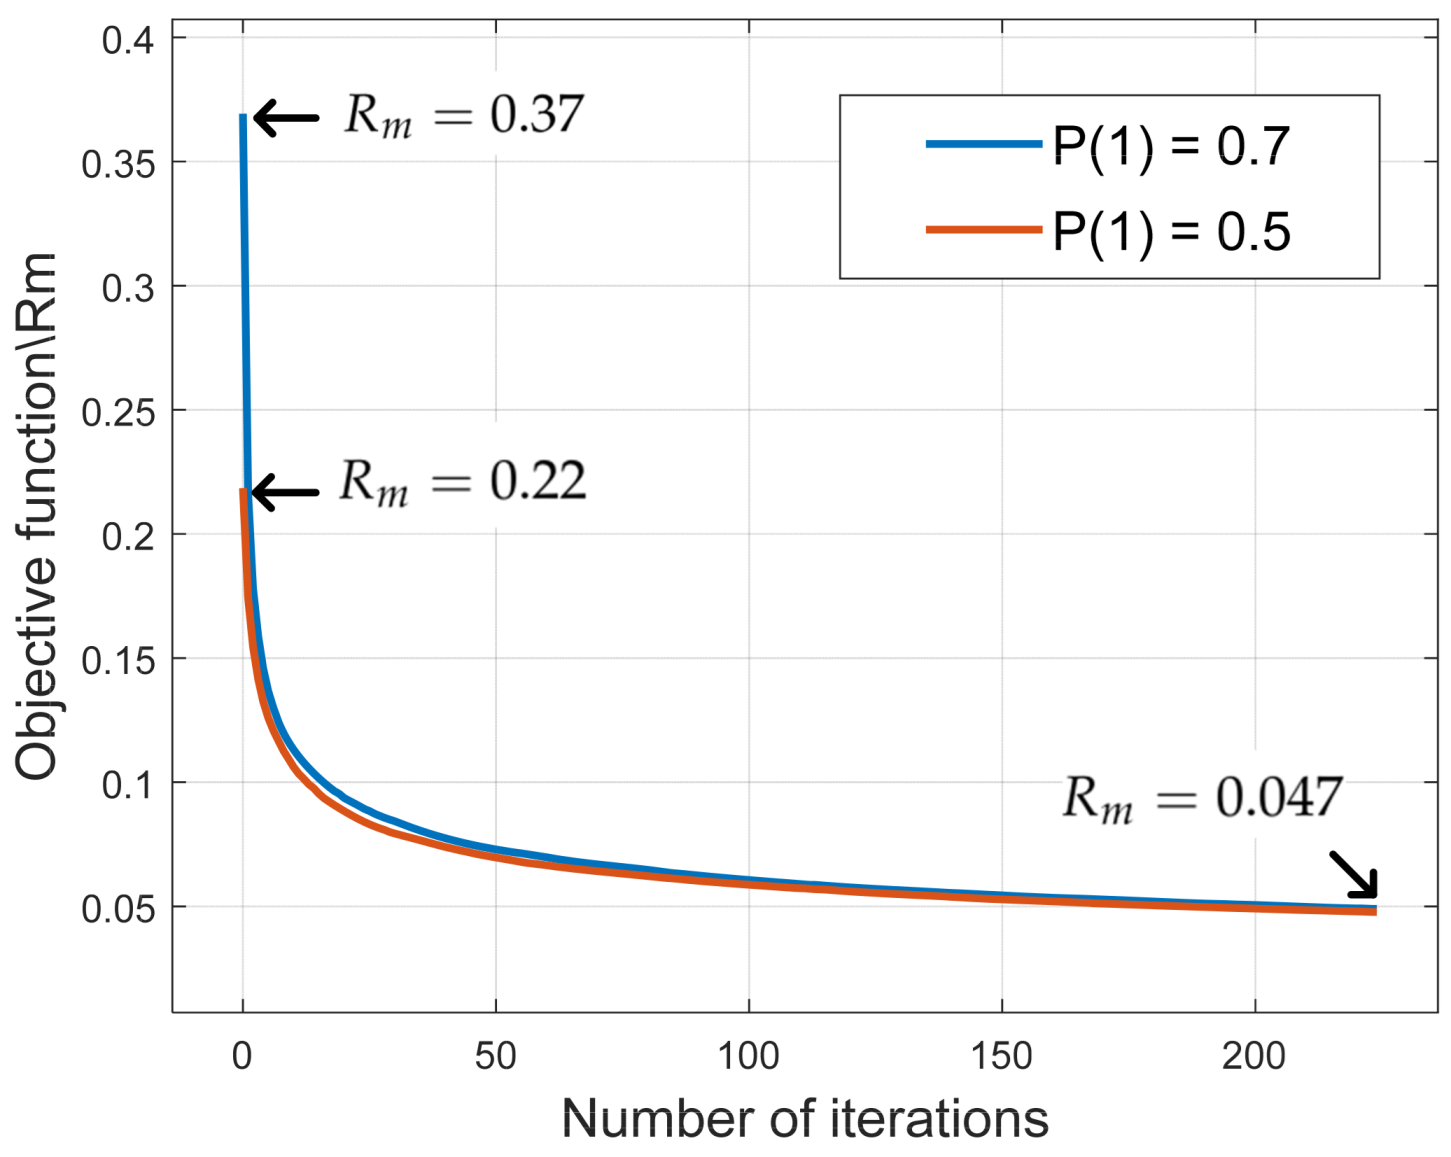
Figure 12 illustrates the relationship between the objective function value and the number of iterations of the SA algorithm during sequence design. Under different probabilities of ‘1’ bits, the objective function exhibits a consistent downward trend. However, the more imbalanced the ratio of ‘0’ to ‘1’ bits, the larger the correlation function value becomes. Meanwhile, a rapid decrease in the objective function is observed during the first 10 iterations. This is attributed to the use of random phase perturbation in the sequence design, where the phase is randomly selected within the range of 0° to 360°. Such random perturbation significantly affects the constellation points and leads to a swift reduction in correlation.
Table 3 lists the representative points of the curve for the case of P(1) = 0.7, along with the corresponding computational time. In practical applications, using high-performance computing units can accelerate the computation time. and this curve can be used to flexibly balance the trade-off between the real-time performance and correlation characteristics of sequence design.


