Article

Intelligent Battery-Designed System for Edge-Computing-Based Farmland Pest Monitoring System

Department of Electrical Engineering, National Yunlin University of Science & Technology Doulu, Yunlin 64002, Taiwan
*
Author to whom correspondence should be addressed.
Electronics 2025, 14(15), 2927; https://doi.org/10.3390/electronics14152927
Submission received: 11 June 2025 / Revised: 9 July 2025 / Accepted: 17 July 2025 / Published: 22 July 2025
(This article belongs to the Special Issue Battery Health Management for Cyber-Physical Energy Storage Systems)

Abstract

Cruciferous vegetables are popular in Asian dishes. However, striped flea beetles prefer to feed on leaves, which can damage the appearance of crops and reduce their economic value. Due to the lack of pest monitoring, the occurrence of pests is often irregular and unpredictable. Regular and quantitative spraying of pesticides for pest control is an alternative method. Nevertheless, this requires manual execution and is inefficient. This paper presents a system powered by solar energy, utilizing batteries and supercapacitors for energy storage to support the implementation of edge AI devices in outdoor environments. Raspberry Pi is utilized for artificial intelligence image recognition and the Internet of Things (IoT). YOLOv5 is implemented on the edge device, Raspberry Pi, for detecting striped flea beetles, and StyleGAN3 is also utilized for data augmentation in the proposed system. The recognition accuracy reaches 85.4%, and the results are transmitted to the server through a 4G network. The experimental results indicate that the system can operate effectively for an extended period. This system enhances sustainability and reliability and greatly improves the practicality of deploying smart pest detection technology in remote or resource-limited agricultural areas. In subsequent applications, drones can plan routes for pesticide spraying based on the distribution of pests.

1. Introduction

Highly developed agriculture is created owing to Taiwan’s superior geographical and climatic conditions, and cruciferous vegetables account for a significant portion of total vegetable production. However, the striped flea beetle (Phyllotreta striolata) is one of the most destructive pests of cruciferous vegetables since striped flea beetle adults usually eat the leaves and cause many holes, diminishing the commodity value of vegetables [1]. The damage can be so extensive that crops or even entire areas of farmland will be abandoned when under severe infestations. In the spring and summer, the density of pests is often higher due to the high temperature. The control of insects primarily relies on manual assessments of the pest situation by humans, as well as high-dose spraying for large areas. Nevertheless, this can lead to excessive agricultural chemical residues, endangering the health of farmers and consumers.
To achieve smart agriculture, implementing artificial intelligence systems requires significant energy consumption [2]. However, outdoor edge devices are limited by the availability of green energy acquisition and the storage capacity of battery systems. Additionally, long-term standby operation increases energy demands. Therefore, low-power energy management strategies are needed to extend system operating times, ensuring the sustainability of edge-based intelligent recognition systems [3]. These strategies are also instrumental in enabling early and accurate pest detection, which is vital for effective pest management in smart agriculture.
In the past, pest monitoring using sticky traps depended on observation and counting by humans [4,5,6], which is a labor-intensive task with low efficiency. With the development of machine vision (MV) technology, an increasing number of image-processing algorithms have been developed to detect pests on sticky traps. Shape and color features are used to detect pests on sticky board images in [7,8,9]. While the recognition accuracy of their experiment is high, the proposed solutions are limited to specific conditions of lighting, color, and resolution. If images captured under different conditions are applied, parameters should be calibrated manually. Many deep learning methods have been successfully applied to solve the problems of pest detection. Deep learning networks are adopted to detect various objects and have achieved good results in outdoor environmental conditions. The authors of [10,11,12,13,14,15] developed a mobile application that uses the faster region-based convolutional neural network (faster R-CNN) model to detect pests such as aphids, mango leafhoppers, and beetles. The authors of [16] trained a mango pest classifier based on VGG-16 and used data augmentation methods to improve classification performance. The method of deep learning can better allow computers to automatically extract feature information from the identification targets, thereby improving detection accuracy. The most representative one-stage object detection algorithm, You Only Look Once (YOLO) [17], has also been applied for pest detection. YOLOv5 is used to identify thistle caterpillars in [18], and the mean average precision (mAP) reaches 59%. With a dataset containing 7046 images of 23 species of insects, evaluations of YOLOv3 and YOLOv5 are accomplished by [19], achieving mAP results of 97.6% and 97.18% respectively. However, a substantial number of manually annotated target detection objects are still required to train the model. Therefore, generative adversarial networks (GANs) are adopted to augment the dataset in [20,21,22,23], reducing the requirement for collecting a large number of samples and enhancing model accuracy.
The Internet of Things (IoT) plays a significant role in monitoring environments, analyzing data, predicting needs, and releasing agricultural automation. As a result, IoT applications are implemented widely in agriculture [24,25,26,27,28]. IoT and machine learning (ML) are used in [29] for precision irrigation to reduce water use, as well as for disease monitoring in rice paddies in [30]. Although agricultural technology companies and research units have developed insect monitoring systems for crops such as mangoes, apples, and corn [31,32,33], there is evidently a lack of similar systems designed for cruciferous plants.
To effectively monitor cruciferous pests, a farmland pest monitoring system that combines deep learning and the IoT is proposed in this paper to monitor the density of striped flea beetles. Pest samples are generated through a generative adversarial network to increase the amount of training data for the recognition model, reducing the time needed to collect real samples. By performing image recognition at the edge, network traffic for data transmission can be reduced and data privacy can be protected. After comparing the recognition performance of different YOLO versions, the model is deployed to the Raspberry Pi (RPi). Finally, the solar power supply system and the Internet of Things function are integrated to achieve an automatic pest identification system. This system enables drones to accurately spray pesticides in areas with a high density of pests. In this way, manual labor and the use of pesticides can be reduced to achieve the goal of smart agriculture. The main contributions of this paper are as follows:
  • This study presents a low-cost, solar-powered edge AI system that integrates solar energy with supercapacitors to enable long-term outdoor operation, significantly enhancing the feasibility and sustainability of intelligent pest detection in farmland environments;
  • This study develops an image-based monitoring system for pests of cruciferous plants and demonstrates its novel application on resource-constrained edge devices;
  • This study establishes a dataset of 8421 images of yellow-striped flea beetles.

2. Materials and Methods

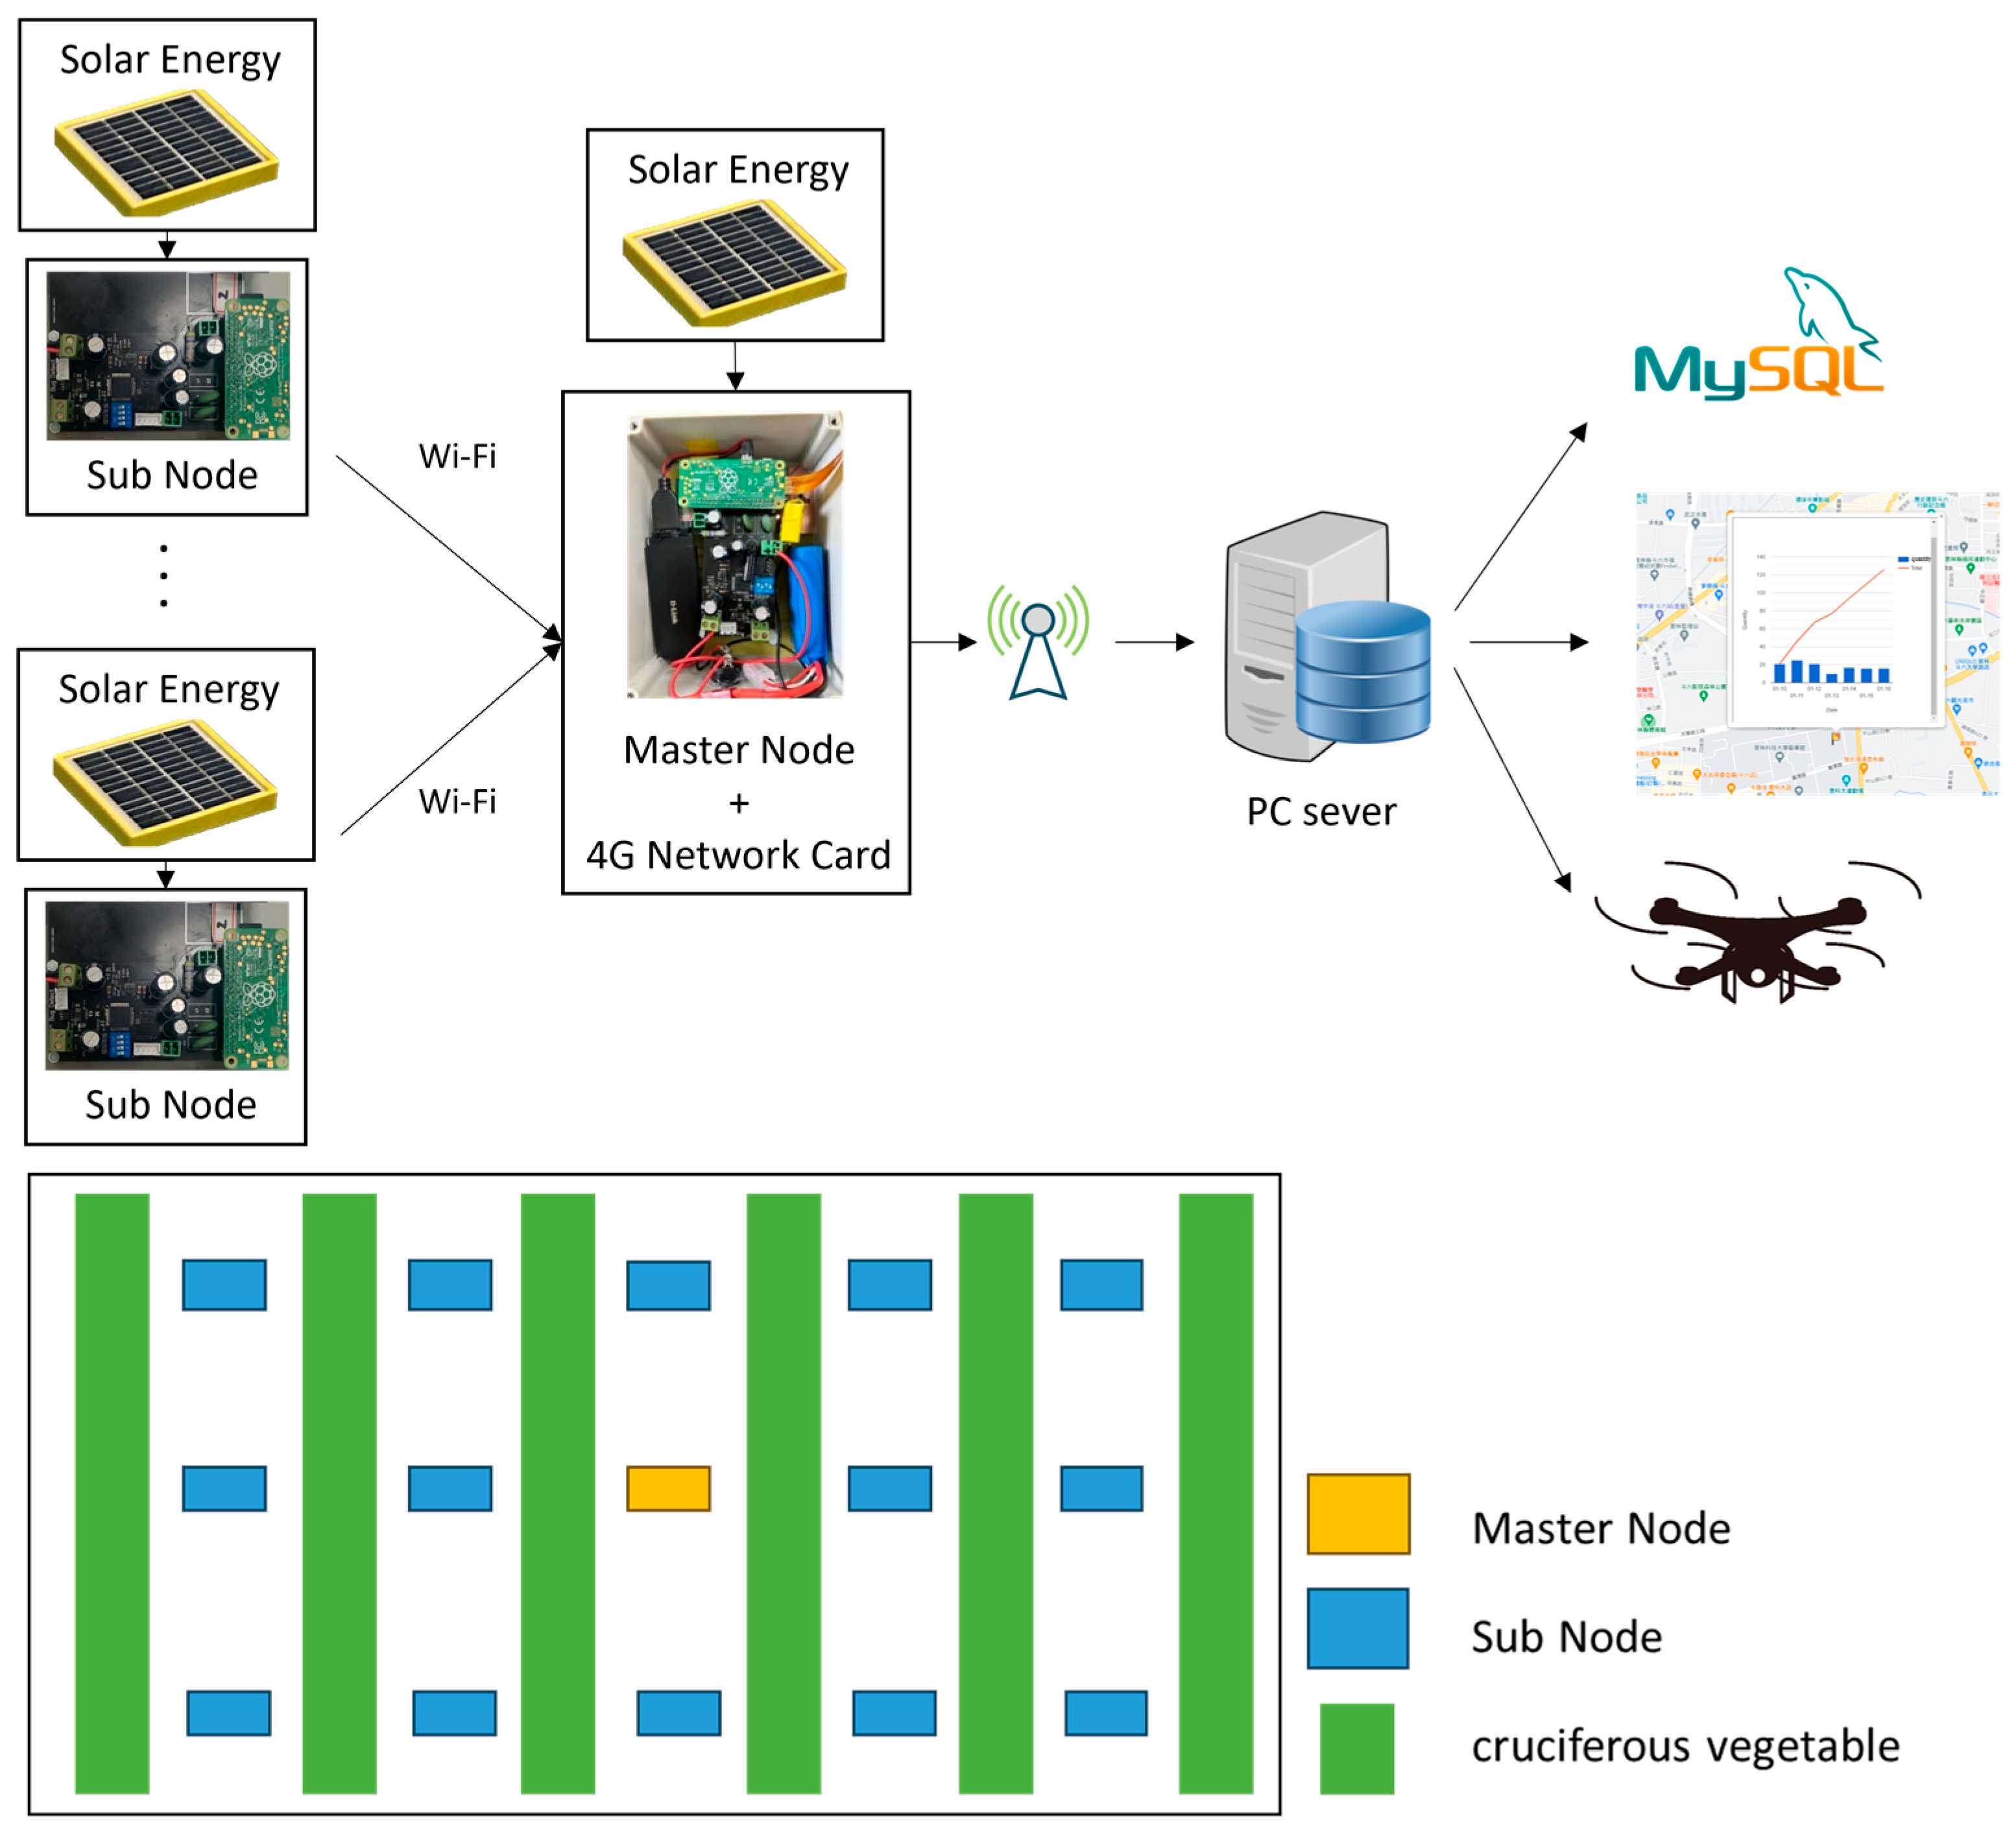
2.1. System Architecture

This system is implemented in farmland to monitor pest infestations. A master node is adopted as the central hub to establish network connections with sub-nodes and transmit the results back to a server. The system architecture, which is shown in Figure 1, is mainly divided into four parts, including the solar power supply, image recognition, the server, and the user interface. Image capture and recognition are performed by nodes that are powered by solar energy. The power supply and scheduling for startup are controlled by a micro control unit (MCU, Renesas RL78/G13 R5F100FCAFP). In addition, image capture, recognition, and network functions are handled by a Raspberry Pi. A Raspberry Pi with a 4G network card is adopted as the master node of the system, performing access point (AP) functions and providing a Wi-Fi connection for sub-nodes. For a single area of farmland, a master node can be deployed to connect multiple sub-nodes. After recognizing the image of pests on yellow sticky traps, the recognition result of each node will be sent back to the database on the server. The images will also allow us to retrain and update the model continuously. These data can not only be utilized to plan the routes of pesticide spraying for drones but also be accessed and reviewed through a web interface by users.

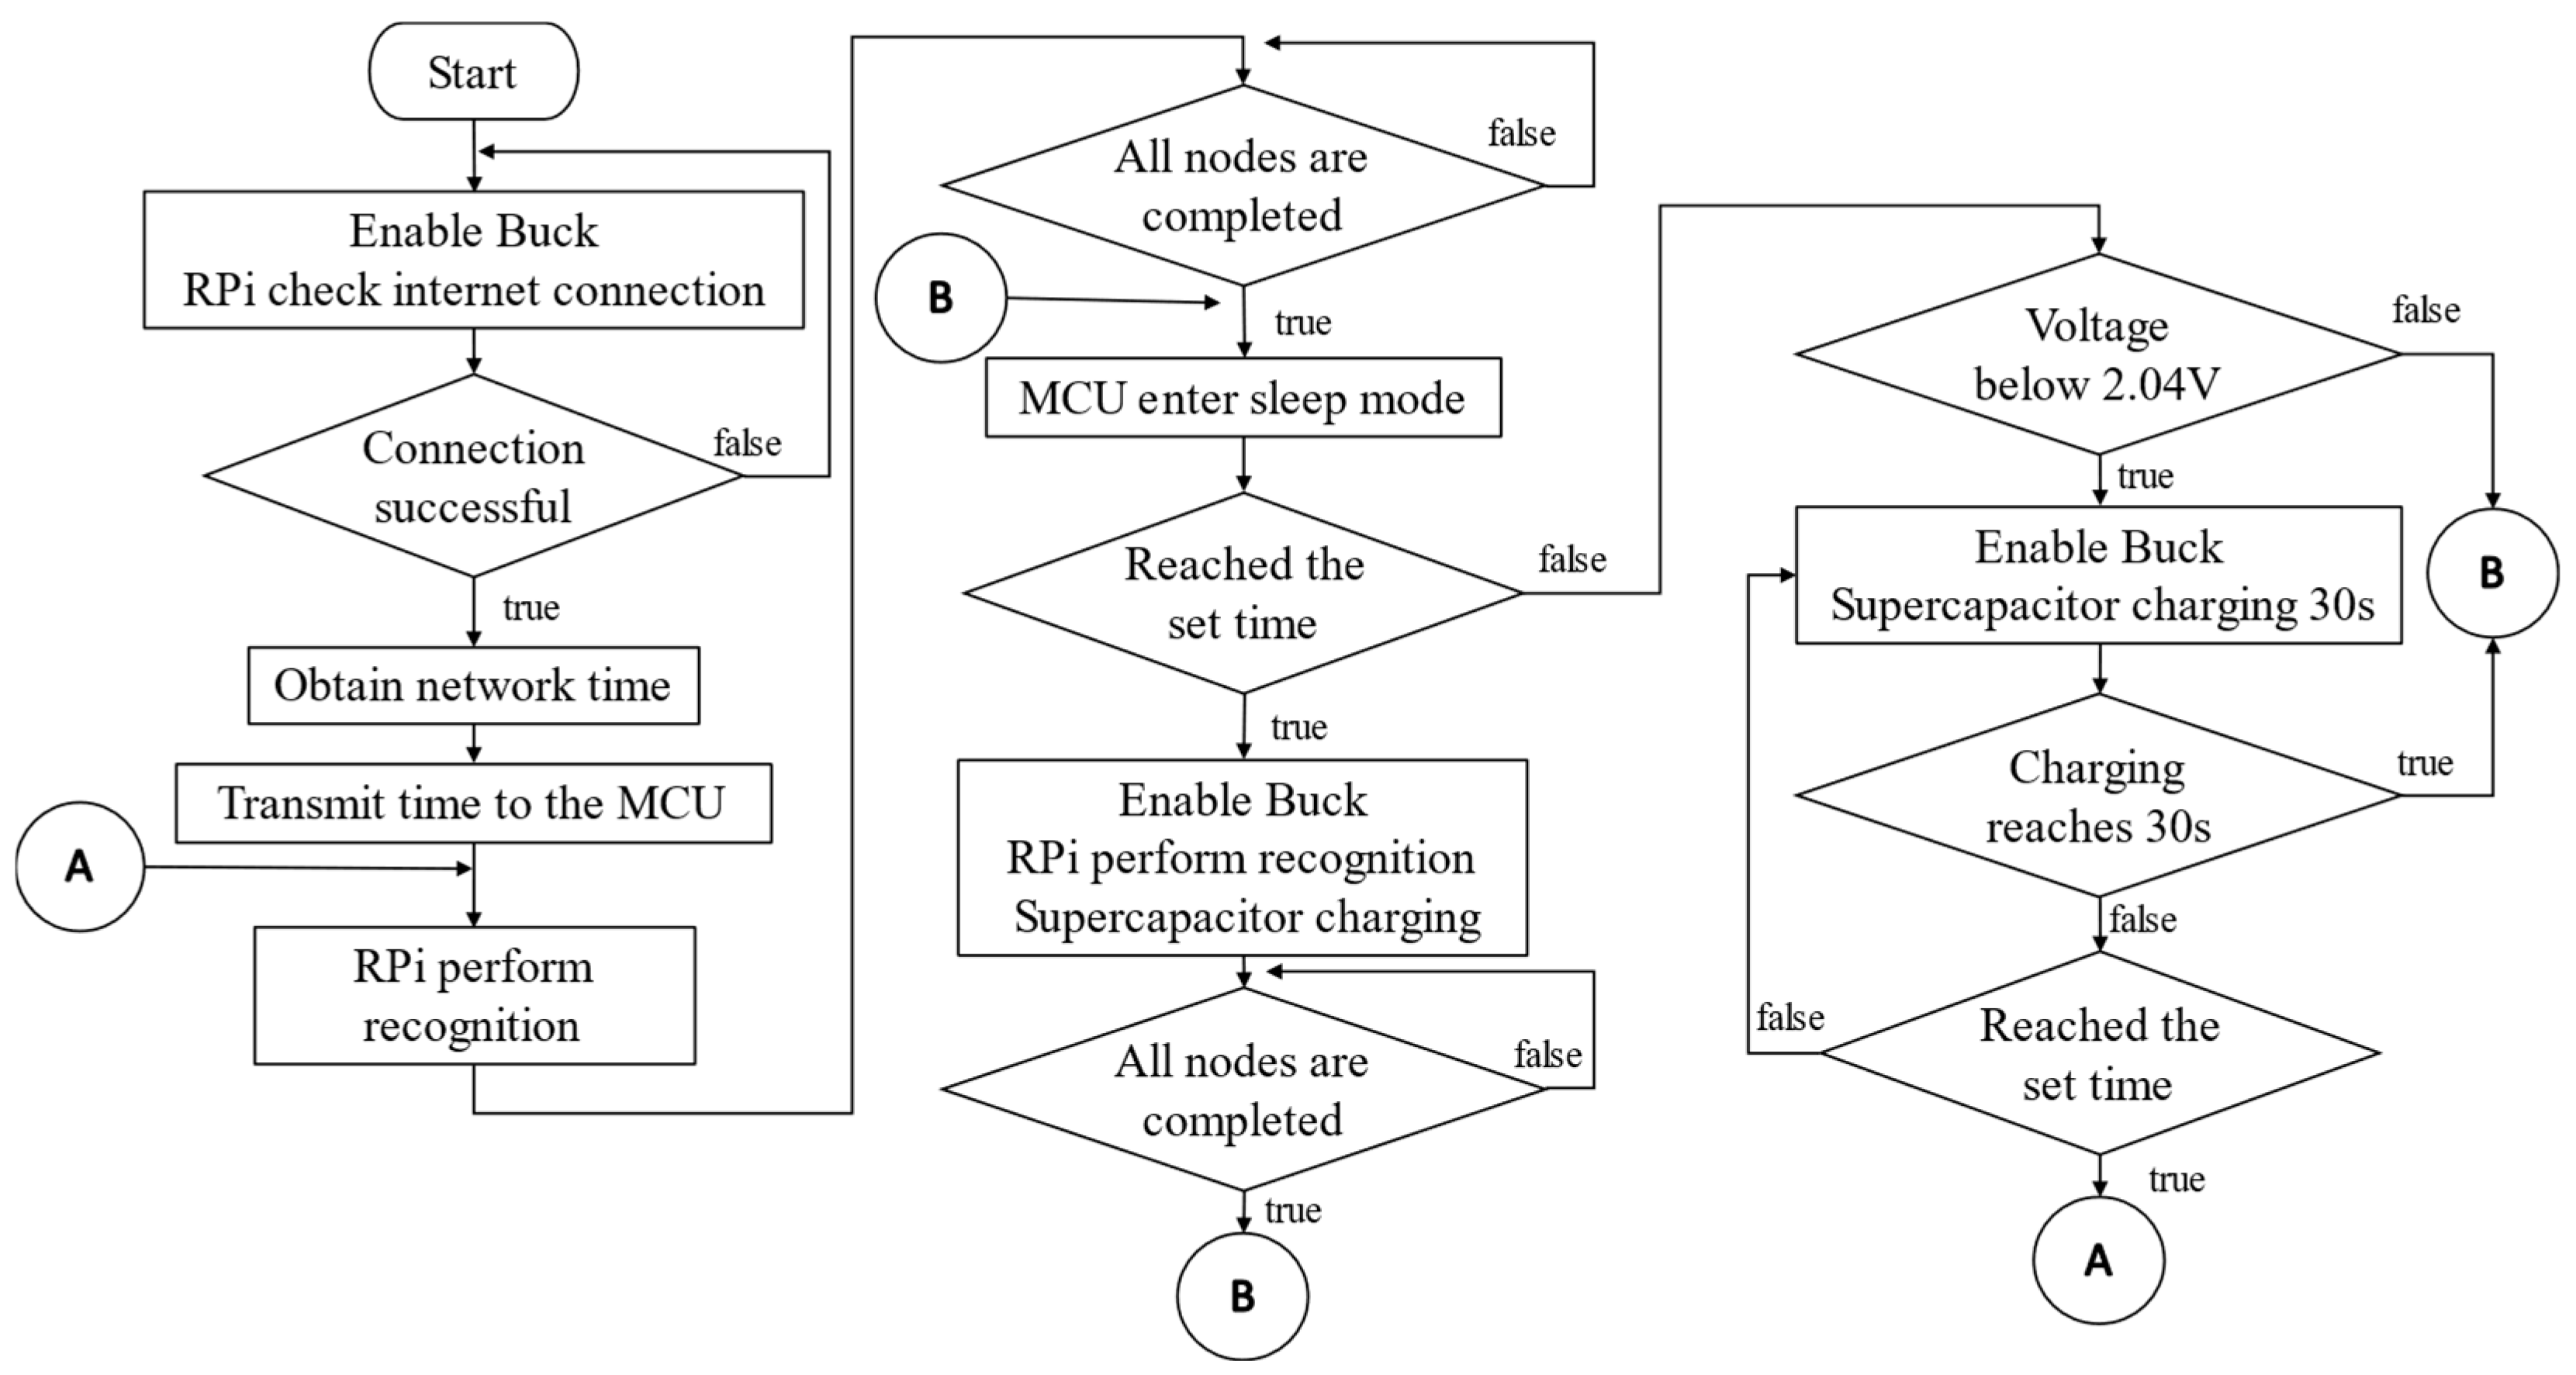
2.2. Power Management Strategy

Energy in the environment can be converted into electrical power through energy-harvesting techniques such as solar energy, wind energy, tidal energy, and geothermal energy. The purpose of the proposed system is to regularly detect the pest situation of striped flea beetles on outdoor farms. Accordingly, solar energy is selected as the source of electric power because of the low stability of wind energy, and the difficulty in obtaining tidal energy and geothermal energy. The circuit architecture presented in Figure 2 shows that a solar panel (with characteristics of 9 V and 2 W) is utilized to charge 18650 lithium-ion batteries. The batteries demonstrate robust tolerance to temperature variations, with an allowable charging temperature range of 0 °C to 50 °C and a discharging range of −20 °C to 75 °C. They also offer excellent life cycles [34], supporting over 300 charge–discharge cycles (4.2 V to 2.5 V) under standard conditions while maintaining at least 75% of their initial capacity. However, by limiting the charge–discharge voltage range to 3.6 V to 4.2 V, their life cycle can be significantly extended to approximately 2500 cycles, which corresponds to an estimated operational lifespan of around 6.8 years, as reported in [35]. These characteristics make the batteries highly suitable for long-term outdoor operations within our system. Moreover, since the MCU, Raspberry PI, and ring lights used in this system all use a 5 V, MP2330HGTL-P low-IQ buck converter, the IC produced by MPS is employed to decrease the lithium-ion battery’s voltage from 8.4 V to 5 V for powering the system. Then, the MCU is adopted to control the power supply and enable the pin of the buck converter IC to determine whether the power supply is active or not. The flow of the power management strategy of the system is shown in Figure 3. During non-operational periods, the MCU will enter low-power mode and will be powered by a supercapacitor. This allows the current to decrease from 10 mA to 8μA. When the MCU is in low-power mode, it monitors the supercapacitor, automatically activating the buck converter to charge the supercapacitor for 30 s when the voltage falls below 2.04 V. Based on experimentation, this process occurs approximately seven times per day to sustain system operation. The system is periodically awakened using a real-time clock (RTC), which helps maintain the cyclic operation of the system. A universal asynchronous receiver/transmitter (UART) is implemented for communication between the Raspberry Pi and the MCU.
Two solar panels connected in parallel and a 3200 mAh lithium battery are equipped with the master node, providing an energy capacity of 23.68 Wh. A solar panel and a 1500 mAh lithium battery are equipped with the sub-node, offering an energy capacity of 11.1 Wh. Assuming a daily charging window of 10:00 to 14:00, the most sunlight-rich 4 h, the system can theoretically accumulate 16 Wh and 8 Wh of energy daily for the master and sub-nodes, respectively. Under the assumption of no losses, both configurations are expected to fully charge their batteries within two days.

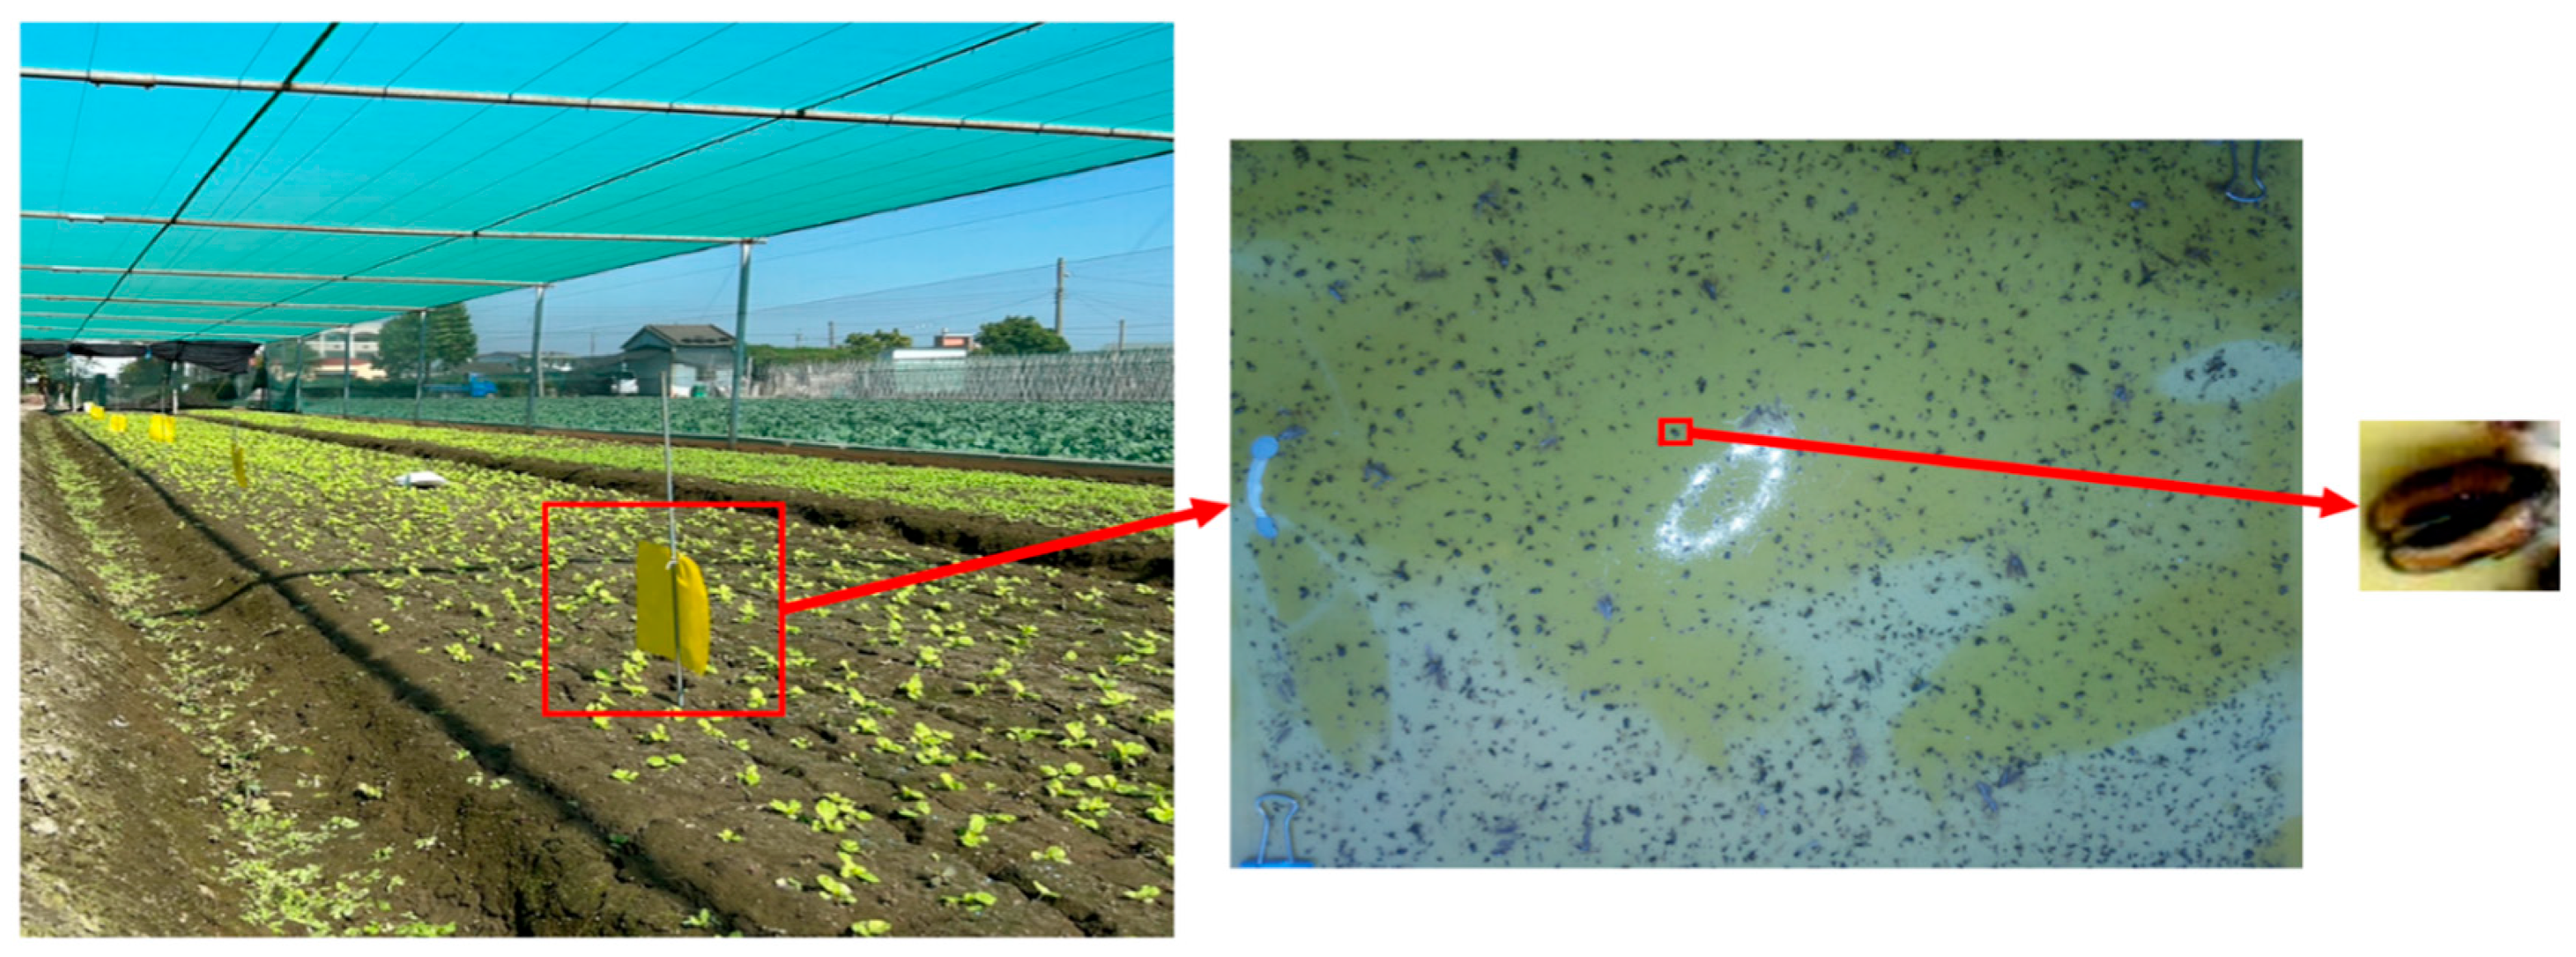
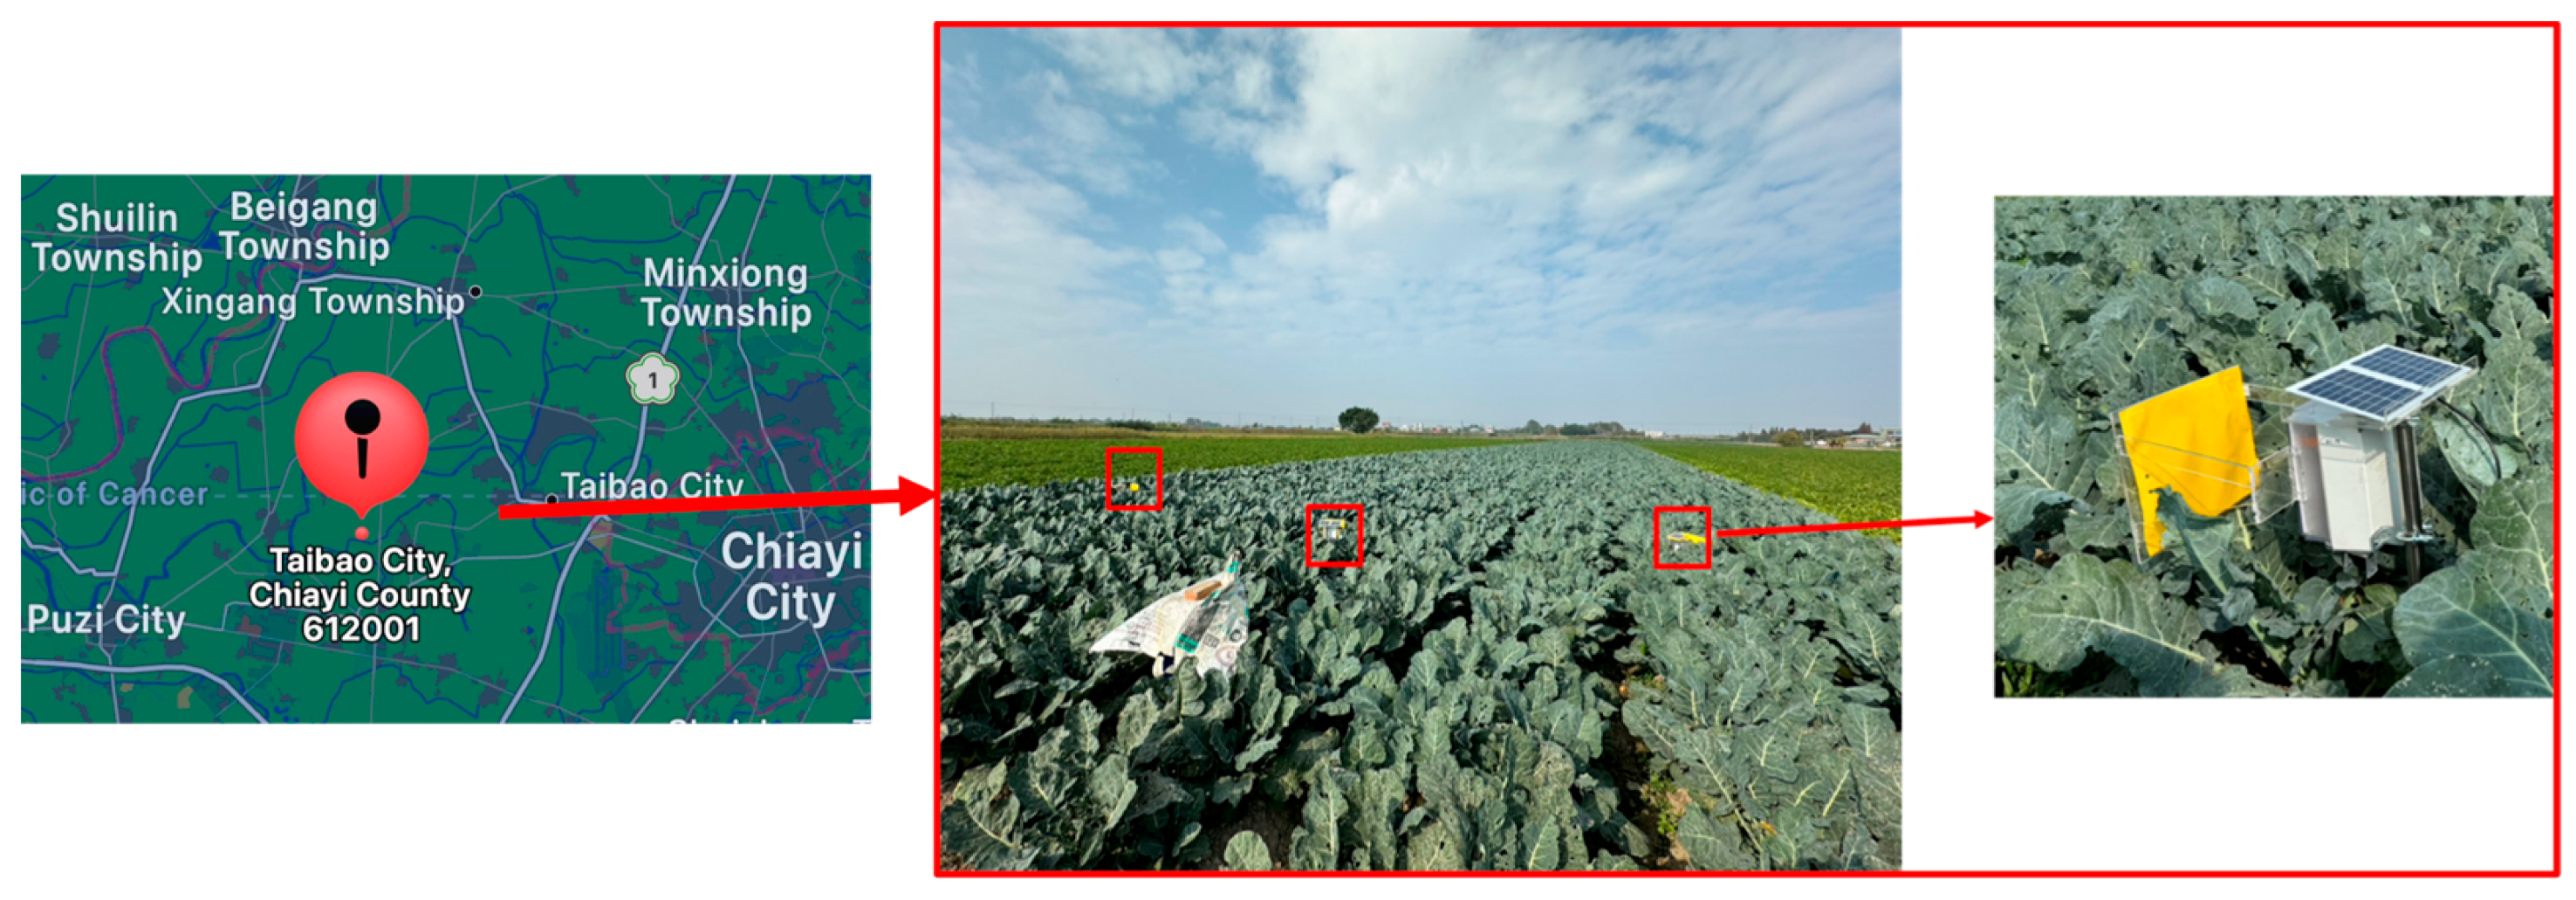
2.3. Data Acquisition

As shown in Figure 4, a total of 10 pieces of yellow sticky traps are arranged on the cabbage farmland at intervals of 3 m. A total of 120 sticky traps are collected and photos are taken in a seven-day cycle, along with 240 photos of sticky traps provided by farmers. Moreover, the LabelImg marking tool (Version: 1.8.6) is adopted to mark the fleas from 360 images in total, resulting in 8421 samples.

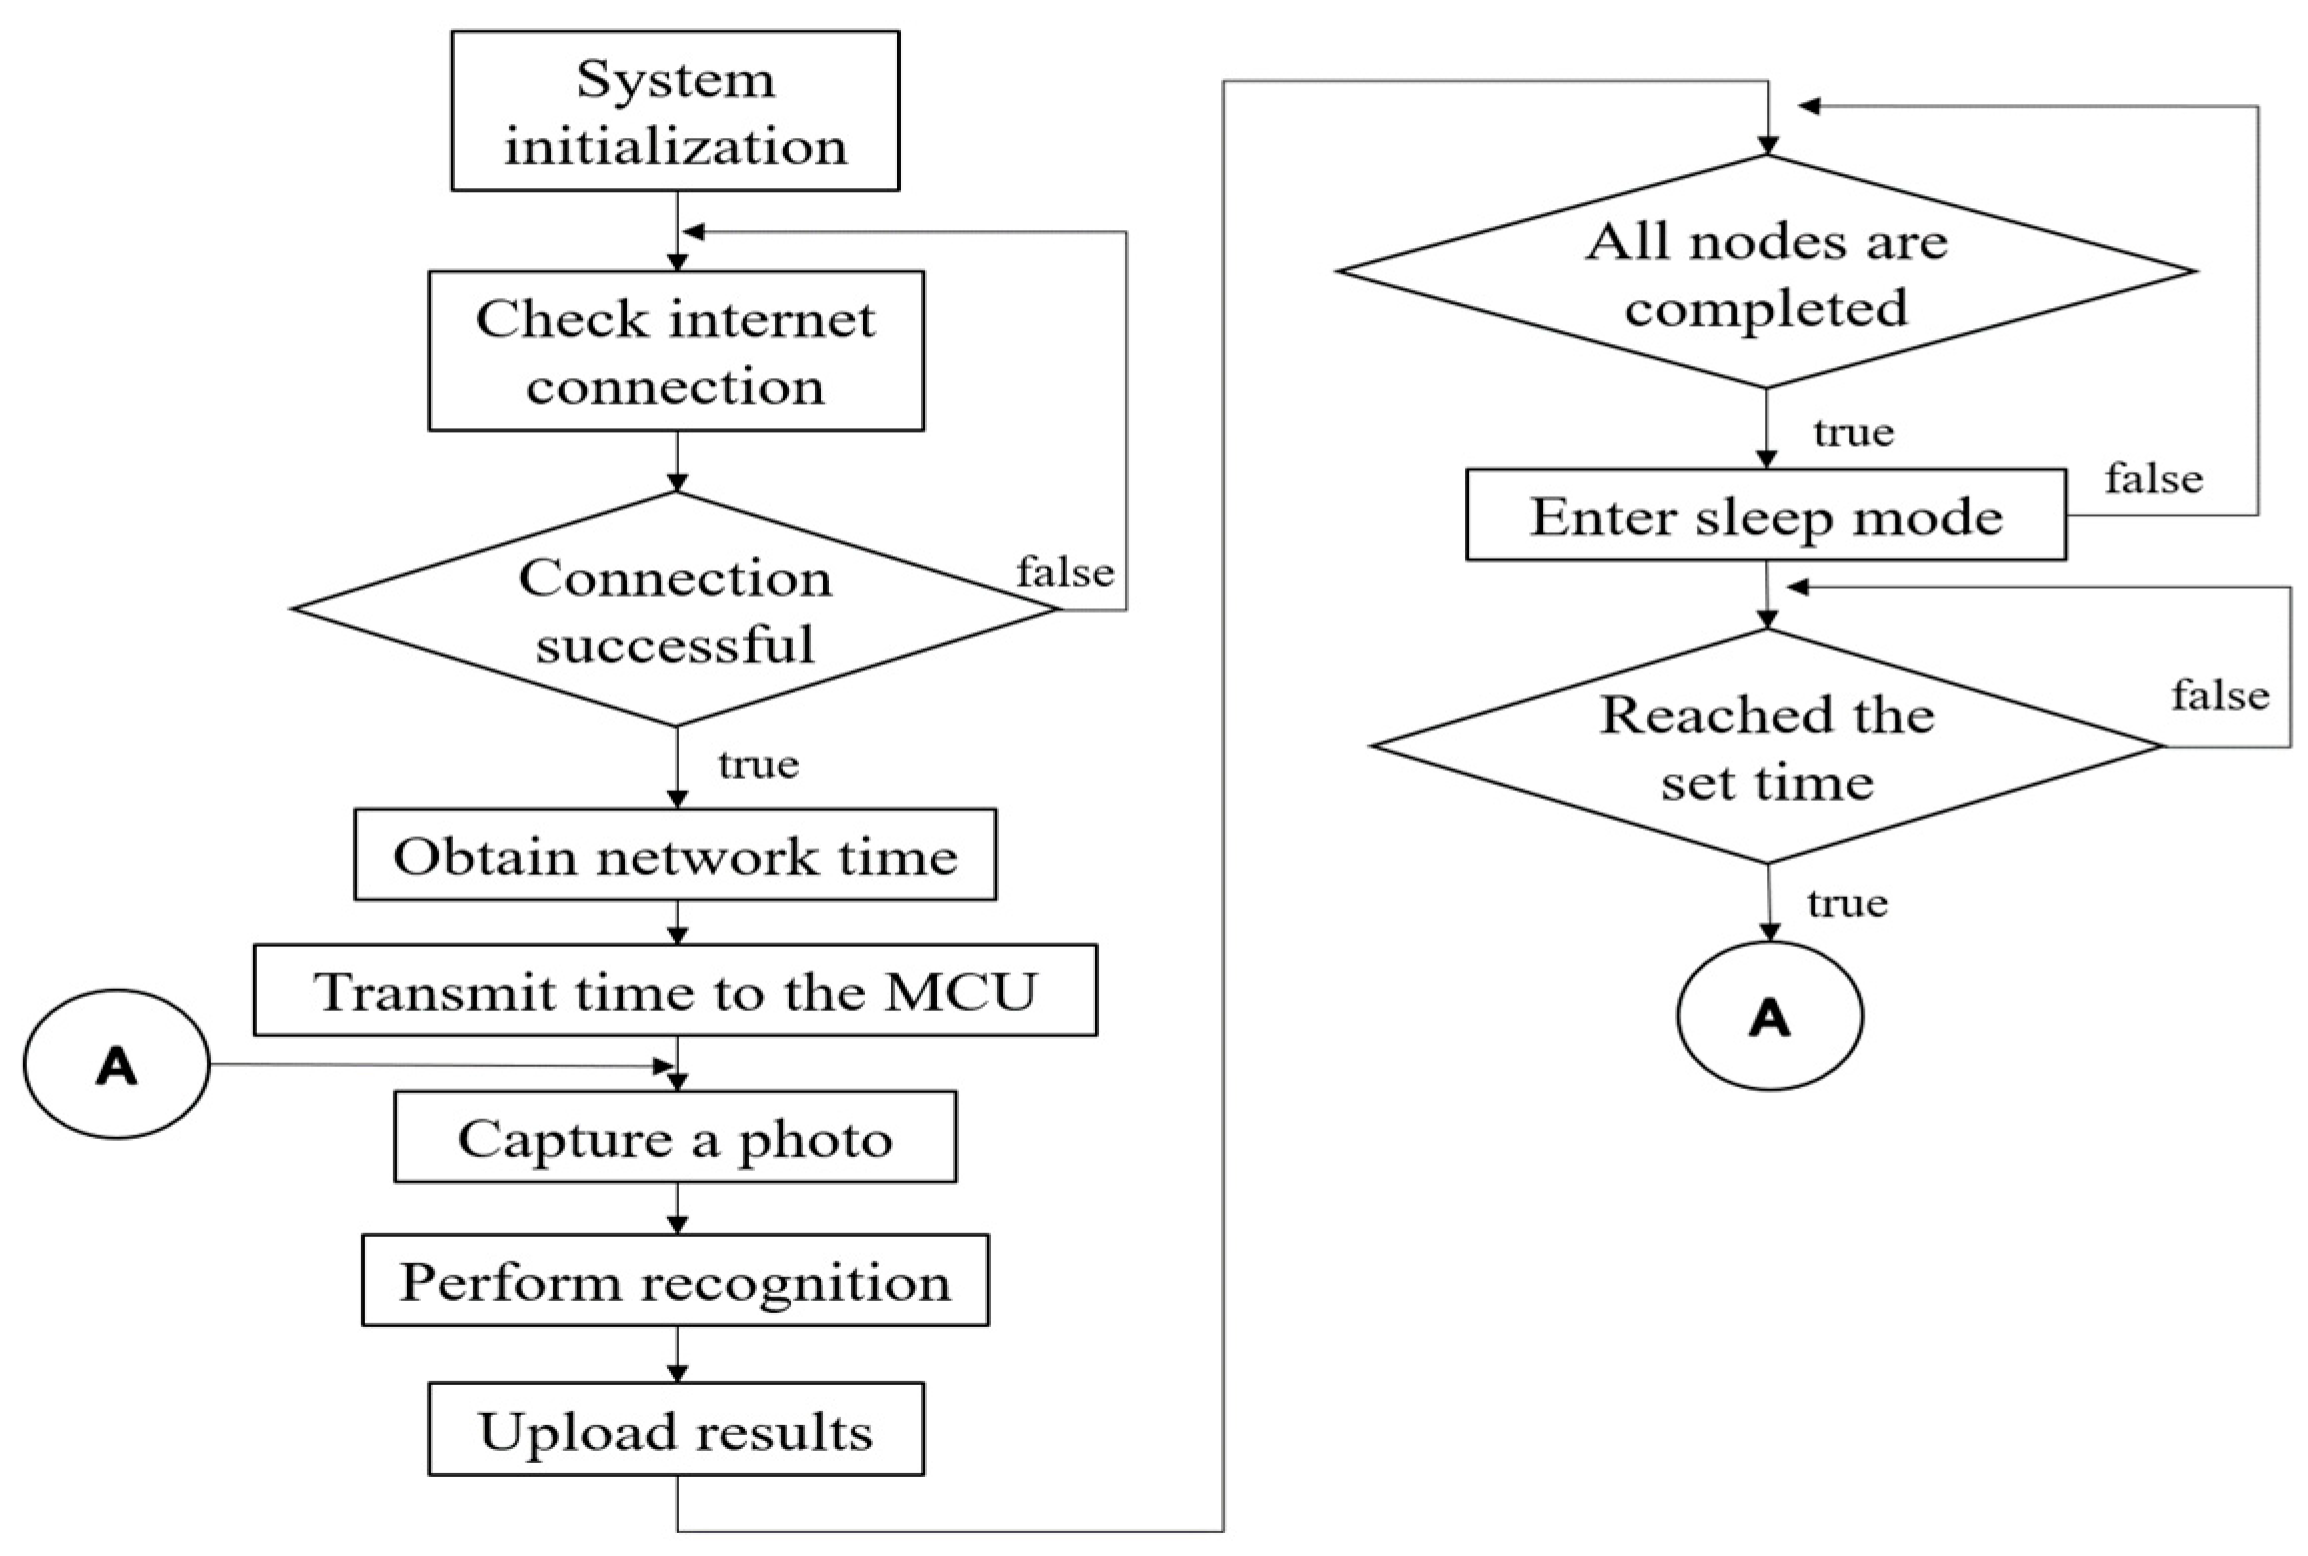
2.4. Computing and Shooting Components
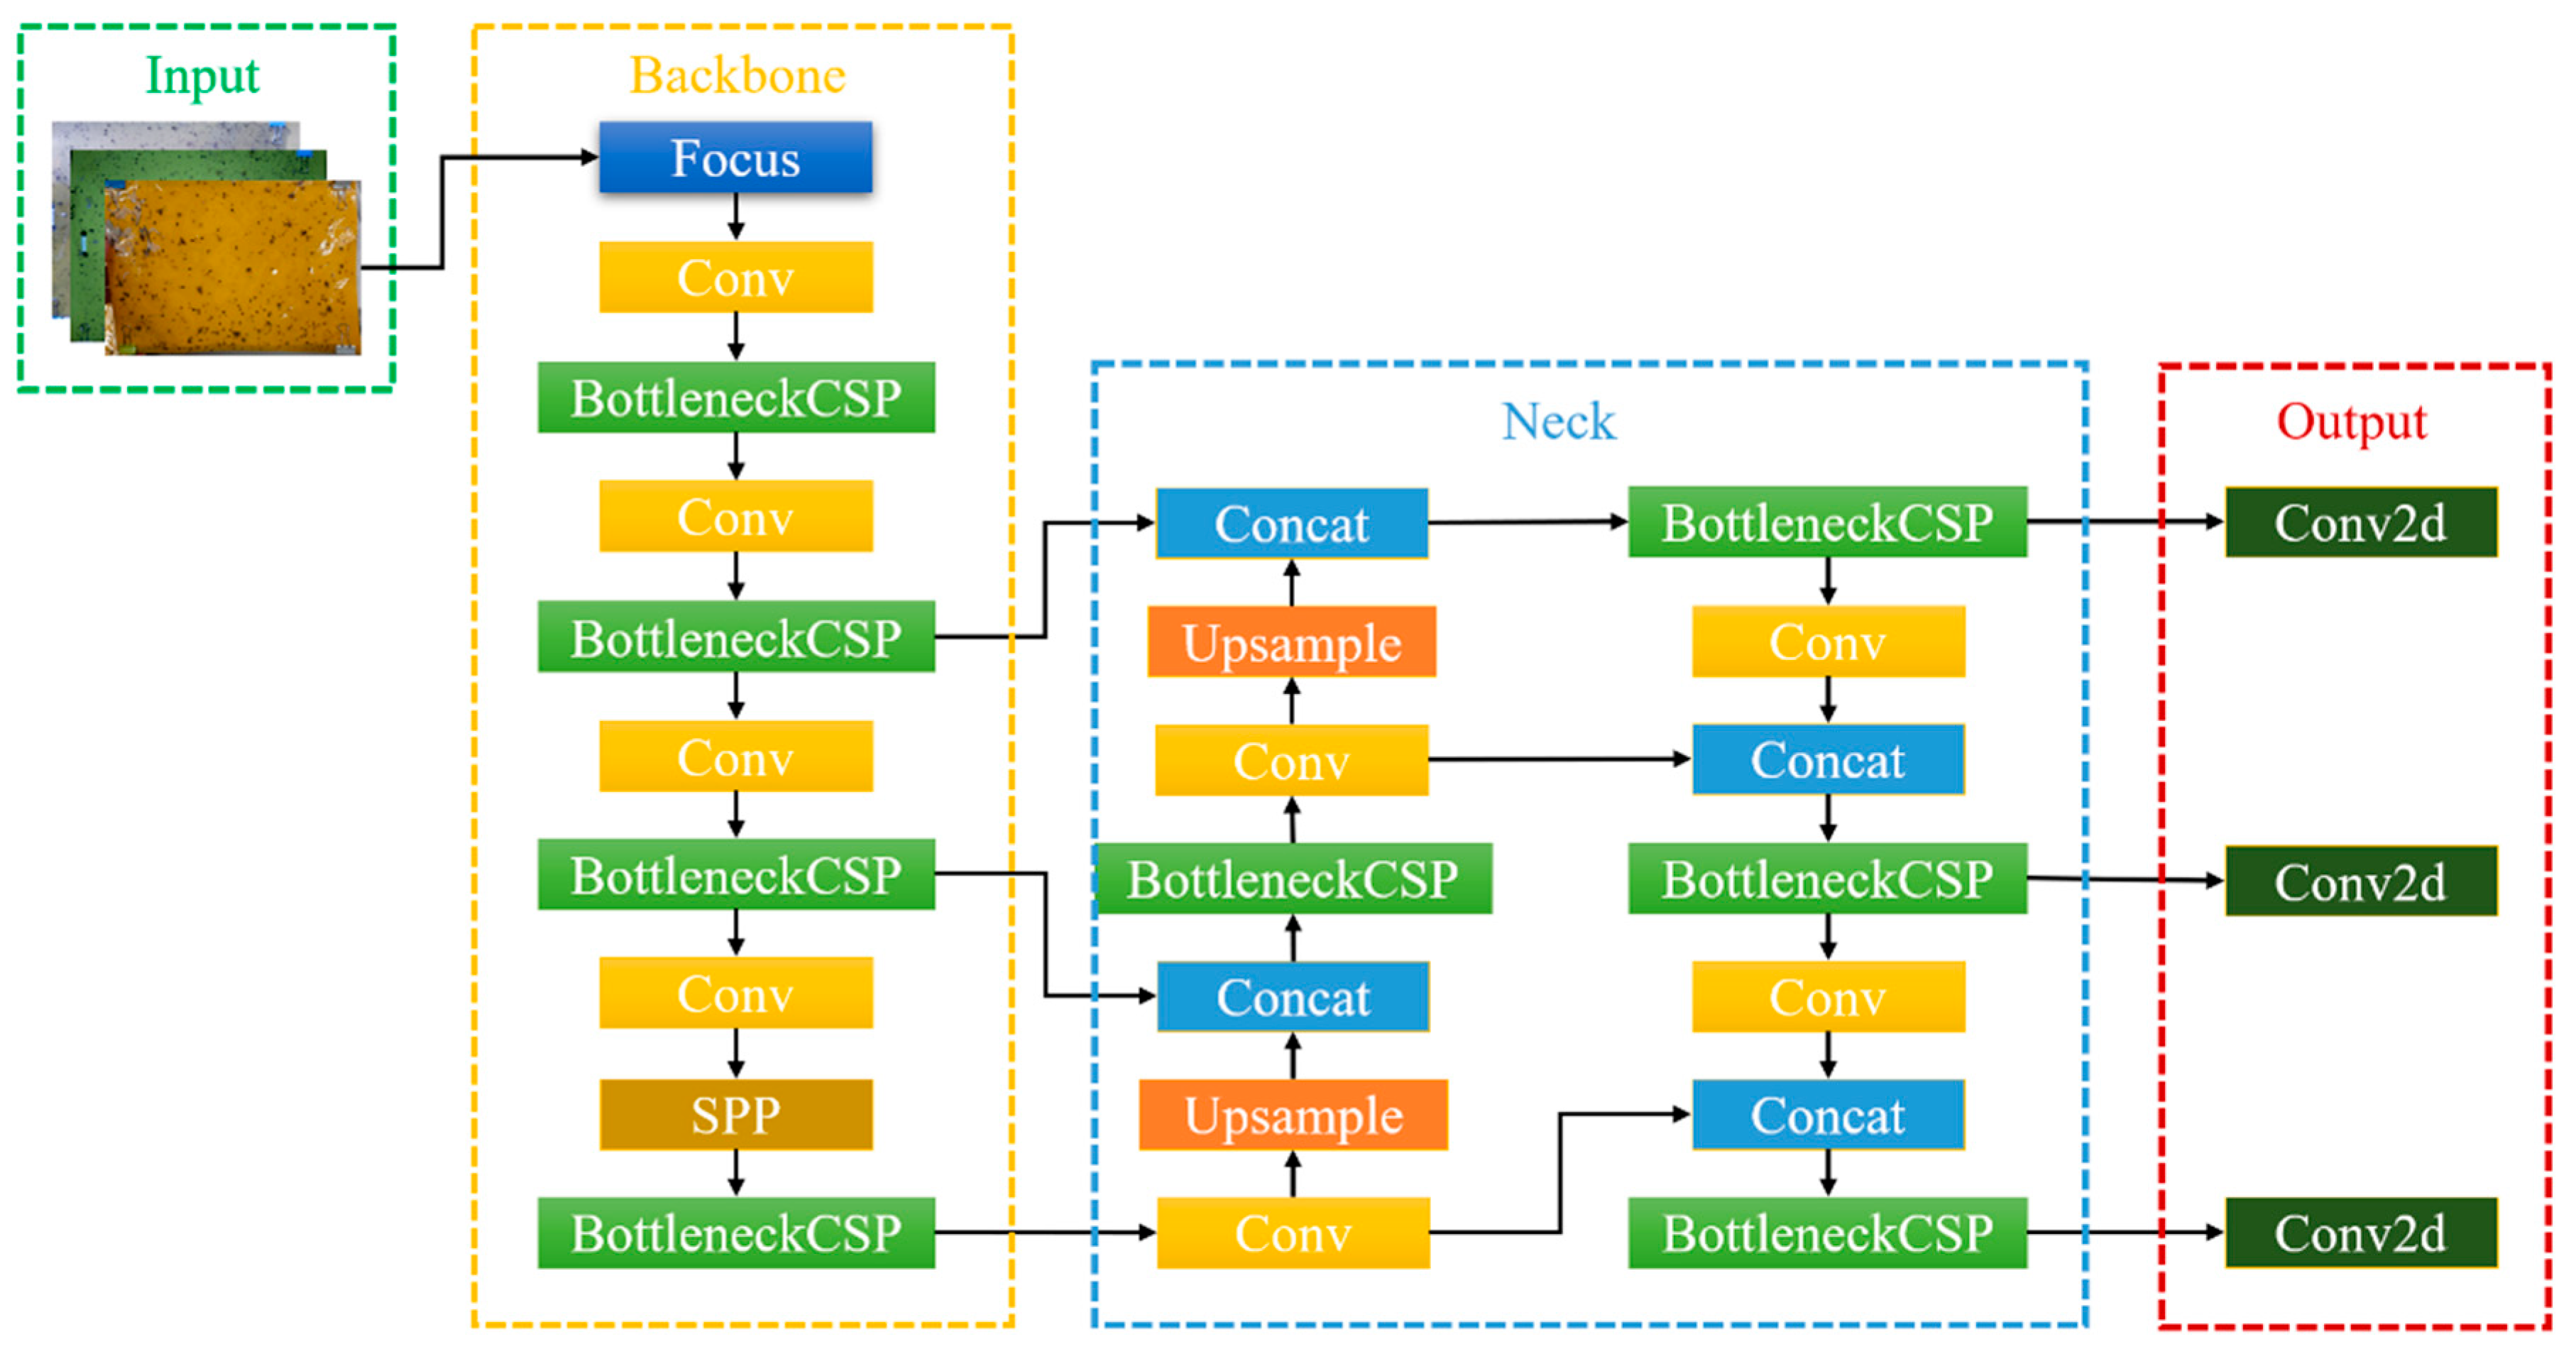
A Raspberry Pi zero 2 W single-board computer with an Arm Cortex-A53 core and 512 MB LPDDR2 SDRAM is employed in this system to capture images of yellow sticky traps and perform the calculation for recognizing striped flea beetles. This single-board computer also has Wi-Fi and an MIPI camera serial interface, equipped with the Raspberry Pi camera module v2, which contains a SONY IMX219 image sensor element (SONY, Tokyo, Japan) with a resolution of 3280 × 2464 and a horizontal 62.2 48.8-degree vertical viewing angle. As shown in Figure 5, all electronic components are integrated in a waterproof box, and the yellow sticky traps for catching striped flea beetles are installed with a support frame 20 cm in front of the lens. A ring light is also used for lighting when shooting.
The operation process of the node is shown in Figure 6. In the beginning, the system confirms the network connection after turning on the power and initializing. When confirming the connection, the obtained network time is sent to the MCU to correct the system time. Then, a picture is taken and recognition is performed. The recognition result is uploaded to the server after recognition is completed. Due to the high computational resource usage during the recognition process, the operation of the AP function on the master node becomes unstable. To address this issue, it is possible to stagger the operation time of the master node and sub-nodes. Sub-nodes are activated only when the recognition process on the master node is completed. Therefore, the operation time of the master node is longer than that of the sub-nodes, and the power consumption is also larger.

2.5. YOLOv5

YOLO, a well-known one-stage object detection algorithm, has been widely used since it was proposed because of its simple network structure and fast detection speed. After several iterations, the problems of low detection accuracy and weak detection of small targets in the YOLO series have been greatly improved. The architecture of YOLOv5 [36] used in this research consists of the following four parts, and the network architecture is shown in Figure 7.
  • Input: Performing mosaic data augmentation and adaptive image scaling;
  • Backbone: Extracting target features;
  • Neck: Applying pooling operations to feature maps of different sizes;
  • Head: Predicting the output category.
Compared with the traditional image algorithm, it is necessary to use a different algorithm to identify striped flea beetles and exclude other insects or dust on the trap board. Using deep learning models can achieve better recognition of target objects in complex images by increasing the number of training samples. The YOLOv5 network is divided into five versions, including v5n, v5s, v5m, v5l, and v5x. The difference between them is the width and depth of the network. The v5n model is the smallest model, making it more suitable for deployment on edge platforms with low computer capabilities.

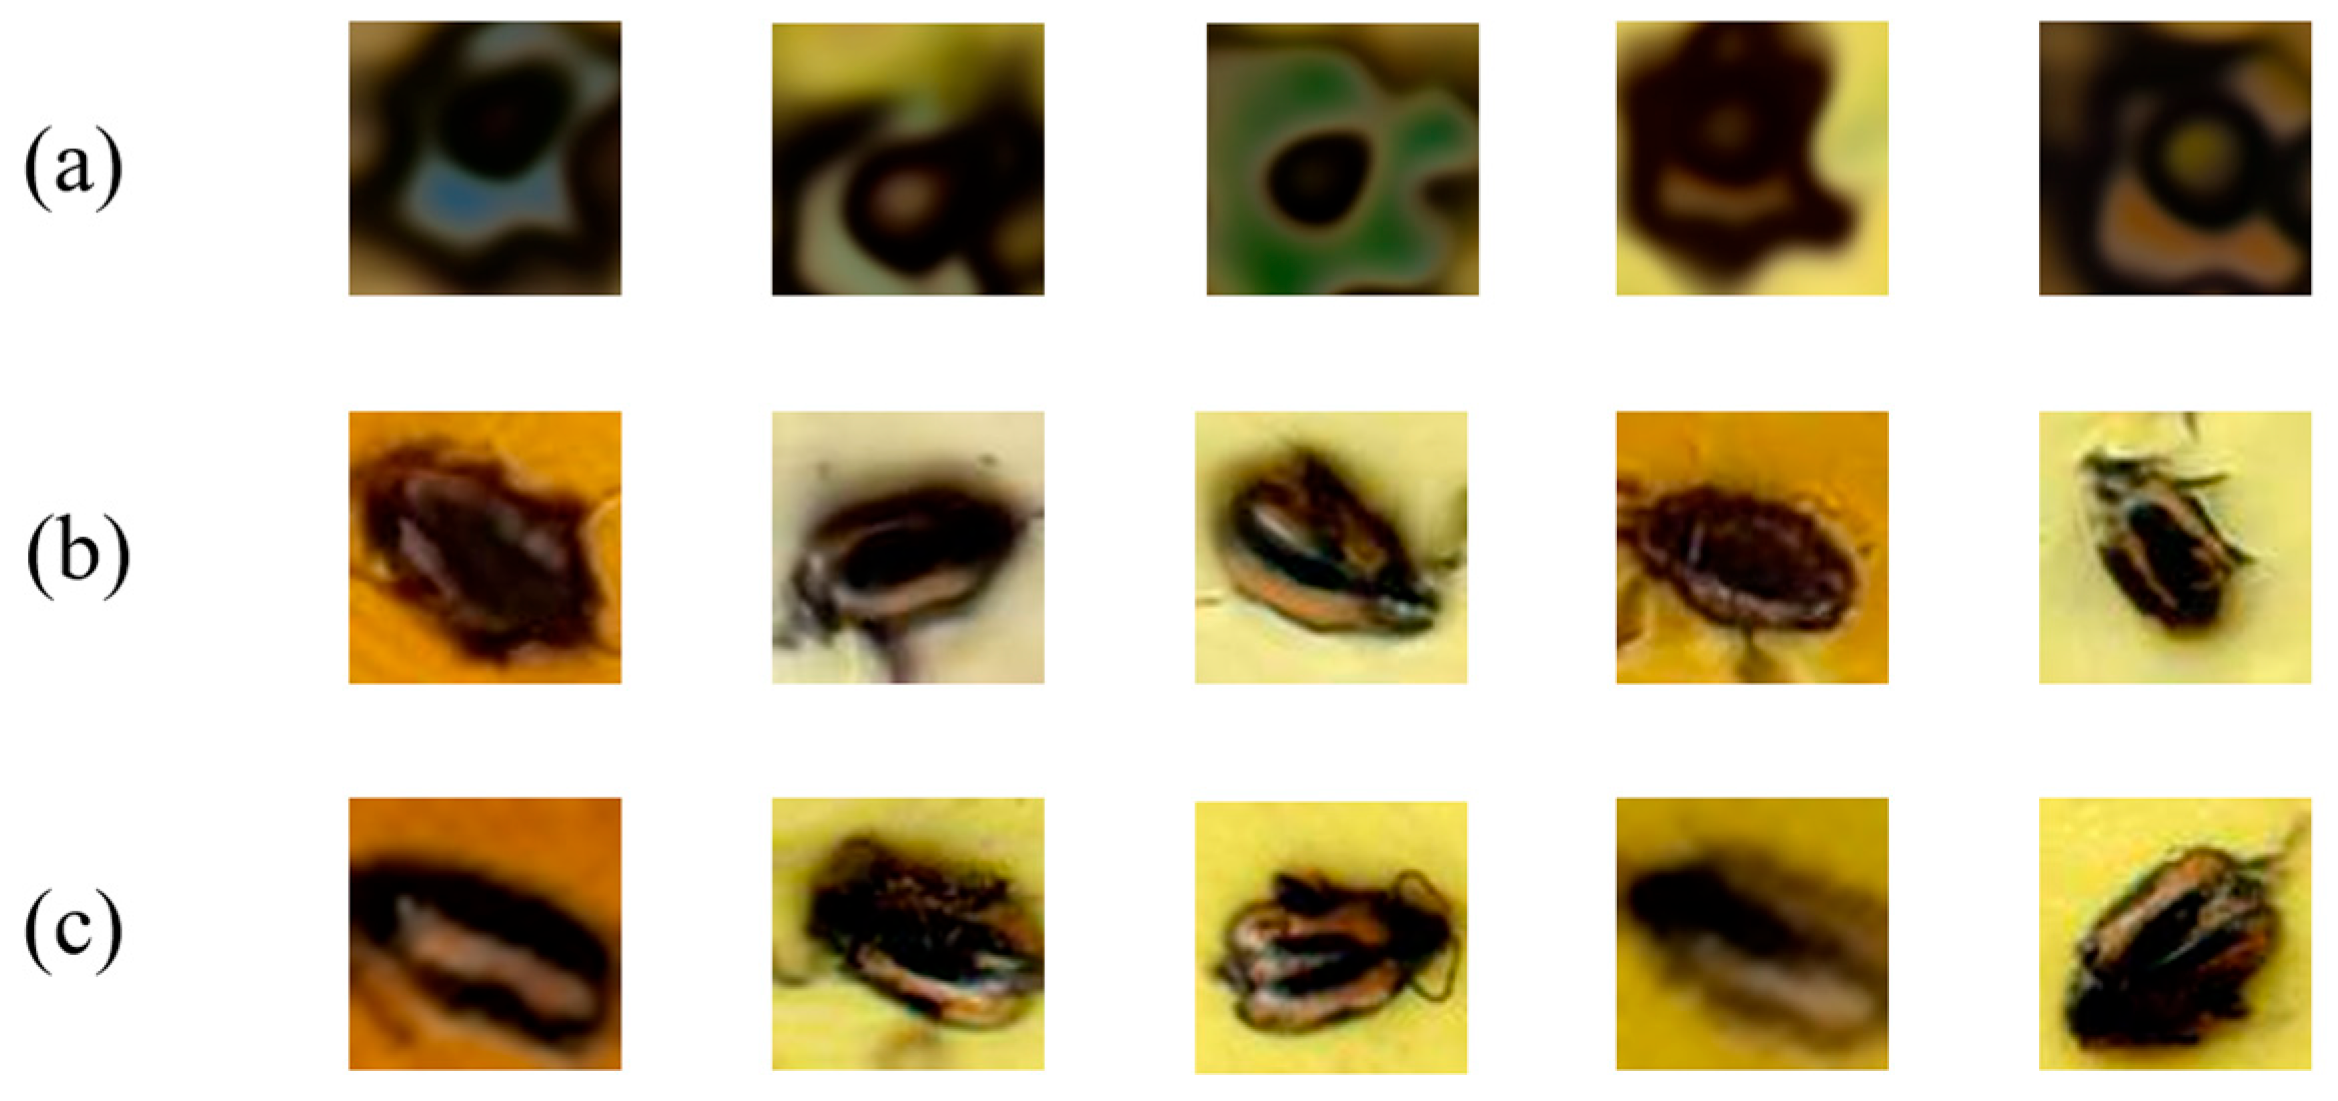
2.6. Data Augmentation with StyleGAN3

In order to train an image recognition model with excellent accuracy, a large amount of image data are required. However, it would take a long time to acquire these data because collecting a large number of samples and manually annotating the target objects within the images are both needed to train the recognition model. Therefore, a GAN is implemented to generate new image samples from the existing dataset, effectively expanding the training dataset. A GAN consists of a generator and a discriminator. The purpose of the generator is to generate fake images that are close to the real images through the training data we provide, while the discriminator assesses whether an image is real or fake and provides feedback to the generator. When the fake images generated by the generator are classified as real by the discriminator, it indicates an improvement in the generator’s performance. On the contrary, if the images are identified as fake by the discriminator, the generator will be adjusted to generate a realistic image.
The generative network StyleGAN3 [37] used in this paper is an improved version based on StyleGAN [38], which has greatly improved the details of the generated images. It changes the input of the network from the traditional random noise vector to Fourier features. In addition to focusing on features, the positional information of these features is also emphasized. This leads to a better effect on the continuous features and details of the generated image. The network architecture is shown in Figure 8. The distinctive features of images of striped flea beetles include small antennae and stripes that occupy only a small portion of the image. Therefore, StyleGAN3 can be used to learn image details and generate external samples to achieve data augmentation in this research.

2.7. Server and User Interface

MySQL is applied as the database to store node data in this system, including timestamps, the MAC address of each node, and recognition results. When recognition nodes are being linked to the server to upload data, the information is stored in the database. Additionally, a message is sent to update the pest situation after each recognition process. The webpage is adopted as the user interface to display the distribution of nodes through the map. Within the webpage, users can select a specific node to view the detailed variations of pest infestations. The GPS coordinates of the nodes are obtained using mobile devices near the nodes, and then users can set the corresponding nodes on the webpage. This approach helps reduce the cost of equipping all nodes with GPS modules.

3. Results and Discussion

3.1. Experimental Platform

The environment of our experimental system is configured as follows. The GPU utilized for this study is equipped with an RTX 3090 processor, and Windows 10 is chosen as the operating system. CUDA 12.2, CUDNN 8.9.2, and torch 1.11.0 comprise the acceleration environment.

3.2. Evaluation Metrics

To evaluate the training results of the recognition model, ref. [39] used metrics such as true positive (TP), false positive (FP), true negative (TN), and false negative (FN) to calculate precision (P), shown in (1), the proportion of actually positive samples among the predicted positive samples, and recall (R), shown in (2), the proportion of correctly predicted positive samples among all positive samples. Accuracy (ACC), presented in (3), is adopted to evaluate the overall accuracy of the model. The F1-score (4) was used to verify the correctness of each detection. Both metrics are measured from 0 to 1.0, where values closer to 1.0 indicate better performance.
P = T P T P + F P
R = T P T P + F N
A C C = T P + T N T P + F P + F P + F N
F 1 - s c o r e = 2 P R P + R

3.3. Image Generation

The dataset utilized to train StyleGAN3 consists of self-collected striped flea beetle images. These images are first annotated manually and cropped to images of various sizes, from 10 × 15 pixels to 32 × 34 pixels. Finally, these images are resized to 32 × 32 pixels. In total, there are 8421 pest images in the dataset.
The pictures generated at the initial stage of training are shown in Figure 9a. It can be observed that there are no features of striped flea beetles. The images generated after 2000 kiloimages (kimg) of training are shown in Figure 9b. Comparing the generated images with real image samples, as shown in Figure 9c, it is evident that the generated images show the features of striped flea beetles. Therefore, the generated images are incorporated into the training of the YOLOv5 recognition model to achieve data augmentation.

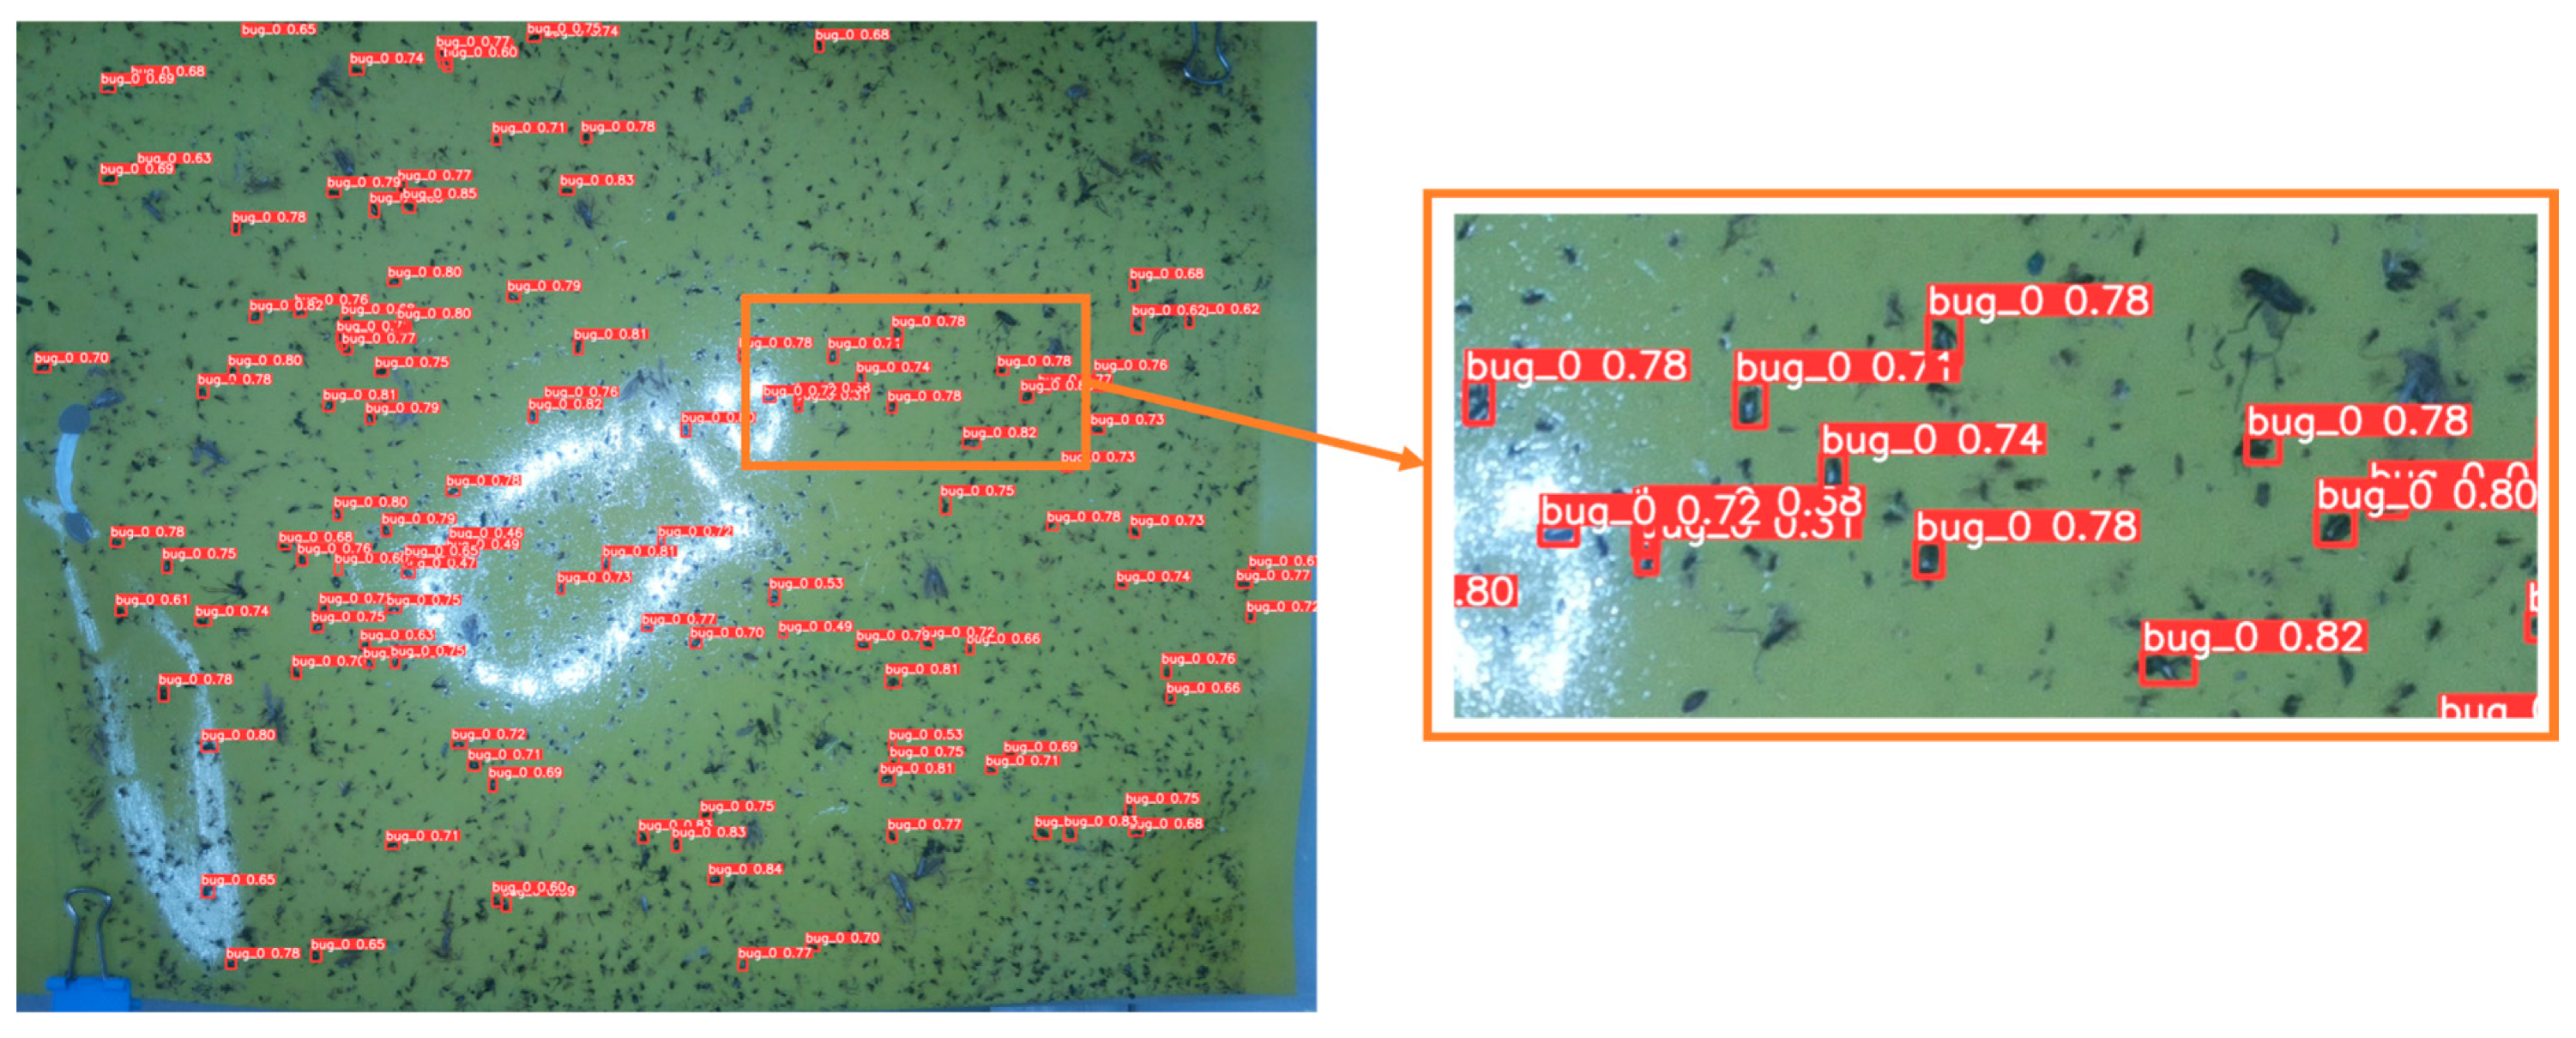
3.4. Comparison of Recognition Results

The following compares models trained using the original dataset alone with models trained using the original dataset combined with a dataset generated using StyleGAN3. The dataset is split into a training set and a validation set with a ratio of 9:1. To verify the accuracy of the model, an independent test dataset containing 546 images of striped flea beetles was used, which were collected separately, that is, not used in the training and validation process. In the experimental process, a stochastic gradient descent (SGD) optimizer with a momentum of 0.937 is utilized. The parameters for training the YOLOv5 model are shown in Table 1.
Table 2 presents the accuracy results of the independent test dataset for both the model trained with the original dataset and the model enhanced by adding 2000 generated images of different sizes. When adding 2000 generated images with a size of 32 × 32 pixels and 16 × 16 pixels to the original dataset, the ACC improved by 3.5% and 6.3%, respectively. Furthermore, when simultaneously adding generated images of both sizes to the original dataset, the improvement in ACC reached 7.1%. Recall and precision also improved by 6.2% and 2.6%, respectively. The results show that adding images generated by StyleGAN3 to the original dataset for model training can enhance the accuracy of the recognition model.
The model recognition results are shown in Figure 10. Bug_0 represents striped flea beetles. The results show that the striped flea beetles can be effectively identified even when there are various other insects and particles stuck on the sticky trap.
Table 3 compares YOLOv5n, YOLOv7-tiny, and YOLOv8n, where each model was trained using the original dataset and the original dataset augmented with generated images. The accuracy results were evaluated using an independent test dataset, which was collected separately and not used during the training or validation process. The results show that the accuracy of YOLOv5n and YOLOv8n increased by 7.3% and 5%, respectively, after adding generated images. Although YOLOv7tiny did not show a significant improvement in accuracy after training with generated images, it had already achieved an accuracy of 86% without using generated images, which is comparable to the performance of YOLOv5n trained with generated images.
Additionally, we attempted to compare other lightweight image recognition model architectures, such as the faster region-based convolutional neural network (faster R-CNN) and EfficientDet [40]. In the application of this article, due to the small proportion of striped flea beetles in the images, with each insect measuring only 10 to 30 pixels in size, the detection accuracy of these models was only around 1%, which is far lower than the accuracy achieved by the currently used YOLO model.
A comparison of the running speeds of each model on Raspberry Pi is shown in Table 4. Among them, YOLOv5n has the fastest recognition speed and the smallest model size, being 44% faster than YOLOv7tiny. While there is only a 0.5% difference in accuracy compared to YOLOv7tiny, as shown in Table 3, the final choice of model is YOLOv5n.
Comparisons of recognition results under different lighting conditions for the same yellow sticky trap are shown in Figure 11 and Table 5. Owing to the angle of sunlight, the lighting ratio of captured yellow sticky trap images tends to be too high. This causes the striped flea beetles in the images to appear as black shadows, making it impossible to distinguish their features. During the night, using a ring light source to provide even illumination can obtain better recognition results in captured images, since there is no interference from other light sources. Therefore, the recognition results at night are referred to in this research.

3.5. Deployment on Raspberry Pi

The operating system implemented on Raspberry Pi zero 2 w is 32-bit Raspbian 10. The programming environment contains Python 3.7.3 and Torch 1.7.0. RaspAP 2.8.8 is used to realize the AP function used by the master node. Regarding memory allocation, 56 MB is allocated to the GPU, satisfying the minimum memory requirement when taking photos. The remaining 456 MB is allocated to the CPU. The pt file generated by training YOLOv5n on a computer is used for the recognition model. Deploying the model on Raspberry Pi, the time taken to recognize one photo is approximately 4 min and 30 s, while the entire process from start to finish takes around 5 min and 30 s. Although performing image recognition on a computer takes only 0.01 s for a single photo, using a Raspberry Pi for recognition in the field is sufficient because the recognition process only needs to run once or twice a day.

3.6. Long-Term Testing of the Power Management Strategy

The system proposed in this study was deployed outdoors for long-term testing, as shown in Figure 12. The experimental site is located in Taibao City, Chiayi County, Taiwan, where the average daily sunlight duration is 5.9 h [41]. The current consumption of each work stage of the system is summarized in Table 6. The system’s daily operation can be divided into four stages: the time synchronization stage, the recognition stage, the MCU sleep stage, and the supercapacitor charging stage. Without using supercapacitors, the estimated operating days would decrease from 7 days to 1 day. The power management strategy is the use of an MCU to monitor the voltage level of the supercapacitor. Charging via the Enable Buck circuit is only activated when the supercapacitor voltage is about to drop below the operating threshold of 2.04 V. During all other times, the charging circuit remains in a disabled state. This strategy effectively reduces the current consumption from 10 mA to as low as 8.6 µA, as reflected in Table 6 and Figure 13 and Figure 14. The solar energy measurement results of the sub-node show the measurement results of the solar charging system for one month. The red line represents the battery voltage, while the blue line represents the solar panel voltage. Each node is scheduled to perform recognition tasks at 7 a.m. and 8 p.m. every day. Results from day 1 to day 14 show that the optimal charging efficiency is achieved between 10 a.m. and 2 p.m. The power consumption of the master node and the sub-node for one day can be fully charged within 1 h. From day 14 to day 18, because of the influence of a typhoon, the nodes were moved indoors. Without charging during these 4 days, the voltage of the master node dropped to 7.8V, and the voltage of the sub-node dropped to 7.93 V. After redeploying the nodes outdoors on the evening of day 18, the master node battery was fully recharged by the morning of day 20, and the sub-node by the morning of day 21. From day 21 to day 36, the system operated stably. On day 28, due to overcast weather, solar irradiance was suboptimal, resulting in a lower solar panel voltage. However, the system was still able to replenish the energy consumed that day. The experimental results verify that the system can operate for up to seven days without sunlight, as originally designed. Under local sunlight conditions, the two nodes required approximately 2 and 3 days, respectively, to reach full charge. This demonstrates that the power system remains operational without recharging for up to seven days, regardless of weather variability, confirming its feasibility and reliability for long-term deployment. Based on the estimation method described in [35], the system’s charge–discharge range of 3.6 V to 4.2 V yields approximately 2500 cycles, corresponding to an estimated service life of approximately 6.8 years. Meanwhile, the integrated supercapacitor, with its capacity to withstand up to one million cycles, significantly contributes to the long-term durability of the system.

3.7. Comparison with Similar Systems

A similar pest image monitoring system [33] also set up pest sensing nodes on farmland to monitor pest densities, as shown in Table 7. The pests monitored are mainly pests such as mango leafhoppers. Its image recognition F1-score is 0.96. In the energy storage system, by using a timer relay module, a 12 V 30 A solar charge controller, an 18 V 100 W solar panel, and a 12 V 26 A·h lead acid battery, it is possible to maintain system operation for at least 7 days. The construction cost of a single node is about USD 100. Compared with the system for striped flea beetles in this article, the F1-score of the image recognition model is 0.92, and the construction cost of a single node is about USD 50. With similar performance, this system can reduce the cost by half and is more friendly to farmers.

4. Conclusions

The energy management strategy proposed in this study is applied to an AI-based pest image recognition system that integrates AI and the IoT. By using YOLOv5 for image recognition and generating images through StyleGAN3 to achieve data augmentation, the accuracy of recognizing striped flea beetles on yellow sticky traps can reach 85.4%. The solar charging system uses batteries and supercapacitors for energy storage, allowing the recognition nodes to operate outdoors for a long time. With the implementation of the proposed system, farmers no longer need to count insect traps manually to obtain information on pest distribution and density. Moreover, this system can also provide information with which the drone system can automatically plan pesticide spraying tasks. The experimental results show that pest recognition and solar power systems are feasible and effective solutions with which to accomplish smart agriculture [43]. By utilizing precision pesticide spraying, the amount of applied pesticide can be reduced by 30–50%, resulting in a decrease of up to 56.16% in crop production costs. In subsequent work, we will compare the effectiveness of traditional manual methods and the application of this system. Additionally, pest counting needs to be able to overcome the limitations of environmental changes, which may involve glare, dirt, and raindrops. This is a major problem in pest counting. The accuracy of the current system is affected by this, and this can be improved in the future.

Author Contributions

C.-W.H., C.-C.W. and C.-L.L. initiated and conceptualized the study. Methodological development was carried out by C.-W.H., Z.-J.L. and Y.-H.S., while Z.-J.L. and Y.-H.S. were responsible for programming and software implementation. The manuscript was drafted collaboratively by Z.-J.L., Y.-H.S. and C.-L.L.; C.-W.H. and C.-L.L. provided critical revisions and intellectual input to improve the manuscript. Data analysis and interpretation were conducted by C.-C.W., Z.-J.L. and Y.-H.S. Verification of the results and the overall integrity of the work were ensured by C.-W.H., C.-C.W. and C.-L.L. All authors have read and agreed to the published version of the manuscript.

Funding

This research received no external funding.

Data Availability Statement

The data presented in this study are available in this article.

Acknowledgments

This study was partly supported by the National Science and Technology Council, Taiwan, under Contract NSTC 113-2221-E-224-037, 113-2622-E-224-017, and IRIS “Intelligent Recognition Industry Service Research Center” from The Featured Areas Research Center Program within the framework of the Higher Education Sprout Project by the Ministry of Education (MOE) in Taiwan.

Conflicts of Interest

The authors declare no conflicts of interest.

References

  1. Chen, W.; Zhang, H. Ecological Harm Habits and Control of Striped Flea Beetle. Tainan District Agricultural Research and Extension Station Technical; Issue 86-3 (No.69). 1997. Available online: https://book.tndais.gov.tw/Brochure/tech69.htm (accessed on 2 June 2024).
  2. Desislavov, R.; Martínez-Plumed, F.; Hernández-Orallo, J. Trends in AI inference energy consumption: Beyond the performance-vs-parameter laws of deep learning. In Sustainable Computing: Informatics and Systems; Elsevier: Amsterdam, The Netherlands, 2023; Volume 38, p. 100857. [Google Scholar]
  3. Zhu, S.; Ota, K.; Dong, M. Energy-efficient artificial intelligence of things with intelligent edge. IEEE Internet Things J. 2022, 9, 7525–7532. [Google Scholar] [CrossRef]
  4. Aliakbarpour, H.; Rawi, C.S.M. Evaluation of yellow sticky traps for monitoring the population of thrips (Thysanoptera) in a mango orchard. Environ. Entomol. 2011, 40, 873–879. [Google Scholar] [CrossRef] [PubMed]
  5. Bashir, M.A.; Alvi, A.M.; Naz, H. Effectiveness of sticky traps in monitoring insects. J. Environ. Agric. Sci. 2014, 1, 1–2. [Google Scholar]
  6. Devi, M.S.; Roy, K. Comparable study on different coloured sticky traps for catching of onion thrips, Thrips tabaci Lindeman. J. Entomol. Zool. Stud. 2017, 5, 669–671. [Google Scholar]
  7. Qiao, M.; Lim, J.; Ji, C.W.; Chung, B.K.; Kim, H.Y.; Uhm, K.B.; Myung, C.S.; Cho, J.; Chon, T.S. Density estimation of bemisia tabaci (hemiptera: Aleyrodidae) in a greenhouse using sticky traps in conjunction with an image processing system. J. Asia-Pac. Entomol. 2008, 11, 25–29. [Google Scholar] [CrossRef]
  8. Xia, C.; Chon, T.S.; Ren, Z.; Lee, J.M. Automatic identification and counting of small size pests in greenhouse conditions with low computational cost. Ecol. Inform. 2015, 29, 139–146. [Google Scholar] [CrossRef]
  9. Cho, J.; Choi, J.; Qiao, M.; Ji, C.-W.; Kim, H.-Y.; Uhm, K.-B.; Chon, T.-S. Automatic identification of whiteflies aphids thrips in greenhouse based on image analysis. Int. J. Math. Comput. Simul. 2007, 1, 46–53. [Google Scholar]
  10. Chen, J.; Fan, Y.; Wang, T.; Zhang, C.; Qiu, Z.; He, Y. Automatic segmentation and counting of aphid nymphs on leaves using convolutional neural networks. Agronomy 2018, 8, 129. [Google Scholar] [CrossRef]
  11. Li, Y.; Wang, H.; Dang, L.M.; Sadeghi-Niaraki, A.; Moon, H. Crop pest recognition in natural scenes using convolutional neural networks. Comput. Electron. Agric. 2020, 169, 105174. [Google Scholar] [CrossRef]
  12. Valan, M.; Makonyi, K.; Maki, A.; Vondracek, D.; Ronquist, F. Automated Taxonomic Identification of Insects with Expert-Level Accuracy Using Effective Feature Transfer from Convolutional Networks. Syst. Biol. 2019, 68, 876–895. [Google Scholar] [CrossRef]
  13. Wang, R.; Zhang, J.; Dong, W.; Yu, J.; Xie, C.; Li, R.; Chen, T.; Chen, H. A crop pests image classification algorithm based on deep convolutional neural network. TELKOMNIKA (Telecommun. Comput. Electron. Control.) 2017, 15, 1239–1246. [Google Scholar] [CrossRef]
  14. Li, W.; Wang, D.; Li, M.; Gao, Y.; Wu, J.; Yang, X. Field detection of tiny pests from sticky trap images using deep learning in agricultural greenhouse. Comput. Electron. Agric. 2021, 183, 106048. [Google Scholar] [CrossRef]
  15. Karar, M.E.; Alsunaydi, F.; Albusaymi, S.; Alotaibi, S. A new mobile application of agricultural pests recognition using deep learning in cloud computing system. Alex. Eng J. 2021, 60, 4423–4432. [Google Scholar] [CrossRef]
  16. Kusrini, K.; Suputa, S.; Setyanto, A.; Agastya, I.M.A.; Priantoro, H.; Chandramouli, K.; Izquierdo, E. Data augmentation for automated pest classification in Mango farms. In Computers and Electronics in Agriculture; Elsevier: Amsterdam, The Netherlands, 2020; Volume 179, p. 105842. [Google Scholar] [CrossRef]
  17. Redmon, J.; Divvala, S.; Girshick, R.; Farhadi, A. You only look once: Unified, real-time object detection. In Proceedings of the IEEE Conference on Computer Vision and Pattern Recognition, Las Vegas, NV, USA, 27–30 June 2016; pp. 779–788. [Google Scholar]
  18. Önler, E. Real time pest detection using YOLOv5. Int. J. Agric. Nat. Sci. 2021, 14, 232–246. [Google Scholar]
  19. Ahmad, I.; Yang, Y.; Yue, Y.; Ye, C.; Hassan, M.; Cheng, X.; Wu, Y.; Zhang, Y. Deep Learning Based Detector YOLOv5 for Identifying Insect Pests. Appl. Sci. 2022, 12, 10167. [Google Scholar] [CrossRef]
  20. Gandhi, R.; Nimbalkar, S.; Yelamanchili, N.; Ponkshe, S. Plant disease detection using CNNs and GANs as an augmentative approach. In Proceedings of the 2018 IEEE International Conference on Innovative Research and Development (ICIRD), Bangkok, Thailand, 11–12 May 2018; pp. 1–5. [Google Scholar]
  21. Ma, D.; Liu, J.; Fang, H.; Wang, N.; Zhang, C.; Li, Z.; Dong, J. A multi-defect detection system for sewer pipelines based on StyleGAN-SDM and fusion CNN. Constr. Build. Mater. 2021, 312, 125385. [Google Scholar] [CrossRef]
  22. Khanzhina, N.; Filchenkov, A.; Minaeva, N.; Novoselova, L.; Petukhov, M.; Kharisova, I.; Pinaeva, J.; Zamorin, G.; Putin, E.; Zamyatina, E.; et al. Combating data incompetence in pollen images detection and classification for pollinosis prevention. Comput. Biol. Med. 2022, 140, 105064. [Google Scholar] [CrossRef]
  23. Cap, Q.H.; Uga, H.; Kagiwada, S.; Iyatomi, H. LeafGAN: An Effective Data Augmentation Method for Practical Plant Disease Diagnosis. IEEE Trans. Autom. Sci. Eng. 2020, 19, 1258–1267. [Google Scholar] [CrossRef]
  24. Muangprathub, J.; Boonnam, N.; Kajornkasirat, S.; Lekbangpong, N.; Wanichsombat, A.; Nillaor, P. IoT and agriculture data analysis for smart farm. Comput. Electron. Agric. 2019, 156, 467–474. [Google Scholar] [CrossRef]
  25. Barkunan, S.R.; Bhanumathi, V.; Sethuram, J. Smart sensor for automatic drip irrigation system for paddy cultivation. Comput. Electr. Eng. 2019, 73, 180–193. [Google Scholar] [CrossRef]
  26. Mohanraj, I.; Ashokumar, K.; Naren, J. Field monitoring and automation using IOT in agriculture domain. Procedia Comput. Sci. 2016, 93, 931–939. [Google Scholar] [CrossRef]
  27. Blessy, A.; Kumar, A.; Md, A.Q.; Alharbi, A.I.; Almusharraf, A.; Khan, S.B. Sustainable Irrigation Requirement Prediction Using Internet of Things and Transfer Learning. Sustainability 2023, 15, 8260. [Google Scholar] [CrossRef]
  28. Kaur, G.; Upadhyaya, P.; Chawla, P. Comparative analysis of IoT-based controlled environment and uncontrolled environment plant growth monitoring system for hydroponic indoor vertical farm. Environ. Res. 2023, 222, 115313. [Google Scholar] [CrossRef] [PubMed]
  29. Vianny, D.M.M.; John, A.; Mohan, S.K.; Sarlan, A.; Ahmadian, A. Water optimization technique for precision irrigation system using IoT and machine learning. Sustain. Energy Technol. Assess. 2022, 52, 102307. [Google Scholar]
  30. Debnath, O.; Saha, H.N. An IoT-based intelligent farming using CNN for early disease detection in rice paddy. Microprocess. Microsyst. 2022, 94, 104631. [Google Scholar] [CrossRef]
  31. Pessl Instruments. iSCOUT. 2021. Available online: https://metos.at/iscout/ (accessed on 1 November 2021).
  32. Trapview. 2021. Available online: https://trapview.com/ (accessed on 2 June 2024).
  33. Rustia, D.J.A.; Lee, W.-C.; Lu, C.-Y.; Wu, Y.-F.; Shih, P.-Y.; Chen, S.-K.; Chung, J.-Y.; Lin, T.-T. Edge-based wireless imaging system for continuous monitoring of insect pests in a remote outdoor mango orchard. Comput. Electron. Agric. 2023, 211, 108019. [Google Scholar] [CrossRef]
  34. LG Chem. ICR18650HB4 1500mAh Lithium-Ion Battery Product Specification; Document No. BCY-PS-HB4-Rev6; LG Chem: Seoul, Republic of Korea, 2016; BatteryUniversity.com; Available online: https://queenbattery.com.cn/index.php?controller=attachment&id_attachment=97 (accessed on 2 June 2024).
  35. Battery University. BU-808: How to Prolong Lithium-Based Batteries. BatteryUniversity.com. Available online: https://batteryuniversity.com/article/bu-808-how-to-prolong-lithium-based-batteries (accessed on 2 July 2025).
  36. Glenn, J.; Stoken, A.; Borovec, J.; Changyu, L.; Hogan, A.; Diaconu, L.; Adam, H.; Trevor, S.; Wang, X.; Pritu, D.; et al. Ultralytics/yolov5, 3rd ed.; Zenodo: Geneva, Switzerland, 2020. [Google Scholar]
  37. Karras, T.; Aittala, M.; Laine, S.; Härkönen, E.; Hellsten, J.; Lehtinen, J.; Aila, T. Alias-free generative adversarial networks. Adv. Neural Inf. Process. Syst. 2021, 34, 852–863. [Google Scholar]
  38. Karras, T.; Laine, S.; Aila, T. A style-based generator architecture for generative adversarial networks. In Proceedings of the IEEE/CVF Conference on Computer Vision and Pattern Recognition, Long Beach, CA, USA, 16–20 June 2019; pp. 4401–4410. [Google Scholar]
  39. Ding, W.; Taylor, G. Automatic moth detection from trap images for pest management. Comput. Electron. Agric. 2016, 123 (Suppl. C), 17–28. [Google Scholar] [CrossRef]
  40. Tan, M.X.; Pang, R.; Le, Q.V. Efficientdet: Scalable and efficient object detection. In Proceedings of the IEEE/CVF Conference on Computer Vision and Pattern Recognition, Seattle, WA, USA, 13–19 June 2020. [Google Scholar]
  41. Chen, H.-W.; Lo, J.-Y. Chiayi City Solar Photovoltaic Development Overview; Chiayi City Government: Jiaxuan City, Taiwan, 2019. Available online: https://icmp-ws.chiayi.gov.tw/Download.ashx?u=LzAwMS9VcGxvYWQvNDAxL3JlbGZpbGUvOTA0My80MDIxODAvYzA3Mjk3ZWUtOWQ0Mi00NDI5LWE1Y2ItNTE2NDVhYTM3MDk5LnBkZg (accessed on 2 June 2024).
  42. Liu, C.; Zhai, Z.; Zhang, R.; Bai, J.; Zhang, M. Field pest monitoring and forecasting system for pest control. Front. Plant Sci. 2022, 13, 990965. [Google Scholar] [CrossRef]
  43. Zanin, A.R.A.; Neves, D.C.; Teodoro, L.P.R.; da Silva Júnior, C.A.; da Silva, S.P.; Teodoro, P.E.; Baio, F.H.R. Reduction of pesticide application via real-time precision spraying. Sci. Rep. 2022, 12, 5638. [Google Scholar] [CrossRef]
Figure 1. System architecture. The identification node is powered by solar energy to perform image shooting and identification. A master node is adopted as the central hub to establish network connections with sub-nodes and transmit the results back to a server. Nodes will be placed at fixed intervals in the farmland to obtain the pest density in each area.
Electronics 14 02927 g001
Figure 2. Circuit architecture.
Electronics 14 02927 g002
Figure 3. Power management strategy flowchart.
Electronics 14 02927 g003
Figure 4. Data acquisition.
Electronics 14 02927 g004
Figure 5. Hardware diagram.
Electronics 14 02927 g005
Figure 6. Node workflow.
Electronics 14 02927 g006
Figure 7. Network structure of YOLOv5.
Electronics 14 02927 g007
Figure 8. Network structure of StyleGAN3.
Electronics 14 02927 g008
Figure 9. Performance under different dataset conditions. (a) Initial stage of training; (b) after 2000kimg of training; (c) real image.
Electronics 14 02927 g009
Figure 10. Pest image recognition results.
Electronics 14 02927 g010
Figure 11. Performance under different lighting conditions: (a) ring light at night; (b) high contrast caused by sunlight.
Electronics 14 02927 g011
Figure 12. System deployment diagram showing the outdoor testing setup.
Electronics 14 02927 g012
Figure 13. Solar energy measurement result of the master node.
Electronics 14 02927 g013
Figure 14. Solar energy measurement result of the sub-node.
Electronics 14 02927 g014
Table 1. Training parameters.
Parameter
OptimizerSGD
Learning rate momentum0.937
Initial learning rate0.01
Weight decay0.0005
Input image resolution3280 × 2464 pixels
Batch size4
Number of iterations500
Table 2. Comparison of recognition accuracy.
DatasetACCRPF1-Score
Original0.7830.8460.9130.878
Original + 2000 32 × 32 pixel image0.8180.8680.9340.899
Original + 2000 16 × 16 pixel image0.8460.8970.9360.916
Original + 2000 32 × 32 pixel image
+ 2000 16 × 16 pixel image
0.85640.9080.9390.923
Table 3. Comparison of the accuracy of different models.
DatasetACCRPF1-ScoreModel Size
YOLOv5n0.7830.8460.9130.8786.3 MB
YOLOv5n + generated images0.8560.9080.9390.9236.3 MB
YOLOv7tiny0.8610.9210.9290.92412.5 MB
YOLOv7tiny + generated images0.8440.8880.9450.91512.5 MB
YOLOv8n0.7300.7720.9290.8436.6 MB
YOLOv8n + generated images0.7880.8310.9380.8816.6 MB
Table 4. Comparison of the running speeds of each model on Raspberry Pi.
ModelTimeModel Size
YOLOv5n3 min 30 s6.3 MB
YOLOv7tiny7 min 49 s12.5 MB
YOLOv8n15 min 34 s6.6 MB
Table 5. Recognition accuracy.
DatasetACCRP
Figure 9a0.820.910.89
Figure 9b0.350.390.78
Table 6. Current consumption at each work stage.
Work StageOperating TimeCurrent
Time synchronization stage26 s288,640 μA
Recognition stage839 s133,020 μA
Supercapacitor charging stage210 s95,824 μA
MCU sleep stage85,325 s8.6 μA
Power Consumption0.194 Wh
MCU sleep stage
(without supercapacitors)
85,325 s10 mA
Power Consumption1.378 Wh
Table 7. Comparison with similar systems.
FeatureThis StudyMango Orchard Pest Monitoring [33]Cotton Field Pest Monitoring [42]
Target PestStriped flea beetlesMango leafhoppersCotton pest
ModelYolov5nYolov3SM_ResNet V2
Recognition Accuracy0.920.960.85
Power Consumption0.194 WH0.8 WHN/A
Node Cost (USD)50~100~400
Disclaimer/Publisher’s Note: The statements, opinions and data contained in all publications are solely those of the individual author(s) and contributor(s) and not of MDPI and/or the editor(s). MDPI and/or the editor(s) disclaim responsibility for any injury to people or property resulting from any ideas, methods, instructions or products referred to in the content.

