Article

Time-Division Subbands Beta Distribution Random Space Vector Pulse Width Modulation Method for the High-Frequency Harmonic Dispersion

1
Institute of Acoustics, Chinese Academy of Sciences, Beijing 100190, China
2
University of Chinese Academy of Sciences, Beijing 100049, China
*
Author to whom correspondence should be addressed.
Electronics 2025, 14(14), 2852; https://doi.org/10.3390/electronics14142852
Submission received: 6 June 2025 / Revised: 9 July 2025 / Accepted: 15 July 2025 / Published: 16 July 2025
(This article belongs to the Section Power Electronics)

Abstract

Conventional space vector pulse width modulation (CSVPWM) with the fixed switching frequency generates significant sideband harmonics in the three-phase voltage. Discrete random switching frequency SVPWM (DRSF-SVPWM) methods have been widely applied in motor control systems for the suppression of tone harmonic energy. To further reduce the amplitude of the high-frequency harmonic with a limited switching frequency variation range, this paper proposes a time-division subbands beta distribution random SVPWM (TSBDR-SVPWM) method. The overall frequency band of the switching frequency is equally divided into N subbands, and each fundamental cycle of the line voltage is segmented into 2*(N-1) equal time intervals. Additionally, within each time segment, the switching frequency is randomly selected from the corresponding subband and follows the optimal discrete beta distribution. The switching frequency harmonic energy in the line voltage spectrum spreads across multiple frequency subbands and discrete frequency components, thereby forming a more uniform power spectrum of the line voltage. Both simulation and experimental results validate that, compared with CSVPWM, the sideband harmonic amplitude is reduced by more than 8.5 dB across the entire range of speed and torque conditions in the TSBDR-SVPWM. Furthermore, with the same variation range of the switching frequency, the proposed method achieves the lowest switching frequency harmonic amplitude and flattest line voltage spectrum compared with several state-of-the-art random modulation methods.

1. Introduction

With the rapid development of new energy vehicles, there has been considerable research and attention on high-performance motors and their control systems. With the application of rare-earth materials and variable-frequency drives, permanent magnet synchronous motors (PMSMs) have been dominant in the drive motor market, due to their high power density, efficiency, and rotation speed [1,2]. It can be inferred that for the electromagnetic interference (EMI) and noise, vibration, and harshness (NVH) of PMSM, the noise harmonic energy is concentrated near the switching frequency and its integer multiples [3]. This is because the widely used two-level three-phase voltage source inverter (VSI) converts DC into AC through the high-frequency on and off switching of power semiconductor devices. Conventional space vector pulse width modulation (CSVPWM) with a fixed switching frequency generates significant sideband harmonics in the output three-phase current. The interaction between the magnetic field produced by the stator current harmonic and the permanent magnet field plays a leading role in generating sideband electromagnetic force [4,5]. Considering the lifespan of power semiconductor devices in VSIs, the switching frequency is generally set in the range of 5 kHz to 16 kHz, resulting in EMI and piercing tone noise [6,7,8].
To solve this problem, several vector control methods have been proposed to suppress sideband noise. Cheng et al. derived an analytical formula of the current harmonic near the switching frequency and its integer multiples in the SVPWM method [9]. Experimental results demonstrated that the current harmonic amplitude near the switching frequency will decrease when the switching frequency increases, the motor speed decreases, and the load torque decreases. Additionally, it has been shown that the impact of load torque on the sideband harmonic is less significant than that of motor speed. Huang et al. and Wang et al. proposed new switching state sequences to synthesize the desired voltage vector based on CSVPWM [10,11]. The method proposed in [10] effectively suppresses the noise harmonic at odd multiples of the switching frequency for VSI. The method proposed in [11] achieves harmonic spreading of motor vibration acceleration by random selection of two proposed switching state sequences for dual three-phase PMSMs. However, both methods increase the switching frequency, leading to higher switching losses.
Within the range supported by power semiconductor devices, the variable switching frequency SVPWM (VSF-SVPWM) can also reduce the peak amplitude of the sideband harmonic. The efficiency of the inverter remains unchanged in the VSF-SVPWM because the average switching frequency of the VSF-SVPWM is equal to that of the CSVPWM. According to the variation pattern of the switching frequency, the VSF-SVPWM can be classified into the periodic switching frequency SVPWM (PSF-SVPWM) and random switching frequency SVPWM (RSF-SVPWM). Liu et al. established the relationship between the variation range of the periodic switching frequency and the harmonic diffusion effect [12]. Huang et al. and Zheng et al. further proposed a staggered three-phase switching frequency based on the PSF-SVPWM, achieving an effective suppression effect of sideband current harmonic [13,14]. However, the impact of these methods on motor performance has not been investigated. Ji et al. applied a multiple population genetic algorithm to optimize the periodic switching frequency sequence [15]. In the method, an inverse proportional relationship was established between the zero-order electromagnetic force and vibration frequency response function (VFRF) of the PMSM within the local frequency band, effectively reducing the harmonic peak value of vibration acceleration. Furthermore, the experimental results indicated that the distribution of switching frequency shifts toward the lower limit of the local frequency band. Consequently, both the vibration acceleration level (VAL) and average switching frequency decreased, which is beneficial for reducing the switching loss of the inverter. However, the major sideband harmonic frequency of the current is equal to the switching frequency plus or minus even multiples of the fundamental frequency, and the variation in the fundamental frequency leads to a change in the sideband electromagnetic force distribution. Therefore, this method is applicable only for PMSMs operated at a constant rotation speed.
For RSF-SVPWM, Xu et al. proposed a double frequency-band RSF-SVPWM method to achieve sideband harmonic dispersion even when the allowable range of the switching frequency is small [16]. However, due to the inverter’s load being a star-connected three-phase RLC circuit, the impact of this method on motor control needs further experimental investigations. Zhao et al. combined RSF-SVPWM with a modified variable delay time control method, effectively suppressing vibration harmonics of PMSMs near the switching frequency and its integer multiples [17]. The experimental results revealed that the spectrum dispersion method increased harmonic energy at other frequencies. Peyghambari et al., Li et al., and Wen et al. proposed various selective harmonic elimination methods based on RSF-SVPWM [18,19,20,21]. These methods suppressed the switching frequency harmonic and created a spectrum gap of the voltage and current at the motor’s resonant frequency, thereby reducing resonance noise. Wang et al. proposed a beta distribution DRSF-SVPWM (BD-DRSF-SVPWM) method [22]. Simulation and experimental results demonstrated that the beta distribution of the switching frequency, compared to the uniform distribution, achieved better sideband harmonic diffusion. In our recent work, an optimization method for the switching frequency distribution was proposed [23]. It has been theoretically verified that the optimal distribution for reducing harmonic peak value is the beta distribution with the shape parameters (a = b) ∧ (b < 1), which are defined by Equation (7) in this article. Furthermore, simulation and experimental results were conducted to investigate the impact of the number of discrete switching frequencies and shape parameters of the beta distribution on harmonic dispersion performance. In summary, existing RSF-SVPWM methods ignore the influence of splitting the overall variation range of the RSF into multiple subbands and the distribution followed by the RSF on the sideband harmonic, total harmonic distortion (THD), inverter efficiency, and PMSM control performance. Therefore, there are still a number of gaps in the existing methods of sufficiently spreading the harmonic energy concentrated at the switching frequency.
This paper proposes a time-division subbands beta distribution random SVPWM (TSBDR-SVPWM) method to further optimize the harmonic diffusion effect near the switching frequency. The entire switching frequency variation range is evenly divided into N subbands, and the discrete switching frequency is randomly selected from different subbands based on the beta distribution. The variance in the harmonic amplitude near the switching frequency is used to quantitatively evaluate the harmonic diffusion effect. Simulation results validate that, within the same switching frequency variation range, the proposed method obtains the lowest sideband harmonic amplitude and variance values in the line voltage spectrum compared to other representative SVPWM methods. Experiments are conducted in a field-oriented control (FOC) system of a surface PMSM (SPMSM). Experimental results of the line voltage spectra are consistent with the theoretical and simulation results, verifying the effectiveness of the proposed TSBDR-SVPWM.

2. Proposed TSBDR-SVPWM Method to Improve the Harmonic Spreading Effect

As shown in Figure 1, the two-level three-phase VSI consists of one pair of power semiconductor switching devices (Insulated Gate Bipolar Transistors (IGBTs), Si MOSFETs, or SiC MOSFETs) in each phase, located in the upper and lower arms of the bridge circuit. The inverter has a total of eight switching states determined by the on/off combinations of these switching devices. These eight circuit states correspond to the eight basic voltage vectors, which include two zero vectors, U0 and U7, and six active vectors, U1, U2, …, and U6, utilized in SVPWM. In practical applications, the switching frequency fs of power semiconductor devices in inverters is constrained within a defined range:
fs min ≤ fs ≤ fs max
The entire variation range of fs is equally divided into N subbands, and the bandwidth Δf of each subband is given by
Δ f = f s max f s min N
The range of the i-th subband switching frequency fs(i) can be derived as
f s min + ( i 1 ) × Δ f f s ( i ) f s min + i × Δ f ,   i = 1 , 2 , , N
In this i-th subband, the switching frequency fs(i) is treated as a discrete random variable. Consequently, the continuous switching frequency variation range needs to be discretized into a finite sequence, which is defined by
f s ( i ) ( 1 ) , f s ( i ) ( 2 ) , , f s ( i ) ( M ) ,   i = 1 , 2 , , N
where M denotes the number of discrete values that the random variable fs(i) can take. These discrete switching frequency values can be calculated by
f s ( i ) ( 1 ) = f s min + ( i 1 ) × Δ f , f s ( i ) ( M ) = f s min + i × Δ f , f s ( i ) ( j ) f s ( i ) ( j 1 ) = f s ( i ) ( M ) f s ( i ) ( 1 ) M 1 = Δ f M 1 ,   j = 2 , 3 , , M
As shown in Figure 2, an interval discretization method is adopted to calculate the probability mass function (PMF) of the fs(i):
P f s ( i ) = f s i ( j ) = j 1 M j M f z d z ,   j 1 , 2 , , M
where f(z) is the probability density function (PDF) of the uniform distribution or beta distribution. The PDF of the beta distribution is given by
f z = 1 0 1 z a 1 1 z b 1 d z z a 1 1 z b 1 , 0 z 1 0 , otherwise
where a and b are the shape parameters. f(z) is the uniform distribution when (a = b) ∧ (b = 1).
Subsequently, a case study is conducted to explain the changing law of the switching frequency in the proposed method in detail. In our previous work [23], it was demonstrated that when the shape parameters of the beta distribution satisfy 0.09 ≤ a = b ≤ 0.21, the harmonic suppression near the switching frequency is significantly more effective than that achieved by other distributions. Therefore, taking (a = b) ∧ (b = 0.15) and M = 9 as an example, fs min and fs max are set to 12 and 16 kHz, respectively. The number of subbands N is set to 4. According to (2), the bandwidth of each subband Δf is equal to 1 kHz. Then, determined by (5), the discrete values of the switching frequency sequence in the first subband can be calculated by
f s ( 1 ) ( 1 ) = 12   kHz + ( 1 1 ) × 1   kHz = 12   kHz , f s ( 1 ) ( 9 ) = 12   kHz + 1 × 1   kHz = 13   kHz , f s ( 1 ) ( j ) f s ( 1 ) ( j 1 ) = 1 kHz 9 1 = 125   Hz ,   j = 2 , 3 , , 9
Similarly, the discrete switching frequency sequences of these four subbands can be written as
12   kHz ,   12 . 125   kHz ,   12 . 250   kHz ,   , 12 . 875   kHz ,   13   kHz , 13   kHz ,   13 . 125   kHz ,   13 . 250   kHz ,   , 13 . 875   kHz ,   14   kHz , 14   kHz ,   14 . 125   kHz ,   14 . 250   kHz ,   , 14 . 875   kHz ,   15   kHz , 15   kHz ,   15 . 125   kHz ,   15 . 250   kHz ,   , 15 . 875   kHz ,   16   kHz
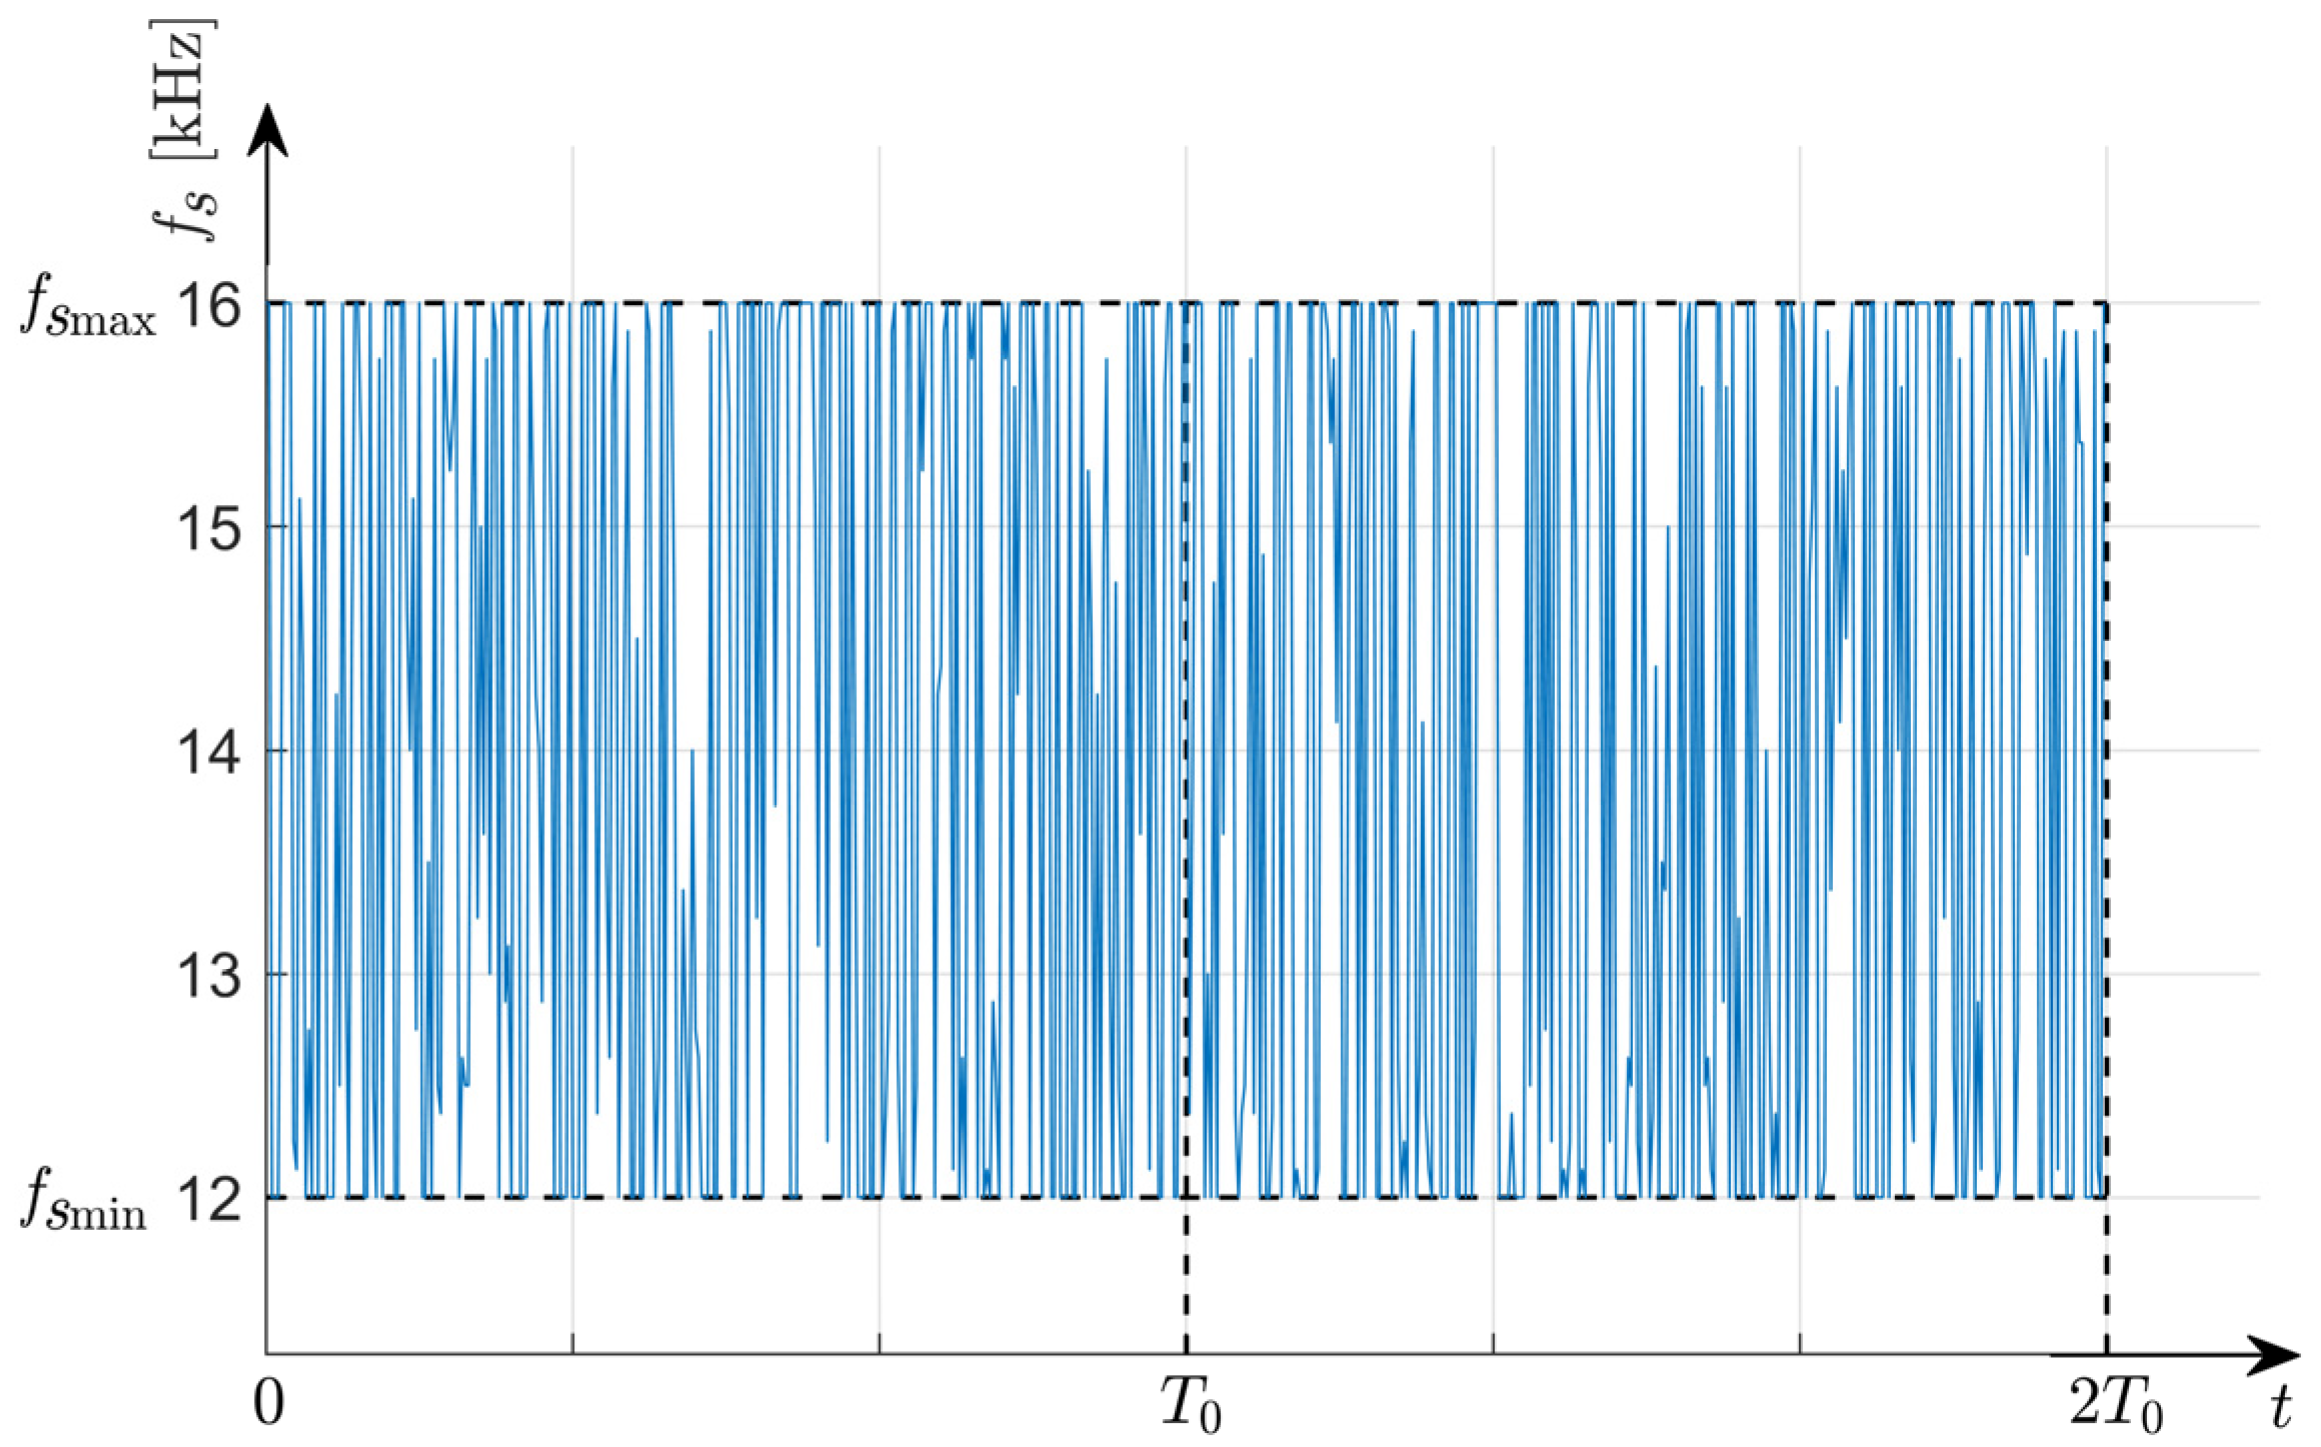
According to (6) and (7), the PMF of the fs(i) in subbands is obtained and shown in Figure 3. In the conventional DRSF-SVPWM methods, which can be regarded as a special case of the proposed method when N = 1, the switching frequency fs is randomly selected from the entire frequency band, as shown in Figure 4. In the proposed TSBDR-SVPWM method, the switching frequency change pattern in the time domain is shown in Figure 5. A fundamental period of the line voltage is equally divided into 2*(N-1) segments. In each time segment, the switching frequency is randomly selected from the corresponding discrete sequence of the subband and follows the discrete beta distribution. Since the switching frequency harmonic energy in the line voltage spectrum is distributed across multiple subbands and discrete frequency components, this method can further reduce the amplitude of the sideband harmonic.

3. Simulation and Experimental Results

To further validate the effectiveness of the proposed method, the SPMSM parameters shown in Table 1 and the FOC closed-loop control system shown in Figure 1 are simulated using MATLAB R2022b. Under the operating conditions of the rotation speed 750 rpm and load torque 0.2 N·m, the fundamental frequency f0 of the line voltage is 50 Hz, and the DC voltage is set to 24 V. In the simulation, the proposed method is compared with three other SVPWM methods, including CSVPWM, uniform distribution DRSF-SVPWM (UD-DRSF-SVPWM), and beta distribution DRSF-SVPWM (BD-DRSF-SVPWM). The variance in the switching frequency harmonic amplitude is used to quantitatively calculate the harmonic suppression effect and can be written as [23]
V a r = 1 P f p = f s min f s max V f p V 0 2 V 0 = 1 P f p = f s min f s max V f p
where fp = p × f0, V(f) is the power spectrum (PS) of the line voltage. The smaller the value of Var, the better the harmonic spreading effect is.
As shown in Figure 6, the switching frequency harmonic amplitude is −11.89 dB in the CSVPWM with a fixed switching frequency of 14 kHz. DRSF-SVPWM (12 kHz ≤ fs ≤ 16 kHz) methods effectively suppress the harmonic peak near the switching frequency. A comparison of Figure 6b,c indicates that the sideband harmonic suppression effect when fs follows a beta distribution is better than that obtained with a uniform distribution. Comparing the BD-DRSF-SVPWM with the CSVPWM, the harmonic amplitude reduces from −11.89 dB to −20.30 dB, while the THD increases from 64.01% to 71.10%. Random selection of the switching frequency over the entire frequency band significantly increases the THD. Figure 6d shows the line voltage of the proposed TSBDR-SVPWM method. The overall variation range of the switching frequency is equal to that in the UD-DRSF-SVPWM and BD-DRSF-SVPWM methods. As in the case study of Section 2, the proposed method divides the frequency range of 12 kHz to 16 kHz into four subbands, and the random switching frequency of the subbands follows a discrete beta distribution. Compared with the BD-DRSF-SVPWM method, TSBDR-SVPWM achieves a better harmonic diffusion effect. The harmonic amplitude and Var reduce by 1.73 dB and 0.0449, respectively. Additionally, the THD of the line voltage spectrum also decreases from 71.10% to 66.36%.
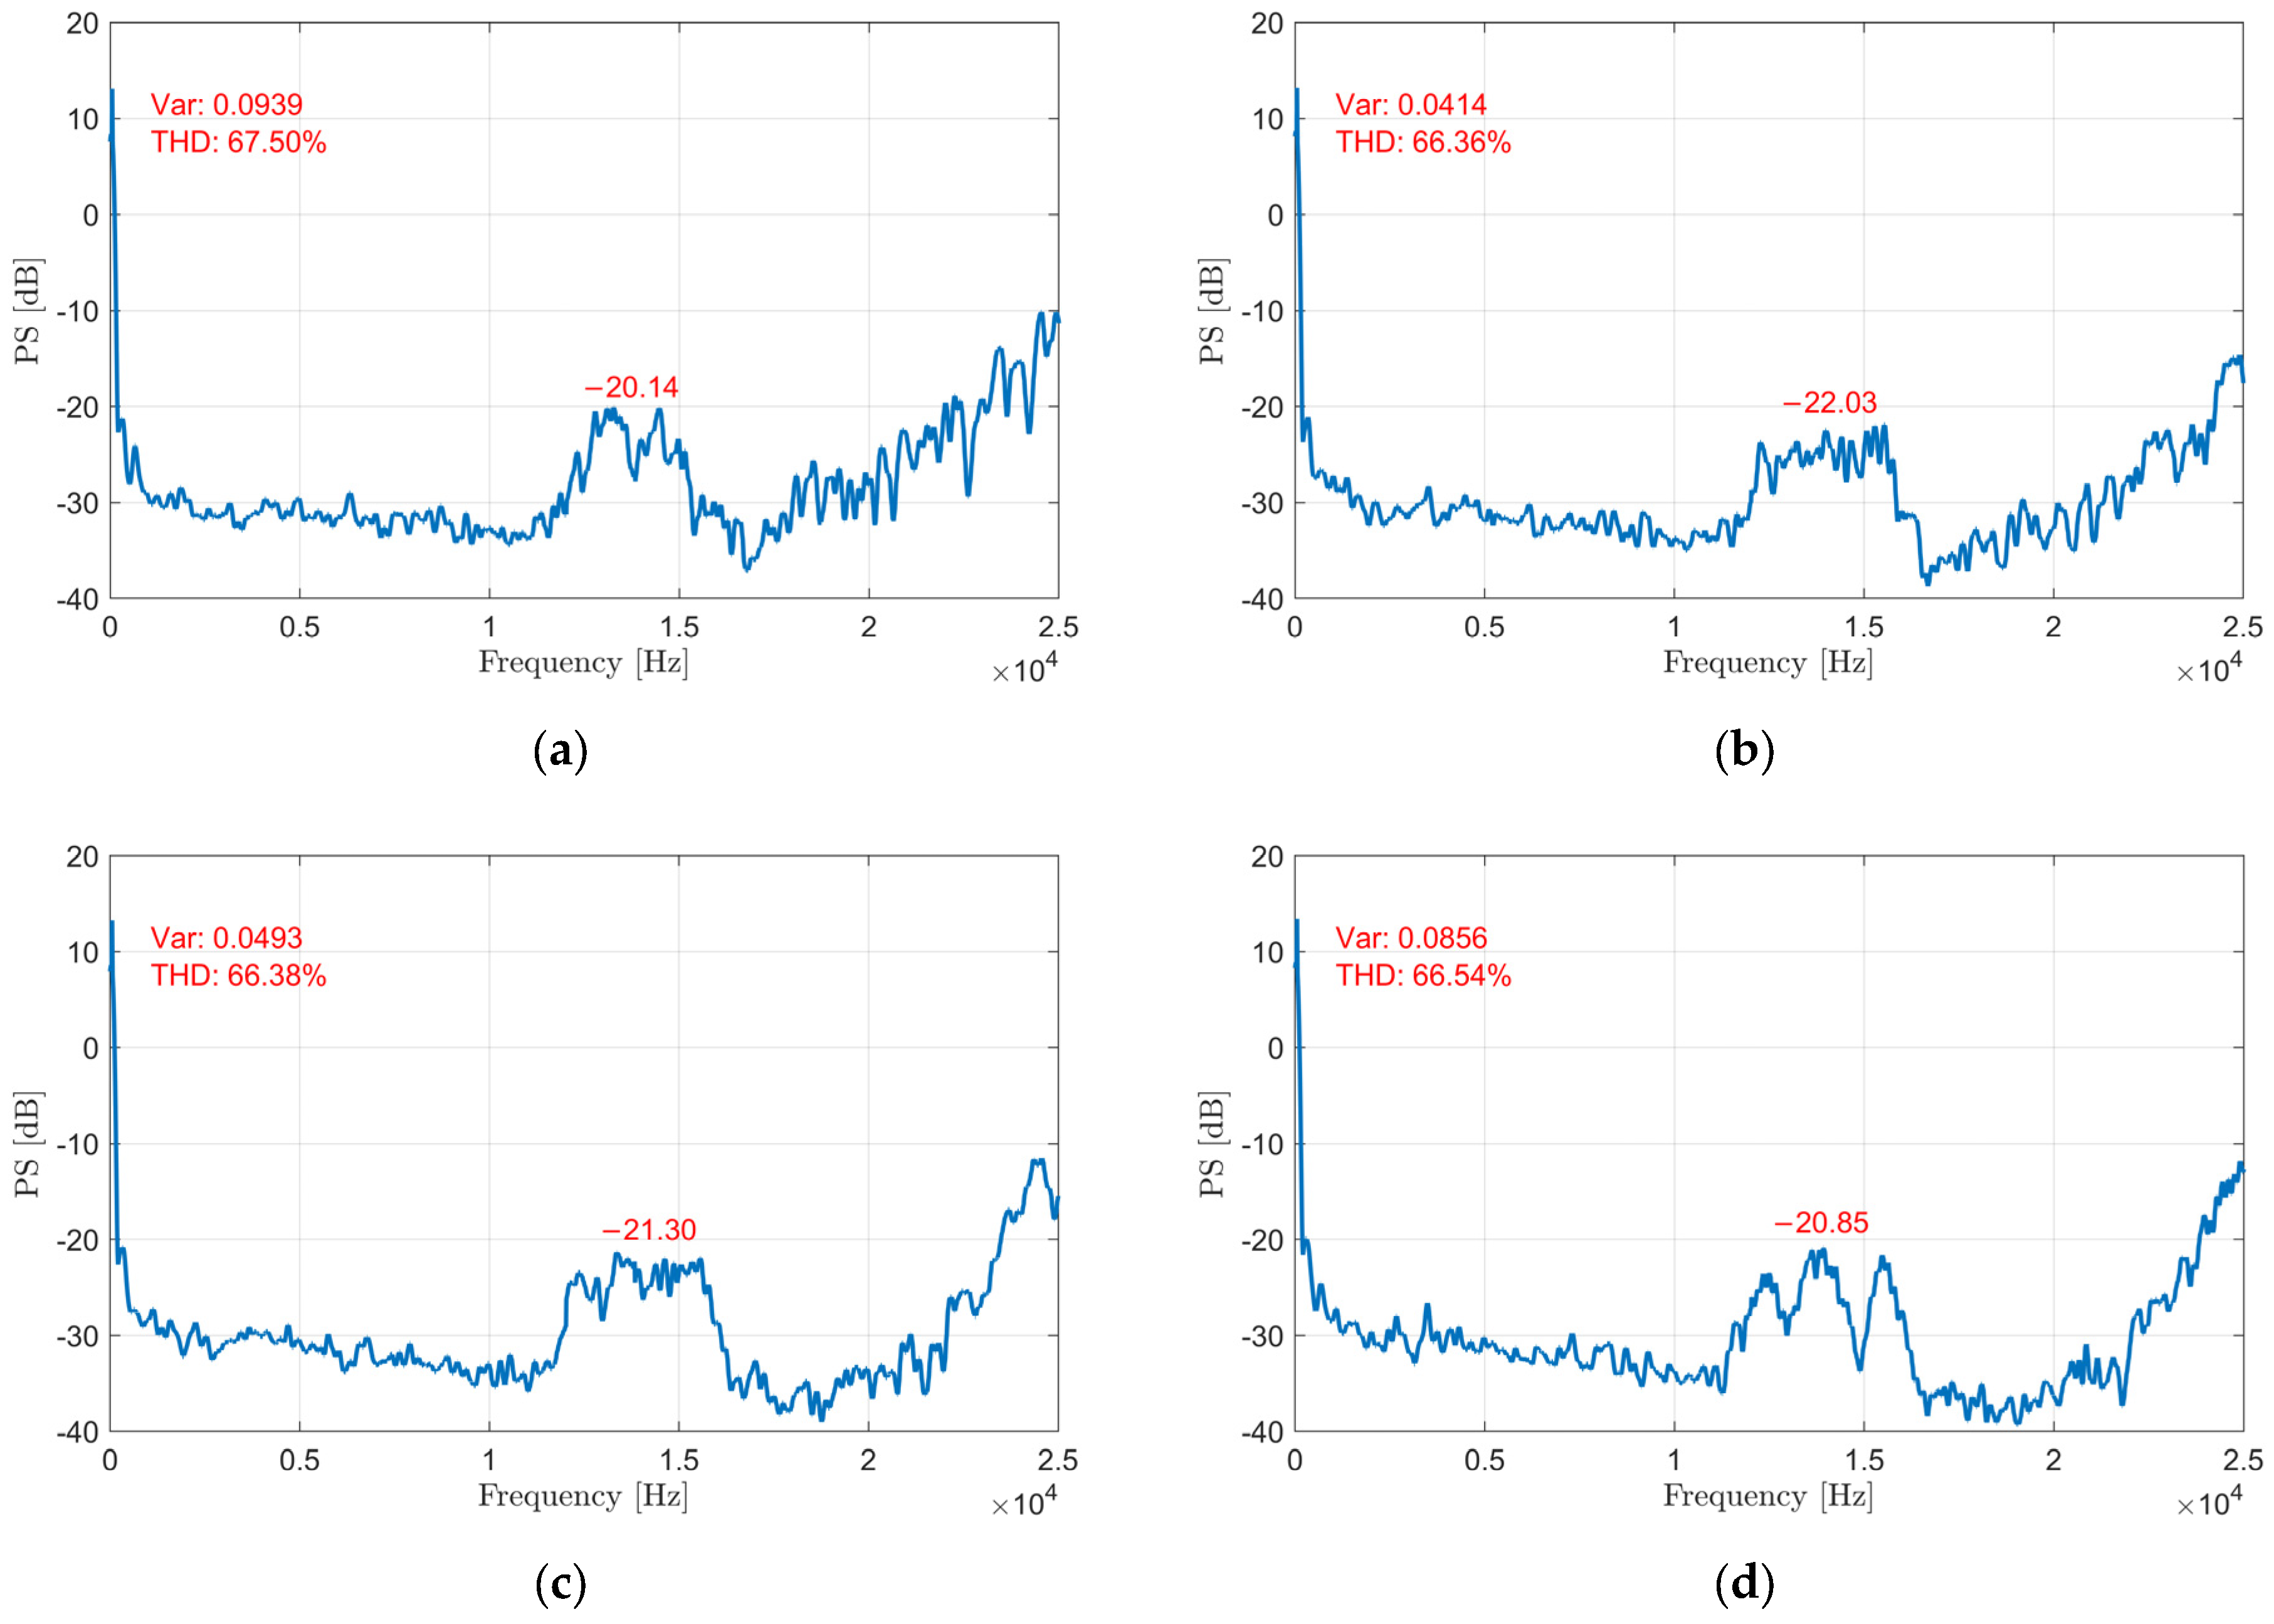
The line voltage spectrum simulation results for the TSBDR-SVPWM method with different subband numbers (N) are shown in Figure 7. It can be seen that the Var and harmonic amplitude exhibit a decrease followed by an increase as the value of N increases. They are both lowest when the number of subbands N is equal to 4. This is because the sideband harmonic energy in the line voltage spectrum diffuses across these multiple frequency bands. However, the bandwidth Δf of each subband decreases as the value of N increases. The overlap of the sideband harmonic energy among these subbands results in a re-increase in the harmonic amplitude. The shape parameters a and b take values from 0.01 to 1.00. Subsequently, the Var of the sideband harmonic in line voltage spectra can be calculated with different shape parameters, as shown in Figure 8. It can be clearly observed that under the operating conditions of the rotation speed 750 rpm and load torque 0.2 N·m, the value of Var attains a local optimum when the beta distribution shape parameters are set to (a = b) ∧ (b = 0.15).
The same system parameters are applied in the FOC experimental system to further substantiate the simulation results. The experimental platform is shown in Figure 9, and the details of the experimental platform are presented in Table 2. The STM32F407 microcontroller unit (MCU) is utilized to implement SVPWM methods and to output three complementary PWM signals to control the inverter’s switching states. N-channel MOSFETs (Infineon IRFS3607 from Neubiberg, Germany) are utilized as power semiconductor switches. The load torque is quantitatively controlled by a magnetic damper (MTB-05). The inverter’s efficiency and loss are measured using a power analyzer (Everfine PF330A), while a digital oscilloscope (Tektronix DPO2024 from Beaverton, OR, USA) is utilized to observe the line voltage in channel 1 (X-axis: 2.5 kHz/Div; Y-axis: 10 dB/Div). A complete block diagram of the experiment control system is shown in Figure 10.
Figure 11 and Figure 12 show experimental results of the line voltage spectra with different SVPWM methods and with different subband numbers N in the TSBDR-SVPWM method, respectively. The spectrum amplitude of the switching frequency harmonic with the proposed TSBDR-SVPWM method is lowest among these methods at −21.88 dB. Comparing Figure 6, Figure 7, Figure 11, and Figure 12, the tolerance of the THD values is within ±0.3% between experimental and simulation results. Furthermore, the calculation error of the Var values is within ±0.004. Therefore, the line voltage spectra measured in the experiment agree well with those obtained from the simulation. Figure 13, Figure 14 and Figure 15 show the line voltage spectra at rotation speeds of 1500 rpm, 2250 rpm, and 3000 rpm, respectively. The amplitude and spectral bandwidth of the sideband harmonic vary with motor speed, resulting in slight differences in the optimal beta distribution shape parameters under different operating conditions. The corresponding optimal shape parameters for these speeds are 0.13, 0.17, and 0.15, respectively. Table 3 shows the sideband harmonic amplitude of the line voltage with different load torques. As the speed and torque increase, the amplitude of all harmonic components in the line voltage increases. Furthermore, compared with other SVPWM methods, the proposed TSBDR-SVPWM still demonstrates the best performance in suppressing switching frequency harmonic across the entire range of speed and torque conditions, achieving a reduction of more than 8.5 dB. It can be further concluded that the proposed TSBDR-SVPWM method achieves the flattest voltage spectrum near the switching frequency.
Whilst the harmonic noise is reduced, we must ensure that the proposed method will not affect the basic performance of the motor control, such as response time and speed waveform. The FOC system enables real-time control of motor speed. As shown in Figure 16, the speed reference of the SPMSM varies within the range of 750 rpm to 3000 rpm, and the measured speed accurately tracks the speed reference with low delay and high stability. This confirms that all these SVPWM methods demonstrate good dynamic and steady-state responses in terms of the rotation speed. Figure 17 shows the torque waveform at a rotation speed of 750 rpm and load torque of 0.2 N·m. The torque ripple in CSVPWM is 2.1%. In both UD-DRSF-SVPWM and BD-DRSF-SVPWM, the torque ripple increases significantly due to the large variation in adjacent switching frequencies, as well as uneven rotor position and current sampling, leading to an increase in THD and low-frequency harmonic amplitude. In contrast, compared with CSVPWM, the torque ripple in the proposed TSBDR-SVPWM increases by only 0.7%. Unlike traditional DRSF-SVPWM methods, the division of the switching frequency range into subbands in TSBDR-SVPWM effectively reduces the variation range of adjacent switching frequencies, thereby reducing both THD and torque ripple.
Subsequently, the inverter efficiency is measured with different SVPWM methods by using the load of a three-phase symmetric star-connected resistance of 20 Ω. The switching loss of the inverter within one fundamental current cycle T0 can be obtained by
P switching   loss = K u d c π 0 π i 2 ω t f s ω t d ω t
where i(ωt) is the current flowing through the power semiconductor, fs(ωt) is the switching frequency, K is the coefficient of switching loss, and udc is the DC voltage [24]. It can be seen that the switching loss Pswitching loss is proportional to the switching frequency. Since the average switching frequency of the proposed TSBDR-SVPWM and other SVPWM methods is 14 kHz, the inverter efficiency remains nearly unchanged when the modulation index is fixed, as shown in Table 4. The comprehensive comparison results are shown in Table 5 and Table 6. Due to the time segment and multi-subbands, the additional timer of MCU resources and subband discrete switching frequency sequences are required in the proposed method, resulting in an increase in static random-access memory (SRAM) usage and central processing unit (CPU) load. Although the implementation is complex, the proposed TSBDR-SVPWM demonstrates that multi-subbands random switching frequency and discrete beta distribution achieve the most uniform harmonic energy distribution without increasing inverter loss, THD, and torque ripple, compared with other existing DRSF-SVPWM methods.

4. Conclusions

Since the switching frequency is fixed in the CSVPWM method, three-phase voltage and current spectra generate tone harmonics near the switching frequency. The broadband frequency spectrum of the BD-DRSF-SVPWM in our recent work achieves the dispersion of the switching frequency harmonic energy. In this paper, TSBDR-SVPWM has been proposed to further reduce the amplitude of the sideband harmonic. The discrete random variable, switching frequency, is selected from different frequency subbands using time-division and follows a beta distribution. Simulation and experimental results are conducted in an FOC system. It can be concluded that, compared with CSVPWM, the switching frequency harmonic amplitude is consistently reduced by more than 8.5 dB even with changes in rotation speeds and load torques. Additionally, compared to other DRSF-SVPWM methods, the proposed method reduces THD and torque ripple significantly and obtains the best sideband harmonic spreading effect with the same overall variation range of switching frequency. Furthermore, the proposed method has no influence on the inverter efficiency due to the same average switching frequency. This study provides a basis for the selection of DRSF-SVPWM methods to suppress the sideband harmonics in the FOC system. Future work will further explore advanced random SVPWM methods to achieve a flat harmonic distribution by improving inverter efficiency and motor performance.

Author Contributions

Conceptualization: J.W.; methodology: J.W.; software: J.W.; validation: J.W.; formal analysis: J.W. and X.C.; writing—original draft preparation: J.W.; writing—review and editing: X.C.; funding acquisition: X.C. All authors have read and agreed to the published version of the manuscript.

Funding

This research was funded by the Strategic Priority Research Program of the Chinese Academy of Sciences, grant number XDC02020400.

Data Availability Statement

The datasets generated during the current study are available from the corresponding author.

Conflicts of Interest

The authors declare no conflicts of interest.

References

  1. Lin, C.; Wang, S.; Moallem, M.; Fahimi, B.; Tschida, C. Analysis of vibration in permanent magnet synchronous machines due to variable speed drives. IEEE Trans. Energy Conv. 2017, 32, 582–590. [Google Scholar] [CrossRef]
  2. Chau, K.T.; Chan, C.C.; Liu, C. Overview of permanent-magnet brushless drives for electric and hybrid electric vehicles. IEEE Trans. Ind. Electron. 2008, 55, 2246–2257. [Google Scholar] [CrossRef]
  3. Deng, W.; Zuo, S. Electromagnetic vibration and noise of the permanent-magnet synchronous motors for electric vehicles: An overview. IEEE Trans. Transp. Electrif. 2019, 5, 59–70. [Google Scholar] [CrossRef]
  4. Deng, W.; Zuo, S. Comparative study of sideband electromagnetic force in internal and external rotor PMSMs with SVPWM technique. IEEE Trans. Ind. Electron. 2019, 66, 956–966. [Google Scholar] [CrossRef]
  5. Deng, W.; Huang, J.; Qian, Z.; Qian, C.; Zhong, D. A random pulse position-based selective noise cancellation modulation method for SVPWM driven PMSMs. IEEE Trans. Energy Convers. 2022, 37, 2190–2198. [Google Scholar] [CrossRef]
  6. Lu, Y.; Li, J.; Yang, K. A hybrid calculation method of electromagnetic vibration for electrical machines considering high-frequency current harmonics. IEEE Trans. Ind. Electron. 2022, 69, 10385–10395. [Google Scholar] [CrossRef]
  7. Xu, Y.; Zhang, W.; Huang, Y.; Zou, J. Reduction method of high-frequency audible PWM noise for three-phase permanent magnet synchronous motors. Energy Rep. 2020, 6, 1123–1129. [Google Scholar] [CrossRef]
  8. Colak, I.; Kabalci, E. Developing a novel sinusoidal pulse width modulation (SPWM) technique to eliminate side band harmonics. Int. J. Electr. Power Energy Syst. 2013, 44, 861–871. [Google Scholar] [CrossRef]
  9. Cheng, Y.; Sun, H.; Wang, Y.; Yang, M.; Ding, L.; Yao, K. SVPWM sideband harmonic analysis in permanent magnet synchronous motor driven by voltage source inverter. In Proceedings of the 26th International Conference on Electrical Machines and Systems (ICEMS), Zhuhai, China, 5–8 November 2023. [Google Scholar]
  10. Huang, Y.; Xu, Y.; Li, Y.; Yang, G.; Zou, J. PWM frequency voltage noise cancelation in three-phase VSI using the novel SVPWM strategy. IEEE Trans. Power Electron. 2018, 33, 8596–8606. [Google Scholar] [CrossRef]
  11. Wang, C.; Zhao, W.; Tao, T.; Yu, Y.; Zhang, X. High frequency harmonics dispersion for dual three-phase PMSM drives with random switching sequence. IEEE Trans. Energy Convers. 2024; early access. [Google Scholar]
  12. Liu, J.; Yao, X.; Liu, H. PWM harmonic cancellation of permanent magnet synchronous motor based on periodic spread spectrum modulation. J. Electr. Eng. Technol. 2023, 19, 2413–2423. [Google Scholar] [CrossRef]
  13. Huang, J.; Li, K. Suppressing the maximum EMI spectral peak through asynchronous carriers in the three-phase inverter with the periodic CFM. IEEE Trans. Power Electron. 2022, 37, 3702–3707. [Google Scholar] [CrossRef]
  14. Zheng, B.; Zou, J.; Xu, Y.; Yu, G.; Wang, L.; Zanchetta, P. High-frequency current harmonic analysis and suppression in dual three-phase PMSMs with advanced carrier phase-shift PWM. IEEE Trans. Power Electron. 2023, 39, 2569–2581. [Google Scholar] [CrossRef]
  15. Ji, Z.; Cheng, S.; Li, X.; Lv, Y.; Wang, D. An optimal periodic carrier frequency PWM scheme for suppressing high-frequency vibrations of permanent magnet synchronous motors. IEEE Trans. Power Electron. 2023, 38, 13008–13018. [Google Scholar] [CrossRef]
  16. Xu, J.; Ouyang, Z.; Sun, J.; Zhu, W.; Nie, Z. Performance and characterization of optimal harmonic dispersion effect in double FrequencyBand random PWM strategy. IEEE Trans. Power Electron. 2024, 39, 14680–14690. [Google Scholar] [CrossRef]
  17. Zhao, W.; Feng, J.; Tao, T.; Wang, C.; Liu, S. High frequency harmonics and vibration reduction for dual three phase PMSM using multiple randomized SVPWM strategy. IEEE Trans. Power Electron. 2024, 39, 11455–11467. [Google Scholar] [CrossRef]
  18. Peyghambari, A.; Dastfan, A.; Ahmadyfard, A. Strategy for switching period selection in random pulse width modulation to shape the noise spectrum. IET Power Electron. 2015, 8, 517–523. [Google Scholar] [CrossRef]
  19. Peyghambari, A.; Dastfan, A.; Ahmadyfard, A. Selective voltage noise cancellation in three-phase inverter using random SVPWM. IEEE Trans. Power Electron. 2016, 31, 4604–4610. [Google Scholar] [CrossRef]
  20. Li, G.; Fu, Z.; Wang, Y. Electromagnetic vibration and noise suppression of induction motor based on RPWM selective spectrum shaping. IEEE Access 2021, 9, 54509–54517. [Google Scholar] [CrossRef]
  21. Wen, J.; Cheng, X.; Gao, Y.; Wu, T.; Zhao, F. Towards harmonic cancellation in motors using selective noise suppression random SVPWM method. In Proceedings of the 13th International Conference on Power Electronics, Machines and Drives (PEMD), Nottingham, UK, 10–13 June 2024. [Google Scholar]
  22. Wang, Y.; Liu, J.; Jiao, T.; Wang, M.; Mo, G. Characterization and selection of probability density function in a discrete random switching period SVPWM strategy. IEEE J. Emerg. Sel. Top. Power Electron. 2022, 10, 7475–7485. [Google Scholar] [CrossRef]
  23. Wen, J.; Cheng, X.; Gao, Y.; Liu, J.; Ji, P.; Yang, J. An optimization method in the random switching frequency SVPWM for the sideband harmonic dispersion. IEEE J. Emerg. Sel. Top. Power Electron. 2024, 12, 4801–4813. [Google Scholar] [CrossRef]
  24. Xia, Y.; Roy, J.; Ayyanar, R. Optimal variable switching frequency scheme to reduce loss of single-phase grid-connected inverter with unipolar and bipolar PWM. IEEE J. Emerg. Sel. Top. Power Electron. 2021, 9, 1013–1026. [Google Scholar] [CrossRef]
Figure 1. FOC system of PMSMs.
Electronics 14 02852 g001
Figure 2. An interval discretization method to randomize the fs(i) based on the continuous distribution f(z) (M = 5 as an example).
Electronics 14 02852 g002
Figure 3. PMF of the discrete random variable fs(i) in sub-frequency bands ((a = b) ∧ (b = 0.15), M = 9).
Electronics 14 02852 g003
Figure 4. The switching frequency change law of the conventional DRSF-SVPWM (N = 1).
Electronics 14 02852 g004
Figure 5. The switching frequency change law of the proposed TSBDR-SVPWM (N = 4).
Electronics 14 02852 g005
Figure 6. Simulation results of the line voltage spectrum at a rotation speed of 750 rpm and load torque of 0.2 N·m with different SVPWM methods. (a) CSVPWM (M = 1). (b) UD-DRSF-SVPWM (N = 1, (a = b) ∧ (b = 1), M = 9). (c) BD-DRSF-SVPWM (N = 1, (a = b) ∧ (b = 0.15), M = 9). (d) TSBDR-SVPWM (N = 4, (a = b) ∧ (b = 0.15), M = 9).
Electronics 14 02852 g006
Figure 7. Simulation results of the line voltage spectrum at a rotation speed of 750 rpm and load torque of 0.2 N·m in the TSBDR-SVPWM method with different N. (a) N = 2. (b) N = 4. (c) N = 6. (d) N = 8.
Electronics 14 02852 g007
Figure 8. The Var with different beta distribution shape parameters in the proposed TSBDR-SVPWM method at a rotation speed of 750 rpm and load torque of 0.2 N·m.
Electronics 14 02852 g008
Figure 9. Experimental platform of the control system and measurement system.
Electronics 14 02852 g009
Figure 10. Complete FOC closed-loop system including the MCU and SVPWM methods.
Electronics 14 02852 g010
Figure 11. Experimental results of the line voltage spectrum at a rotation speed of 750 rpm and load torque of 0.2 N·m with different SVPWM methods. (a) CSVPWM (M = 1). (b) UD-DRSF-SVPWM (N = 1, ((a = b) ∧ (b = 1), M = 9). (c) BD-DRSF-SVPWM (N = 1, (a = b) ∧ (b = 0.15), M = 9). (d) TSBDR-SVPWM (N = 4, (a = b) ∧ (b = 0.15), M = 9).
Electronics 14 02852 g011
Figure 12. Experimental results of the line voltage spectrum at a rotation speed of 750 rpm and load torque of 0.2 N·m in the TSBDR-SVPWM method with different N. (a) N = 2. (b) N = 4. (c) N = 6. (d) N = 8.
Electronics 14 02852 g012
Figure 13. Experimental results of the line voltage spectrum at a rotation speed of 1500 rpm and load torque of 0.2 N·m with different SVPWM methods. (a) CSVPWM (M = 1). (b) UD-DRSF-SVPWM (N = 1, (a = b) ∧ (b = 1), M = 9). (c) BD-DRSF-SVPWM (N = 1, (a = b) ∧ (b = 0.13), M = 9). (d) TSBDR-SVPWM (N = 4, (a = b) ∧ (b = 0.13), M = 9).
Electronics 14 02852 g013
Figure 14. Experimental results of the line voltage spectrum at a rotation speed of 2250 rpm and load torque of 0.2 N·m with different SVPWM methods. (a) CSVPWM (M = 1). (b) UD-DRSF-SVPWM (N = 1, (a = b) ∧ (b = 1), M = 9). (c) BD-DRSF-SVPWM (N = 1, (a = b) ∧ (b = 0.17), M = 9). (d) TSBDR-SVPWM (N = 4, (a = b) ∧ (b = 0.17), M = 9).
Electronics 14 02852 g014
Figure 15. Experimental results of the line voltage spectrum at a rotation speed of 3000 rpm and load torque of 0.2 N·m with different SVPWM methods. (a) CSVPWM (M = 1). (b) UD-DRSF-SVPWM (N = 1, (a = b) ∧ (b = 1), M = 9). (c) BD-DRSF-SVPWM (N = 1, (a = b) ∧ (b = 0.15), M = 9). (d) TSBDR-SVPWM (N = 4, (a = b) ∧ (b = 0.15), M = 9).
Electronics 14 02852 g015
Figure 16. Experimental results of rotation speed dynamic response with different SVPWM methods (speed measured: white line; speed reference: red line). (a) CSVPWM. (b) UD-DRSF-SVPWM. (c) BD-DRSF-SVPWM. (d) TSBDR-SVPWM.
Electronics 14 02852 g016
Figure 17. Experimental results of the torque waveform at a rotation speed of 750 rpm and load torque of 0.2 N·m with different SVPWM methods. (a) CSVPWM (M = 1). (b) UD-DRSF-SVPWM (N = 1, (a = b) ∧ (b = 1), M = 9). (c) BD-DRSF-SVPWM (N = 1, (a = b) ∧ (b = 0.15), M = 9). (d) TSBDR-SVPWM (N = 4, (a = b) ∧ (b = 0.15), M = 9).
Electronics 14 02852 g017
Table 1. Main parameters of the SPMSM.
ParameterValue
Rated Voltage24 V
Rated Current4 A
Rated Speed3000 rpm
Rated Torque0.2 N·m
Rated Power62 W
Resistance1.02 Ω
Inductance0.59 mH
B-Emf Constant4.3 V/krpm
Pole Number4
Table 2. Experimental setup.
EquipmentType
MCUSTM32F407
MOSFET of VSIInfineon IRFS3607
MotorSPMSM
Magnetic damperMTB-05
Power analyzerEverfine PF330A
OscilloscopeTektronix DPO2024
Table 3. Sideband harmonic amplitude with different load torques at the rotation speed of 750 rpm.
No-Load0.1 N·m0.2 N·m0.3 N·m
CSVPWM (M = 1)−14.52 dB−13.04 dB−12.08 dB−10.06 dB
UD-DRSF-SVPWM (N = 1, (a = b) ∧ (b = 1), M = 9)−18.82 dB−20.86 dB−14.35 dB−16.21 dB
BD-DRSF-SVPWM (N = 1, (a = b) ∧ (b = 0.15), M = 9)−21.02 dB−21.32 dB−20.12 dB−17.92 dB
TSBDR-SVPWM (N = 4, (a = b) ∧ (b = 0.15), M = 9)−23.11 dB−22.75 dB−21.88 dB−19.06 dB
Table 4. Measurement results of inverter efficiency with different modulation indexes.
0.20.40.60.81.0
CSVPWM (M = 1)95.80%97.68%98.23%98.65%98.78%
UD-DRSF-SVPWM (N = 1, (a = b) ∧ (b = 1), M = 9)95.73%97.68%98.25%98.66%98.77%
BD-DRSF-SVPWM (N = 1, (a = b) ∧ (b = 0.15), M = 9)95.82%97.65%98.20%98.65%98.72%
TSBDR-SVPWM (N = 4, (a = b) ∧ (b = 0.15), M = 9)95.78%97.70%98.22%98.63%98.75%
Table 5. Qualitative comparison results of different SVPWM methods.
Harmonic Spreading EffectTHDInverter EfficiencyImplementation of
Complexity in the MCU
CSVPWM (M = 1)WorstBaseline valueBaseline valueEasy
UD-DRSF-SVPWM (N = 1, (a = b) ∧ (b = 1), M = 9)ModerateSignificant increaseEqual to baselineModerate
BD-DRSF-SVPWM (N = 1, (a = b) ∧ (b < 1), M = 9)GoodSignificant increaseEqual to baselineModerate
TSBDR-SVPWM (N = 4, (a = b) ∧ (b < 1), M = 9)BestSlight increaseEqual to baselineComplex
Table 6. Quantitative comparison results of different SVPWM methods on key parameters.
Sideband Harmonic
Amplitude
Torque RippleSRAM Usage in the MCUCPU Load in the MCU
CSVPWM (M = 1)−12.08 dB2.1%17.8%23.5%
UD-DRSF-SVPWM (N = 1, (a = b) ∧ (b = 1), M = 9)−14.35 dB3.8%21.2%27.6%
BD-DRSF-SVPWM (N = 1, (a = b) ∧ (b < 1), M = 9)−20.12 dB3.7%21.2%27.6%
TSBDR-SVPWM (N = 4, (a = b) ∧ (b < 1), M = 9)−21.88 dB2.8%22.0%28.2%
Disclaimer/Publisher’s Note: The statements, opinions and data contained in all publications are solely those of the individual author(s) and contributor(s) and not of MDPI and/or the editor(s). MDPI and/or the editor(s) disclaim responsibility for any injury to people or property resulting from any ideas, methods, instructions or products referred to in the content.