This section primarily outlines the process of evaluating the effectiveness of our attacks through experiments, including the experimental setup and implementation process. The tested algorithms include MADDPG [
36] and Qmix [
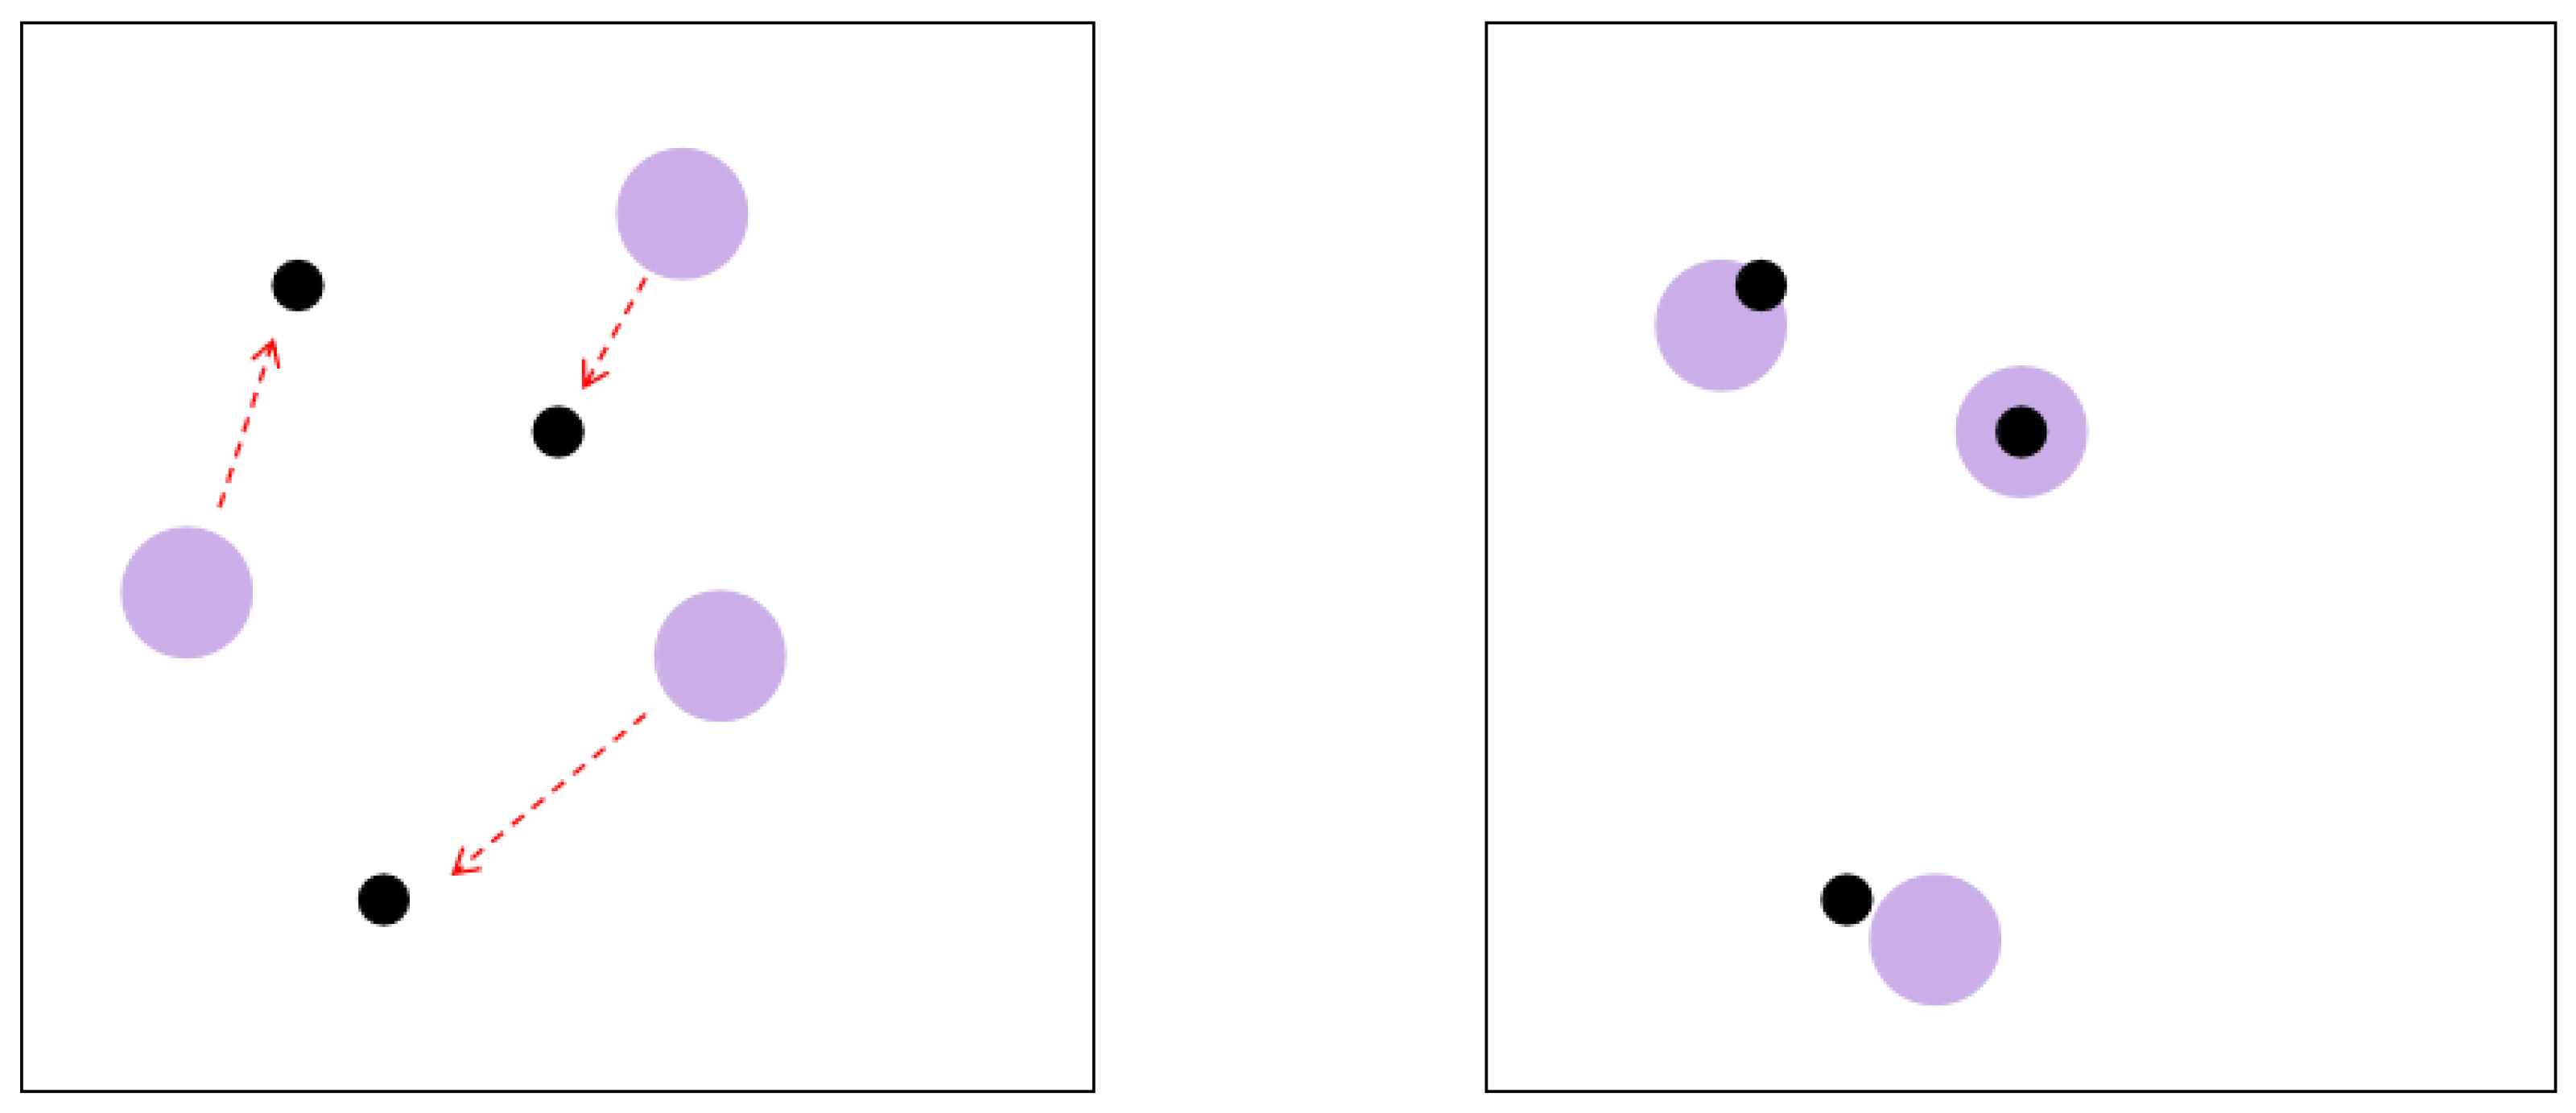
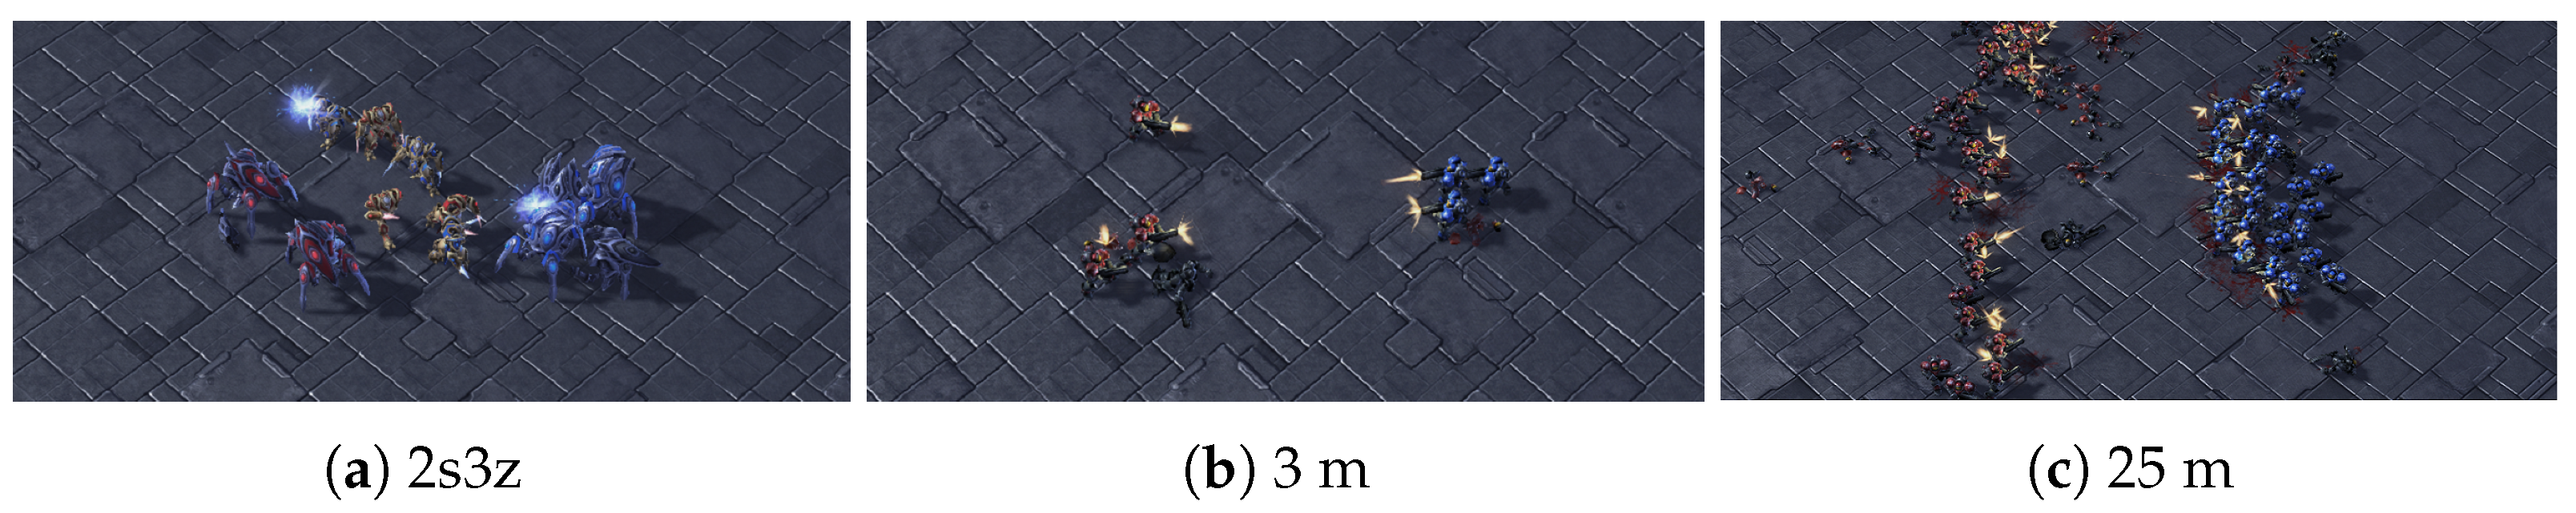
37]. The experiments were conducted in scenarios such as ‘simple spread’ in the Multi-Agent Particle Environment (MPE) and several map scenarios in the StarCraft Multi-Agent Challenge (SMAC). The MPE and SMAC were selected as our experimental environments because they represent two distinct types of experimental scenarios. In the MPE, the action space is continuous, whereas in the SMAC, it is discrete. Additionally, the SMAC is a well-established environment for MARL, characterized by a more complex experimental setup. The experimental scenarios are illustrated in
Figure 4 and
Figure 5.
5.3. Implementation
Example 1: MPE. We used MADDPG to obtain the optimal policy to be attacked, with training episodes set to 100,000 and episode length set to 25. Ultimately, the average reward converged to approximately −1.5. In this scenario, the T-function was set as the sum of the distances between agents and the nearest landmarks. Conducting 1000 tests on this model yielded an average reward of −1.514 and an average T-value of 0.660. We utilized these data as the baseline for the attack experiments.
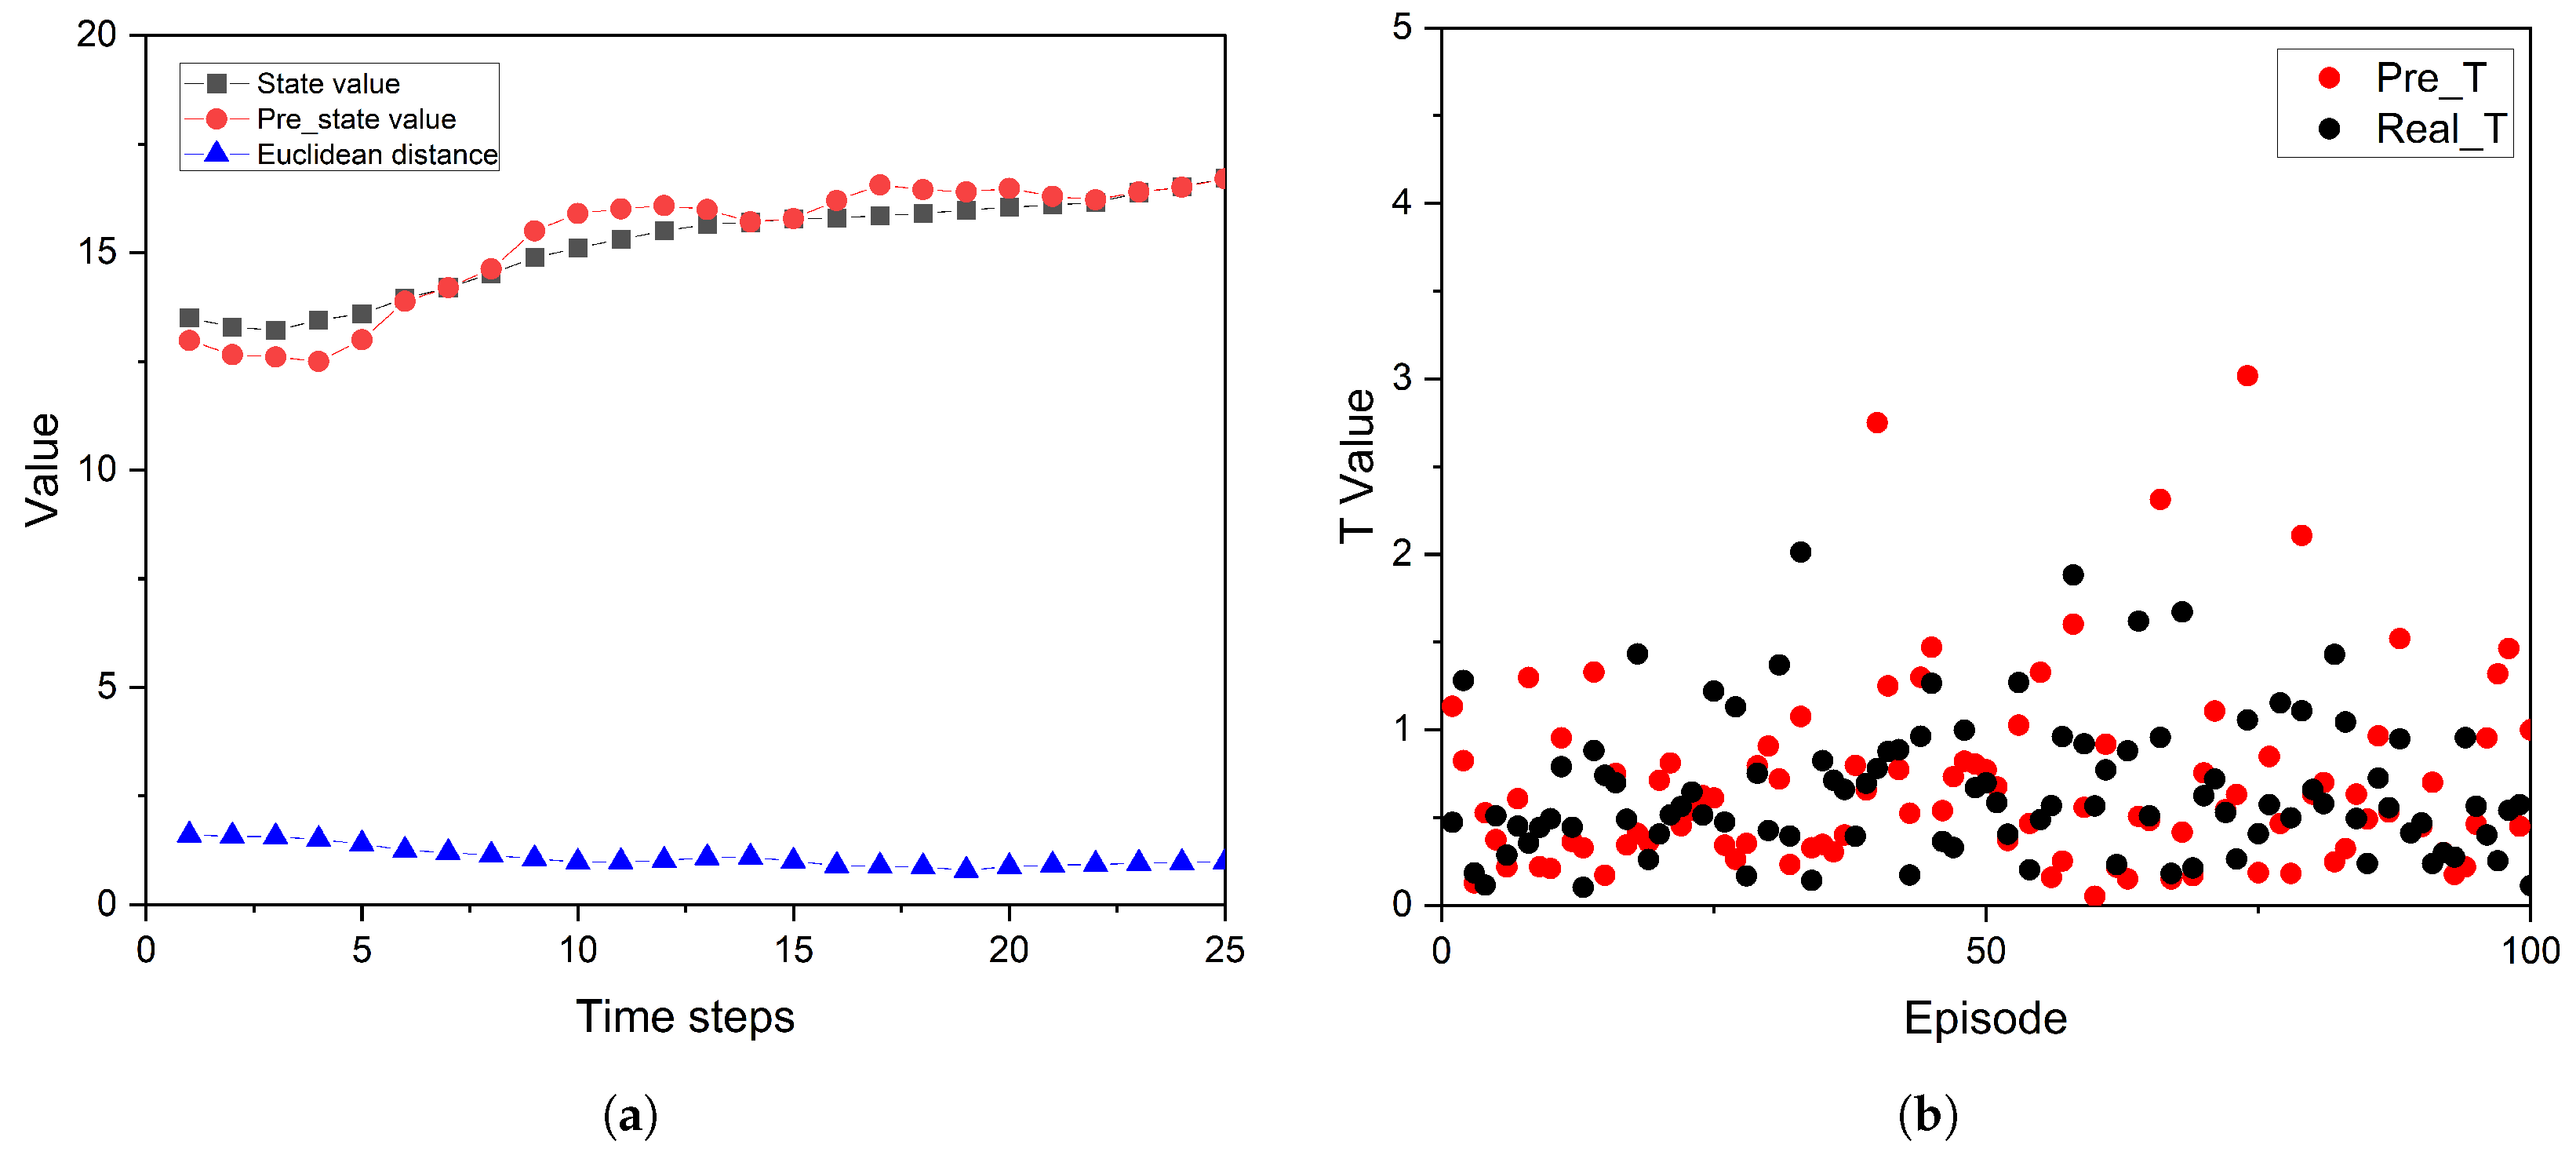
To construct a predictive model, we utilized the trained model described above for 10,000 tests. The data generated in each round of testing were collected into a training set for the predictive model. We used observations and actions in each round as inputs and the subsequent observation as an output. We assessed the performance of the predictive model using two metrics. Firstly, we replaced the normal environmental update function with the predictive model to obtain the next state values for 100 episodes. Compared to the baseline average T-value of 0.660, the results show an average T-value of 0.687. Apart from a few outliers, the overall trend of the predictive T-value closely resembles the baseline, indicating that the predictive model can effectively simulate real environments. Secondly, for individual tasks, we measured the accuracy of the predictive results by calculating the Euclidean distance between real and predicted state values, as shown in the
Figure 6. With these two metrics, we trained a predictive model that fits the environment iteration well and can serve as a basis for searching key attack steps and key agents.
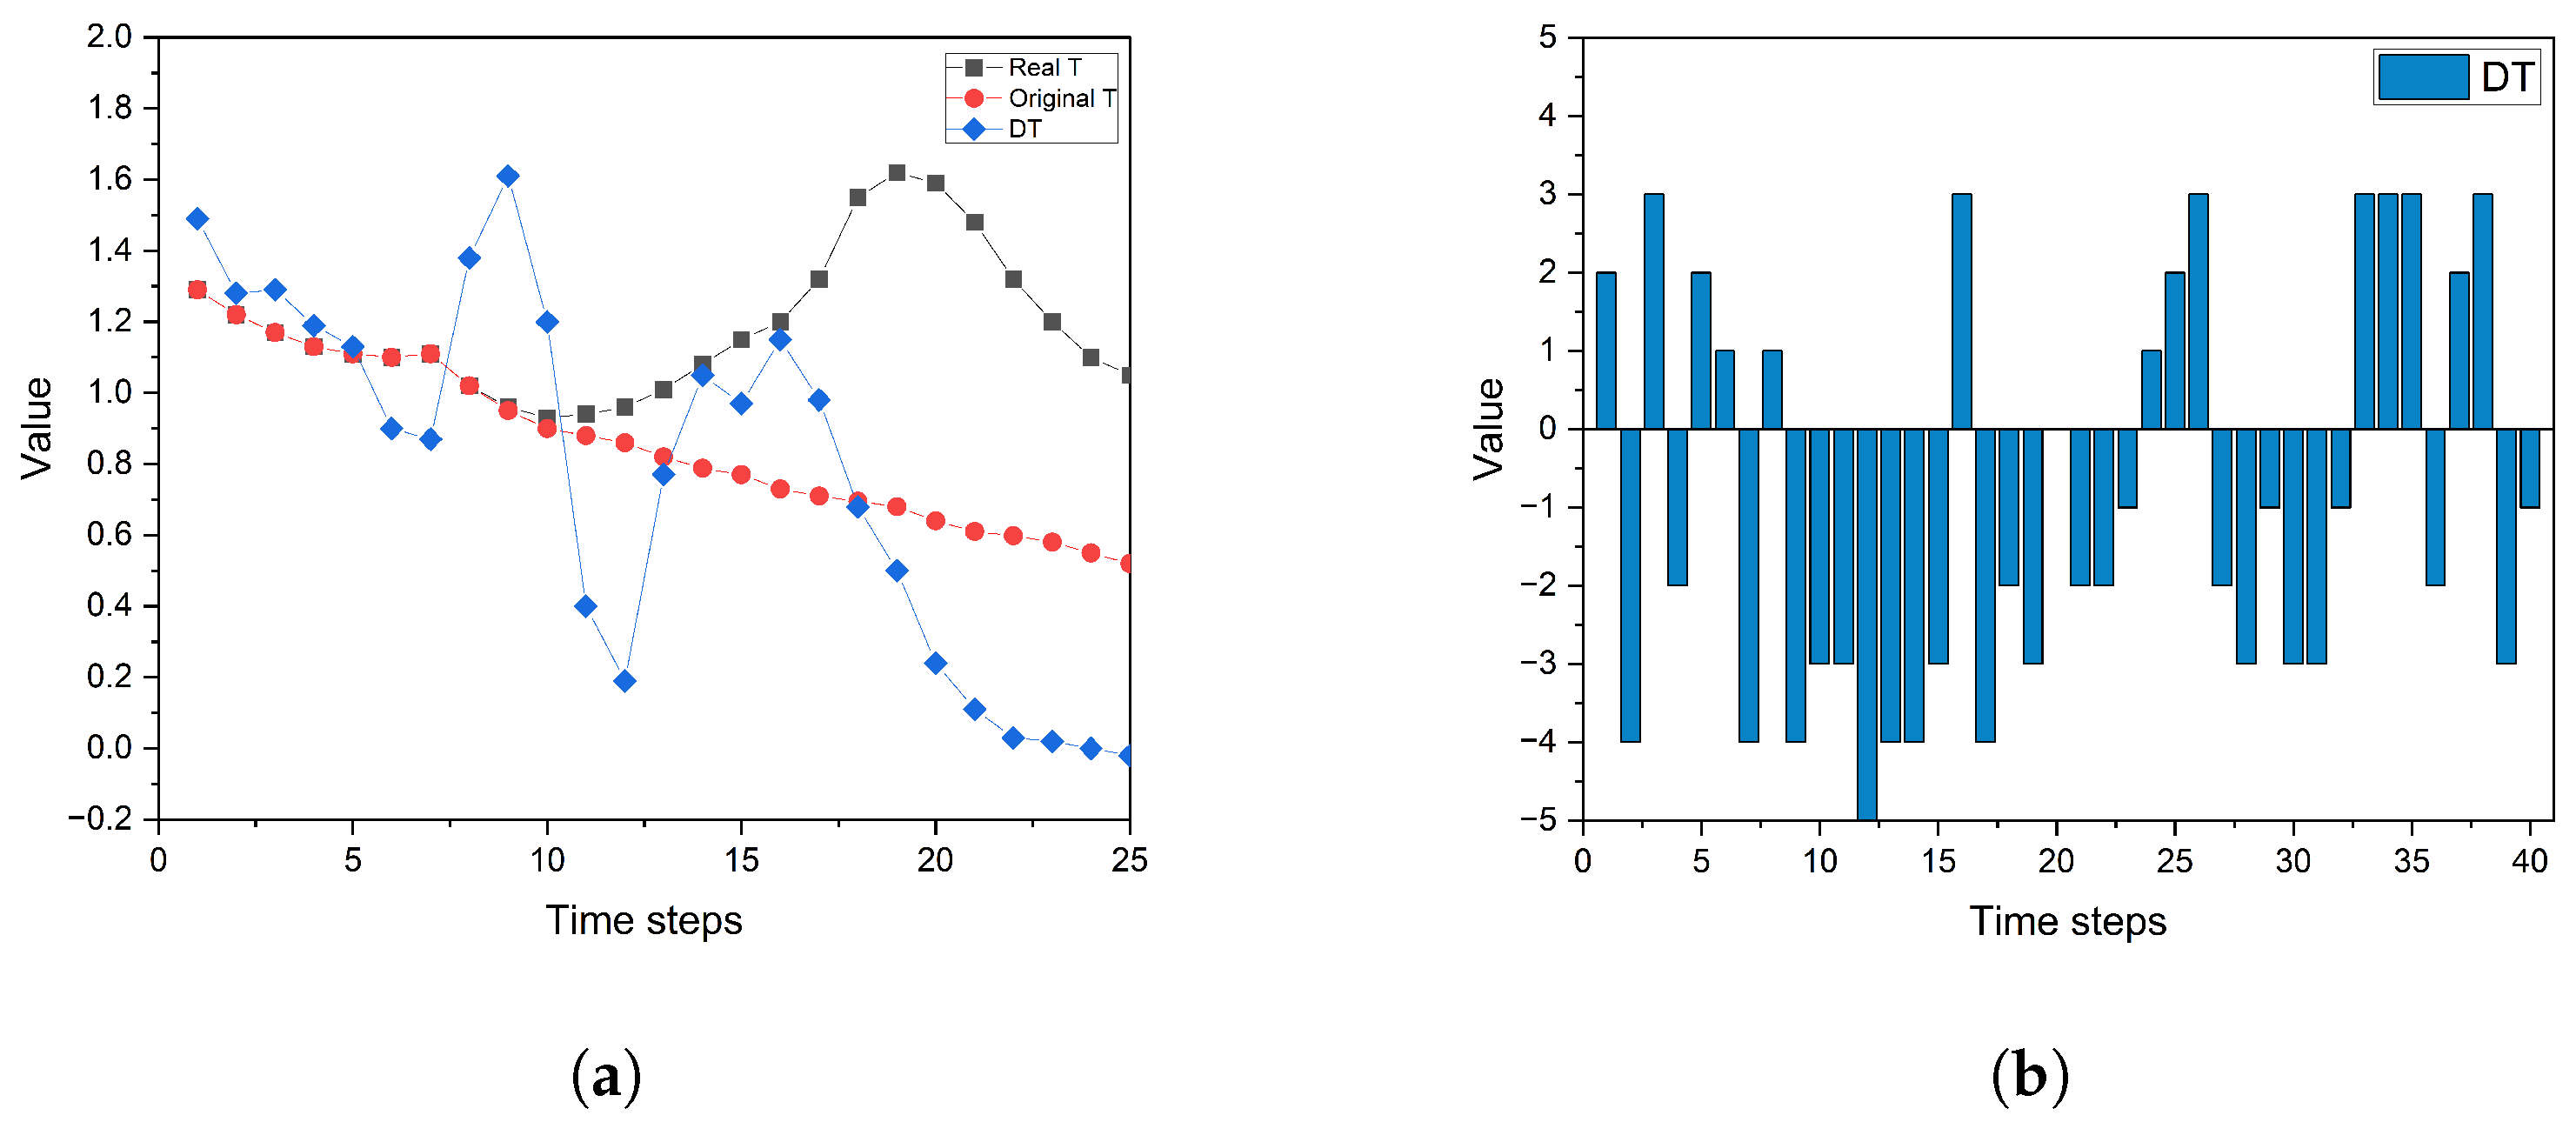
In the current scenario, the attack strategy involves negating the real action values.
Figure 7a illustrates the changes in actual T-values, T-values after the attack, and ensuing differences (DT values) in a specific round. With
m set to 10, the search results indicate that starting from the 9th step, executing an attack maximized the DT value. Therefore, the ninth step can be defined as the key step. Steps 9 to 18 were designated as the attack steps in which the attack strategy is executed. The T-value curve shows an immediate increase in T-values after the attack, reaching the maximum deviation in the final attack step. The agent moves closer to the landmark under the control of the original model, but by the end of the round, it fails to reach the T-value level of the baseline. This indicates an inability to cover or approach the landmark within the fixed number of rounds.
Example 2: SMAC. We selected three maps, including 2s3z, 3 m, and 25 m, as experimental scenarios. Taking the 2s3z map as an example, we conducted 2,050,000 rounds of gameplay training using the QMIX algorithm, resulting in an average win rate of 97.8% and a mean return of around 20. To construct the predictive model (PM), we collected observations and action sets from each round during a 10,000-round testing process. The combination of observations and actions was input to the PM, while the subsequent observations served as the output. To evaluate the PM’s performance, we replaced the environment’s state update values with the PM’s output during 100 rounds of testing gameplay. The results show a win rate of up to 92% out of 100 rounds. Compared to the normal gameplay win rate of 97.8%, this indicates that the PM effectively fulfills its predictive role. Additionally, in a single round of gameplay, we measured the deviation in the prediction results by calculating the Euclidean distance between the observations updated normally at each step and the predicted observations.
In this scenario, the attack strategy entails directing agents to take actions with the lowest Q-value. The T-value function is defined by the disparity between the number of friendly surviving agents and the number of enemy-surviving agents. A positive T-value denotes victory in the game, while a negative T-value signifies defeat. Additionally, a smaller T-value indicates better performance of the attack. We set m to 5 and conducted one key-step search. The results indicate that attacking from the 12th step yielded the minimum T-value, so we defined the 12th step as the key step. Under the conditions of m = 5 attack steps and the lowest Q-value attack strategy, the win rate in 100 game rounds is 13%. Compared to the normal win rate of 97% in 100 game rounds, this indicates a significant improvement in performance for this attack pattern.
After determining the key step, we proceeded to adjust the value of
m and conducted attack tests with step lengths of 3, 5, and 7. In
Table 1, the results show that with a step length of 3, the win rate in 100 game rounds drops to around 50% from the original 98%. With a step length of 5, the win rate decreases to around 10%. Increasing the attack step length to 7 almost guarantees a 100% failure rate in all game rounds. It is worth noting that in these attack tests, the attack step length of 3 accounted for only about 5% of the total episode steps. Even with a step length of 7, it did not exceed 15% of the total episode steps. After identifying the key step, we proceeded to search for the key agents while keeping the key step fixed. We determined the key agents by individually testing the weight of each agent in the attack. Agents were prioritized by sorting tuples
, where
t represents the T-values and
s denotes episode steps, in ascending order of
t and descending order of
s. The experimental results are shown in
Table 2.
5.4. Results and Evaluation
Example 1: MPE. In this scenario, we validate the effectiveness of our method by setting the same stealth indicators, i.e., attacking the same number of time steps and agents. The results show that the method proposed in this paper performs better. We initialized 1000 sets of random points, where three points corresponded to agent positions, and the remaining three corresponded to landmark positions in each set. Using three attack methods and the constructed set of random points, we conducted 1000 experiments. We evaluated the attack effectiveness using two metrics: T-value and reward. A larger T-value and a smaller reward indicate a more effective attack compared to the baseline. The average T-value and reward are calculated as the final experimental results. The two attack methods compared in this context were the following:
The results are shown in
Table 3. When
m = 10, the attack effectiveness of SKKA is significant for both individual agents and all agents. In the case of attacking all agents,
F = 0.4, the T-value increased by 84.4%, and the reward decreased by 29.7%, indicating an improvement in attack performance. In the case of attacking a single agent,
F = 0.13, the T-value increased by 41.2%, and the reward decreased by 11.1%. Compared to similar methods, the effectiveness of the attack is still maintained even when the number of attacked agents is reduced.
Example 2: SMAC. To further validate the stealth and advantages of the proposed method, we conducted comparative experiments in the SMAC. The experimental results show that SKKA has higher stealth under the same attack effectiveness. In certain scenarios, SKKA outperforms similar methods in terms of both effectiveness and stealth. We compared win rates against benchmark opponents using three attack methods. The win rate of the model trained by the RL algorithm over 1000 games was used as the baseline. The proposed attack algorithm SKKA, along with three other attack algorithms, were employed to attack the model using 1000 games for each test. A lower win rate, accompanied by a lower F value, indicates a better performance for the attack method. The three attack methods include the following:
STA: An attack method proposed by Lin [
11] based on rules. In the present experiment, the attack timing determination was based on computing the average action probability divergence among agents, subject to a predefined maximum-step constraint for adversarial interventions.
RSRARA: Random selection of attack steps, agents, and actions during the attack.
RSRALA: Execution of the action with the lowest Q-value for random agents at random steps.
First, we used the “search for key steps” method to determine the attack time steps. At the target attack time step, we attacked all agents, and the experimental results are shown in
Table 4. The results indicate that when the win rates are very low, SKKA demonstrates the best stealth, i.e., the lowest F-value. For instance, in the 2s3z scenario, with win rates all at 0, SKKA’s stealth is 0.137, while STA’s stealth is 0.217. In contrast, RSRALA and RSRARA, which have worse attack effectiveness, also exhibit worse stealth. The specific experimental data can be found in
Table 5.
Next, we further used the “search for key agents” method to determine the range of agents being attacked, aiming to enhance the stealth of the attack. The experimental results are shown in
Table 6. The results demonstrate that, while keeping the attack time steps unchanged, reducing the number of attacked agents decreases the attack’s effectiveness but further improves the stealth. The detailed experimental data are illustrated in
Table 7. Compared to similar methods, our method not only further enhances stealth but also achieves superior attack effectiveness.


