

Stochastic Operation of BESS and MVDC Link in Distribution Networks Under Uncertainty


Abstract
1. Introduction
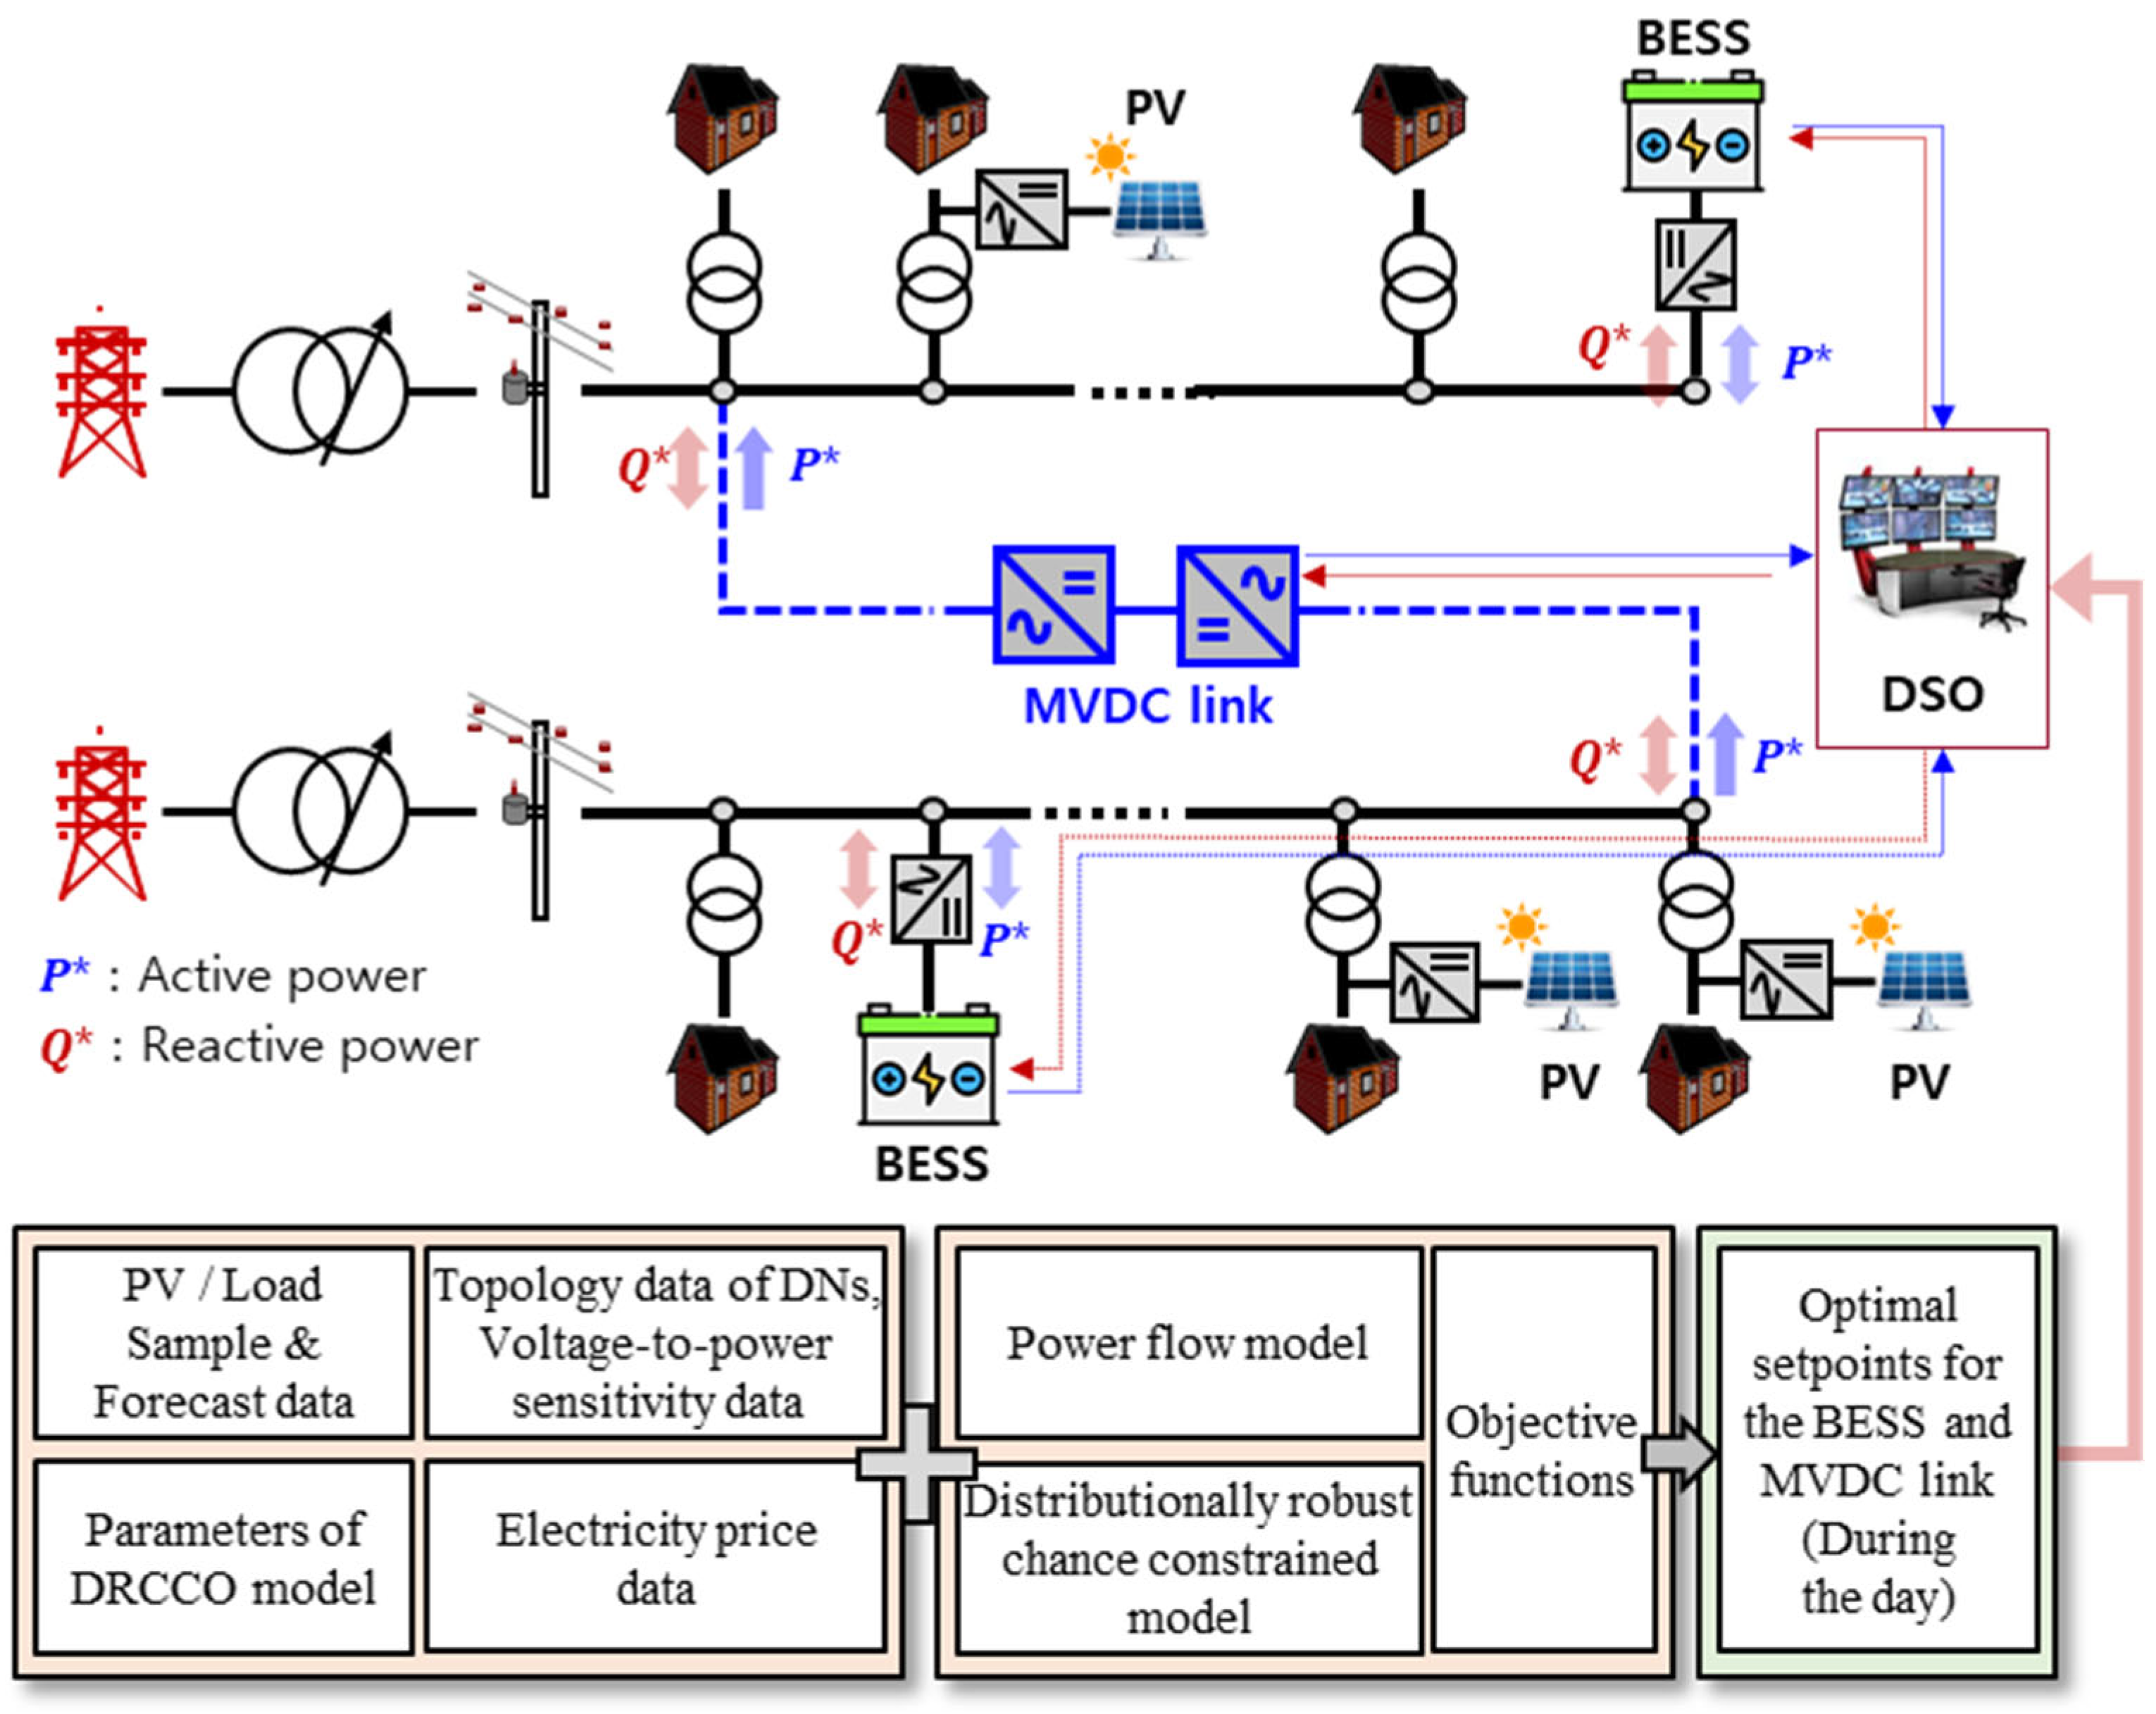
- In this work, we propose a day-ahead optimal scheduling strategy for MVDC links that aims to reduce the energy procurement costs for DSOs by coordinating with BESS under forecast uncertainties. The proposed method incorporates the DRCCO framework to optimize power allocation and ensure reliable operation across interconnected distribution networks.
- Furthermore, we conduct detailed case studies to investigate the impact of critical DRCCO parameters—namely, the ambiguity set radius and the confidence level—on the operational cost, voltage reliability, and energy loss. These analyses offer valuable insights for DSOs seeking to balance economic efficiency and system robustness.
2. Problem Formulation
2.1. Flexible MVDC Link System
2.2. Battery Energy Storage System Model
2.3. Load Flow Calculation Model
2.4. Uncertainty Variable Model
2.5. Distributionally Robust Chance-Constrained Optimization Model
2.6. Proposed Optimization Model
3. Case Studies
- Scenario I: Baseline cases without the integration of the MVDC link and BESS.
- Scenario II: Incorporates the MVDC link and BESS, employing a deterministic optimization framework that neglects forecast uncertainties.
- Scenario III: Incorporates the MVDC link and BESS, employing a robust optimization that considers only the maximum and minimum values of forecast uncertainties.
- Scenario IV: Incorporates the MVDC link and BESS, employing the proposed DRCCO method to explicitly account for forecast uncertainties.
4. Conclusions
Author Contributions
Funding
Data Availability Statement
Conflicts of Interest
Nomenclature
| Sets | |
| k | Index of DNs |
| i, j | Index of buses in each DN |
| t | Time index |
| Parameters | |
| Bus voltage confidence level | |
| Radius of ambiguity set | |
| Active/Reactive power of load demand at bus j, time t, in k-th DN | |
| Active/Reactive power of PV generation at bus j, time t, in k-th DN | |
| Lower/Upper bus voltage limits at buses | |
| Minimum/Maximum state-of-charge of BESS | |
| Resistance/Reactance of branch (i, j) at k-th DN | |
| Rated apparent power capacity of MVDC link converter | |
| Rated apparent power capacity of BESS converter | |
| Loss coefficients of MVDC converter and BESS, respectively | |
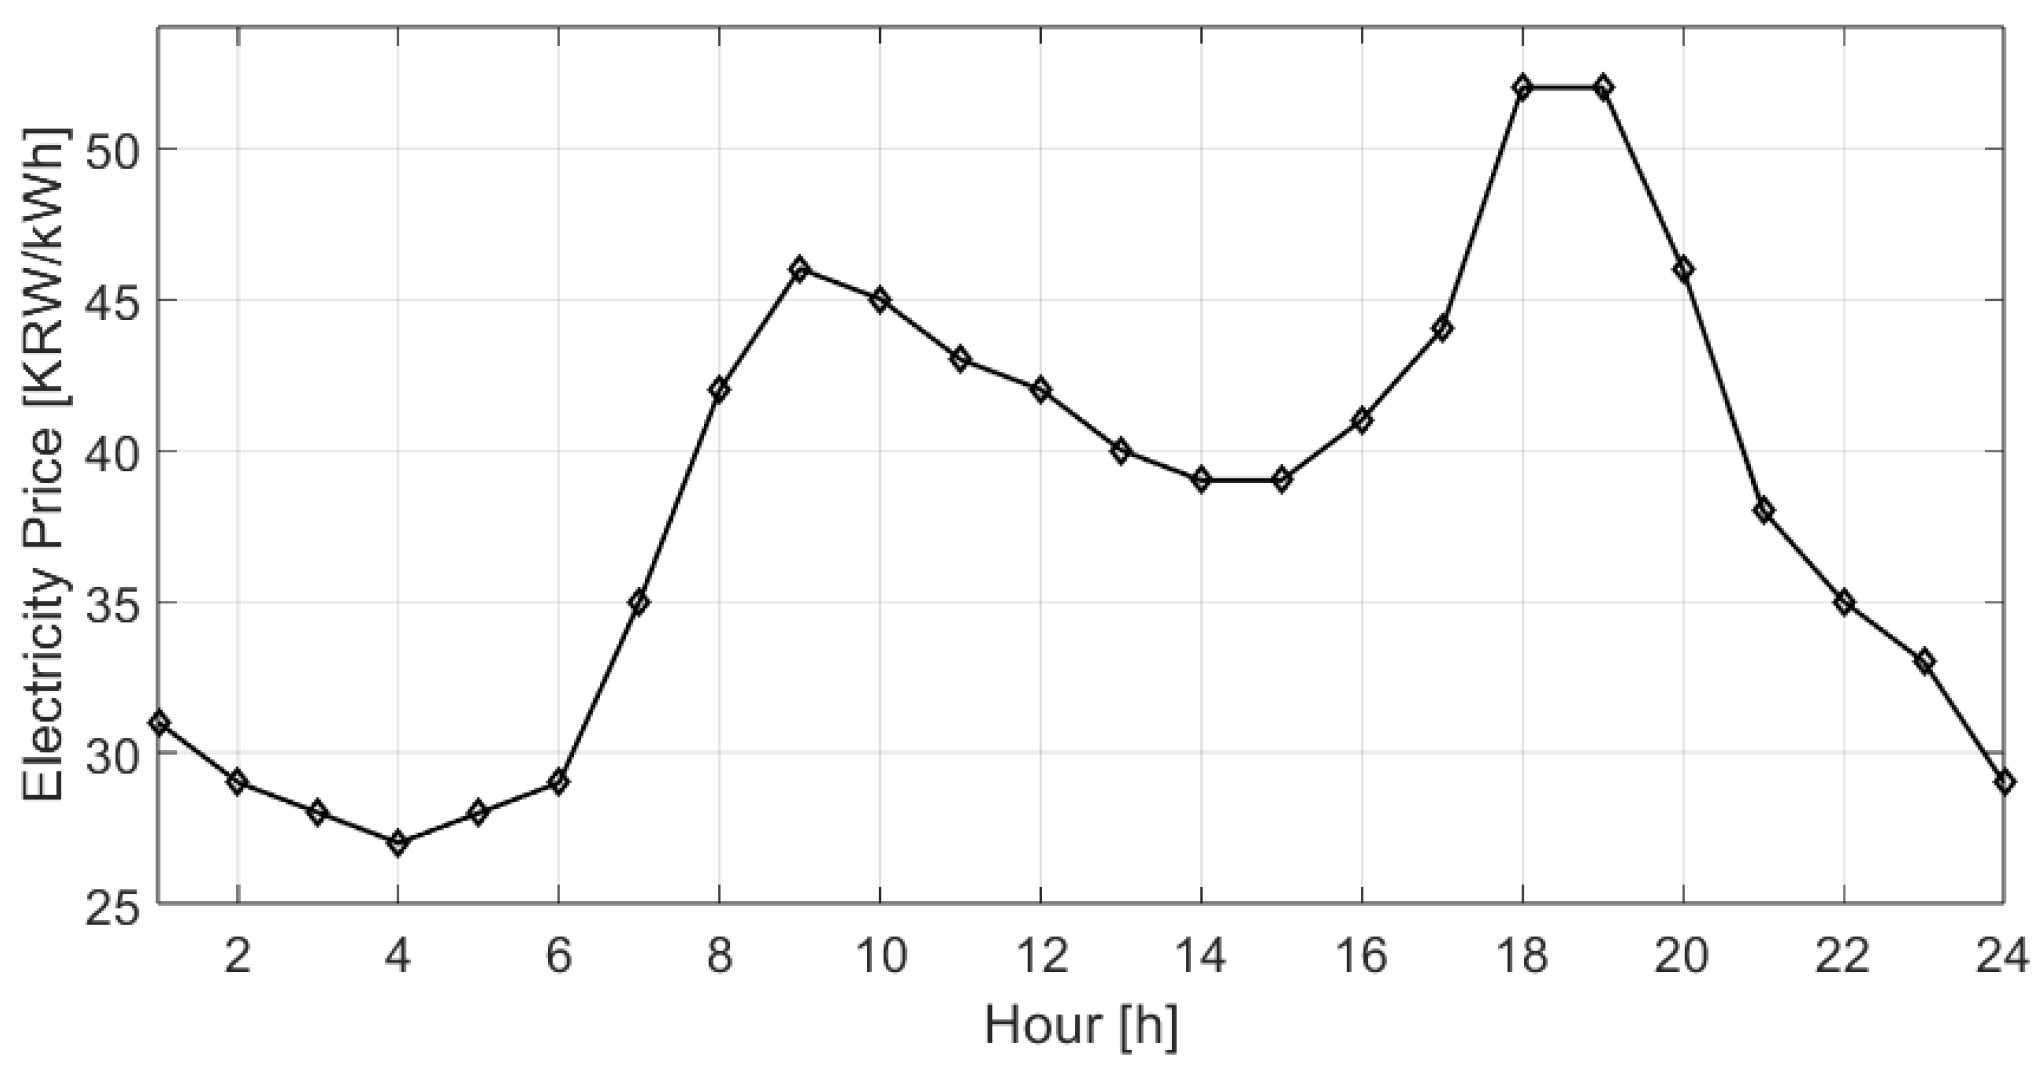
| Unit electricity cost at time t | |
| Decision Variables | |
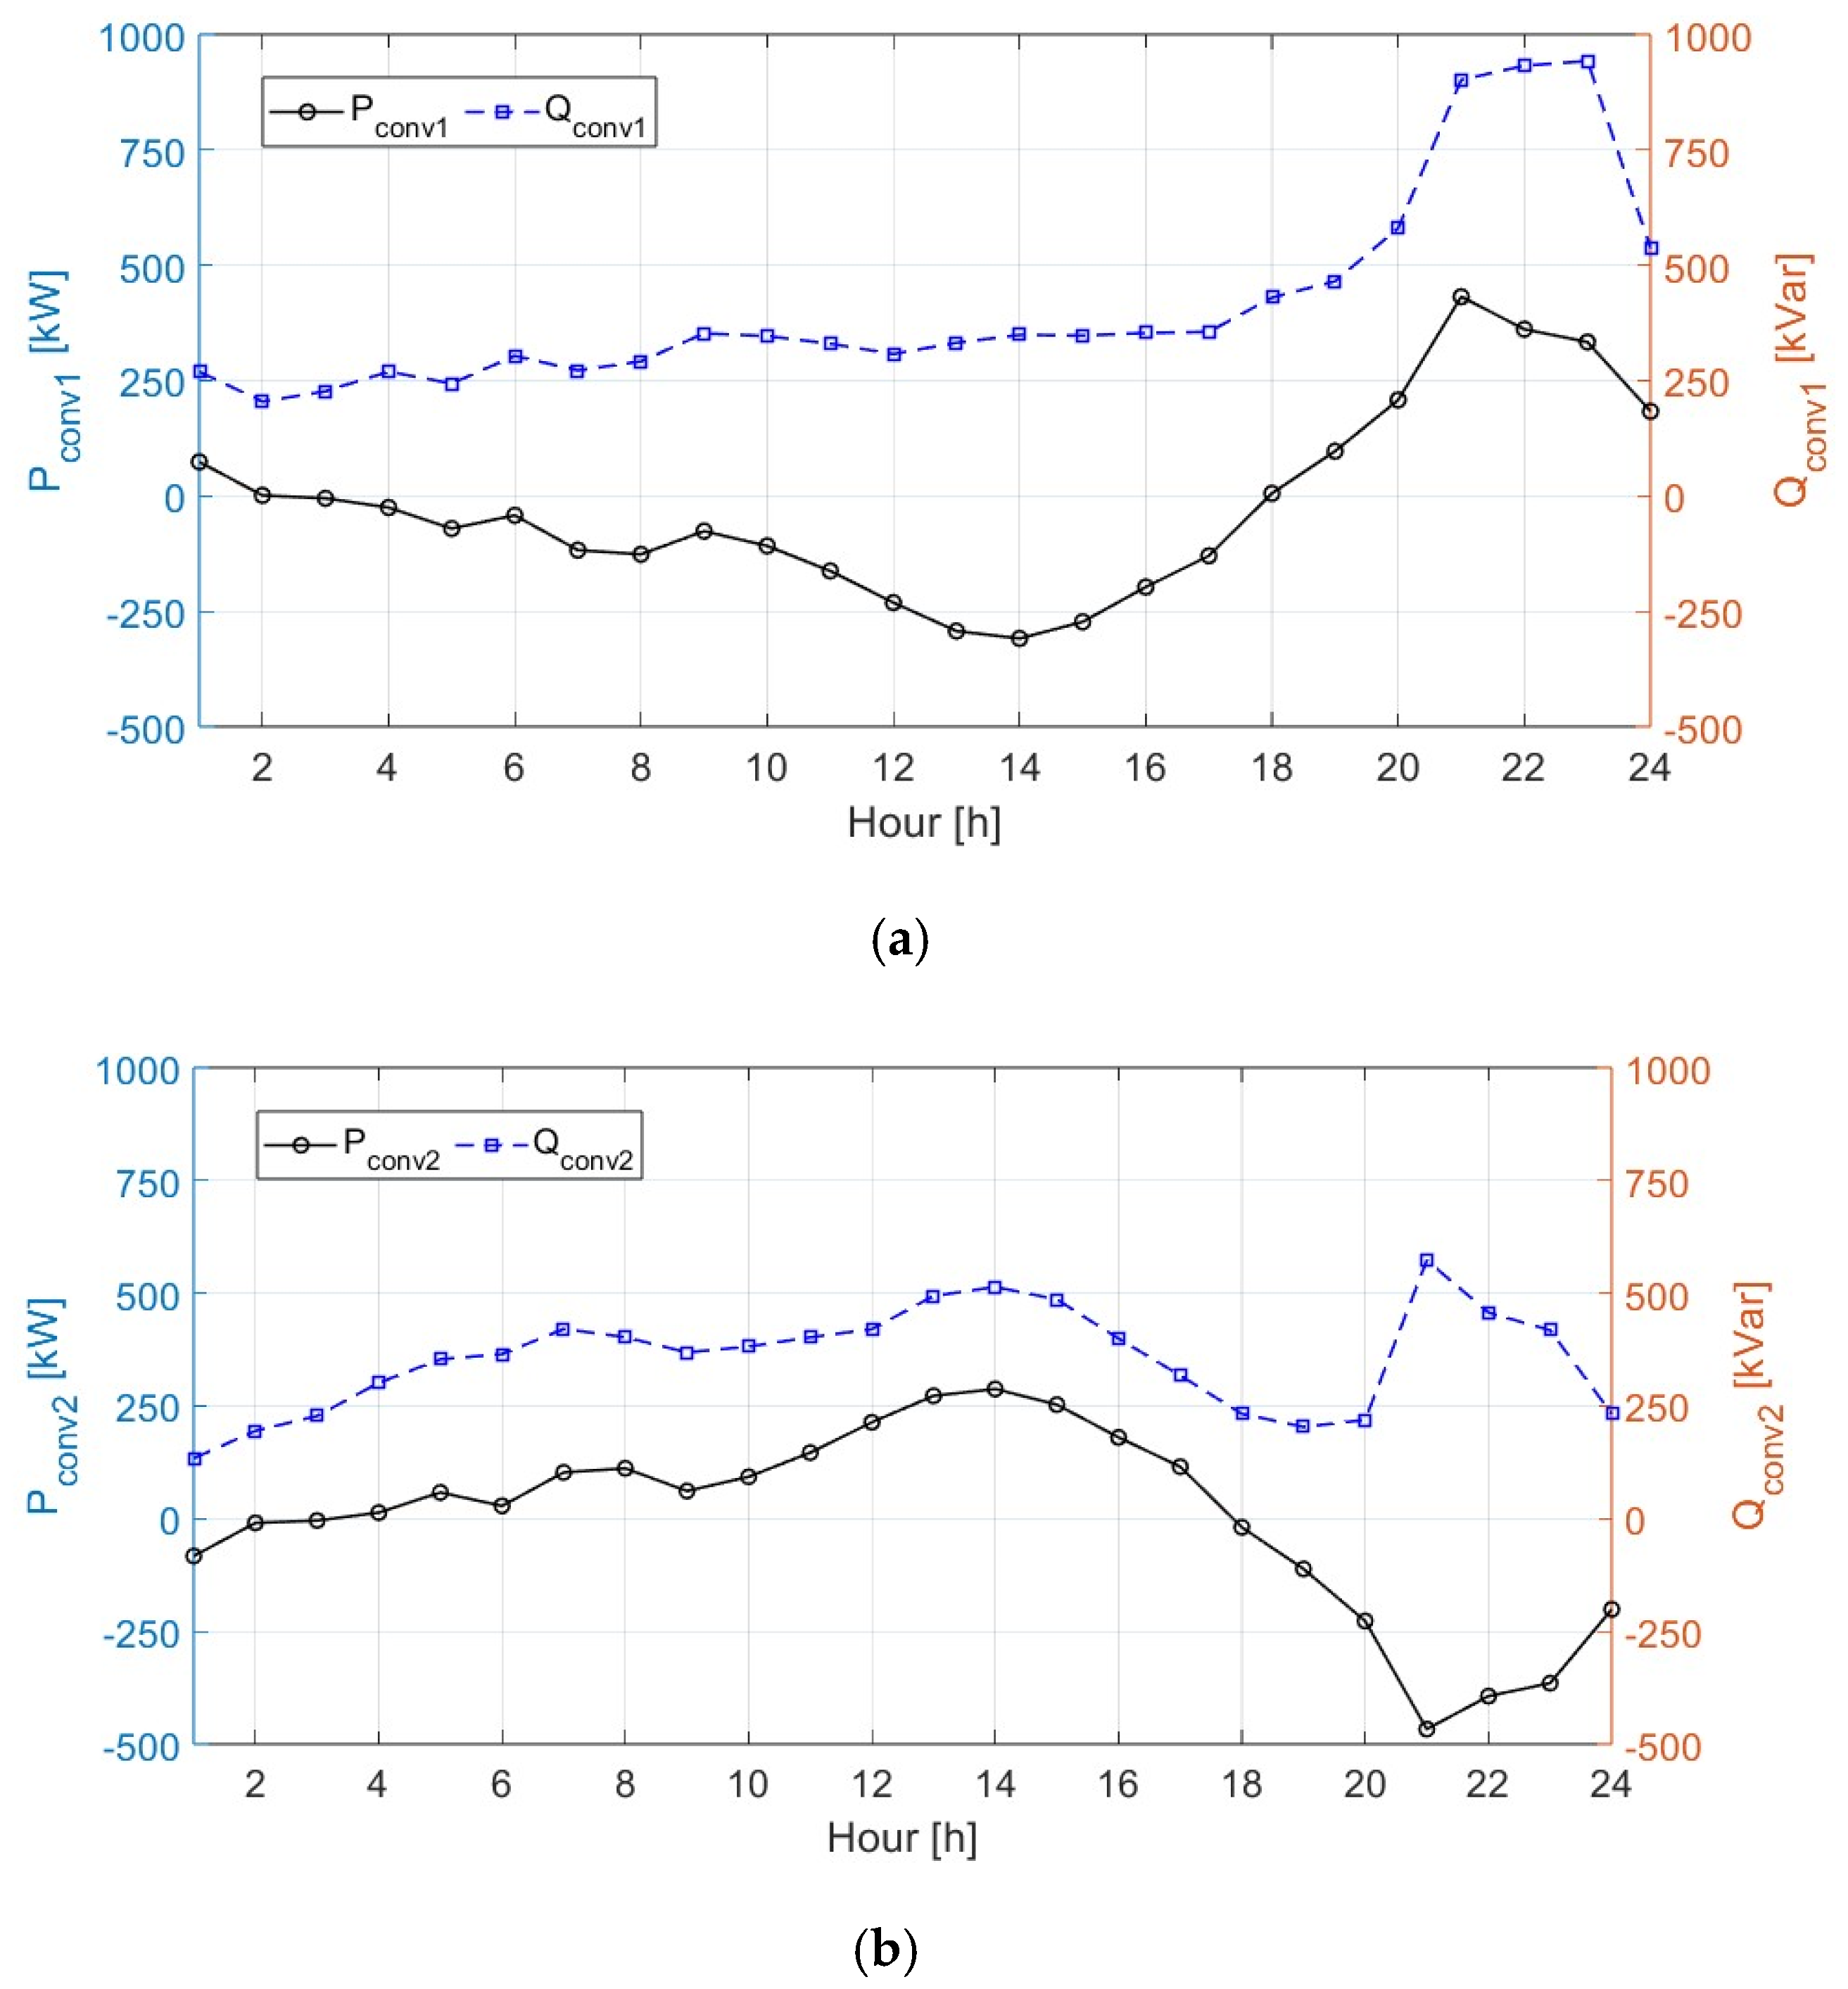
| Active/Reactive power outputs of MVDC link converter at time t, k-th DN | |
| Active/Reactive power outputs of BESS at time t, k-th DN | |
| State-of-charge of BESS at time t, k-th DN | |
| Voltage magnitude at bus i, time t, k-th DN | |
| Active/Reactive power flow on branch (i, j), time t, k-th DN | |
| Squared current magnitude on branch (i, j), time t, k-th DN | |
| Uncertainty Variables | |
| Load demand forecast error at time t, k-th DN | |
| PV output forecast error at time t, k-th DN | |
| Other Variables | |
| Actual load demand and PV generation after applying uncertainty | |
| Actual bus voltage considering uncertainties and control actions | |
| Auxiliary variables for DRCCO formulation | |
References
- Kok, C.L.; Fu, X.; Koh, Y.Y.; Teo, T.H. A Novel Portable Solar Powered Wireless Charging Device. Electronics 2024, 13, 403. [Google Scholar] [CrossRef]
- Konstantelos, I.; Giannelos, S.; Strbac, G. Strategic Valuation of Smart Grid Technology Options in Distribution Networks. IEEE Trans. Power Syst. 2017, 32, 1293–1303. [Google Scholar]
- Rahmani, S.; Amjady, N.; Shah, R. Application of Deep Learning Algorithms for Scenario Analysis of Renewable Energy-Integrated Power Systems: A Critical Review. Electronics 2025, 14, 2150. [Google Scholar] [CrossRef]
- Cavus, M. Advancing Power Systems with Renewable Energy and Intelligent Technologies: A Comprehensive Review on Grid Transformation and Integration. Electronics 2025, 14, 1159. [Google Scholar] [CrossRef]
- Quizhpe, K.; Arévalo, P.; Ochoa-Correa, D.; Villa-Ávila, E. Optimizing Microgrid Planning for Renewable Integration in Power Systems: A Comprehensive Review. Electronics 2024, 13, 3620. [Google Scholar] [CrossRef]
- Friman, H.; Banner, I.; Sitbon, Y.; Einav, Y.; Shaked, N. Preparing the Public Opinion in the Community to Accept Distributed Energy Systems and Renewable Energy. Energies 2022, 15, 4226. [Google Scholar] [CrossRef]
- Zhang, X.; Son, Y.; Choi, S. Optimal Scheduling of Battery Energy Storage Systems and Demand Response for Distribution Systems with High Penetration of Renewable Energy Sources. Energies 2022, 15, 2212. [Google Scholar] [CrossRef]
- Walling, R.A.; Saint, R.; Dugan, R.C.; Burke, J.; Kojovic, L.A. Summary of distributed resources impact on power delivery systems. IEEE Trans. Power Deliv. 2008, 23, 1636–1644. [Google Scholar] [CrossRef]
- Palmintier, B.; Broderick, R.; Mather, B.; Coddington, M.; Baker, K.; Ding, F.; Reno, M.; Lave, M.; Bharatkumar, A. On the Path to Sunshot: Emerging Issues and Challenges in Integrating Solar with the Distribution System. National Renewable Energy Laboratory; 2016. Available online: http://www.nrel.gov/docs/fy16osti/65331.pdf (accessed on 1 May 2016).
- Salimon, S.A.; Adepoju, G.A.; Adebayo, I.G.; Howlader, H.O.R.; Ayanlade, S.O.; Adewuyi, O.B. Impact of distributed generators penetration level on the power loss and voltage profile of radial distribution networks. Energies 2023, 16, 1943. [Google Scholar] [CrossRef]
- Zsiborács, H.; Baranyai, N.H.; Vincze, A.; Zentkó, L.; Birkner, Z.; Máté, K.; Pintér, G. Intermittent renewable energy sources: The role of energy storage in the European power system of 2040. Electronics 2019, 8, 729. [Google Scholar] [CrossRef]
- Niu, X.; Qiu, R.; Liu, S.; Chow, X. DC-Link Voltage Fluctuation Suppression Method for Modular Multilevel Converter Based on Common-Mode Voltage and Circulating Current Coupling Injection under Unbalanced Grid Voltage. Electronics 2024, 13, 3379. [Google Scholar] [CrossRef]
- Montoya, O.D.; Gil-González, W.; Arias-Londoño, A.; Rajagopalan, A.; Hernández, J.C. Voltage Stability Analysis in Medium-Voltage Distribution Networks Using a Second-Order Cone Approximation. Energies 2020, 13, 5717. [Google Scholar] [CrossRef]
- Kang, K.-P.; Cho, Y.; Kim, H.-S.; Baek, J.-w. DC-Link Capacitor Voltage Imbalance Compensation Method Based Injecting Harmonic Voltage for Cascaded Multi-Module Neutral Point Clamped Inverter. Electronics 2019, 8, 155. [Google Scholar] [CrossRef]
- Simiyu, P.; Xin, A.; Wang, K.; Adwek, G.; Salman, S. Multiterminal Medium Voltage DC Distribution Network Hierarchical Control. Electronics 2020, 9, 506. [Google Scholar] [CrossRef]
- Chen, Y.; Yu, S.; Wang, Y.; Yang, R.; Cheng, X. An Improved AC-Link Voltage Matching Control for the Multiport Modular Multilevel DC Transformer in MVDC Applications. Energies 2024, 17, 1346. [Google Scholar] [CrossRef]
- Blázquez, A.; Pérez-Molina, M.J.; Larruskain, D.M.; Iturregi, A.; Eguia, P. Fault Detection Algorithms in Medium-Voltage Direct-Current (MVDC) Grids. Appl. Sci. 2024, 14, 11052. [Google Scholar] [CrossRef]
- Cheng, Q.; Li, X.; Zhang, M.; Fei, F.; Shi, G. Optimal configuration strategy of soft open point in flexible distribution network considering reactive power sources. Energies 2025, 18, 529. [Google Scholar] [CrossRef]
- Zhao, J.; Yao, M.; Yu, H.; Song, G.; Ji, H.; Li, P. Decentralized voltage control strategy of soft open points in active distribution networks based on sensitivity analysis. Electronics 2020, 9, 295. [Google Scholar] [CrossRef]
- Alanazi, M. Optimal integration of distributed generators and soft open points in radial distribution networks: A hybrid WCA-PSO approach. Processes 2025, 13, 1775. [Google Scholar] [CrossRef]
- Li, J.; Zhang, Y.; Lv, C.; Liu, G.; Ruan, Z.; Zhang, F. Coordinated planning of soft open points and energy storage systems to enhance flexibility of distribution networks. Appl. Sci. 2024, 14, 8309. [Google Scholar] [CrossRef]
- Diaaeldin, I.M.; Abdel Aleem, S.H.E.; El-Rafei, A.; Abdelaziz, A.Y.; Zobaa, A.F. Enhancement of hosting capacity with soft open points and distribution system reconfiguration: Multi-objective bilevel stochastic optimization. Energies 2020, 13, 5446. [Google Scholar] [CrossRef]
- Ji, H.; Wang, C.; Li, P.; Ding, F.; Wu, J. Robust operation of soft open points in active distribution networks with high penetration of photovoltaic integration. IEEE Trans. Sustain. Energy 2019, 10, 280–289. [Google Scholar] [CrossRef]
- Sun, F.; Ma, J.; Yu, M.; Wei, W. Optimized two-time scale robust dispatching method for the multi-terminal soft open point in unbalanced active distribution networks. IEEE Trans. Sustain. Energy 2021, 12, 587–598. [Google Scholar] [CrossRef]
- Chen, T.; Song, Y.; Hill, D.J.; Lam, A.Y. Chance-constrained OPF in droop-controlled microgrids with power flow routers. IEEE Trans. Smart Grid 2022, 13, 2601–2613. [Google Scholar] [CrossRef]
- Roald, L.; Andersson, G. Chance-constrained AC optimal power flow: Reformulations and efficient algorithms. IEEE Trans. Power Syst. 2018, 33, 2906–2918. [Google Scholar] [CrossRef]
- Narimani, M.R.; Azizivahed, A.; Naderi, E. An Efficient Scenario-Based Stochastic Energy Management of Distribution Networks with Distributed Generation, PV Module, and Energy Storage. arXiv 2019, arXiv:1910.07109. [Google Scholar]
- Li, P.; Ji, H.; Wang, C.; Zhao, J.; Song, G.; Ding, F.; Wu, J. Coordinated Control Method of Voltage and Reactive Power for Active Distribution Networks Based on Soft Open Point. IEEE Trans. Sustain. Energy 2017, 8, 1430–1442. [Google Scholar] [CrossRef]
- Azizivahed, A.; Gholami, K.; Arefi, A.; Arif, M.T.; Haque, M.E. Utilizing Soft Open Points for Effective Voltage Management in Multi-Microgrid Distribution Systems. Electricity 2024, 5, 1008–1021. [Google Scholar] [CrossRef]
- Attanasio, F.; Wasterlain, S.; Pidancier, T.; Marchesoni, M.; Favre-Perrod, P.; Carpita, M. Low Voltage Soft Open Point with Energy Storage: System Simulation and Prototype Preliminary Test Results. In Proceedings of the 2018 International Symposium on Power Electronics, Electrical Drives, Automation and Motion (SPEEDAM), Amalfi, Italy, 20–22 June 2018; pp. 254–261. [Google Scholar]
- Sarantakos, I.; Peker, M.; Zografou-Barredo, N.-M.; Deakin, M.; Patsios, C.; Sayfutdinov, T.; Taylor, P.C.; Greenwood, D. A Robust Mixed-Integer Convex Model for Optimal Scheduling of Integrated Energy Storage–Soft Open Point Devices. IEEE Trans. Smart Grid 2022, 13, 4072–4087. [Google Scholar] [CrossRef]
- Risi, B.-G.; Riganti-Fulginei, F.; Laudani, A. Modern techniques for the optimal power flow problem: State of the art. Energies 2022, 15, 6387. [Google Scholar] [CrossRef]
- Zhou, Q.; Bialek, J. Simplified calculation of voltage and loss sensitivity factors in distribution networks. In Proceedings of the 16th Power Systems Computation Conference, Glasgow, UK, 14–18 July 2008; pp. 1–6. [Google Scholar]
- Mohajerin Esfahani, P.; Kuhn, D. Data-driven distributionally robust optimization using the Wasserstein metric: Performance guarantees and tractable reformulations. Math. Program. 2017, 171, 115–166. [Google Scholar] [CrossRef]
- Gao, R.; Kleywegt, A.J. Distributionally robust stochastic optimization with Wasserstein distance. arXiv 2016, arXiv:1604.02199. [Google Scholar] [CrossRef]
- Zhao, C.; Guan, Y. Data-driven risk-averse stochastic optimization with Wasserstein metric. Oper. Res. Lett. 2018, 46, 262–267. [Google Scholar] [CrossRef]
- Jiang, R.; Guan, Y. Data-driven chance constrained stochastic program. Math. Program. 2016, 158, 291–327. [Google Scholar] [CrossRef]
- Shen, C.; Liu, H.; Wang, J.; Yang, Z.; Hai, C. Kullback–Leibler Divergence-Based Distributionally Robust Chance-Constrained Programming for PV Hosting Capacity Assessment in Distribution Networks. Sustainability 2025, 17, 2022. [Google Scholar] [CrossRef]
- Han, C.; Cho, S.; Rao, R.R. Distributionally robust optimization-based stochastic operation strategy of soft open points in distribution networks. In Proceedings of the 2024 IEEE Conference on Technologies for Sustainability (SusTech), Portland, OR, USA, 14–17 April 2024; pp. 70–77. [Google Scholar]
- Baran, M.E.; Wu, F.F. Network Reconfiguration in Distribution Systems for Loss Reduction and Load Balancing. IEEE Trans. Power Deliv. 1989, 4, 1401–1407. [Google Scholar] [CrossRef]
- Baran, M.E.; Wu, F.F. Optimal Capacitor Placement on Radial Distribution Systems. IEEE Trans. Power Deliv. 1989, 4, 725–734. [Google Scholar] [CrossRef]
- Das, D.; Kothari, D.; Kalam, A. Simple and Efficient Method for Load Flow Solution of Radial Distribution Networks. Int. J. Electr. Power Energy Syst. 1995, 17, 335–346. [Google Scholar] [CrossRef]


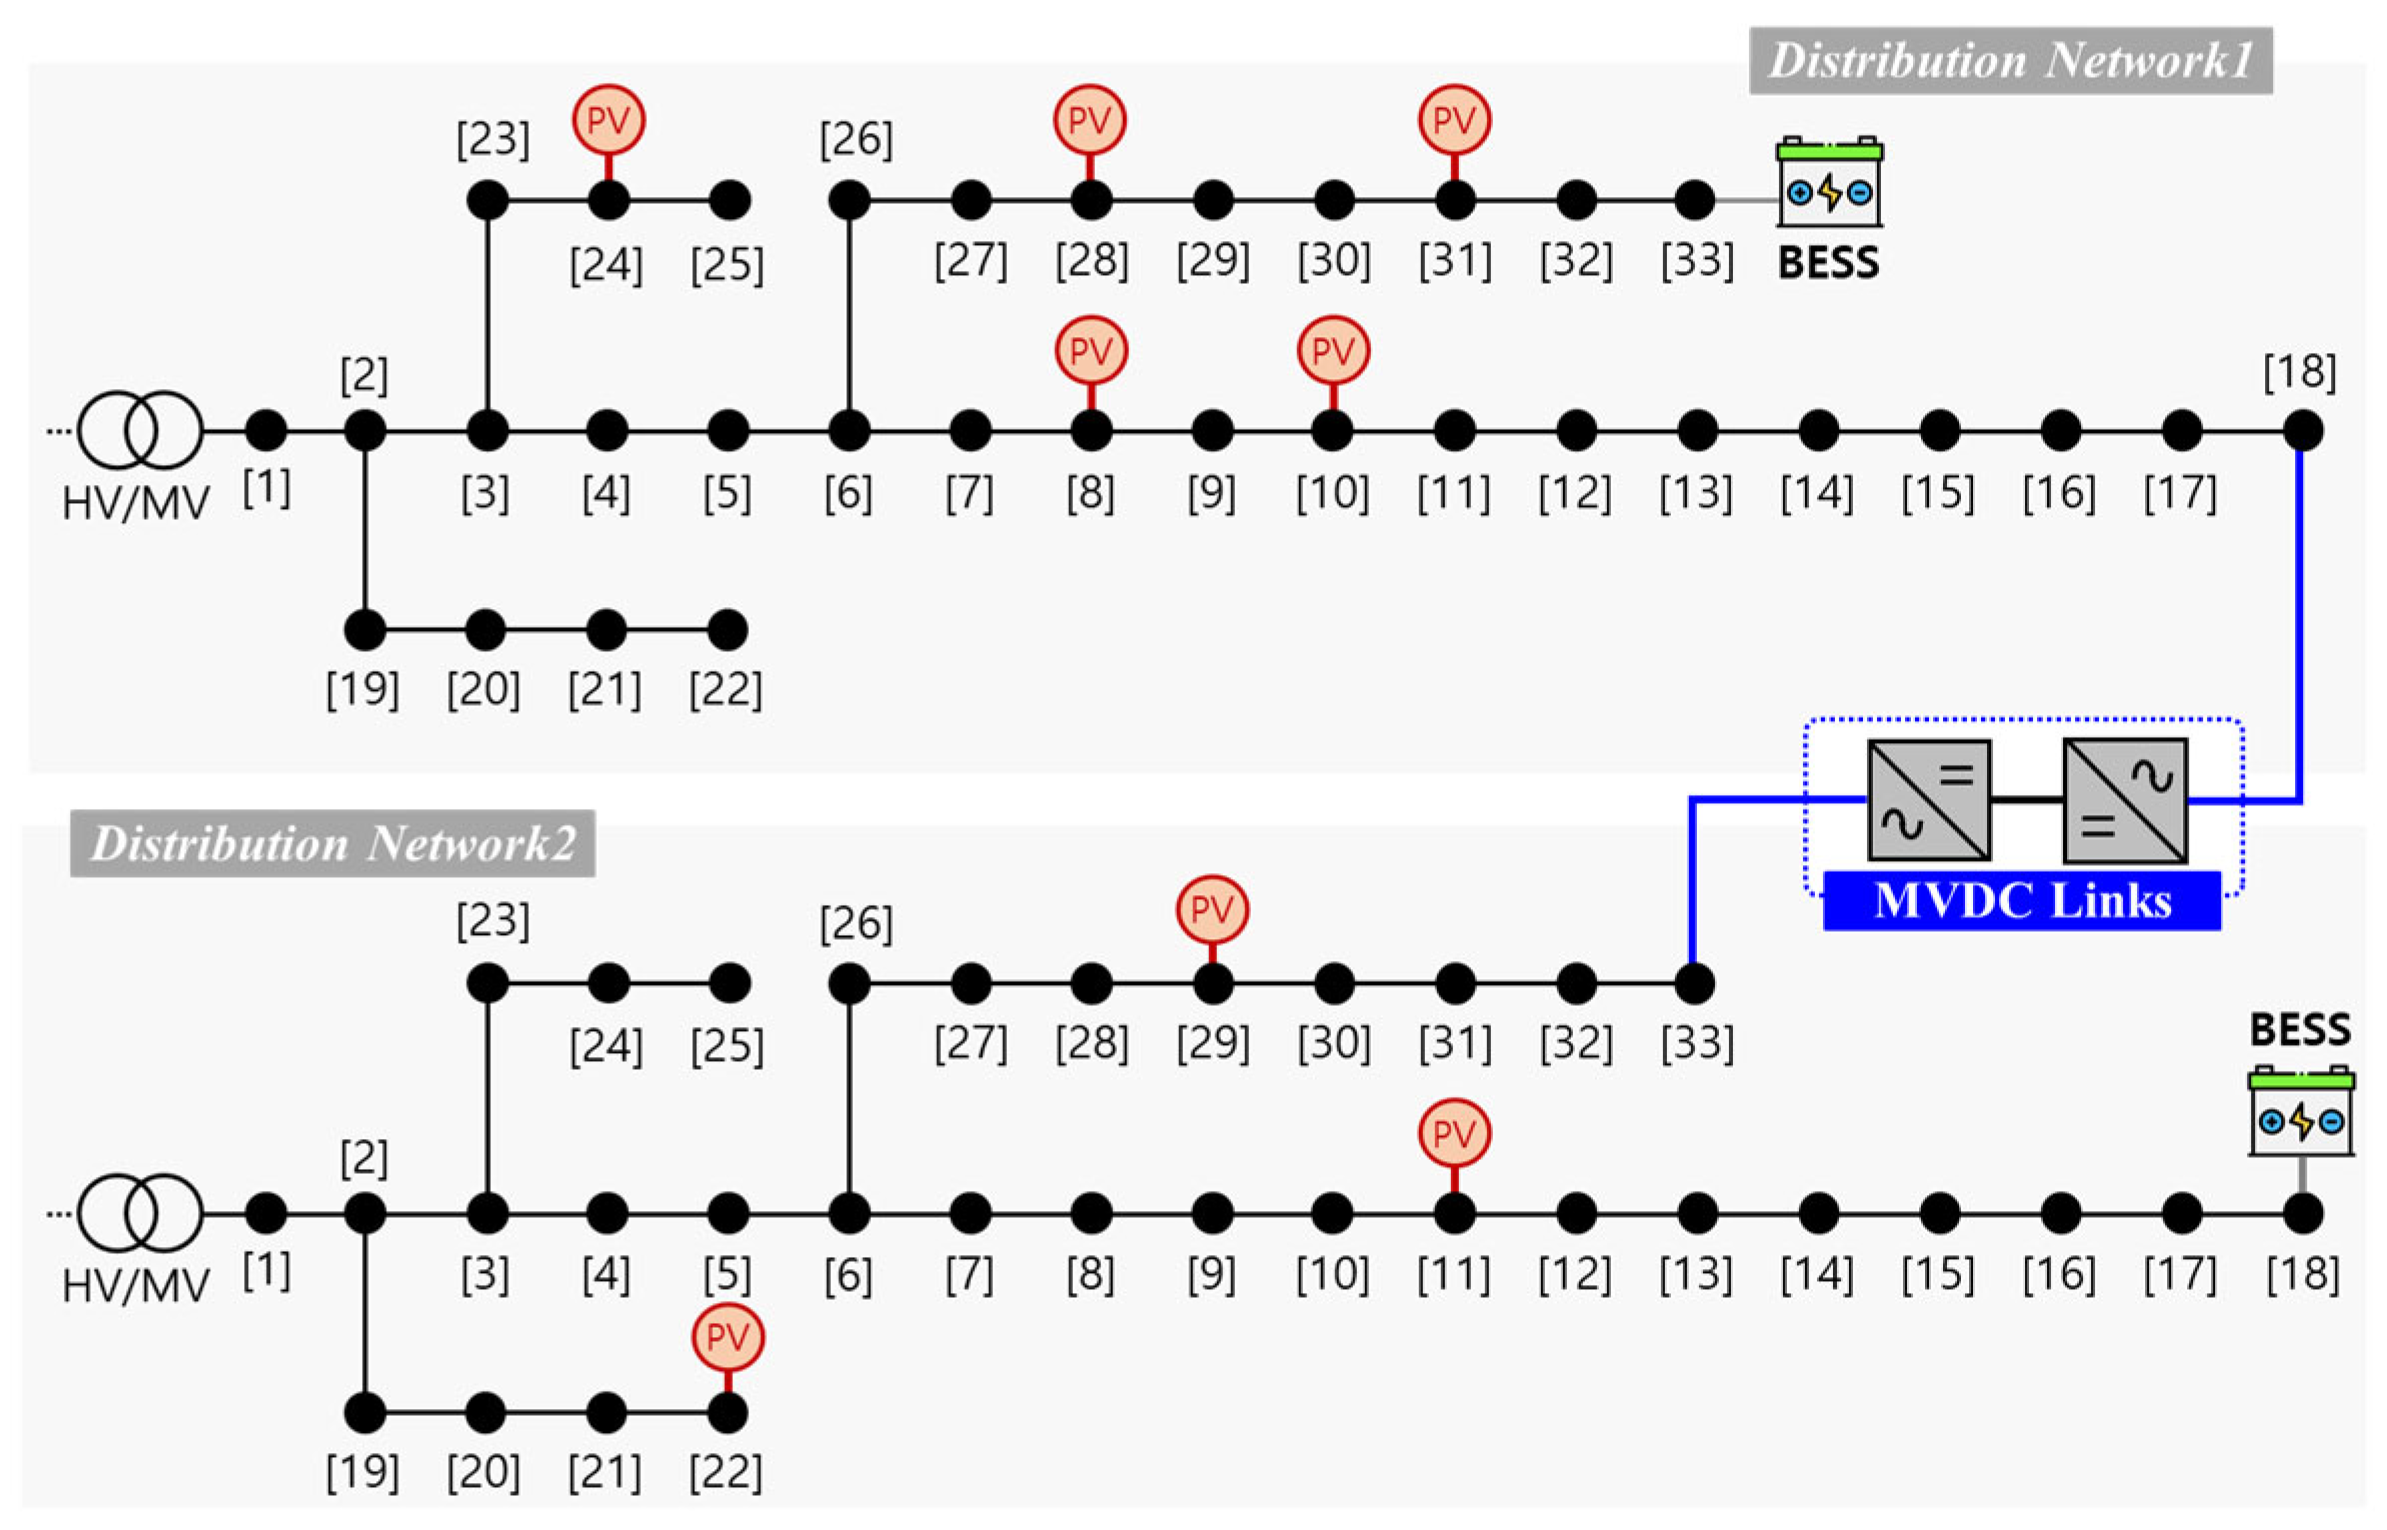
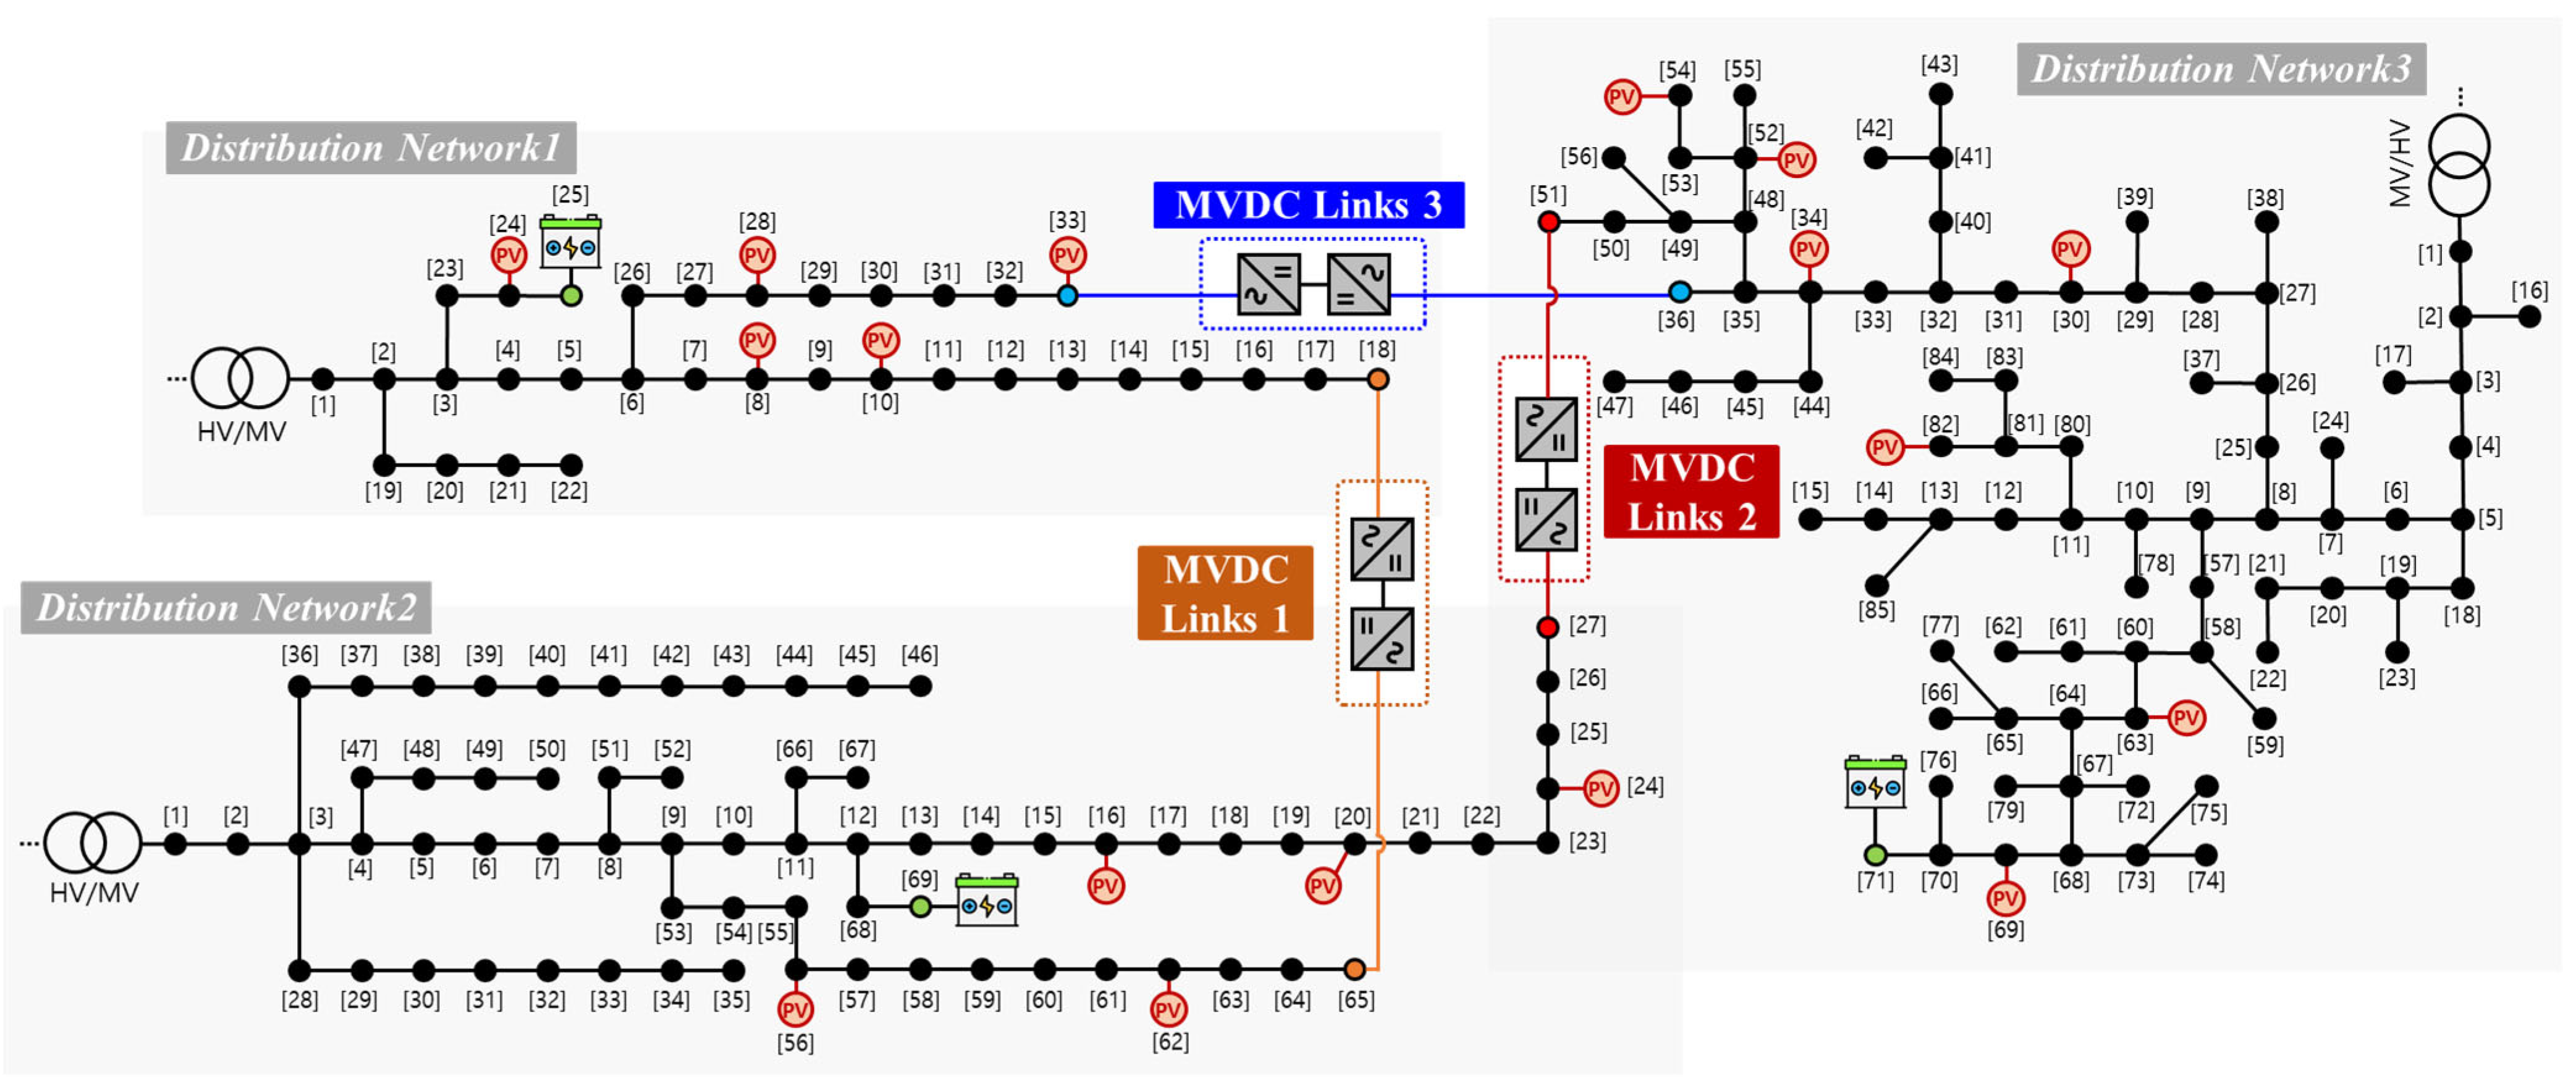
| DN | PV Location | MVDC Link Location | BESS Location |
| 1 | 8, 10, 24, 28, 33 | 18 | 33 |
| 2 | 11, 22, 29 | 33 | 18 |
| DN | PV capacity | MVDC Link Capacity | BESS Capacity |
| 1 and 2 | 700 kVA (Each) | 1000 kVA | 500 kVA/1500 kWh |
| Scenarios | Average Energy Loss Per Day [kWh/day] | Optimal Cost [USD/day] | Bus Voltage Reliability [%] |
|---|---|---|---|
| I | 3490.90 | 132.86 | 0 |
| II | 2237.10 | −53.38 | 75.17 |
| III | 2403.20 | −33.96 | 100 |
| IV | 2255.37 | −49.14 | 96.83 |
| Bus Voltage Confidence Level | Average Energy Loss Per Day [kWh/day] | Cost Improvement [%] | Bus Voltage Reliability [%] |
|---|---|---|---|
| 95% | 2255.37 | 44.7 | 96.83 |
| 90% | 2251.02 | 47.1 | 95.40 |
| 85% | 2247.87 | 49.8 | 92.40 |
| 80% | 2244.49 | 51.2 | 90.03 |
| Radius of Ambiguity Set | Average Energy Loss Per Day [kWh/day] | Cost Improvement [%] | Bus Voltage Reliability [%] |
|---|---|---|---|
| 0.001 | 2248.21 | 49.2 | 91.67 |
| 0.002 | 2250.54 | 47.1 | 94.73 |
| 0.003 | 2255.37 | 44.7 | 96.83 |
| 0.005 | 2270.79 | 38.7 | 98.63 |
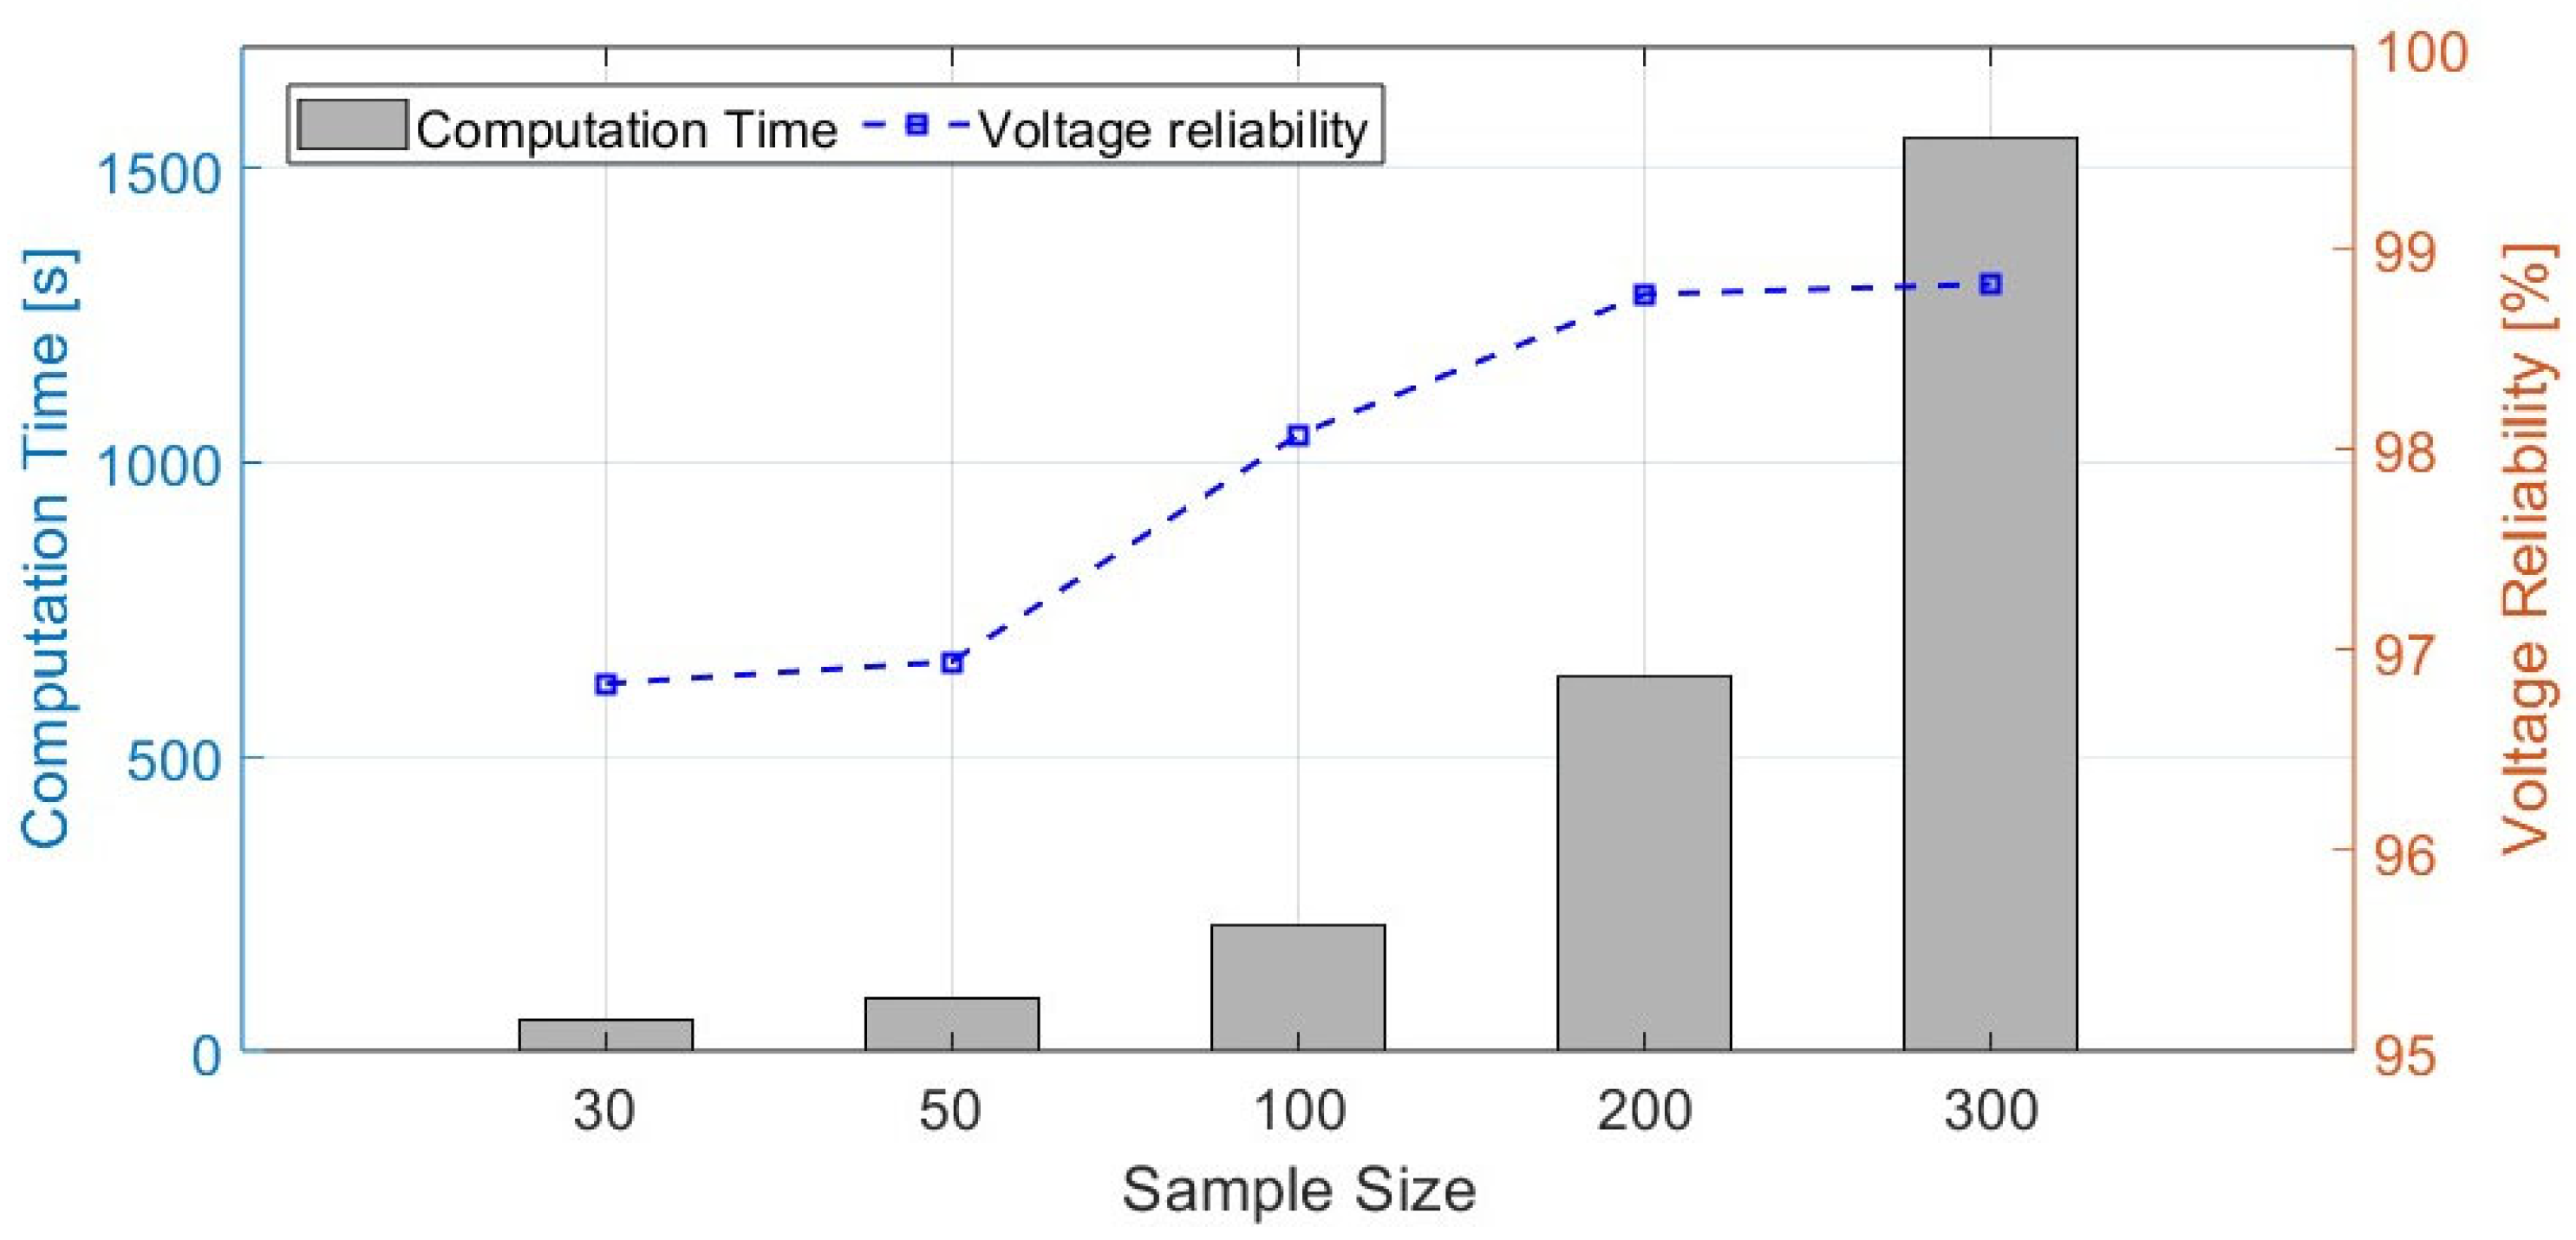
| Sample Sizes | 30 | 50 | 100 | 200 | 300 |
|---|---|---|---|---|---|
| Cost Improvement [%] | 44.7 | 42.8 | 41.0 | 39.7 | 38.9 |
| Bus voltage reliability [%] | 96.83 | 96.94 | 98.07 | 98.77 | 98.82 |
| Computation time [s] | 53.05 | 90.13 | 212.95 | 635.59 | 1550.37 |
| DN | PV Location | MVDC Link Location | BESS Location | ||
|---|---|---|---|---|---|
| MVDC1 | MVDC2 | MVDC3 | |||
| 1 (IEEE-33) | 8, 10, 24, 28, 33 | 18 | - | 33 | 25 |
| 2 (IEEE-69) | 16, 20, 24, 56, 62 | 65 | 27 | 36 | 69 |
| 3 (IEEE-85) | 30, 34, 52, 54, 63, 69, 82 | - | 51 | - | 71 |
| DN | PV Capacity | MVDC Link Capacity | BESS Capacity | ||
| 1 and 2 | 700 kVA (Each) | 1000 kVA | 500 kVA/1500 kWh | ||
| 3 | 500 kVA (Each) | 1000 kVA | 500 kVA/1500 kWh | ||
| Scenarios | Bus Voltage Confidence Level | Optimal Cost [USD/Day] | Cost Improvement [%] | Bus Voltage Reliability [%] |
|---|---|---|---|---|
| II | - | 325.19 | 35.17 | 25.4 |
| III | 100% | 501.64 | - | 100 |
| IV | 95% | 403.12 | 19.64 | 98.86 |
| 90% | 381.11 | 24.03 | 94.60 | |
| 85% | 371.40 | 25.96 | 90.30 | |
| 80% | 365.52 | 27.13 | 84.50 |
Disclaimer/Publisher’s Note: The statements, opinions and data contained in all publications are solely those of the individual author(s) and contributor(s) and not of MDPI and/or the editor(s). MDPI and/or the editor(s) disclaim responsibility for any injury to people or property resulting from any ideas, methods, instructions or products referred to in the content. |
© 2025 by the authors. Licensee MDPI, Basel, Switzerland. This article is an open access article distributed under the terms and conditions of the Creative Commons Attribution (CC BY) license (https://creativecommons.org/licenses/by/4.0/).
Share and Cite
Han, C.; Song, S.; Lee, J. Stochastic Operation of BESS and MVDC Link in Distribution Networks Under Uncertainty. Electronics 2025, 14, 2737. https://doi.org/10.3390/electronics14132737
Han C, Song S, Lee J. Stochastic Operation of BESS and MVDC Link in Distribution Networks Under Uncertainty. Electronics. 2025; 14(13):2737. https://doi.org/10.3390/electronics14132737
Chicago/Turabian StyleHan, Changhee, Sungyoon Song, and Jaehyeong Lee. 2025. "Stochastic Operation of BESS and MVDC Link in Distribution Networks Under Uncertainty" Electronics 14, no. 13: 2737. https://doi.org/10.3390/electronics14132737
APA StyleHan, C., Song, S., & Lee, J. (2025). Stochastic Operation of BESS and MVDC Link in Distribution Networks Under Uncertainty. Electronics, 14(13), 2737. https://doi.org/10.3390/electronics14132737