1. Introduction
A terahertz wave refers to an electromagnetic wave between microwave and infrared waves, with a frequency range of 0.1–10 THz [
1]. It is characterized by low photon energy, strong penetration ability, and water absorption [
2]. A metamaterial is an artificially designed synthetic material with electromagnetic properties that materials in nature do not have [
3,
4,
5]. By adjusting its unit structure, the local electric field can be enhanced to strengthen the interaction between electromagnetic waves and matter [
6]. A change in the refractive index of the surrounding environment can translate into a significant change in electromagnetic properties, so metamaterials can be used in the field of sensing [
7].
In recent years, terahertz sensing and metamaterials have been combined as an efficient, non-destructive, and label-free detection technology that is widely used in optical devices and detectors, such as terahertz modulators, terahertz switches, terahertz lenses, and terahertz sensors [
8,
9,
10,
11,
12,
13,
14]. Landy et al. [
15] first proposed a single-band metamaterial absorber with high absorption in the microwave band. Saadeldin et al. [
16] provided a nearly perfect metamaterial absorber design, which achieved an absorption rate of 0.99 at 2.249 THz and a high sensitivity of 300 GHz/RIU in the refractive index range of 1.0 to 1.39. Guo et al. [
17] designed a terahertz metamaterial biosensor based on an open-square-ring resonant structure, which generated an extremely narrow absorption peak with a sensitivity of 91.5 GHz/RIU when the refractive index of the analyte increased from 1.0 to 1.8. Xiao et al. [
18] proposed a compact graphene metamaterial sensor and analyzed the mechanism of its electromagnetically induced transparency (EIT) effect. The EIT effect was excited by the strong coupling of light and dark modes, resulting in a refractive index sensitivity of 2.828 THz/RIU. Recently, Qu et al. [
19] created a high-performance terahertz microfluidic sensor based on Fabry–Perot resonance, which achieved dual-band absorption in the frequency range of 0.2–1.2 THz, with sensitivities of 159 GHz/RIU and 226 GHz/RIU, respectively, and realized the detection of edible oil. Since metamaterial absorbers were introduced into the field of terahertz sensing and detection, researchers have continuously explored methods to improve their sensing performance. On the one hand, adjusting the structure of the metal resonance unit on the surfaces of metamaterials can provide a sharper resonance peak and then optimize the Q value of the sensor to achieve a leap in sensitivity. On the other hand, carefully planning the structure of the resonance unit and constructing a metamaterial absorber with multiple resonance peaks can achieve accurate multi-point docking between the sensor and the characteristic frequency of the substance to be measured, which can enrich the information dimension reflecting the difference between substances [
20].
In recent years, the combination of microfluidic technology [
21] and metamaterials has provided a new method for the detection of liquid samples [
22]. The height of the microfluidic channel, that is, the volume of the measured analyte, is on the order of micrometers, which greatly reduces the influence of water on terahertz waves. When the electromagnetic wave is incident, the Fabry–Perot structure of the metamaterial absorber binds the energy of the incident wave to the cavity of the absorber; the analyte in the channel acts as the dielectric layer of the absorber, which coincides with the reflecting cavity, thus enhancing the local electric field and effectively improving the sensitivity of the sensor [
23]. Metamaterial absorbers integrated with microfluidic technology have made great progress in improving selectivity for VOC detection. Enric perarnau et al. [
24] assumed that the thickness and properties of the polymer layer played a key role in affecting the selectivity of microchannels and proved the potential of using microfluidic gas detectors in environmental monitoring. Ghazi et al. [
25] developed a sensor for the selective detection of VOCs and proved that the radius and number of microfeatures of the microfluidic channels played a significant role in improving the selectivity of the sensor. Guo et al. [
26] designed a novel microfluidic chip based on the 4-aminohydrazine-5-mercapto-1,2,4-triazole (AHMT) method for the detection of formaldehyde. The sensor was almost unaffected by acetaldehyde, other VOCs, and acid–base conditions, demonstrating high selectivity.
Although many sensing structures for multi-band absorption have emerged based on metamaterial absorbers integrated with microfluidics, many shortcomings remain. For example, in pursuit of higher sensing sensitivity, metamaterial structures have advanced from two-dimensional to three-dimensional [
27,
28,
29]. Although the three-dimensional structure can expand the electromagnetic field to three-dimensional space and strengthen the interaction between the analyte and electromagnetic wave, it also directly increases the manufacturing difficulty. In addition, most of the terahertz microfluidic sensors reported above are based on the dipole resonance mechanism. Terahertz microfluidic sensors designed based on this mechanism have a low Q value and a wide FWHM during resonance. As is well known, the Q value reflects the sensor’s ability to store electromagnetic wave energy. A large Q value is often closely related to the high sensitivity and stability of the sensor and is the key index that must be considered in the sensor design. Meanwhile, a narrow FWHM reflects the strong anti-interference and detail resolution abilities of the sensor. A high Q value and a narrow FWHM can be regarded as the two core elements affecting the sensing performance. However, few reported terahertz microfluidic sensors can simultaneously meet both requirements.
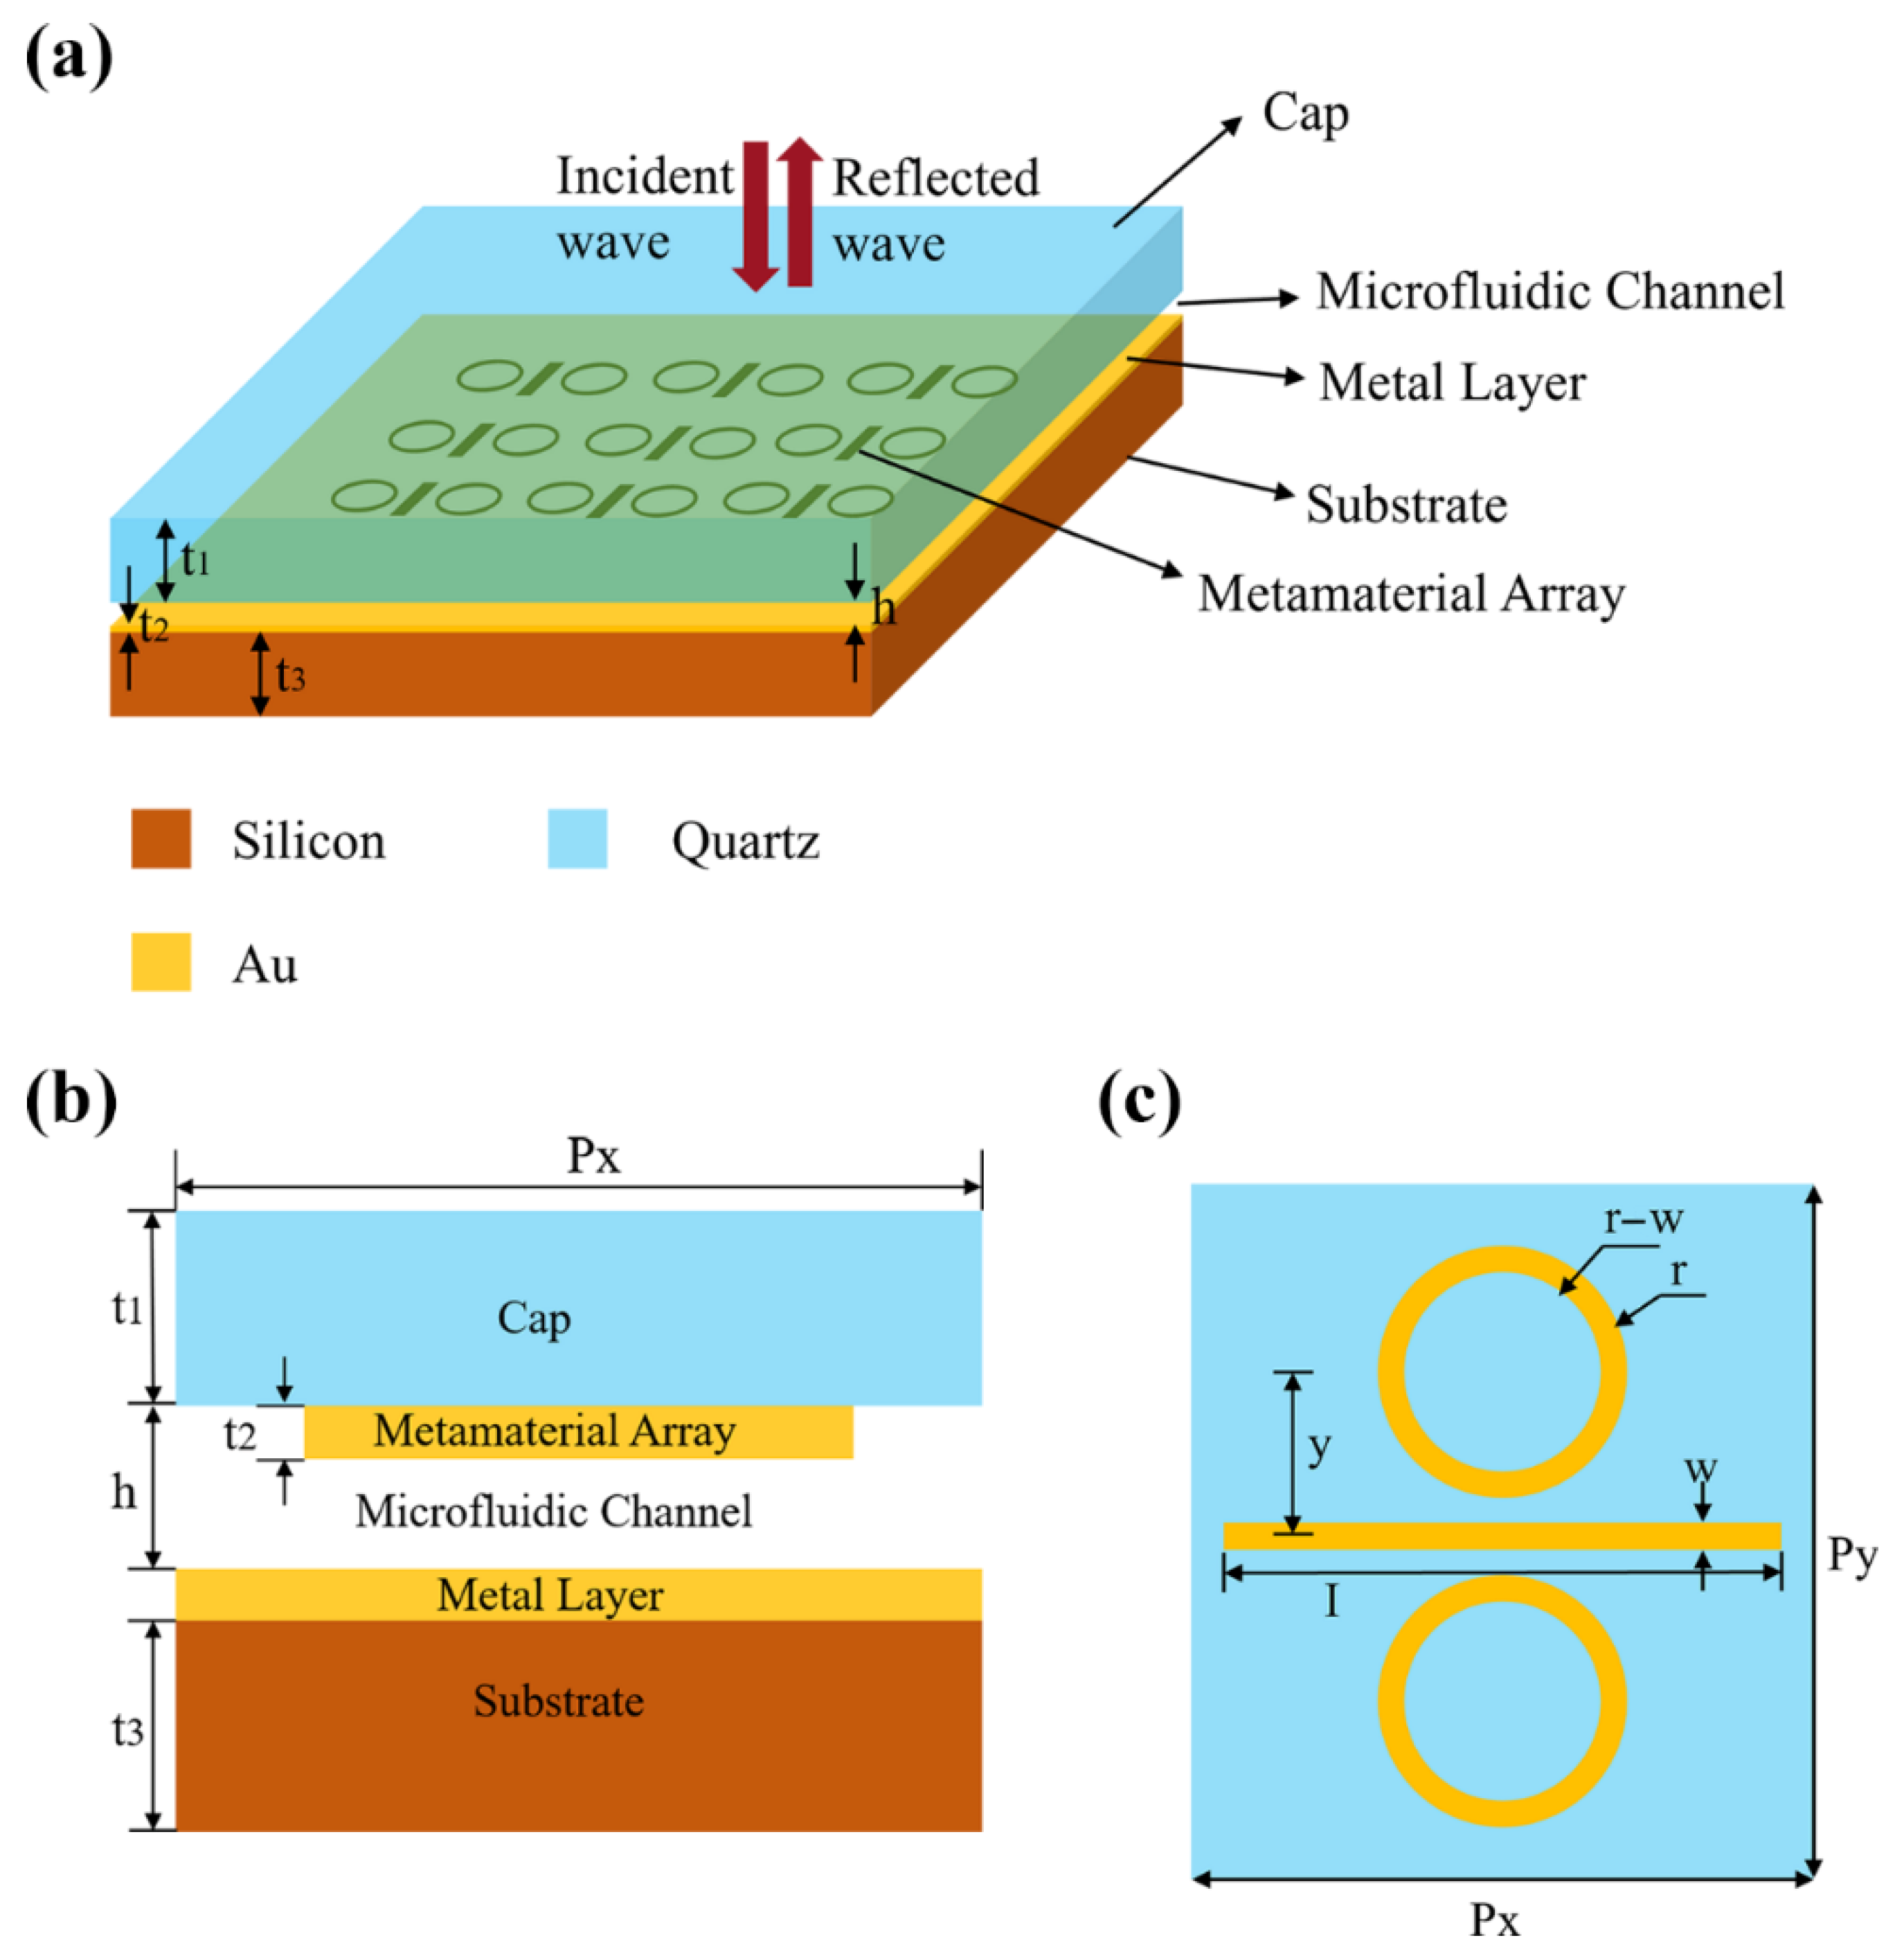
A multi-band terahertz sensor combining a high-order response and microfluidics is proposed in this paper. Its resonant unit structure is simple and is composed of two ring-shaped structures and a rectangular-shaped structure. It can produce three resonance peaks in the frequency range of 0.7–1.6 THz, with absorption rates of 0.976, 0.864, and 0.977, and the corresponding Q values are 21, 19, and 123, respectively. Compared with previous microfluidic multi-band sensors, this absorption sensor can achieve a higher Q value and narrower FWHM and has a simple structure that is easy to manufacture. The simulation results show that this design can achieve high-order resonance at specific frequencies through this simple structure, and the sensor sensitivity can reach 400 GHz/RIU, which has great application advantages in the field of VOC sensing.
3. Results and Discussion
The absorption of electromagnetic waves by the sensor can be expressed as follows:
where
is the absorption rate,
is the reflectivity, and
is the transmissivity. The microfluidic channel acts as the dielectric layer of the Fabry–Perot cavity. When a terahertz wave is incident, the Fabry–Perot structure of the metamaterial absorber binds the energy of the incident wave to the cavity of the absorber; a schematic diagram of its optical path is shown in
Figure 2. From top to bottom are the metal array, the absorption dielectric layer in the channel, and the metal reflection layer. When a terahertz wave is incident to this structure from the upper cover layer, one part of the terahertz wave at the interface between the cover layer and the dielectric (including metal arrays and analytes in channels) is reflected into the cover layer, and the other part enters the channel dielectric layer and continues to propagate. Because the thickness of the metal reflection layer is much greater than the skin depth of the terahertz wave in the metal, the terahertz wave cannot pass through the metal layer, so when it reaches the metal reflection layer, total reflection occurs. At this time,
. The electromagnetic wave reflected by the bottom metal layer will reach the cover dielectric interface again to reflect and transmit. The transmitted part will enter the cover layer, and the reflected part will continue to propagate in the channel dielectric layer and continue to reflect and transmit. The theory of destructive interference in a Fabry–Perot structure can be expressed as
where
k0 represents the free-space wavenumber,
d represents the thickness of the dielectric layer (the channel height h),
represents its reflection phase, and
N represents the resonance order. Here,
n is the effective refractive index that includes the localized field effect of metasurfaces, reflecting the macroscopic optical response of the analyte in non-uniform electromagnetic fields. When the electromagnetic wave is reflected from the bottom metal reflector to the interface between the cover layer and the dielectric, the phase difference between the two reflected or transmitted waves can be an integral multiple of 2 π by designing the appropriate channel height. At this time, the electromagnetic wave meets the cancellation interference condition and
can be obtained. At this point, the Fabry–Perot cavity satisfies the resonance condition, 2
nh = Nλ, where
λ is the wavelength of the incident electromagnetic wave, and the sensor achieves perfect absorption.
In the structural composition of metamaterials, the metal structure under the cover occupies a key position and constitutes the main part of a metamaterial. When the electromagnetic wave penetrates the cover and enters the channel, it will interact with the metasurface and then cause the resonance phenomenon. It is worth noting that there is a close and significant correlation between the absorption frequency of the sensor and the resonance frequency induced by the metasurface. When the resonant structure is carefully designed, the sensor successfully shows three absorption peaks with a high absorption rate.
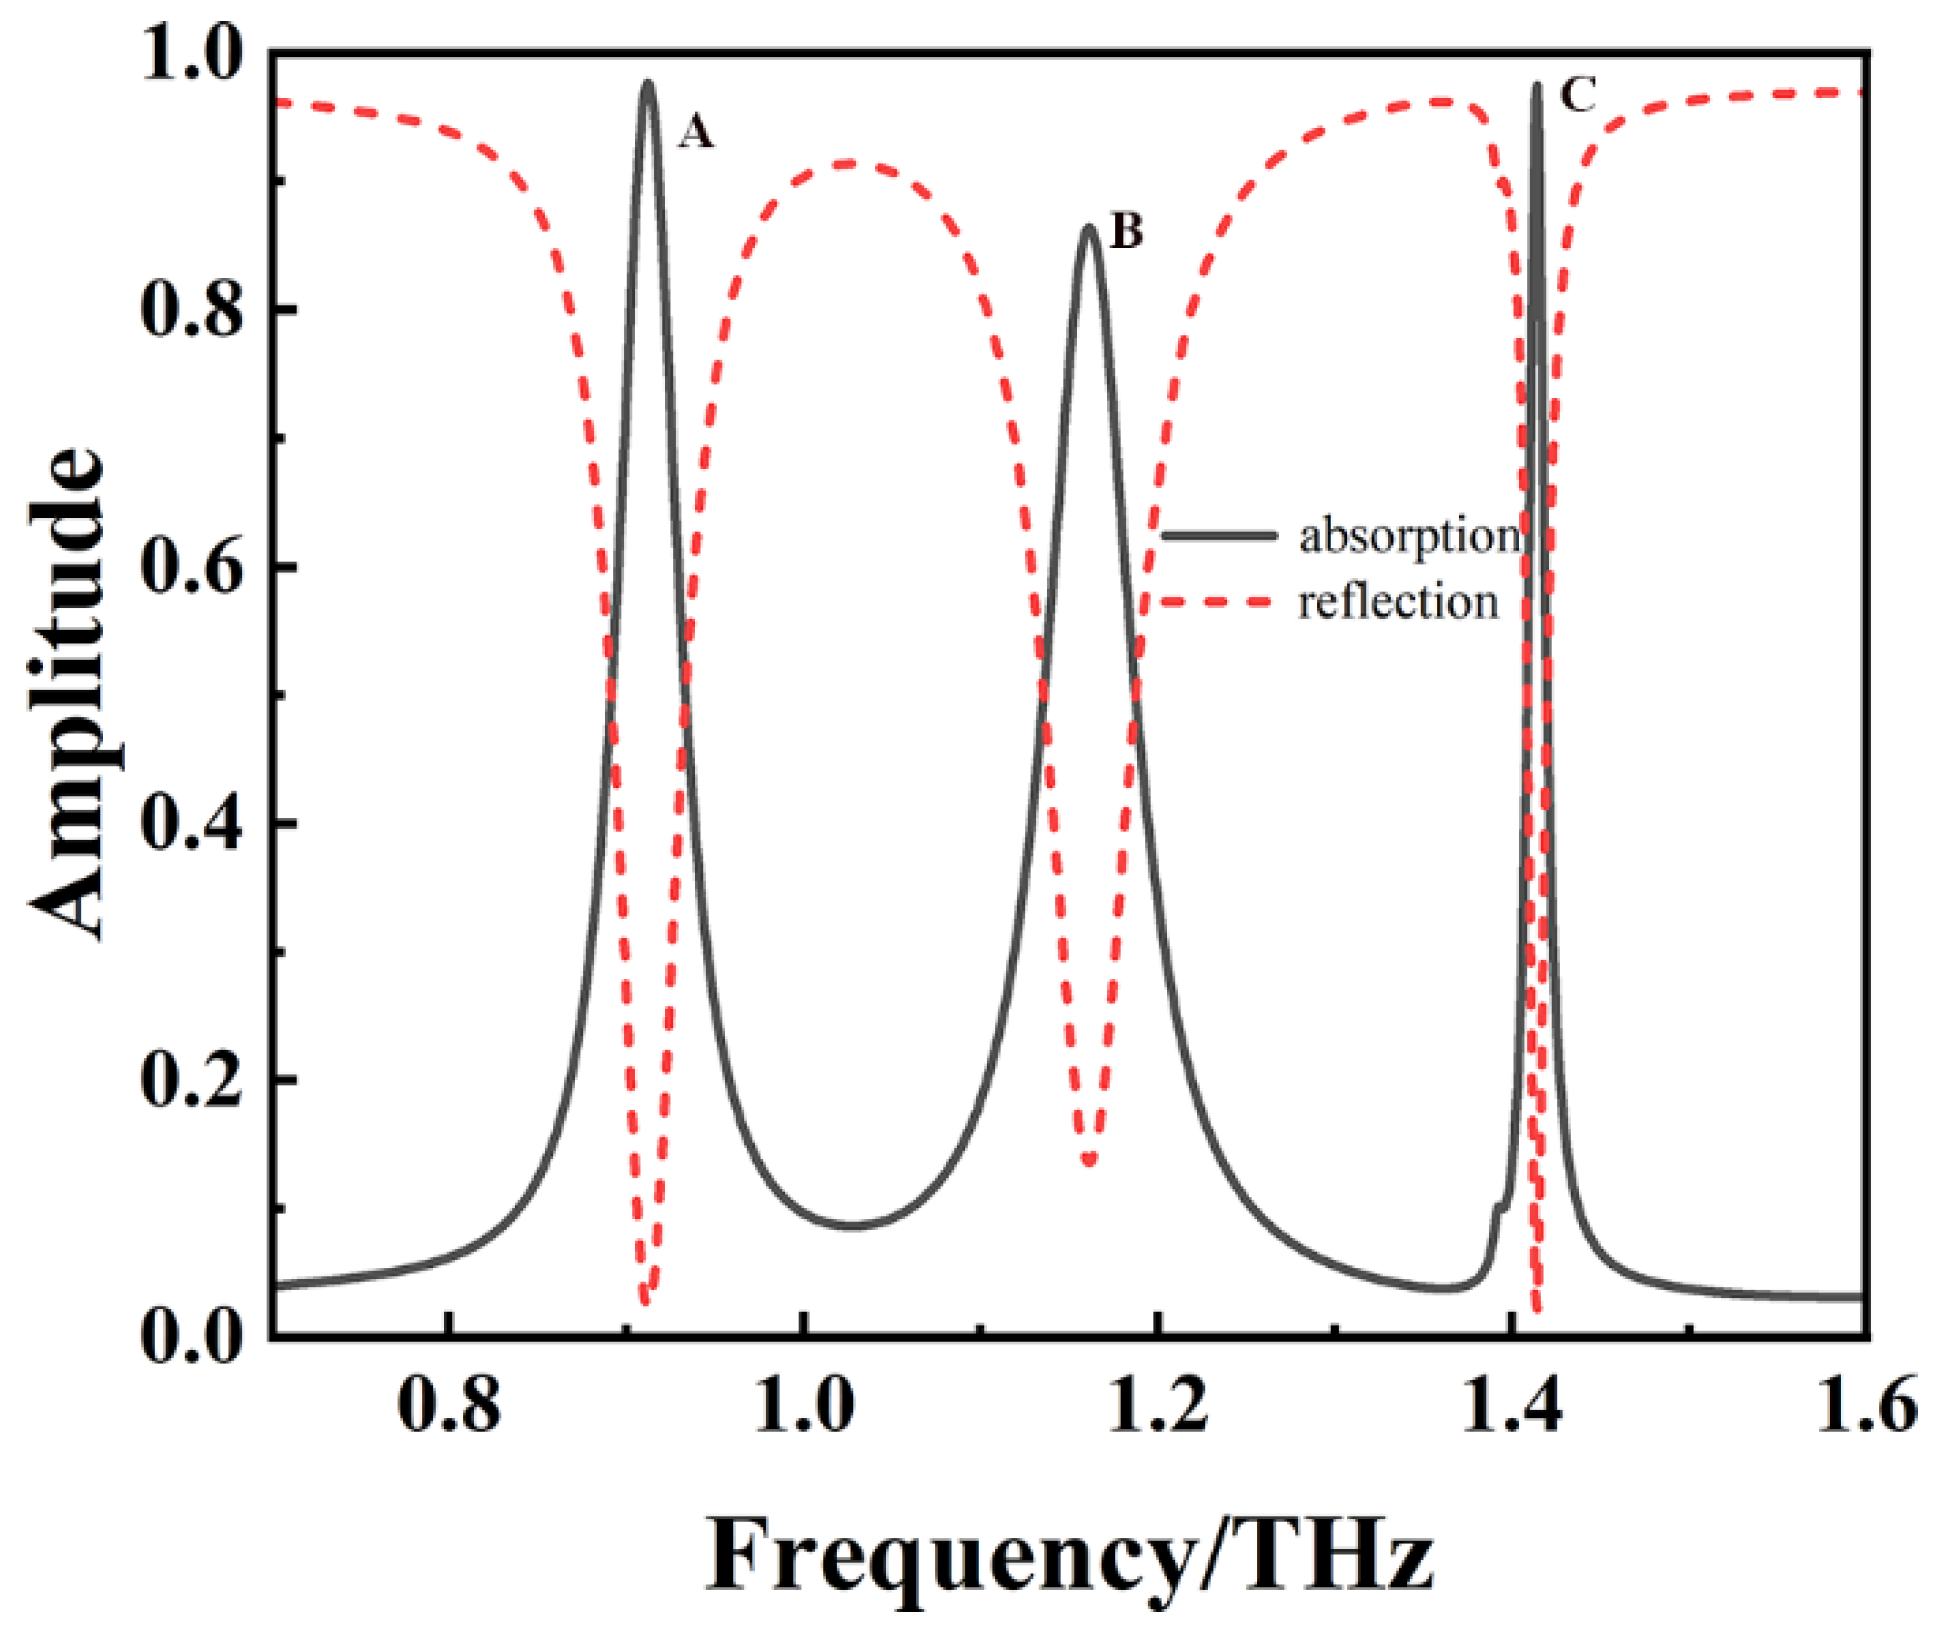
Figure 3 shows the absorption spectrum of the sensor in the 0.7 THz to 1.6 THz band when the refractive index
n of the analyte in the channel is 1.3. The black curve represents absorptivity, and the red curve represents reflectivity. At the three frequency points of 0.912 THz, 1.161 THz, and 1.414 THz, the absorptivity of the sensor rises to the maximum, and the specific values are 0.976, 0.864, and 0.977, respectively. These are named modes A, B, and C, respectively. According to the relevant definitions of Q value and FWHM [
30], mode A has a Q value of 21 and an FWHM of 42.9 GHz; mode B has a Q value of 19 and an FWHM of 61.2 GHz; and mode C has a Q value as high as 123 and an FWHM of 11.5 GHz. Obviously, the Q value and FWHM of the third resonance peak are significantly higher and lower, respectively, than those of the first two. Thus, the formation mechanism of the third absorption peak is much different from that of the first two peaks. The following results also show that the higher-order response absorption peak of mode C is generated by the combination of dipole resonance and lattice surface resonance.
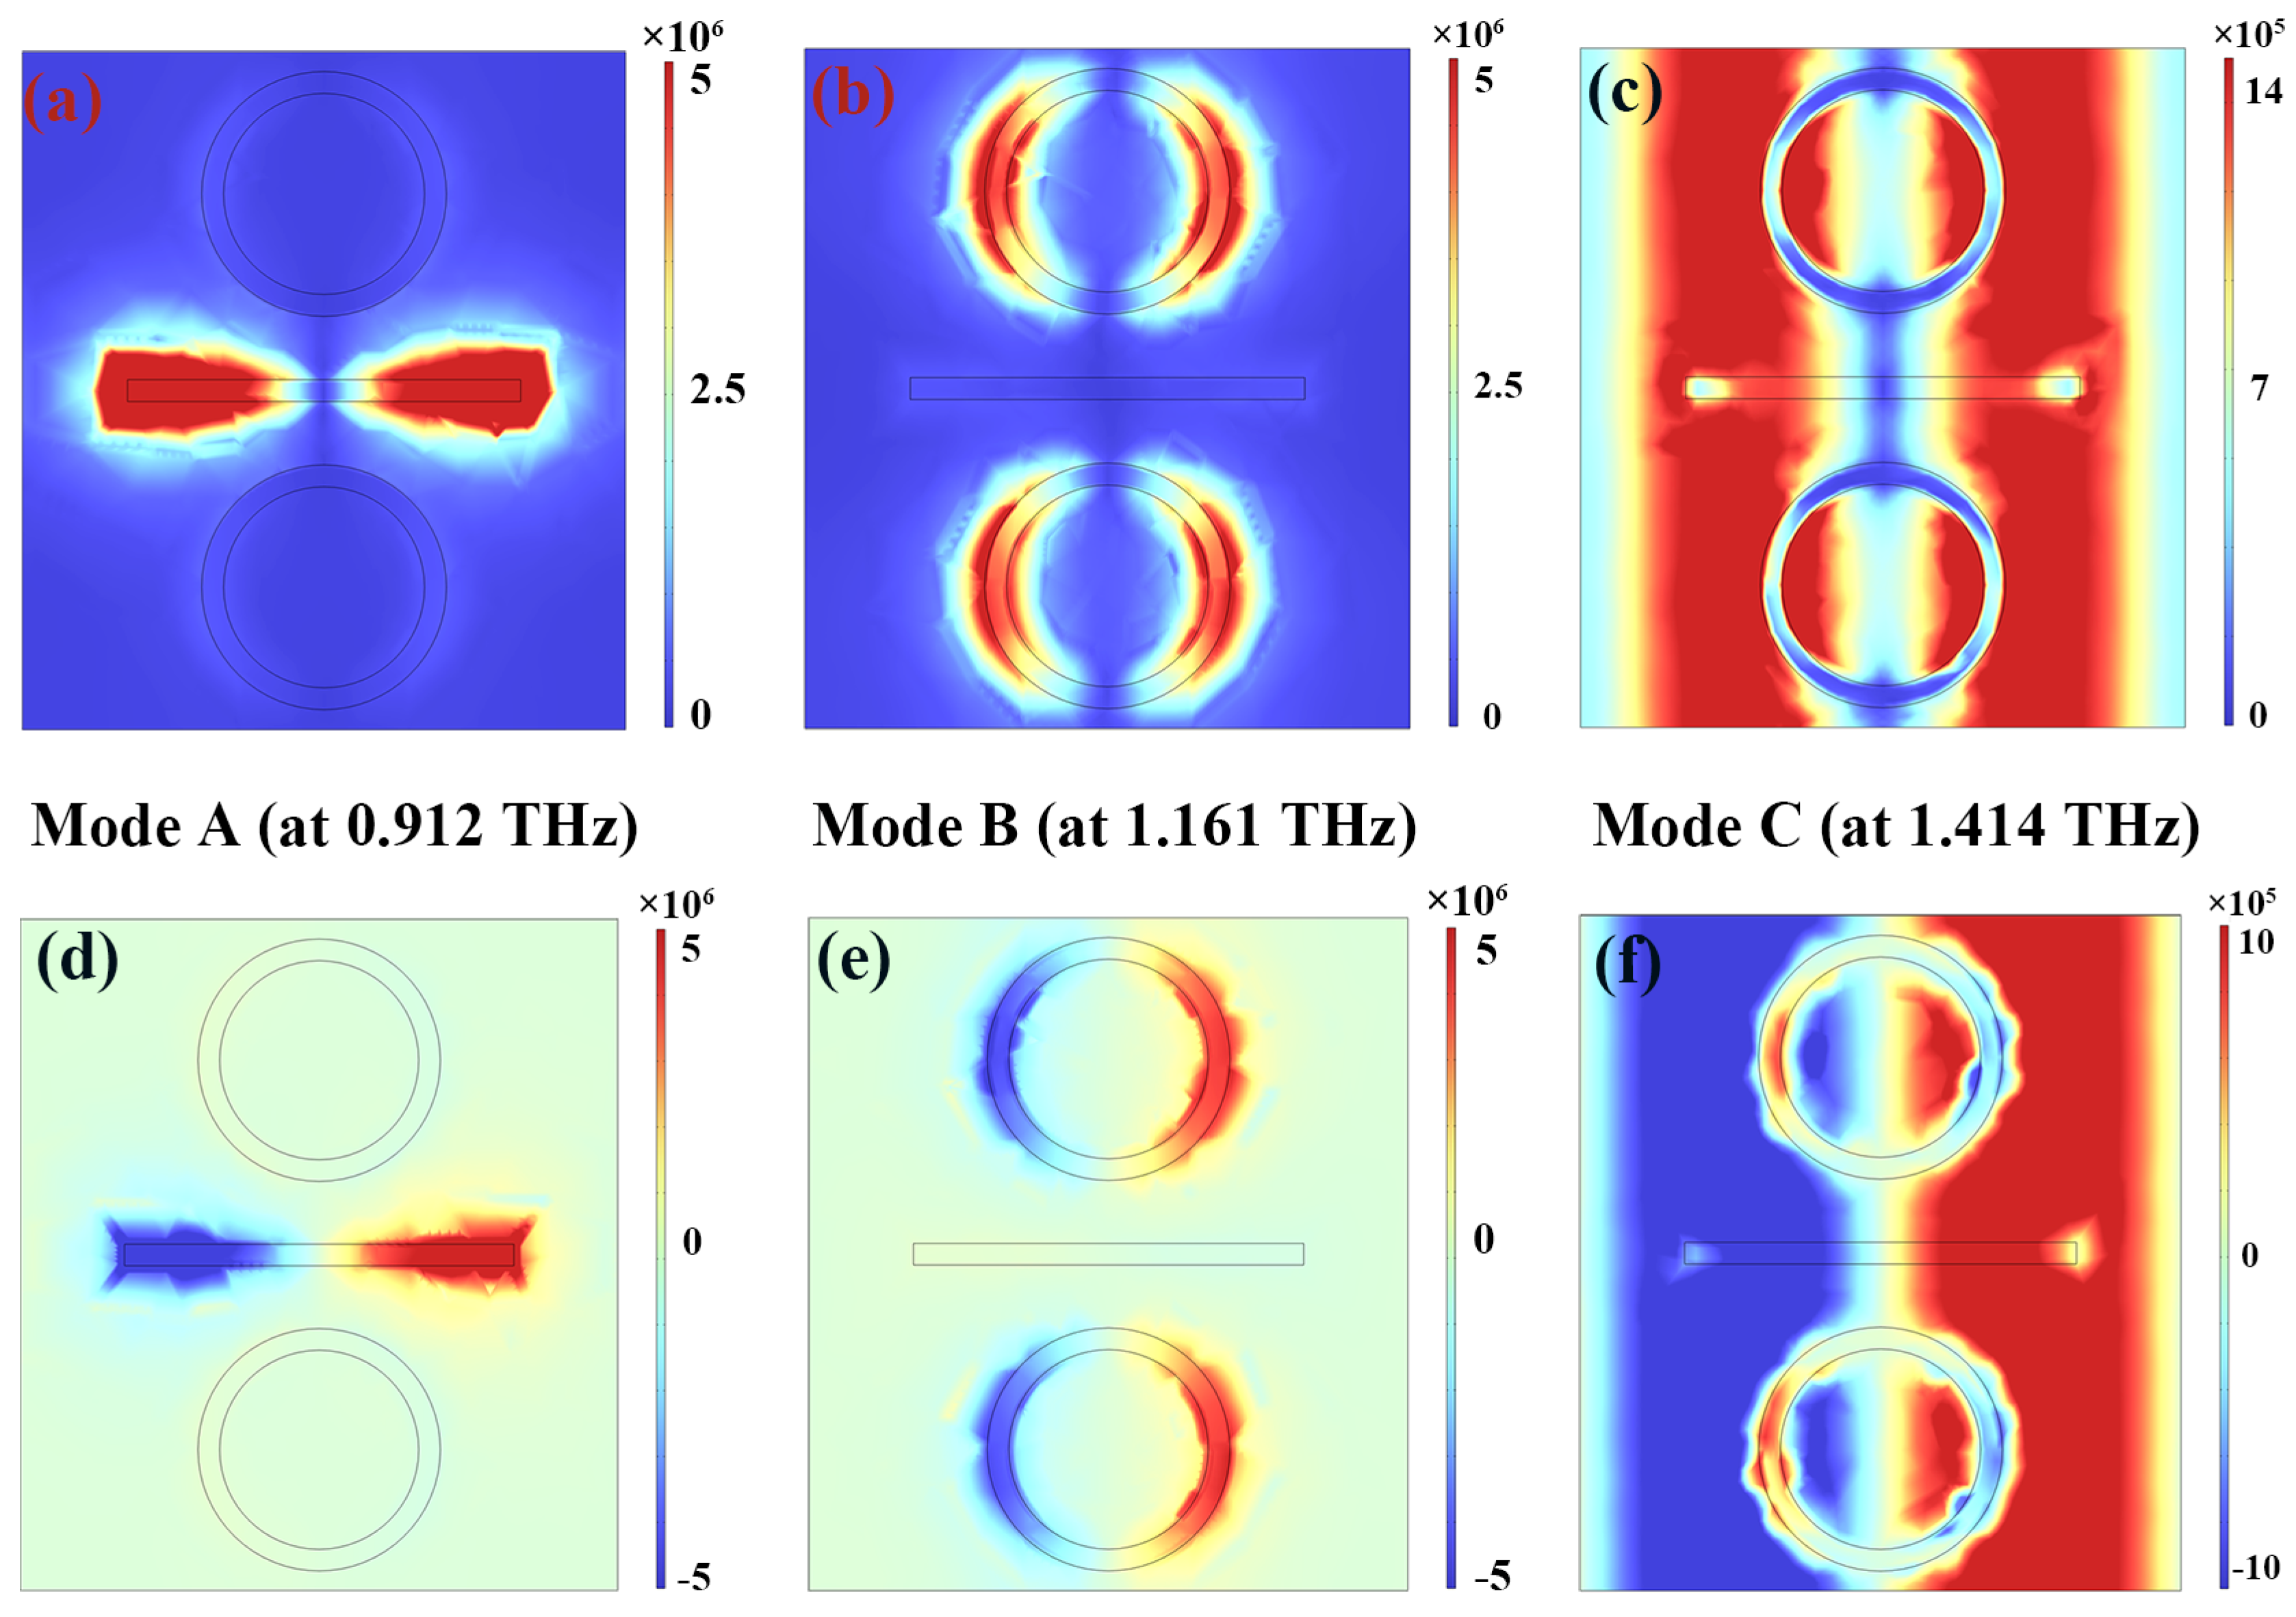
In order to further explain the physical mechanism of the resonant absorption of the sensor, the near-field distribution of the metal resonant unit structure at the resonant frequency is shown in
Figure 4. In the case of sensor mode A shown in
Figure 4a,d, the electric field and its z-component show obvious distribution characteristics; that is, they are mainly concentrated at both ends of the rectangular structure, while in the area outside the rectangular structure, the electric field accumulation phenomenon is almost zero. The distribution law of the z-component of the electric field is consistent with this, and the electric field distribution is typical of the dipole resonance mode. This phenomenon strongly indicates that the incident terahertz wave reacts with the sensor to produce dipole resonance. Similarly, for mode B, as shown in
Figure 4b,e, the electric field and its z-component for the sensor are mainly distributed on the metal arms on both sides of the two metal ring structures. In the rest of the metal ring, the concentration of the electric field is extremely weak. It can be seen that the electric field component of the incident terahertz wave and the resonant ring in the sensor also cause dipole resonance. In this process, the incident electromagnetic wave energy is largely absorbed due to the resonance characteristics of the metal structure and manifests as two absorption peaks with high absorptivity, modes A and B, in the spectrum. In summary, the dipole resonance generated by two metal structures with different shapes can form two resonance peaks with different frequencies and different absorptivities, which proves that building a multi-resonance sensing system by combining different metal structures is an effective method. However, the resonance mode of mode C is significantly different from that of modes A and B. In
Figure 4c,f, the distribution of the resonant electric field and the z-component of the electric field can be clearly observed. The electric field is distributed not only at both ends of the ring and rectangular structures but also in the non-metallic area inside the unit, and the coverage of the electric field in the non-metallic area far exceeds that on the metal arm. Therefore, mode C does not rely solely on the dipole resonance generated by the metal structure but on the high-order response caused by the synergistic effect of dipole resonance and lattice surface resonance. Compared with modes A and B, mode C has a greater electromagnetic field overlap with analytes in microfluidics; that is, its Q value is quite large, and the FWHM is abnormally narrow. These two characteristics are exactly the key conditions for the preparation of high-sensitivity sensors.
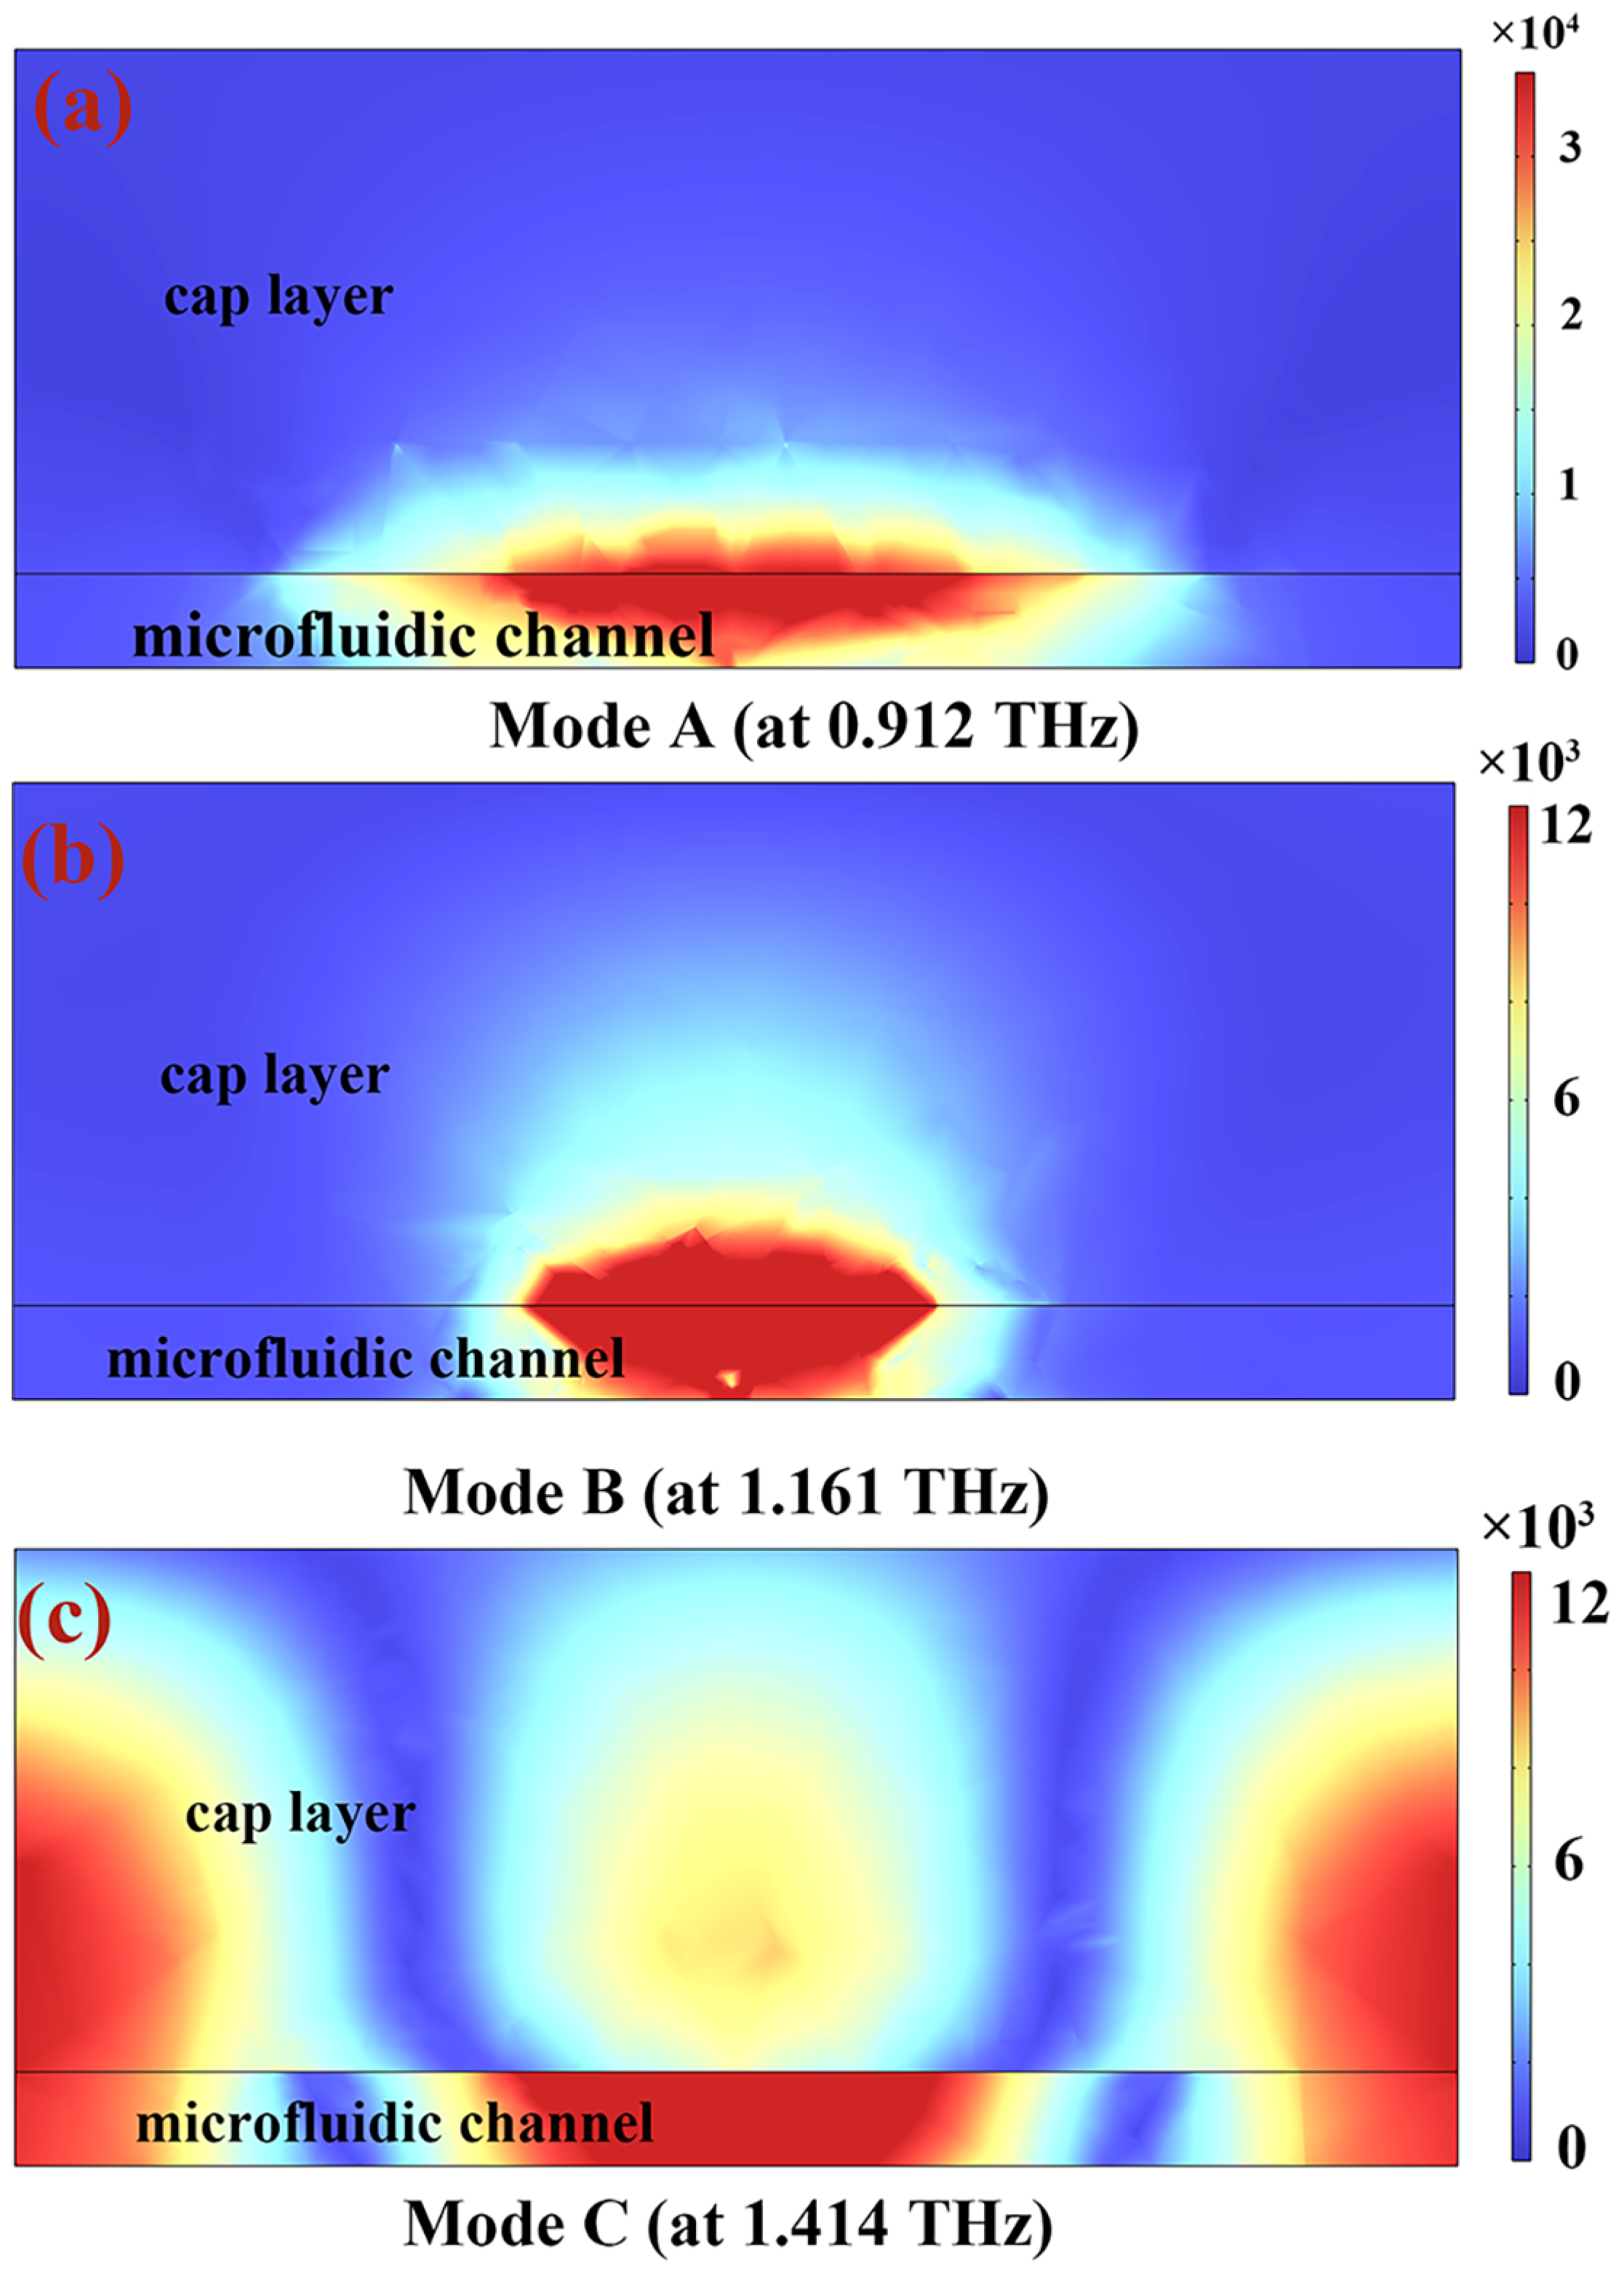
Figure 5 clearly shows the magnetic field distribution in the x–z plane of the cap and channel of the microfluidic sensor in the resonant state, where
Figure 5a–c correspond to modes A, B, and C, respectively. Through observation, it can be found that the incident electromagnetic wave energy shows a clear aggregation trend, mainly concentrated in the microfluidic channel and caprock area. In particular, mode C shows a wider magnetic field distribution area in the microfluidic channel, which more effectively limits the electromagnetic wave energy in the microfluidic channel cavity, resulting in its Q value being significantly higher than that of mode A or B. When electromagnetic waves are irradiated on the metal resonant unit, opposite polarity charges will accumulate at both ends of the bimetallic ring and rectangular metal. Electric dipole resonance occurs on the metal, which will have a strong coupling effect with the metal plate structure at the bottom, resulting in a reverse charge distribution in the metal layer structure at the bottom. Its presence will cause reverse currents to form on the upper and lower surfaces of the metal resonant structure, thereby forming a strong magnetic field resonance. At this time, a concentrated magnetic field will accumulate directly below the metal. This feature can be clearly observed in the magnetic field distribution in
Figure 5a,b, which shows the marked accumulation of a strong magnetic field under the metal ring structure and rectangular structure. In contrast to the previous two magnetic field distribution modes, the magnetic field distribution of mode C in the channel is not limited to right below the metal structure but also exists under other regions of the non-metal structure, which further proves that the absorption peak at 1.414 THz is a high-order response mechanism caused by the combination of dipole resonance and lattice surface resonance from the metal array.
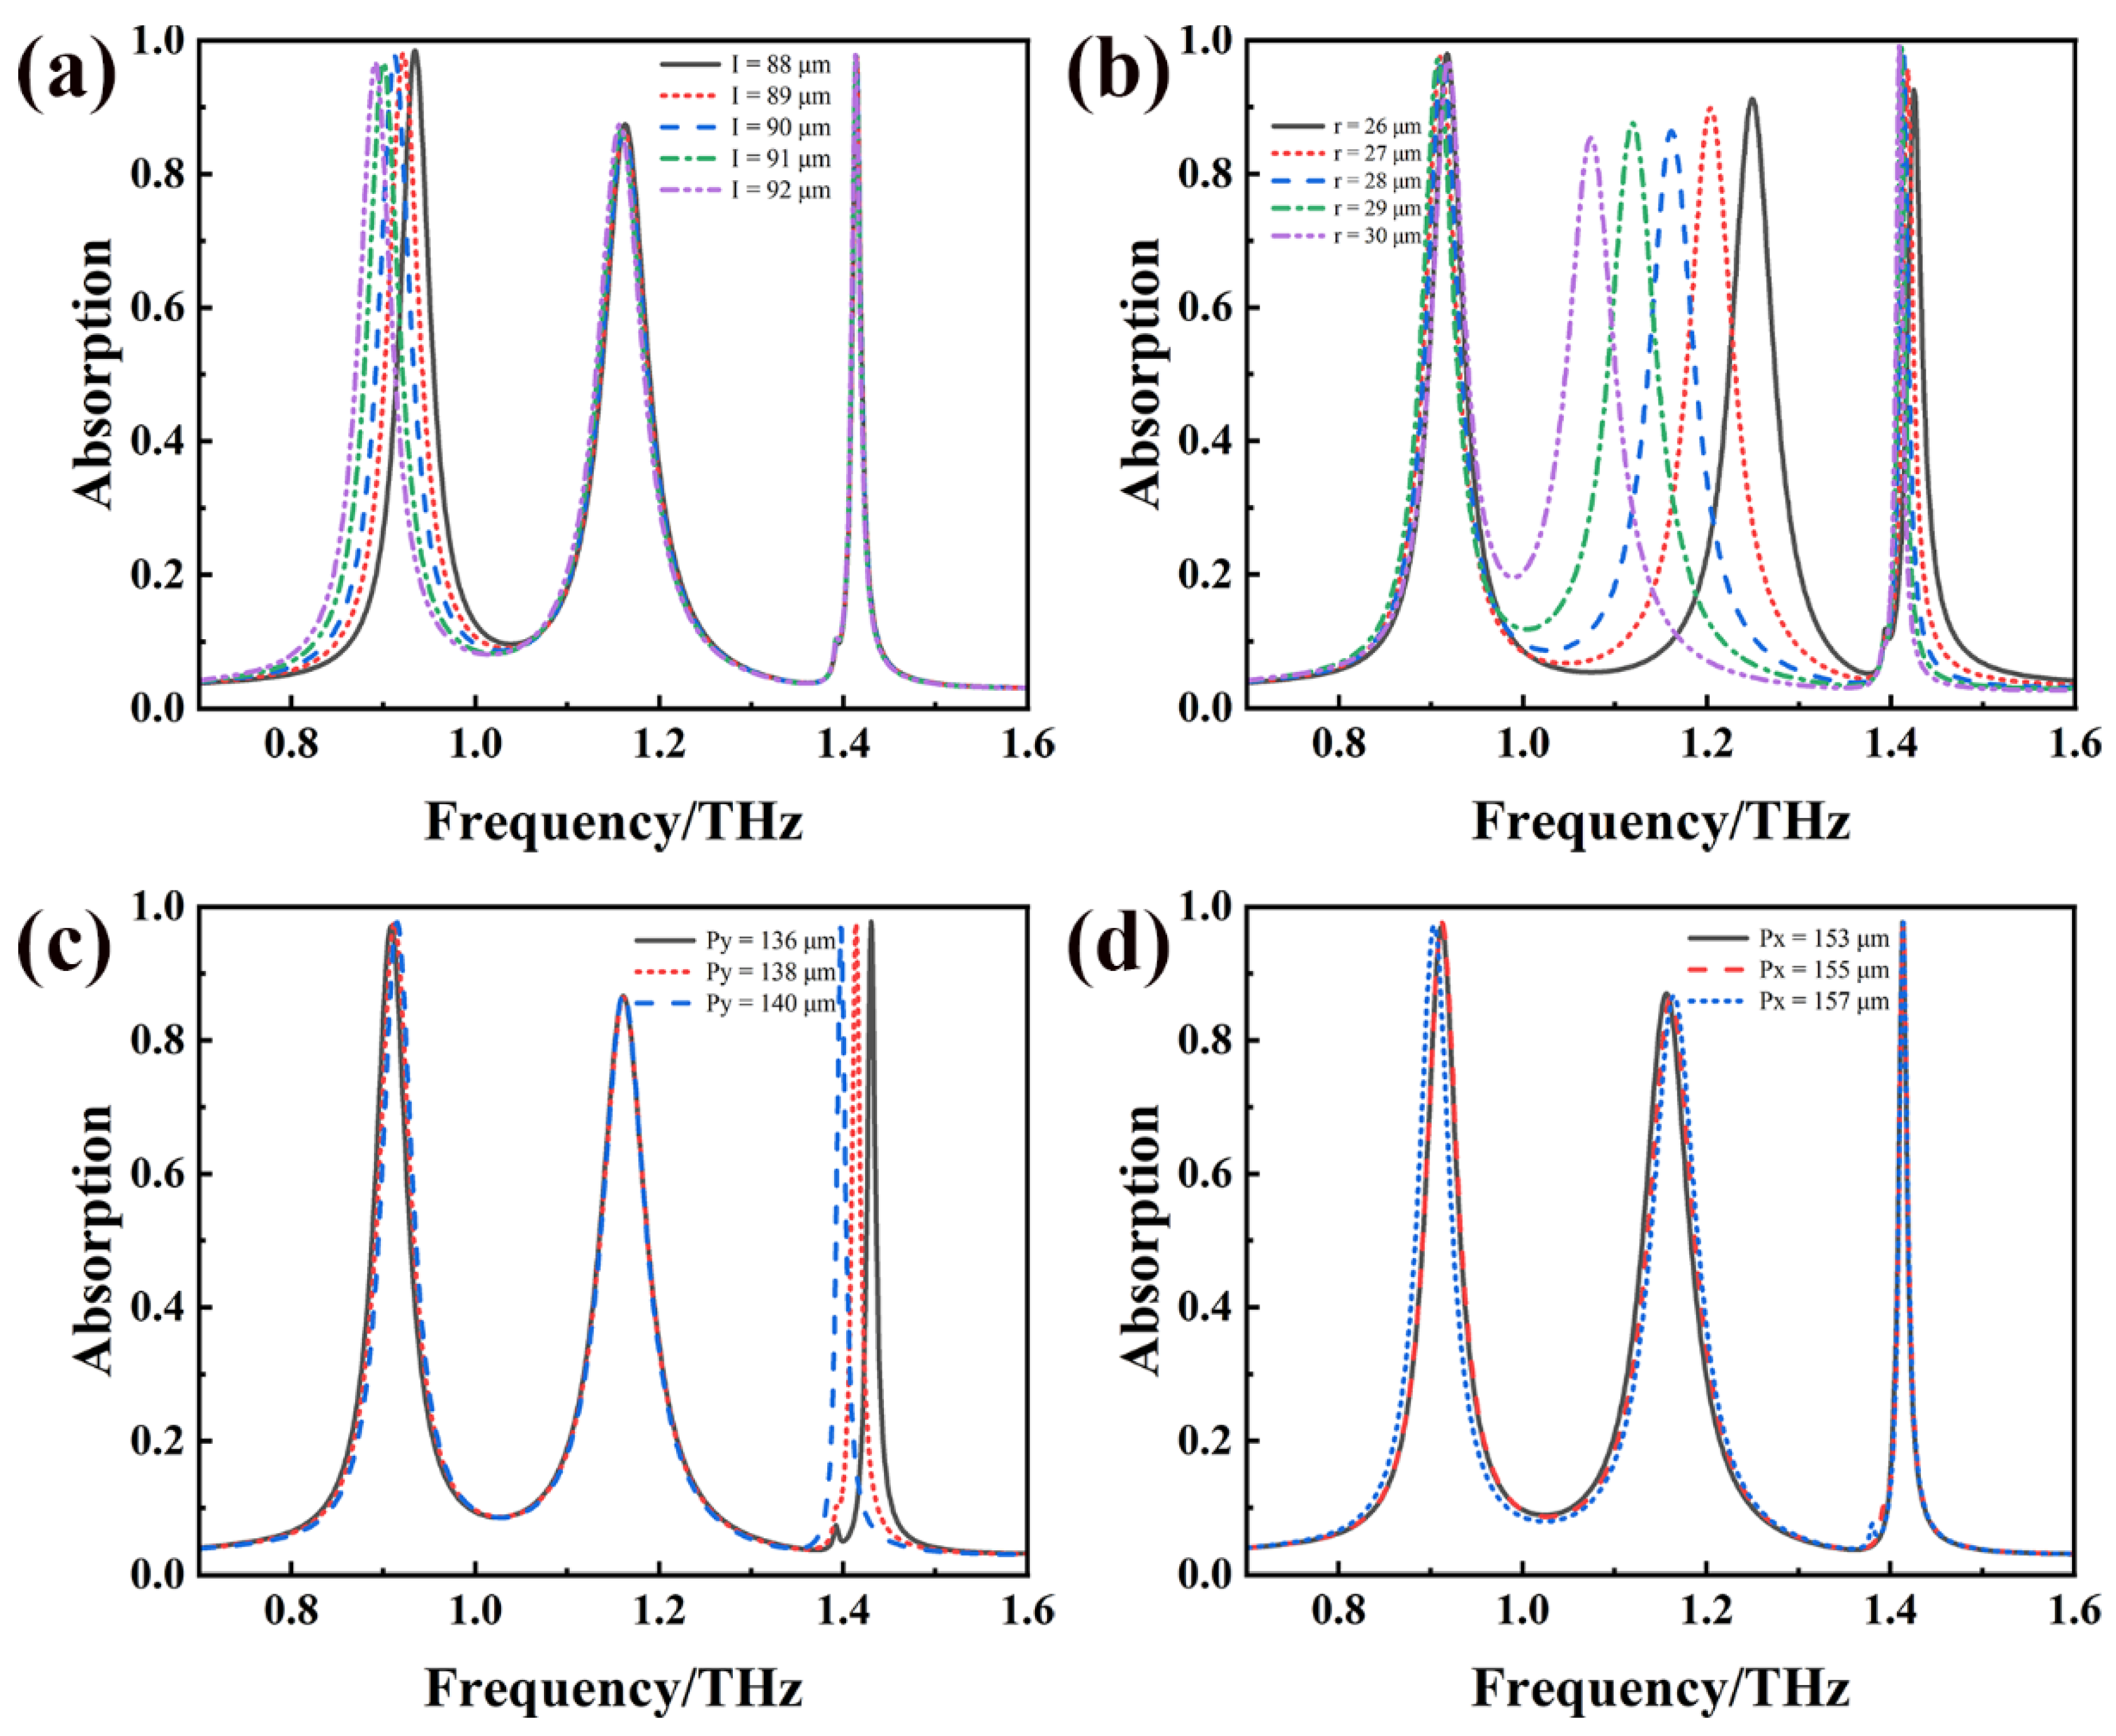
It is not difficult to imagine that this high-order response mechanism will be affected by the metal structure dipole parameters and lattice period parameters. However, through in-depth analysis of the absorption spectra corresponding to changes in the metal structure and lattice period parameters, as shown in
Figure 6a–d, it can be found that changing the metal structure hardly affects the absorption peak, while changing the lattice period
Py causes a significant shift in the resonant frequency. This phenomenon can be reasonably explained by the electric field distribution in metal and non-metal regions in mode C.
Figure 4a–c show that, at 1.414 THz, compared with the electric field on the bimetallic ring and rectangular-type metal structures, most of the electric field is concentrated in the non-metallic region, so the influence of changing the metal structure on the resonance peak is relatively small and not enough to cause an obvious frequency shift.
In order to further verify the resonance absorption phenomenon and theory mentioned above, this study further explored the influence of the microfluidic channel height and related parameters on the absorption spectrum. Under the premise of maintaining the constant size of the structure above the channel, the mechanism of the effect of channel height h on the absorption performance was comprehensively studied for a channel analyte refractive index
n = 1.3. The absorption curves at different channel heights are shown in
Figure 7.
It can be observed that with the continuous increase in microfluidic thickness
h, modes A and B exhibit a frequency redshift phenomenon; that is, the resonant frequency decreases. This is because as the height
h of the cavity increases, in order to maintain phase matching (the phase difference between light traveling back and forth once inside the cavity is an integer multiple of 2π), the wavelength
λ needs to increase accordingly. Due to the inverse proportionality between frequency f and wavelength
λ (
f = c/λ, where
c is the speed of light), an increase in wavelength leads to a redshift. Unlike modes A and B, as the thickness of the microfluidic channel increases, the resonant frequency of mode C undergoes a blue shift; that is, the resonant frequency increases. This is because when mode C occurs, the distribution of the electromagnetic field greatly overlaps with the analyte dielectric in the channel, as shown in
Figure 4c,f. At this time, the effective refractive index will increase due to the metasurface effect. As
h increases, the overlap area between the electromagnetic fields of the microfluidic analyte and the metal structure decreases, and the metasurface effect decreases, resulting in a decrease in the effective refractive index. In order to meet the phase matching condition,
λ needs to be reduced; that is, mode C undergoes a blue shift.
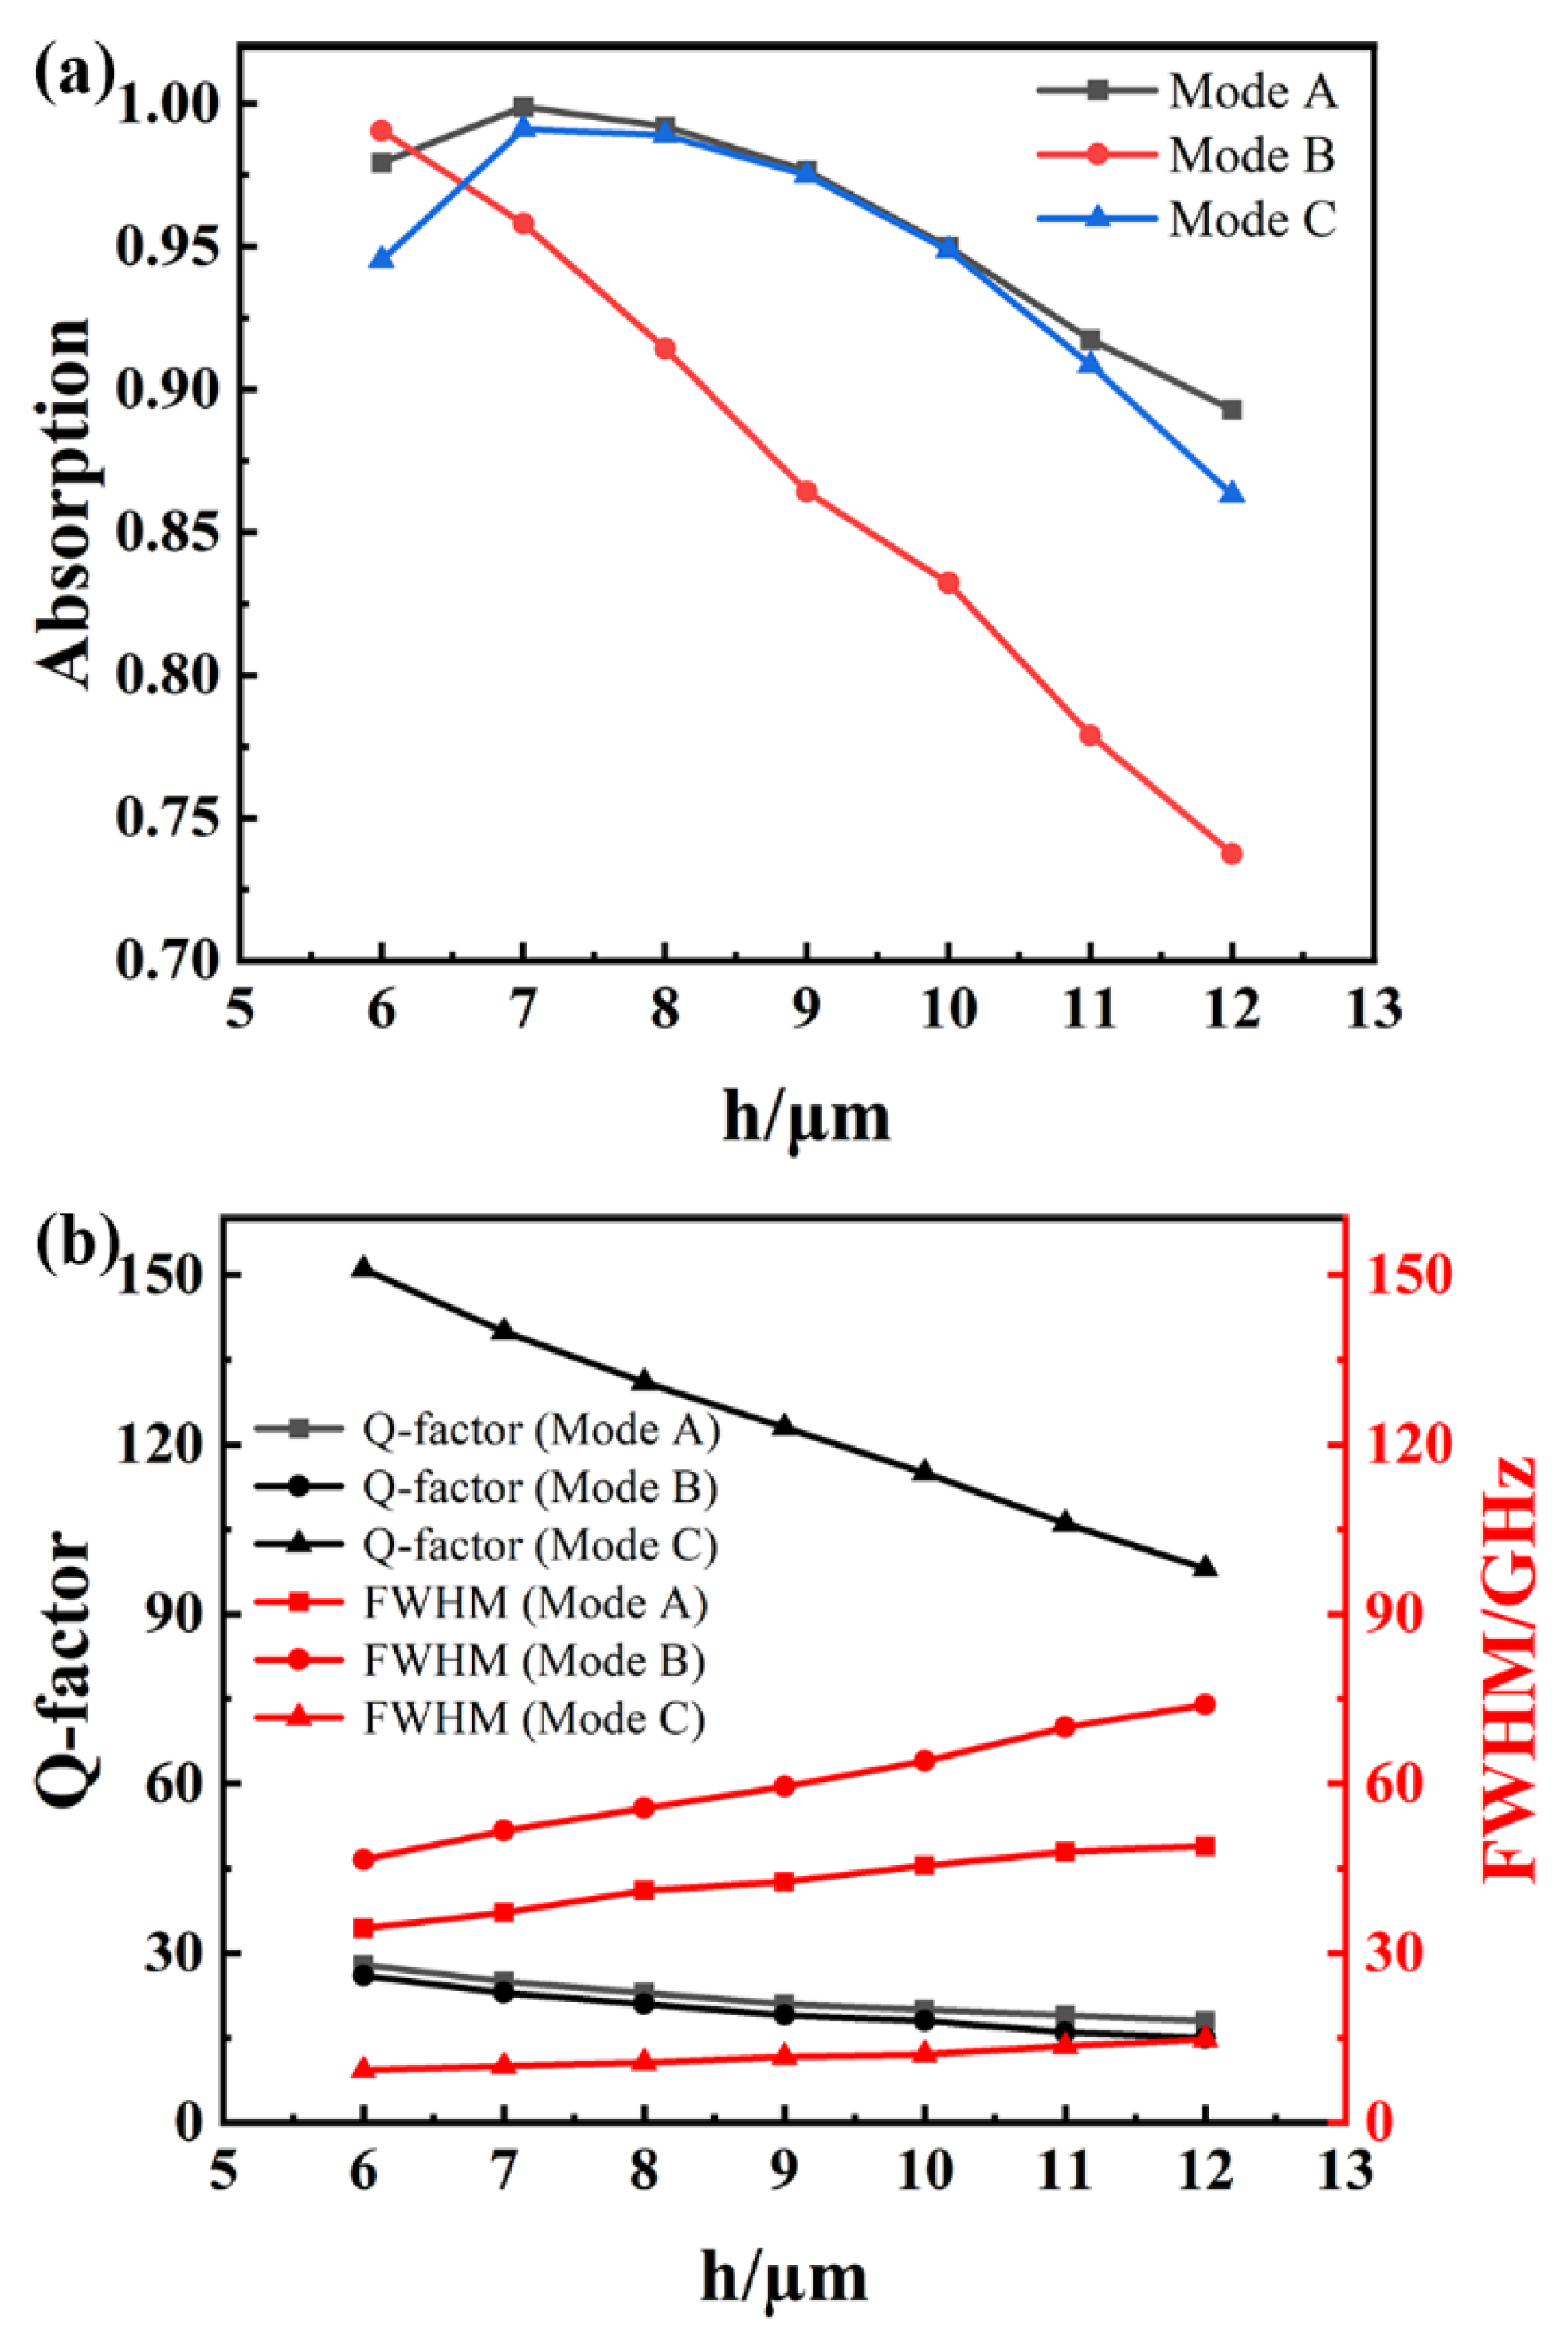
Figure 8a clearly shows that as the channel height
h gradually decreases, the absorption rates of the three resonance peaks show a gradual increase. It is particularly noteworthy that when the channel height
h reaches 7 μm, the absorbance of modes A and C reaches the peak state. However, as the channel height
h continues to decrease, the absorptivity of modes A and C gradually decreases. This phenomenon shows that the optimal height of the microfluidic channel is 7 μm in modes A and C. This is because once the channel height deviates from this optimal value, the sensor will not be able to meet the previously mentioned phase conditions of electromagnetic waves on both sides of the cover dielectric interface in modes A and C, which means that only part of the electromagnetic waves superimposed by multiple reflections on the caprock dielectric interface can undergo destructive interference, or they can even experience interference enhancement, and finally, the absorption frequency will change. The Q value is closely related to the channel height
h. As shown in
Figure 8b, the Q values corresponding to the resonant frequencies of the three absorption peaks show a downward trend with the gradual increase in channel height. The reason for this phenomenon is that the increase in channel height decreases the efficiency of energy storage in the resonator. Further observation shows that the Q value of mode C is about four times higher than those of other absorption peaks, regardless of how the channel height
h changes, and its advantage is very significant. From the perspective of the electric field distribution, the electric field in mode C accumulates over a wide range, covering almost the entire lattice unit, while the electric field energy of the other two resonance peaks is mainly stored in the metal structure; this means that mode C has a stronger ability to store electromagnetic fields, and thus, its Q value is much higher than those of the other absorption peaks. In addition, changing the channel height directly affects the degree of overlap between electromagnetic waves and analytes, leading to changes in the Q value and fluctuations in the FWHM of the absorber. After considering the comprehensive impact of various parameters, it was determined that
h = 9 μm is optimal. At this point, the parameters of modes A, B, and C reach a relatively balanced state, which can achieve a near-ideal overall performance.
To further investigate the formation mechanism of higher-order lattice resonances in mode C, a multipole decomposition method was used for a more in-depth analysis. Multipole decomposition, as a mathematical tool for decomposing electromagnetic fields, can decompose complex electromagnetic fields into a series of modes that characterize different near-field distributions. The scattering characteristics of these modes are the electromagnetic response characteristics of the device. Therefore, the calculation results of multipole decomposition can be used to describe the interaction between electromagnetic fields and devices [
31,
32]. When the device is in an electromagnetic field, specific near-field distributions are generated inside, and the scattering characteristics of these near-field distributions are reflected in the electromagnetic response of the optical structure. By calculating the current density in the material to obtain the intensity of each multipole mode, the electromagnetic response of the device can be determined and its scattering characteristics can be analyzed. In this study, the electric dipole moment (
ED), magnetic dipole moment (
MD), toroidal dipole moment (
TD), electric quadrupole moment (
EQ), and magnetic quadrupole moment (
MQ) were obtained by integrating the current density in the Cartesian coordinate system, achieving an effective description of the interaction process between electromagnetic fields and matter. The specific calculation formula is as follows [
33,
34]:
Among them,
J is the current density;
r is the coordinate vector;
c is the speed of light; and
ω is the angular frequency of the incident electromagnetic wave;
δαβ is the
δ function. The scattering power corresponding to different multipole moments (scattering power
IED of electric dipole, scattering power
IMD of magnetic dipole, scattering power
ITD of toroidal dipole, scattering power
IEQ of relectric quadrupole, scattering power
IMQ of magnetic quadrupole) can be expressed as follows:
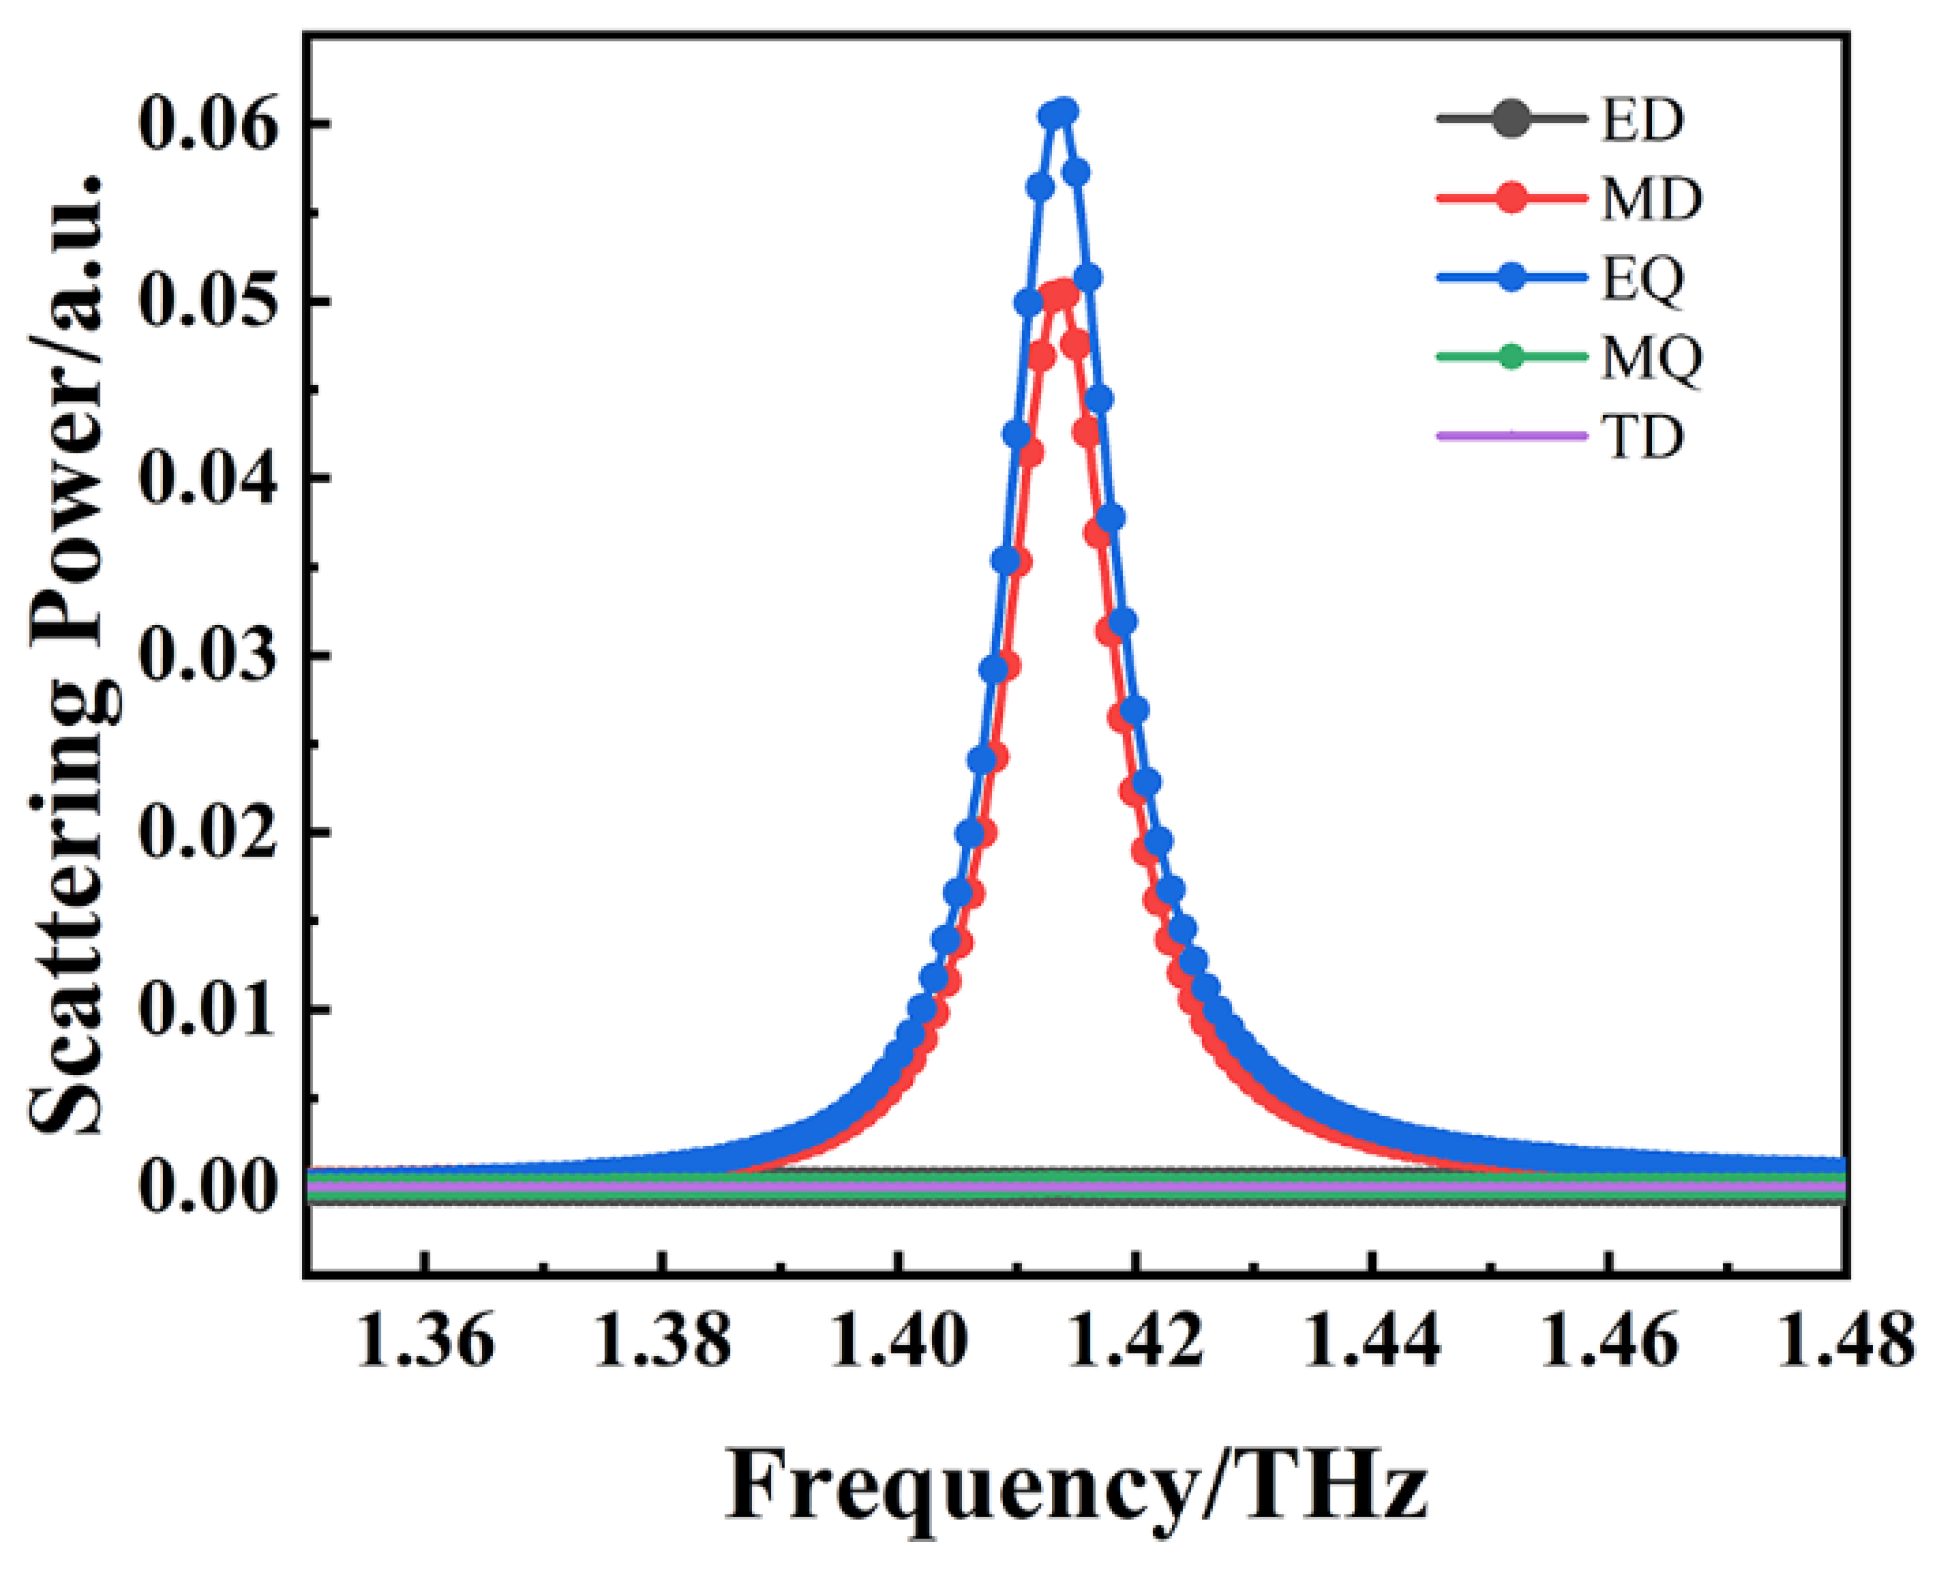
The multipole decomposition calculation was carried out for mode C excited by the resonant structure, and the scattering power calculation results are shown in
Figure 9. The results clearly demonstrate the contribution of different multipole moments to mode C, with
MD and
EQ confirmed as the main contributors to mode C. From
Figure 4f, it can be seen that there are charge accumulations of opposite polarity in the non-metallic regions at both ends along the central axis. These pairs of charges, which are separated by a certain distance and have equal charges but opposite polarities, form a set of
EDs. Similarly, the metal rings at both ends of the central axis accumulate charges of opposite polarity to the non-metallic region, forming another set of
EDs with opposite directions. Eventually, two sets of
EDs with opposite directions are formed in the lattice resonance unit, together forming a set of
EQs. In addition, due to the induction of charges of opposite polarity on the upper and lower surfaces of the metal resonant structure, the charges move in a directional manner under the action of the electric potential field, ultimately forming a circular current on the upper and lower surfaces. The center of this circular current generates a set of
MDs perpendicular to the current plane.
Figure 5c intuitively shows the magnetic field distribution excited by the
MDs in mode C within the channel. The above phenomenon is completely consistent with the conclusion drawn from the multipole decomposition calculation that
EQ and
MD are the main contributors to mode C. As shown in
Figure 6a–d, when changing the length
I of the rectangular structure and the
r of the bimetallic ring structure, both modes A and B will have corresponding frequency point shifts, which are not constrained by the lattice period parameters
Px and
Py, indicating that modes A and B are local dipole resonance responses. However, whether changing the length
I of the rectangular structure or the
r value of the double-ring metal structure, the resonant frequency of mode C is almost unchanged compared with those of modes A and B. When the lattice period parameters
Px and
Py are changed, it is found that the resonant frequency of mode C changes greatly when
Py is changed. It is confirmed that the absorption peak C mainly comes from the surface lattice resonance of the whole metamaterial because the surface lattice resonance is very sensitive to a change in the lattice period, while the parameter change in the metal array itself has little effect on the surface lattice resonance [
35,
36]. More precisely, the coupling of
EQ and
MD produces high-order lattice resonance.
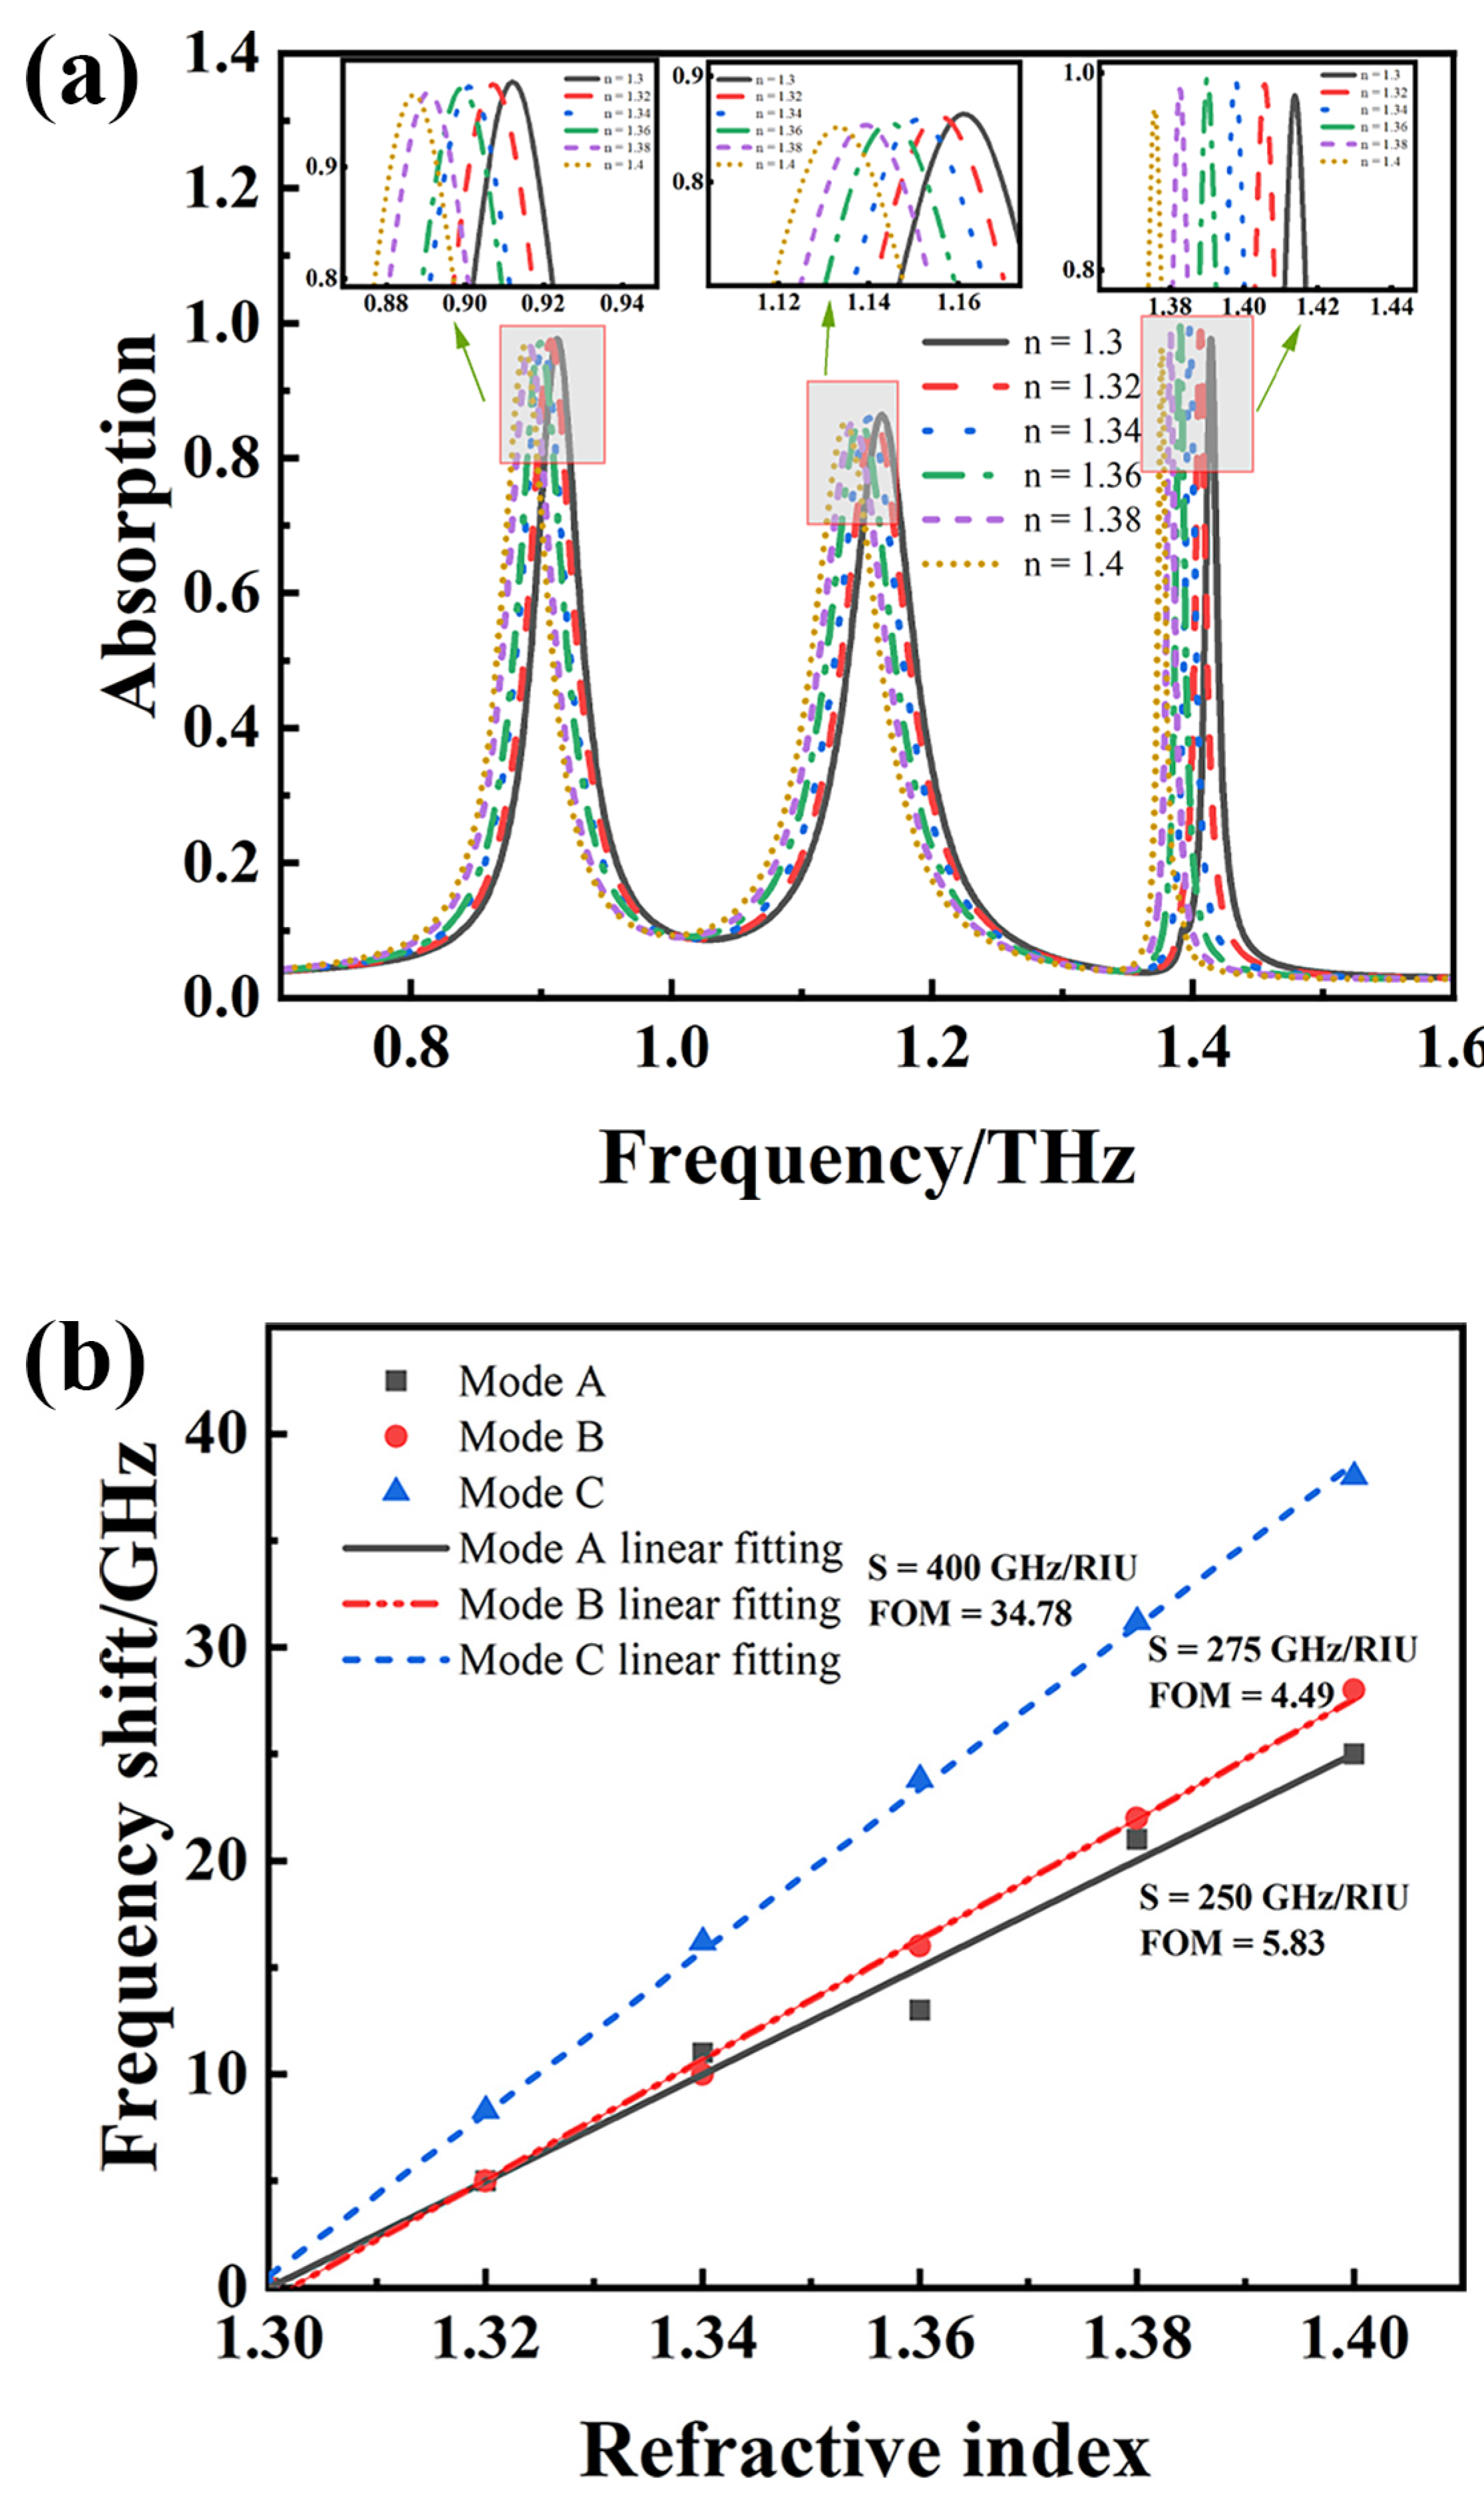
Figure 10a shows the absorption spectra corresponding to the three absorption peaks when the refractive index of the analyte in the microfluidic channel changes. It shows that as the refractive index
n of the analyte increases from 1.3 to 1.4 in steps of 0.02, the three absorption peaks all show significant shifts toward lower frequencies. The reason for this phenomenon is that the change in the refractive index of the analyte changes the dielectric environment around the metamaterial and then affects the phase difference between the electromagnetic waves on both sides of the dielectric cap interface, which is finally reflected in a shift in the resonant frequency point on the spectrum. Further observation shows that the frequency shift resolution of the third peak is significantly higher than that of the other two resonance peaks. The reason is that mode C has a much higher Q value and a narrower FWHM. The electric field diagrams in
Figure 4a–c also show that mode C has the strongest ability to store electric field and thus shows a higher value in the sensing field. In addition, the refractive index detection range (1.3–1.4) of the multi-band terahertz sensor just covers the refractive indices of many common VOCs [
37], which demonstrates its high application potential in gas sensing and other fields.
In terms of sensor performance evaluation, the refractive index sensitivity (
S) is a key indicator. The larger its value, the greater the sensor’s sensitivity to subtle changes in the surrounding dielectric [
38]. Its calculation formula is
, where
represents the change in resonance frequency,
is the change in the refractive index, and its unit is RIU. In addition, the figure of merit (
FOM) can be used to comprehensively characterize the performance of the sensor for a more scientific comparison of the advantages and disadvantages of sensors in different frequency bands; its calculation formula is
[
39]. The data in
Figure 10b show that when the refractive index
n of the analyte changes from 1.3 to 1.4 (in steps of 0.02), the resonant frequency shift of the sensor gradually increases, and it generally shows a good linear relationship with the refractive index.
After linear fitting, the sensitivity of the sensor in modes A, B, and C reached 250 GHz/RIU, 275 GHz/RIU, and 400 GHz/RIU, respectively, and the corresponding
FOM values were 5.83, 4.49, and 34.78, respectively. Obviously, the sensitivity and
FOM value of mode C are significantly better than those of the other two modes. In
Table 1, the resonance mechanism for references [
40,
41,
42,
43,
44,
45] is surface plasmon resonance (SPR), which achieves sensing via resonance absorption when the wave vector of incident light matches the collective oscillation of free electrons on the metal surface. The resonance mechanism for references [
44,
45] is localized surface plasmon resonance (LSPR), which achieves absorption sensing via the collective oscillation of the free electrons of metal nanoparticles when illuminated at a specific wavelength. Comparing the
FOM values of references [
42,
45] reveals that the comprehensive performance of SPR-based sensors is better than that of LSPR-based sensors. The higher Q value and narrower FWHM for reference [
42] further demonstrate the importance of these two parameters in improving sensor performance.
Table 1 shows the performance comparison results between the sensors in this work and those in references from the literature. It can be observed that this design has a higher sensitivity and Q value, as well as a narrower FWHM. The
FOM value shows that this design has better sensing performance.


 ,
, 


