Abstract
This study presents a convolutional neural network (CNN)-based feature-scheduling aggregation clustering framework designed to address the limitations of conventional clustering algorithms in handling high-dimensional data structures. The proposed framework synergistically combines CNN’s automated feature extraction with adaptive feature-scheduling mechanisms and multi-level feature aggregation, enabling the effective capture of nonlinear data relationships and fine-grained pattern distinctions. The experimental results highlight the framework’s superior performance against existing algorithms, alongside its strong generalization capability. This framework advances cluster analysis methodology by providing an integrated deep learning architecture for complex data scenarios.
1. Introduction
In the era of big data, the exponential growth of multidimensional datasets (e.g., hyperspectral imagery, biomedical signals, and social networks) has created unprecedented challenges in discovering intrinsic data patterns and actionable insights. Traditional clustering methods, such as k-means and DBSCAN, often struggle with high-dimensional data due to their reliance on handcrafted similarity metrics and linear assumptions [1,2]. Cluster analysis, as a cornerstone of unsupervised learning, requires advanced techniques to address nonlinear separability and hierarchical feature interactions in complex data structures [3,4].
The advent of deep learning has revolutionized feature representation learning, particularly through convolutional neural networks (CNNs). CNNs excel in capturing spatial hierarchies and translation-invariant features, as evidenced by their success in image segmentation and time-series analysis [5]. Recent studies have integrated CNNs with clustering objectives, such as DeepCluster and Variational Deep Embedding, demonstrating superior performance in learning disentangled representations for unlabeled data [6,7]. However, these approaches often neglect dynamic feature prioritization and multi-scale aggregation, limiting their adaptability to heterogeneous datasets [8].
To address these gaps, this study proposes a clustering framework based on CNN for feature scheduling and aggregation, aiming to enhance the performance of clustering tasks using deep learning techniques. The framework integrates the feature extraction capabilities of CNN, the adaptive adjustment of feature scheduling, and the multi-band information integration of feature aggregation, in order to achieve better clustering results. Through experimental validation on multiple datasets, this paper demonstrates the superiority of the proposed framework compared to existing clustering algorithms and evaluates its generalization ability.
This paper is structured as follows: Section 2 introduces the related works. Section 3 delineates the overall framework architecture and the implementation details of the CNN backbone, feature scheduling mechanism, and feature aggregation module. Section 4 describes the experimental design, including datasets, evaluation metrics, and parameter configurations; following that, we present comparative results and provide an in-depth analysis of the findings. Finally, Section 5 concludes the paper and explores future research directions.
2. Related Works
The integration of deep learning with cluster analysis has emerged as a research frontier, stimulating numerous methodological innovations. Current approaches can be categorized based on their architectural paradigms, as follows.
Transformer-based methods dominate recent advancements. Clusterformer [9] implements iterative cluster center updates through cyclic attention mechanisms, enabling robust representation learning. Contrastive learning frameworks like DeepCluster [10] employ standard K-Means clustering on feature spaces, using partition results as supervisory signals for network optimization. The IIC (Invariant Information Clustering) [11] framework pioneers unsupervised neural classifiers that discover semantically meaningful clusters without labeled data. Geometric processing techniques such as PCT [12] enhance input embedding through farthest point sampling and nearest neighbor search, while SETR [13] establishes global context modeling via transformer layers coupled with dedicated decoders.
Parallel developments in computer vision introduce specialized architectures. SGSCN [14] achieves the joint optimization of feature representation and cluster assignment through iterative end-to-end learning, where spatially constrained loss functions enforce connectivity priors. For point cloud processing, DGCNN [15] proposes permutation-invariant operations preserving local geometric structures. CurveNet [16] models point clouds as undirected graphs, establishing long-range dependencies through curvilinear connections in shallow networks. Large-scale graph analysis benefits from Dink-Net [17], which efficiently captures complex structural patterns. The GDANet [18] architecture introduces geometric decoupling modules that dynamically separate 3D objects into contour (sharp) and planar (gradual) components, capturing complementary geometric semantics. CRM [19] captures invariant target information and suppresses the heterogenous differences in cross-drone information.
In multi-view clustering, MVEC [20] employs a multi-view deep embedding clustering framework designed for multi-density datasets, enhancing clustering accuracy and precision. CSMDC [21] proposes a deep multi-view document clustering framework that captures consistent contextual semantics to boost performance. FPGC [22] addresses graph clustering from a feature perspective through squeeze-and-excitation blocks that select clustering-relevant features, providing novel theoretical foundations for graph clustering research. MWDSC [23] employs multi-dimensional weighted deep subspace clustering to enhance the efficiency and effectiveness of feature extraction and clustering performance.
The MMOEA_DC_HR [24] algorithm, based on hierarchical clustering, conducts dual clustering within the decision and objective spaces. The multi-view C-means clustering algorithm [25] extends NCM clustering to handle multi-view data uncertainty while auto-determining view importance. By combining feature weight learning with the assessment of feature contributions, the ECM [26] enhances the accuracy and reliability of clustering outcomes. CGC-AF [27] enhances graph representation learning through contrastive frameworks and optimizes graph structures with adaptive filters.
MVC-DMLR [28] employs deep non-negative matrix factorization to learn multi-level representations, integrating feature learning and multi-view clustering for accuracy improvement. SPCNet [29] simplifies PCNet while enhancing robustness, providing new theoretical foundations for GNNs handling graphs with varying homophily levels. Co-MSE [30] optimizes graph embeddings by integrating multi-order correlations to address high-order dependency issues. DPSC [31] proposes a novel affinity learning framework to enhance diffusion process robustness. RGSL [32], a robust graph structure learning method for heterophilous graphs, offers new theoretical insights. SCDCMV [33] improves clustering performance by leveraging inter-view consistency while reducing data noise impacts.
Other related studies consist of PRANet [34], focusing on combining structural and relational learning for discriminative regional feature extraction, and a meta-heuristic [35] approach designed to partition datasets into distinct, non-overlapping clusters. This partitioning aims to minimize similarities within clusters and maximize differences between clusters. These works collectively advance cluster analysis through theoretical and methodological innovations.
However, cluster analysis for complex, high-dimensional data remains a significant challenge. Traditional machine learning approaches often struggle with scalability and performance when confronted with large-scale, high-dimensional datasets. While deep learning, particularly deep clustering methods utilizing autoencoders or specific architectures, has shown promise by automating feature learning, significant limitations persist. These methods face challenges when processing highly heterogeneous data where features exhibit diverse scales, types, and distributions.
Addressing these interconnected challenges, this study introduces a novel convolutional neural network (CNN)-based feature-scheduling aggregation clustering framework. Unlike traditional methods, the proposed framework leverages CNN’s strength in automated high-dimensional feature extraction directly from raw or complex structured data. Crucially, it integrates adaptive feature-scheduling mechanisms and multi-level feature aggregation modules within an end-to-end trainable architecture. This integrated design directly tackles the training instability inherent in alternating optimization by jointly optimizing feature learning and clustering objectives. The framework is engineered to inherently capture complex, nonlinear relationships and fine-grained pattern distinctions. Moreover, by its design and the aggregation mechanism, it implicitly promotes geometric consistency in the learned embedding space, better preserving data topology. The adaptive nature of the feature scheduling and aggregation also aims to provide enhanced multi-density adaptability, allowing the model to respond effectively to clusters with varying local densities without relying on fixed, global parameters.
3. Proposed Method
The convolutional neural network (CNN)-based feature-scheduling aggregation clustering framework comprises three core modules: (1) convolutional neural network (CNN), (2) feature scheduling, and (3) feature aggregation. The CNN initially extracts discriminative features from input data, which are then transmitted to the feature scheduling module. This secondary module performs sample-wise classification based on both raw data instances and extracted feature representations. In the final step, the feature aggregation module integrates high-frequency and low-frequency information within each data cluster to generate a unified and informative feature set. The complete architecture is visually summarized in Figure 1, which explicitly delineates inter-modular connections and functional relationships.
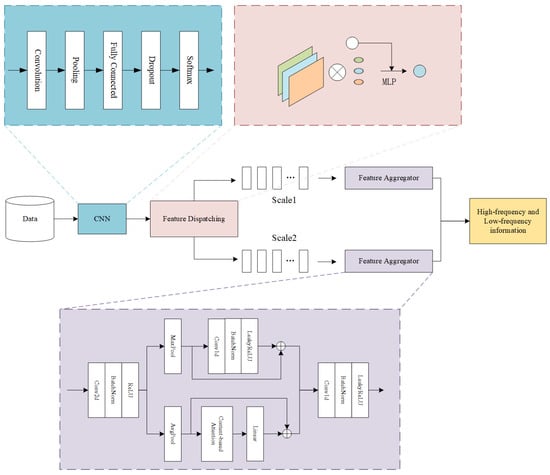
Figure 1.
Architecture of the proposed framework.
3.1. Convolutional Neural Networks
The convolutional layer adopts 3 × 3 kernels to maintain a balance between computational complexity and model performance. With stride = 1 and ‘same’ padding configuration, spatial dimensions of outputs are preserved relative to inputs. The initial layer contains 32 kernels, with quantity progressively increasing across network depth. Each convolutional operation is followed by ReLU activation to enhance nonlinear representation capabilities and helps mitigate gradient vanishing and exploding issues during training. Its expression is shown as follows:
Pooling Layer: Average pooling with 2 × 2 window (stride = 2, zero-padding) reduces feature map dimensionality while preserving critical information. This operation smooths activations through regional averaging, effectively controlling subsequent computational loads.
Model Training: Training involves forward propagation for prediction generation and loss computation, followed by backpropagation for parameter optimization. The mean-squared-error loss function quantifies discrepancies between predictions and ground truth. Cross-entropy loss is utilized as the loss function to optimize the model’s performance and its expression is shown as follows:
Here, denotes the feature vector of the i-th input data point, denotes the predicted probability of point i, and N denotes the number of data points in batch.
To prevent overfitting in fully connected layers, dropout regularization (p = 0.35) randomly deactivates neurons during training, forcing robust feature learning. The Adam optimizer accelerates convergence through adaptive moment estimation, combining momentum and RMSprop principles for stable gradient updates.
3.2. Feature Scheduling
Feature scheduling constitutes an adaptive feature refinement mechanism. During clustering iterations, this module performs sample classification by evaluating cosine similarity between feature embedding and cluster centroids. For each feature embedding, the mechanism undertakes the following: (1) it computes similarity scores with all centroids, (2) it applies adaptive weighting to the embedding vector, and (3) it enhances sample–cluster relationships through geometric alignment, here referring to the optimization process that minimizes spatial discrepancies between feature distributions across different modalities. This dynamic optimization tightens intra-cluster cohesion while increasing inter-cluster separation in the latent space, ultimately improving clustering precision and noise robustness.
Following feature extraction, an adaptive weighting mechanism processes cluster patches based on their centroid similarity. This enables coherent structural understanding through context-aware feature recalibration. The updated patch embedding for each is calculated using the formula as follows:
Here, denotes the feature vector of the i-th input data point, K represents the total number of cluster centers, and denotes the similarity between the k-th cluster center and the input data point.
The scheduling mechanism refines feature embedding by integrating centroid-derived semantic information. Through iterative similarity-driven adjustments, the model develops enhanced comprehension of latent data structures and contextual relationships, enabling more effective capture of intrinsic data patterns.
3.3. Feature Aggregators
Feature aggregators implement local feature integration through a hybrid pooling strategy with parallel high-/low-frequency branches. When processing local feature patches, these modules extract complementary information via two distinct pathways:
- High-frequency branch: Utilizes max pooling to capture salient features and accentuate data variations/detail patterns.
- Low-frequency branch: Applies average pooling to derive global trend representations and background characteristics.
The concatenated outputs from both branches are subsequently processed by a multilayer perceptron (MLP) to generate final feature representations. This dual-branch architecture enables the comprehensive capture of spectral information while preserving inter-feature correlations, thereby enhancing the model’s capacity to handle data complexity in clustering tasks.
The hybrid pooling strategy improves upon conventional approaches through parallel processing rather than serial combination. Unlike traditional max pooling, which primarily aggregates local high-frequency components, our design maintains separate information pathways:
- High-frequency signals are emphasized via max pooling;
- Low-frequency components are distilled through average pooling.
High-frequency aggregation branch: To aggregate high-frequency information in the high-frequency aggregation branch, max pooling is utilized. The expression is presented as follows:
Here, stands for maximum pooling, and represents the residual MLP block.
Low-frequency aggregation branch: Within the low-frequency aggregation branch, average pooling is implemented to direct the module’s attention towards low-frequency information. The formulation for this branch is
Through the high-frequency aggregation branch and the low-frequency aggregation branch, we can obtain the high-frequency and low-frequency information, respectively. Finally, the features from these two branches are concatenated and jointly input into the MLP to yield the output feature. The expression is as follows:
4. Experiments
4.1. Datasets and Evaluation Metrics
Three benchmark datasets from the UCI Machine Learning Repository are selected for clustering evaluation:
- Wisconsin Breast Cancer Dataset: Contains 569 instances with 30 features, classified into benign/malignant categories;
- Heart Disease Dataset: Contains 303 instances containing 13 diagnostic features;
- IRIS Dataset: Contains 150 samples with 4 morphological features across three species classes.
To fully measure the clustering performance of the model, two evaluation metrics are adopted.
Sum of Squared Errors (SSE): Quantifies intra-cluster cohesion through squared Euclidean distances to centroids (lower values preferred). The calculation formula is as follows:
Here, represents the total number of observations, denotes the number of clusters, is the i-th observation, is the centroid of the j-th cluster, and takes a value of 1 if data point i is assigned to cluster j, and 0 otherwise.
Normalized Mutual Information (NMI): Measures label consistency between predicted clusters and ground truth [0, 1] range (higher values indicate better alignment). The calculation formulas are as follows:
where I(A; B) denotes the mutual information between A and B, and H(A) and H(B) represent the entropy of A and B, respectively.
4.2. Experimental Parameter Setting
The experimental parameters, including the configuration of the model and the settings used during training and evaluation, are detailed in Table 1. This transparency in reporting is crucial for replicating the experiments and for understanding the context in which the results were achieved.

Table 1.
Experimental parameters.
4.3. Comparative Experiments
Comparative experiments were conducted on three benchmark datasets (two biomedical collections and one botanical dataset) to rigorously evaluate the proposed model’s clustering performance against established algorithms. The biomedical datasets assess domain-specific performance in healthcare contexts, while the botanical dataset validates generalization capability in cross-domain scenarios. This multi-domain evaluation framework enables a systematic assessment of clustering efficacy across heterogeneous data types.
The comparative models were systematically selected based on recency, representativeness, and technical relevance, as shown in Table 2.
Table 2.
Comparative model selection criteria.
- (1)
- Breast Cancer Dataset Analysis
The experimental performance evaluation involves comparing the efficacy of various algorithmic models in classifying breast cancer subtypes. The detailed experimental results are presented in the table below.
As shown in Table 3, our method achieves state-of-the-art performance on this dataset:
Table 3.
Results of clustering analysis on the breast cancer dataset.
- SSE: 1.479 × 10⁵ (lowest among compared methods);
- NMI: 0.593 (superior feature-target correlation capture, as shown in Figure 2);
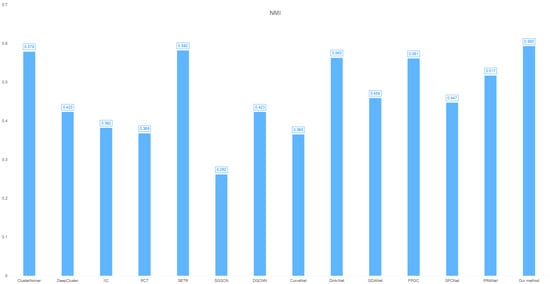 Figure 2. Cross-clustering model NMI distribution on the breast cancer dataset.
 - This tri-metric superiority demonstrates robust classification capability for breast cancer subtyping, particularly excelling in cluster cohesion (SSE) and label consistency (NMI).
- (2)
- Heart Disease Dataset Analysis
In our unsupervised experimental setup, we performed cluster analysis exclusively on feature space, excluding diagnostic labels to discover potential disease subtypes. The detailed experimental results are presented in the table below.
As detailed in Table 4, the proposed model demonstrates superior clustering performance:
Table 4.
Results of clustering analysis on the heart disease dataset.
- SSE: 2.13 × 10⁵ (lowest intra-cluster variance);
- NMI: 0.185 (optimal feature-label correlation capture, as shown in Figure 3).
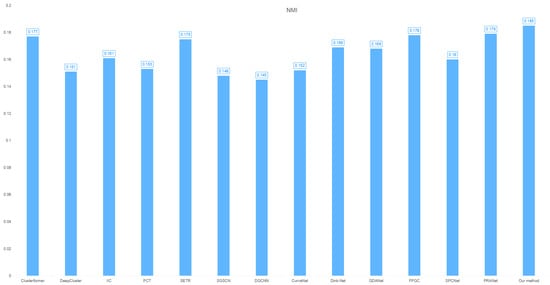 Figure 3. Cross-clustering model NMI distribution on the heart dataset.
This tri-fold superiority confirms the model’s effectiveness in synthesizing spectral information (high-/low-frequency components) to exploit intrinsic data relationships, outperforming comparative methods in cardiovascular pattern discovery.
- (3)
- IRIS Dataset Analysis
To validate the cross-domain generalization capacity of our clustering framework, we conducted extended evaluations on the Iris Species Dataset—a benchmark botanical dataset containing 150 low-dimensional samples (sepal/petal length/width measurements). This controlled experiment tests model adaptability in simplified feature spaces. Table 4, below, provides the specific experimental results.
As detailed in Table 5, the proposed model demonstrates
Table 5.
Results of clustering analysis on the IRIS dataset.
- SSE: 0.95436 (lowest intra-cluster variance);
- NMI: 0.853 (superior cluster-label alignment, as shown in Figure 4).
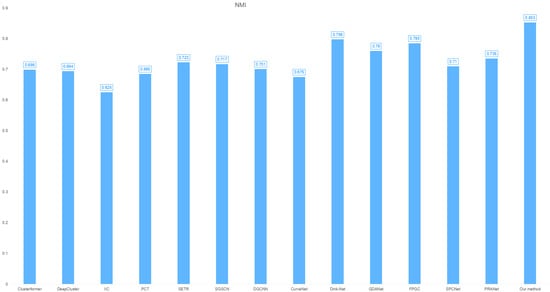 Figure 4. Cross-clustering model NMI distribution on the IRIS dataset.
Significant SSE/NMI improvements confirm the model’s robust pattern discovery capability across domains.
4.4. Ablation Study
To evaluate the necessity and effectiveness of the feature scheduling module and feature aggregator (including a high-frequency aggregation branch for capturing detailed features and a low-frequency aggregation branch for focusing on broader patterns) in the model, ablation experiments were conducted on the three datasets described above. The experimental results were assessed using SSE and NMI. The specific experimental models are as follows:
- CNN-only: The baseline model only has the CNN module.
- No-Feature Dispatching (No-FD): The model removes the feature scheduling module while retaining the CNN and feature aggregation module.
- No-Feature Aggregator (No-FA): The model removes the feature aggregation module while retaining the CNN and feature scheduling module.
- No-AvgPool: The model removes the low-frequency aggregation branch while retaining the CNN, feature scheduling, and high-frequency aggregation branch modules.
Given the critical role of CNNs and the high-frequency aggregation branch in the model, they were not evaluated individually in the ablation experiments. The results of the CNN-only, No-FD, No-FA, and No-AvgPool ablation experiments are presented in Table 6.
Table 6.
Results of the ablation study.
The results of the ablation experiments presented in the table demonstrate that the performance of each experimental model across the three datasets is comprehensively evaluated. The feature scheduling module, high-frequency aggregation branch, and low-frequency aggregation branch collectively influence the clustering performance of the model, with the feature aggregation module (FA) having the most significant impact on overall model performance. Specifically, the SSE and NMI metrics are the most affected, as shown in Figure 5.
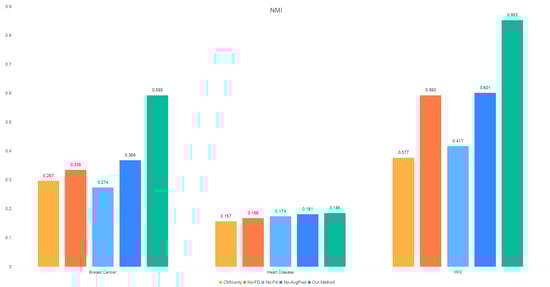
Figure 5.
NMI distribution of the ablation study.
- In all datasets, the largest performance gap between No-FA and Our Method is observed in the SSE metric.
- Except for the heart disease dataset, removing the feature aggregation module leads to a notable reduction in the NMI value.
In summary, the feature scheduling module and the high-frequency and low-frequency aggregation branches collectively enhance the model’s clustering performance, with the feature aggregation module playing the most critical role. These findings underscore the importance of integrating these components to optimize the model’s effectiveness.
5. Conclusions
The proposed CNN-based clustering framework introduces two novel components: (1) a feature scheduling module for similarity-driven adaptive feature alignment, and (2) a dual-branch spectral aggregation architecture combining max/average pooling operators. The scheduling module enhances intra-cluster coherence through dynamic feature-space optimization, while the spectral aggregator captures complementary patterns via parallel processing of high-frequency details (max pooling) and low-frequency trends (average pooling).
Extensive evaluations across medical (breast cancer and heart datasets) and botanical (Iris) datasets demonstrate the consistent superiority of the proposed model. Furthermore, complexity analysis has been performed to lay the groundwork for model simplification and optimization. This analysis not only unveils the model’s performance limitations but also offers insights into boosting computational efficiency, enhancing its applicability in real-world scenarios.
Furthermore, complexity analysis has been performed to lay the groundwork for model simplification and optimization. This analysis not only unveils the model’s performance limitations but also offers insights into boosting computational efficiency, enhancing its applicability in real-world scenarios.
Author Contributions
Conceptualization, Z.S.; Methodology, Y.J. and B.Y.; Validation, A.J. and Y.N.; Formal analysis, P.H.; Writing—review & editing, W.L.; Supervision, K.Z. All authors have read and agreed to the published version of the manuscript.
Funding
The work in this paper is supported in part by the University Synergy Innovation Program of Anhui Province under GXXT-2022-054 and in part by the High-Level Scientific Research Platform Construction Project of Anhui Normal University under 2023GFXK180.
Data Availability Statement
The original contributions presented in this study are included in the article. Further inquiries can be directed to the corresponding author.
Conflicts of Interest
The authors declare no conflict of interest.
References
- Shin, Y.-M.; Kim, S.-W.; Shin, W.-Y. PAGE: Prototype-Based Model-Level Explanations for Graph Neural Networks. IEEE Trans. Pattern Anal. Mach. Intell. 2024, 46, 6559–6576. [Google Scholar] [CrossRef] [PubMed]
- Zhang, H.; Wang, D.; Zhao, W.; Lu, Z.; Jiang, X. IMCSN: An improved neighborhood aggregation interaction strategy for multi-scale contrastive Siamese networks. Pattern Recognit. 2025, 158, 111052. [Google Scholar] [CrossRef]
- Deng, W.; Zhao, L.; Liao, Q.; Guo, D.; Kuang, G.; Hu, D.; Pietikainen, M.; Liu, L. Informative Feature Disentanglement for Unsupervised Domain Adaptation. IEEE Trans. Multimed. 2022, 24, 2407–2421. [Google Scholar] [CrossRef]
- Liu, D.; Zhang, C.; Song, Y.; Huang, H.; Wang, C.; Barnett, M.; Cai, W. Decompose to Adapt: Cross-Domain Object Detection Via Feature Disentanglement. IEEE Trans. Multimed. 2023, 25, 1333–1344. [Google Scholar] [CrossRef]
- Ding, Y.; Zhang, Z.; Zhao, X.; Cai, Y.; Li, S.; Deng, B.; Cai, W. Self-Supervised Locality Preserving Low-Pass Graph Convolutional Embedding for Large-Scale Hyperspectral Image Clustering. IEEE Trans. Geosci. Remote Sens. 2022, 60, 1–16. [Google Scholar] [CrossRef]
- Xue, Y.; Jin, G.; Shen, T.; Tan, L.; Wang, N.; Gao, J.; Wang, L. SmallTrack: Wavelet Pooling and Graph Enhanced Classification for UAV Small Object Tracking. IEEE Trans. Geosci. Remote Sens. 2023, 61, 1–15. [Google Scholar] [CrossRef]
- Malhi, U.S.; Zhou, J.; Yan, C.; Rasool, A.; Siddeeq, S.; Du, M. Unsupervised Deep Embedded Clustering for High-Dimensional Visual Features of Fashion Images. Appl. Sci. 2023, 13, 2828. [Google Scholar] [CrossRef]
- Zhou, W.; Song, W.; Zhang, Z.; Zhang, F.; Teng, Z.; Tian, Z. Hierarchical feature aggregation with mixed attention mechanism for single-cell RNA-seq analysis. Expert Syst. Appl. 2025, 260, 125340. [Google Scholar] [CrossRef]
- Liang, J.; Cui, Y.; Wang, Q.; Geng, T.; Wang, W.; Liu, D. ClusterFomer: Clustering As A Universal Visual Learner. Adv. Neural Inf. Process. Syst. 2023, 36, 64029–64042. [Google Scholar]
- Caron, M.; Bojanowski, P.; Joulin, A.; Douze, M. Deep Clustering for Unsupervised Learning of Visual Features. In Proceedings of the Computer Vision—ECCV 2018: 15th European Conference, Proceedings, Part XIV, Munich, Germany, 8–14 September 2018; Springer: Berlin/Heidelberg, Germany, 2018; pp. 139–156. [Google Scholar]
- Ji, X.; Henriques, J.F.; Vedaldi, A. Invariant Information Clustering for Unsupervised Image Classification and Segmentation. arXiv 2018, arXiv:1807.06653. [Google Scholar]
- Guo, M.-H.; Cai, J.-X.; Liu, Z.-N.; Mu, T.-J.; Martin, R.R.; Hu, S.-M. PCT: Point cloud transformer. Comput. Vis. Media 2021, 7, 187–199. [Google Scholar] [CrossRef]
- Zheng, S.; Lu, J.; Zhao, H.; Zhu, X.; Luo, Z.; Wang, Y.; Fu, Y.; Feng, J.; Xiang, T.; Torr, P.H.S.; et al. Rethinking Semantic Segmentation from a Sequence-to-Sequence Perspective with Transformers. arXiv 2020, arXiv:2012.15840. [Google Scholar]
- de Bruijne, M.; Cattin, P.C.; Cotin, S.; Padoy, N.; Speidel, S.; Zheng, Y.; Essert, C. A Spatial Guided Self-supervised Clustering Network for Medical Image Segmentation. In Proceedings of theMedical Image Computing and Computer Assisted Intervention–MICCAI 2021: 24th International Conference, Strasbourg, France, 27 Septembe–1 October 2021; Springer International Publishing: Berlin/Heidelberg, Germany, 2021; pp. 379–388. [Google Scholar]
- Wang, Y.; Sun, Y.; Liu, Z.; Sarma, S.E.; Bronstein, M.M.; Solomon, J.M. Dynamic Graph CNN for Learning on Point Clouds. ACM Trans. Graph. 2019, 38, 1–12. [Google Scholar] [CrossRef]
- Xiang, T.; Zhang, C.; Song, Y.; Yu, J.; Cai, W. Walk in the Cloud: Learning Curves for Point Clouds Shape Analysis. In Proceedings of the IEEE/CVF International Conference on Computer Vision, Montreal, QC, Canada, 10–17 October 2021; pp. 915–924. [Google Scholar]
- Liu, Y.; Liang, K.; Xia, J.; Zhou, S.; Yang, X.; Liu, X.; Li, S.Z. Dink-Net: Neural Clustering on Large Graphs. In Proceedings of the 40th International Conference on Machine Learning, Proceedings of Machine Learning Research, Honolulu, HI, USA, 23–29 July 2023; pp. 21794–21812. [Google Scholar]
- Xu, M.; Zhang, J.; Peng, Z.; Xu, M.; Qi, X.; Qiao, Y. Learning Geometry-Disentangled Representation for Complementary Understanding of 3D Object Point Cloud. Proc. AAAI Conf. Artif. Intell. 2021, 35, 3056–3064. [Google Scholar] [CrossRef]
- Xue, Y.; Jin, G.; Shen, T.; Tan, L.; Wang, N.; Gao, J.; Wang, L. Consistent Representation Mining for Multi-Drone Single Object Tracking. IEEE Trans. Circuits Syst. Video Technol. 2024, 34, 10845–10859. [Google Scholar] [CrossRef]
- Kassem, H.; Hajjar, S.E.; Abdallah, F.; Omrani, H. Multi-view Deep Embedded Clustering: Exploring a new dimension of air pollution. Eng. Appl. Artif. Intell. 2025, 139, 18. [Google Scholar] [CrossRef]
- Bai, R.; Huang, R.; Xu, L.; Qin, Y. CSMDC: Exploring consistently context semantics for multi-view document clustering. Expert Syst. Appl. 2025, 261, 125386. [Google Scholar] [CrossRef]
- Xie, X.; Li, B.; Pan, E.; Guo, Z.; Kang, Z.; Chen, W. One Node One Model: Featuring the Missing-Half for Graph Clustering. In Proceedings of the AAAI Conference on Artificial IntelligenceArxiv, Pennsylvania, PA, USA, 25 February–4 March 2025; pp. 21688–21696. [Google Scholar]
- Chen, S.; Zhang, X.; He, Y.; Peng, L.; Ou, Y.; Xu, S. Multi-dimensional weighted deep subspace clustering with feature classification. Expert Syst. Appl. 2025, 260, 125375. [Google Scholar] [CrossRef]
- Gu, Q.; Niu, Y.; Hui, Z.; Wang, Q.; Xiong, N. A hierarchical clustering algorithm for addressing multi-modal multi-objective optimization problems. Expert Syst. Appl. 2025, 264, 125710. [Google Scholar] [CrossRef]
- Liu, Z.; Qiu, H.; Deveci, M.; Pedrycz, W.; Siarry, P. Multi-view neutrosophic c-means clustering algorithms. Expert Syst. Appl. 2025, 260, 125454. [Google Scholar] [CrossRef]
- Liu, Z.; Qiu, H.; Senapati, T.; Lin, M.; Abualigah, L.; Deveci, M. Enhancements of evidential c-means algorithms: A clustering framework via feature-weight learning. Expert Syst. Appl. 2025, 259, 125246. [Google Scholar] [CrossRef]
- Xie, X.; Chen, W.; Kang, Z.; Peng, C. Contrastive graph clustering with adaptive filter. Expert Syst. Appl. 2023, 219, 119645. [Google Scholar] [CrossRef]
- Dou, Z.; Peng, N.; Hou, W.; Xie, X.; Ma, X. Learning multi-level topology representation for multi-view clustering with deep non-negative matrix factorization. Neural Netw. 2025, 182, 106856. [Google Scholar] [CrossRef]
- Li, B.; Xie, X.; Lei, H.; Fang, R.; Kang, Z. Simplified PCNet with robustness. Neural Netw. 2025, 184, 107099. [Google Scholar] [CrossRef] [PubMed]
- Zhan, S.; Jiang, H.; Shen, D. Co-regularized optimal high-order graph embedding for multi-view clustering. Pattern Recognit. 2025, 157, 110892. [Google Scholar] [CrossRef]
- Zhu, Y.; Li, Q.; Liu, W.; Yin, C. Diffusion process with structural changes for subspace clustering. Pattern Recognit. 2025, 158, 111066. [Google Scholar] [CrossRef]
- Xie, X.; Chen, W.; Kang, Z. Robust graph structure learning under heterophily. Neural Netw. 2025, 185, 107206. [Google Scholar] [CrossRef]
- Wu, T.; Lu, G.-F. Specific and coupled double consistency multi-view subspace clustering with low-rank tensor learning. Signal Process. 2025, 229, 109803. [Google Scholar] [CrossRef]
- Cheng, S.; Chen, X.; He, X.; Liu, Z.; Bai, X. PRA-Net: Point Relation-Aware Network for 3D Point Cloud Analysis. IEEE Trans. Image Process. 2021, 30, 4436–4448. [Google Scholar] [CrossRef]
- Kaur, A.; Kumar, Y.; Sidhu, J. Exploring meta-heuristics for partitional clustering: Methods, metrics, datasets, and challenges. Artif. Intell. Rev. 2024, 57, 287. [Google Scholar] [CrossRef]
Disclaimer/Publisher’s Note: The statements, opinions and data contained in all publications are solely those of the individual author(s) and contributor(s) and not of MDPI and/or the editor(s). MDPI and/or the editor(s) disclaim responsibility for any injury to people or property resulting from any ideas, methods, instructions or products referred to in the content. |
© 2025 by the authors. Licensee MDPI, Basel, Switzerland. This article is an open access article distributed under the terms and conditions of the Creative Commons Attribution (CC BY) license (https://creativecommons.org/licenses/by/4.0/).