Article

DCCopGAN: Deep Convolutional Copula-GAN for Unsupervised Multi-Sensor Anomaly Detection in Industrial Gearboxes

1
Department of Computer and Information Engineering, Shanxi Institute of Energy, Jinzhong 030006, China
2
School of Information and Software Engineering, University of Electronic Science and Technology of China, Chengdu 611731, China
*
Author to whom correspondence should be addressed.
Electronics 2025, 14(13), 2631; https://doi.org/10.3390/electronics14132631 (registering DOI)
Submission received: 20 May 2025 / Revised: 12 June 2025 / Accepted: 23 June 2025 / Published: 29 June 2025

Abstract

The gearbox, a key transmission device in industrial applications, can cause severe vibrations or failures when anomalies occur. With increasing industrial automation complexity, precise anomaly detection is crucial. This paper introduces DCCopGAN, a novel unsupervised framework that uses a deep convolutional copula-generative adversarial network for unsupervised multi-sensor anomaly detection in industrial gearboxes. Firstly, a Deep Convolutional Generative Adversarial Network (DCGAN) generator is trained on high-dimensional normal operational data from multi-sensors to learn its underlying distribution, enabling the calculation of reconstruction errors for input samples. Then, these reconstruction errors are analyzed by Copula-Based Outlier Detection (CopOD), an efficient non-parametric technique, to identify anomalies. In the testing phase, reconstruction errors for test samples are similarly computed, normalized, and then evaluated by the CopOD mechanism to assign anomaly scores and detect deviations from normal behavior. The proposed DCCopGAN framework has been validated on a real gearbox dataset, where experimental results demonstrate its superior anomaly detection performance over other methods.

1. Introduction

Gearboxes are integral to the power transmission pathways of numerous industrial systems, playing a pivotal role in mechanical equipment operation [1]. Given their critical function during sustained, long-term use, any malfunction can precipitate severe operational disruptions, including excessive vibration, accelerated equipment wear, and, in worst-case scenarios, complete system shutdowns leading to substantial economic repercussions [2]. Consequently, the ability to promptly identify and diagnose anomalous gearbox states is paramount for preempting potential failures and safeguarding the continuous, safe, and efficient operation of industrial machinery [3]. In this context, unsupervised anomaly detection, which obviates the need for pre-labeled fault data, presents significant practical value, particularly in scenarios [4] where acquiring such labels is infeasible or cost-prohibitive.
While anomaly detection techniques have been extensively investigated, a considerable number of established methods depend on supervised learning paradigms that require access to labeled datasets [5]. Traditional supervised approaches can achieve high detection accuracy when provided with ample and representative labeled data [6,7,8]. For instance, Wang et al. [9] introduced an impulse information-enhanced semi-supervised learning model to improve low-label fault diagnosis, and Chuphal et al. [10] proposed an anomaly detection method for motor-driven fan systems based on Mel-frequency cepstral coefficients and artificial neural networks. Nevertheless, in practical industrial settings, the acquisition of comprehensively annotated data is often a costly and time-consuming endeavor. Furthermore, anomalous events are typically infrequent, making it challenging to compile an adequate training set for supervised models [11]. This inherent limitation has spurred considerable research into the development of robust unsupervised anomaly detection methodologies.
Nevertheless, the deployment of unsupervised anomaly detection methods in practical industrial settings is fraught with its own set of challenges. By definition, these methods cannot depend on pre-existing label information. Instead, they must autonomously discern and learn patterns indicative of anomalies directly from raw data, without explicit classification guidance [12,13,14,15]. Compounding this, the infrequent occurrence and diverse manifestations of abnormal events necessitate that unsupervised techniques possess superior generalization capabilities [16] to effectively address a wide spectrum of potential failure modes and previously unencountered abnormal states.
However, existing unsupervised methods often rely on either shallow feature extraction or assume specific data distributions, which limit their ability to generalize across heterogeneous multi-sensor inputs [17,18,19]. Furthermore, conventional discriminators or density-based models struggle with jointly modeling high-dimensional interdependencies among sensor signals [20]. Therefore, there remains a significant gap in robust [21,22] and distribution-agnostic anomaly detection techniques tailored for multi-sensor environments in gearbox systems.
To bridge this gap, we propose a hybrid framework, DCCopGAN, that synergistically combines deep feature reconstruction via DCGAN and dependency-aware anomaly scoring via CopOD. This approach synergistically combines the representational power of Deep Convolutional Generative Adversarial Networks (DCGANs) [23] for learning complex data distributions with the discriminative capabilities of Copula-Based Outlier Detection (CopOD) [24] for anomaly detection. The primary contributions of this research are delineated as follows:
(1)
A novel unsupervised multi-sensor anomaly detection framework, DCCopGAN, is proposed. DCCopGAN employs a Deep Convolutional Generative Adversarial Network (DCGAN) to generate reconstruction errors from high-dimensional multi-sensor data. These errors are then analyzed by an efficient and distribution-agnostic Copula-Based Outlier Detection (CopOD) for accurate anomaly identification and robust generalization.
(2)
The development of an effective fault detection method that operates in a purely unsupervised manner, making it highly suitable for industrial scenarios where labeled data is often unavailable.
(3)
Comprehensive validation of the DCCopGAN model on a real-world gearbox dataset, demonstrating its superior accuracy and robustness compared to existing unsupervised methods and confirming its practical applicability.
The remainder of this paper is organized as follows: Section 2 details the grounded theory used in this paper. Section 3 describes the implementation of the proposed DCSGAN method. Section 4 describes the experimental design, the dataset utilized, and the model evaluation metrics. Section 5 presents and discusses the experimental results. Finally, Section 6 summarizes the key findings and outlines directions for future research.

2. Preliminaries

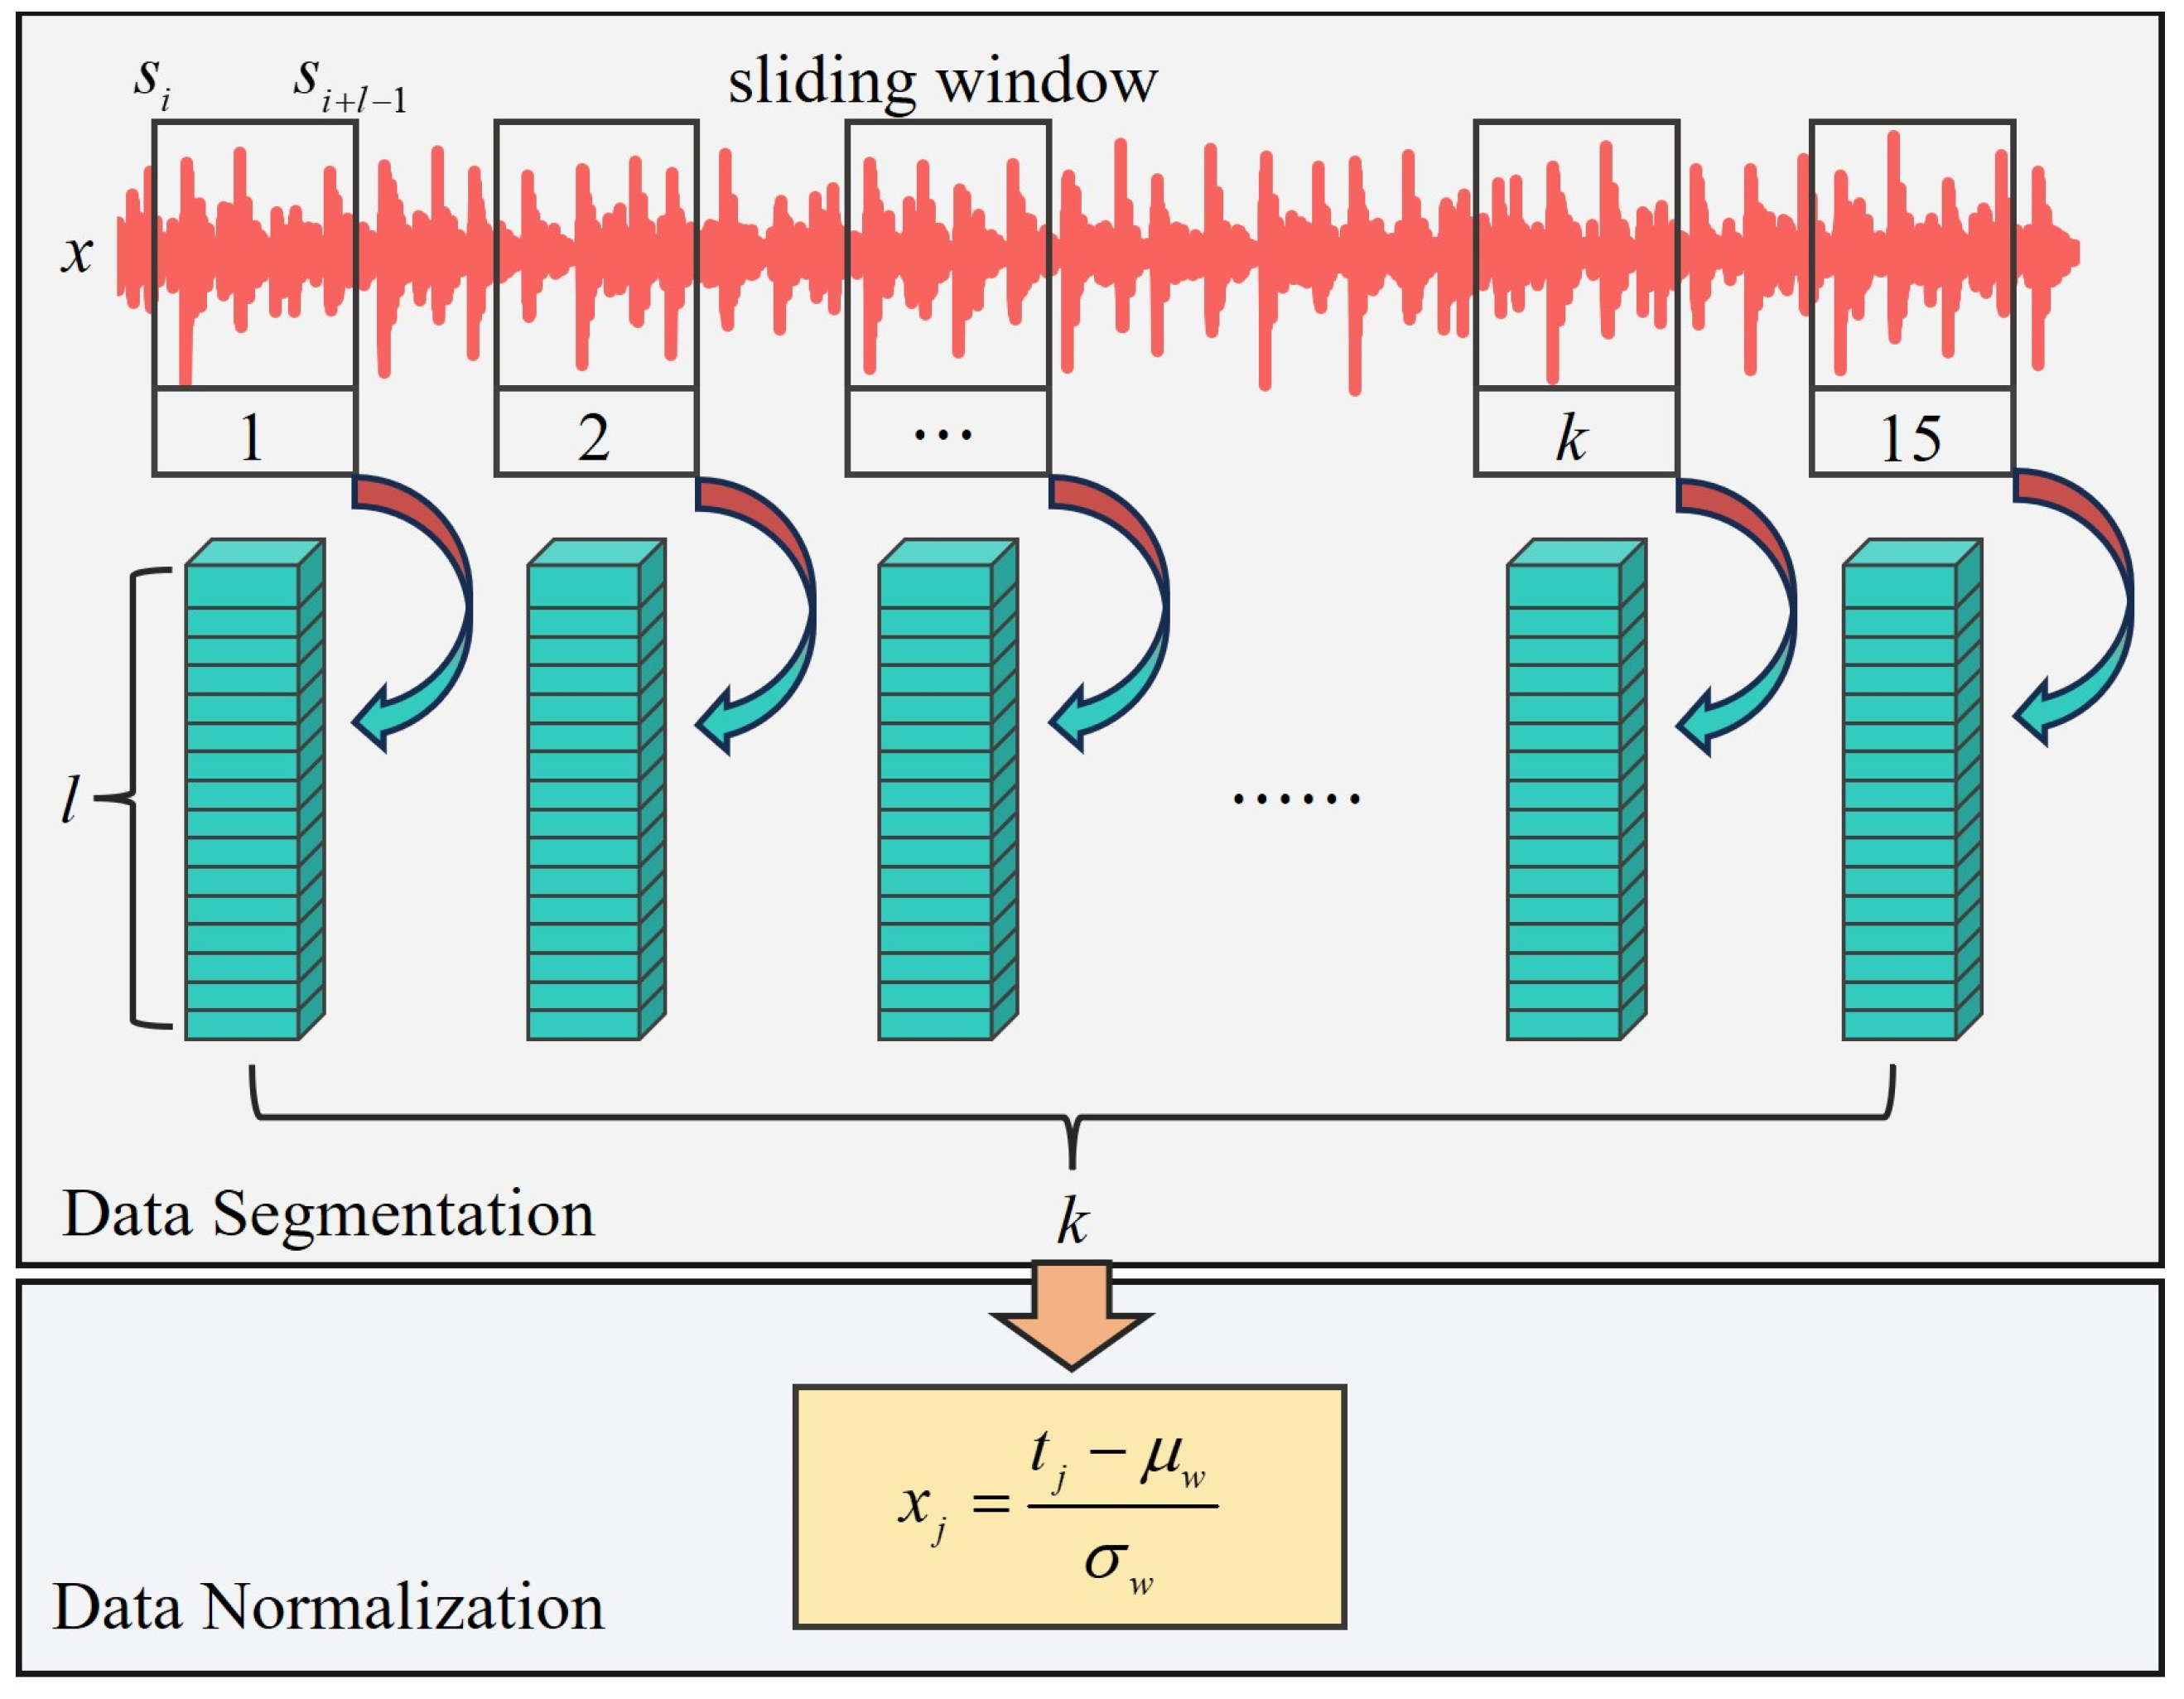
2.1. Data Preprocessing and Preparation

Effective data preparation is a foundational step for developing robust machine learning models. For time-series data x, this paper employs a sliding window approach for data segmentation. A window of a predefined length l traverses the continuous time series, T = { t 1 , t 2 , , t N } , where N is the total number of time steps. Segments are extracted, often with a random starting point s i for each window, to form k individual samples. Each extracted segment, T i , is treated as an independent data sample for subsequent analysis. The flowchart of data preprocessing and preparation is shown in Figure 1.
The sampling process can be formally described as generating a dataset S:
S = { T i } i = 1 k ,   where   T i = { T s i , T s i + 1 , , T s i + l 1 }
where l + is the fixed window length, and s i is the starting index for the i-th sample, typically chosen such that s i U ( 1 , N l + 1 ) for random sampling.
Following segmentation, each resulting sample T i undergoes normalization. This step normalizes the data within each window to have a zero mean and unit variance, mitigating issues related to differing scales or offsets. For a data point t j within a specific window, its normalized [25] value x j is calculated as:
x j = t j μ w σ w
where μ w is the mean and σ w is the standard deviation of the data points within that particular sliding window.

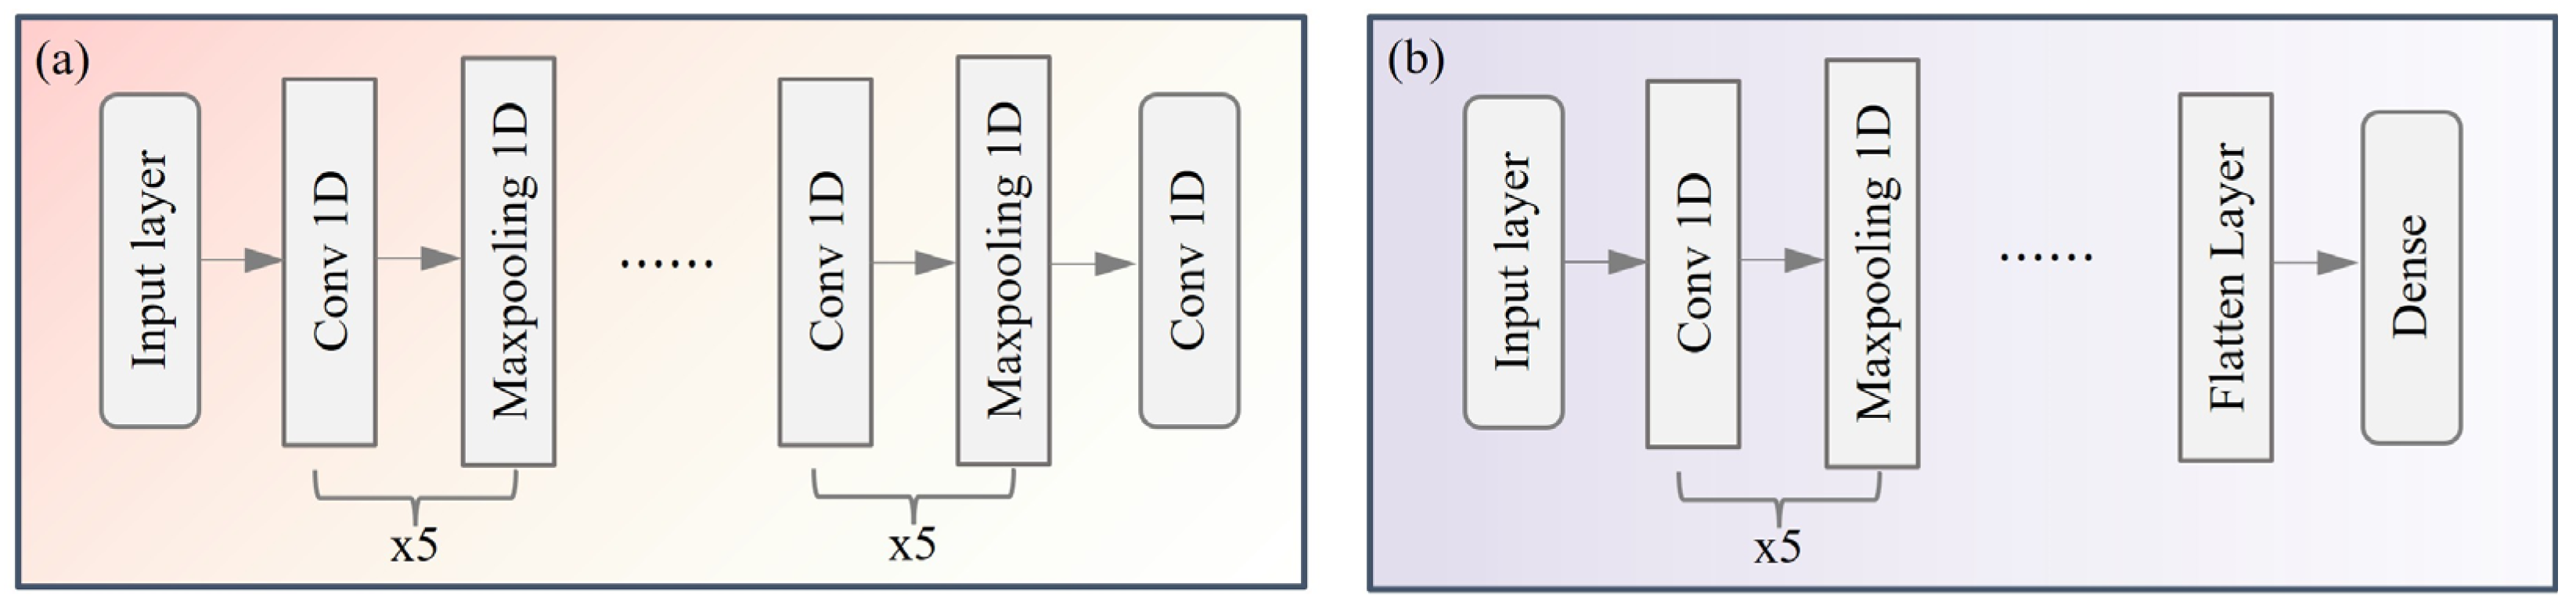
2.2. Deep Convolutional Generation Adversarial Network

This paper utilizes a DCGAN to learn robust representations of normal data, facilitating anomaly detection via reconstruction analysis [26]. The DCGAN architecture comprises two antagonistically trained neural networks: a Generator G and a Discriminator D. As shown in Figure 2, G is composed of multiple one-dimensional convolution layers [27], maximum pooling layer [28], and an upper sampling layer [29], while D also consists of multiple convolutional layers and a flatten layer.
The generator G is constructed using a multi-layered convolutional architecture designed to extract and model the distinctive characteristics of the input data. Through a reconstruction process, it aims to produce outputs that closely resemble the original inputs. The model is trained by minimizing the difference between the generated sample and the real sample, with the loss function L G :
L G = E z p z ( z ) [ log D ( G ( z ) ) ]
where E z p z ( z ) is the expectation of random noise z. G ( z ) is the reconstructed sample generated by G, and z denotes random noise vectors, which are typically from a prior distribution p z ( z ) and normally distributed (0,1).
The discriminator D functions as an evaluator, tasked with assessing the authenticity of samples produced by G. Structured with a series of convolutional layers, it processes input data to make a binary determination. The formula is expressed as:
D ( x ) = θ ( W x + b )
where θ is the sigmoid function. W represents the weight matrix of the discriminator, while b denotes the bias term that calibrates the linear combination of output.
Throughout the training procedure, the discriminator D undergoes updates by alternating between real sample training and generated sample evaluation with the loss function of the discriminator L D :
L D = E x p d a t a ( x ) [ log D ( x ) ] E z p z ( z ) [ log ( 1 D ( G ( x ) ) ) ]
where E x p d a t a ( x ) is the expectation of the real data x, which is derived from the distribution p d a t a ( x ) . The term log D ( x ) is the logarithm of the discriminator prediction probability for the real data x, while log ( 1 D ( G ( x ) ) ) represents the logarithm of the discriminator prediction probability for the fake data G ( x ) generated by the generator.
The DCGAN is trained iteratively in a minimax game, striving towards the overall objective:
min G max D V ( D , G ) = E x p d a t a ( x ) [ log D ( x ) ] + E z p z ( z ) [ log ( 1 D ( G ( x ) ) ) ]
Post-training, generator G can reconstruct input data. Anomalies, deviating from the learned normal data manifold, will yield higher reconstruction errors. The reconstruction error R ( x ) using Mean Squared Error can be expressed as:
R ( x ) = 1 N t i = 1 N t ( x i x i )
where N t is the number of training samples. x i and x i are the raw sample and the reconstructed sample by G, respectively.

2.3. Copula-Based Outlier Detection

Upon obtaining reconstruction errors R ( x ) , which can be a multivariate vector if per-feature errors are considered, from the DCGAN, Copula-Based Outlier Detection (CopOD) is applied for anomaly identification. CopOD identifies statistically rare data points by leveraging copula theory to model the dependence structure within multivariate data. The core of this theory is Sklar’s theorem, which allows any d-dimensional joint cumulative distribution function (CDF), F ( x 1 , x 2 , , x d ) , to be expressed through its marginal CDFs F j ( x j ) and a copula function C that captures their interdependencies:
F ( x 1 , , x d ) = C ( F 1 ( x 1 ) , , F d ( x d ) )
where the copula C describes how the variables relate, independent of their individual distributions.
Utilizing this, CopOD scores anomalies by first empirically estimating the marginal CDF F ^ j ( x j ) for each dimension j of the input data (e.g., reconstruction errors R(x) from n observations):
F ^ j ( r j ) = 1 n i = 1 n I ( r j , i r j )
where I is an indicator function, and can also be regarded as a characteristic function.
From these empirical marginals, let i , j , i , j and λ i , j denote the derived left-tail p l i , right-tail p r i , and skewness-corrected tail p s i probabilities for the j-th dimension of a data point R ( x ) i . CopOD then aggregates these across all d dimensions, often as sums of negative log-likelihoods:
p l i = j = 1 d log ( ^ i , j ) p r i = j = 1 d log ( ^ i , j ) p s i = j = 1 d log ( λ ^ i , j )
The final anomaly score O ( R ( x ) i ) for the data point is the maximum of these aggregated values, with higher scores indicating a greater likelihood of being an anomaly:
O ( R ( x ) i ) = max ( p l i , p r i , p s i )
It is worth noting that although alternative anomaly scoring methods exist, such as utilizing the DCGAN discriminator’s output [30] or employing traditional density estimation techniques [31] on the reconstruction errors, CopOD is specifically chosen in this framework for its superior suitability in analyzing the multivariate reconstruction error vector R(x). Unlike a single discriminator score, CopOD leverages the full dimensionality of R(x), retaining detailed information about the location and magnitude of reconstruction discrepancies across different features. Furthermore, compared to density estimators that often assume specific data distributions, CopOD is non-parametric and distribution-agnostic, relying on empirical cumulative distribution functions (ECDFs) to assess rarity. This makes it highly robust to the potentially complex and non-Gaussian distribution of reconstruction errors generated by DCGAN. Crucially, CopOD’s core strength lies in its ability to identify anomalies as points that are jointly rare across multiple dimensions of the error vector, effectively capturing subtle patterns indicative of abnormal behavior in high-dimensional multi-sensor data that might be missed by simpler scoring methods.

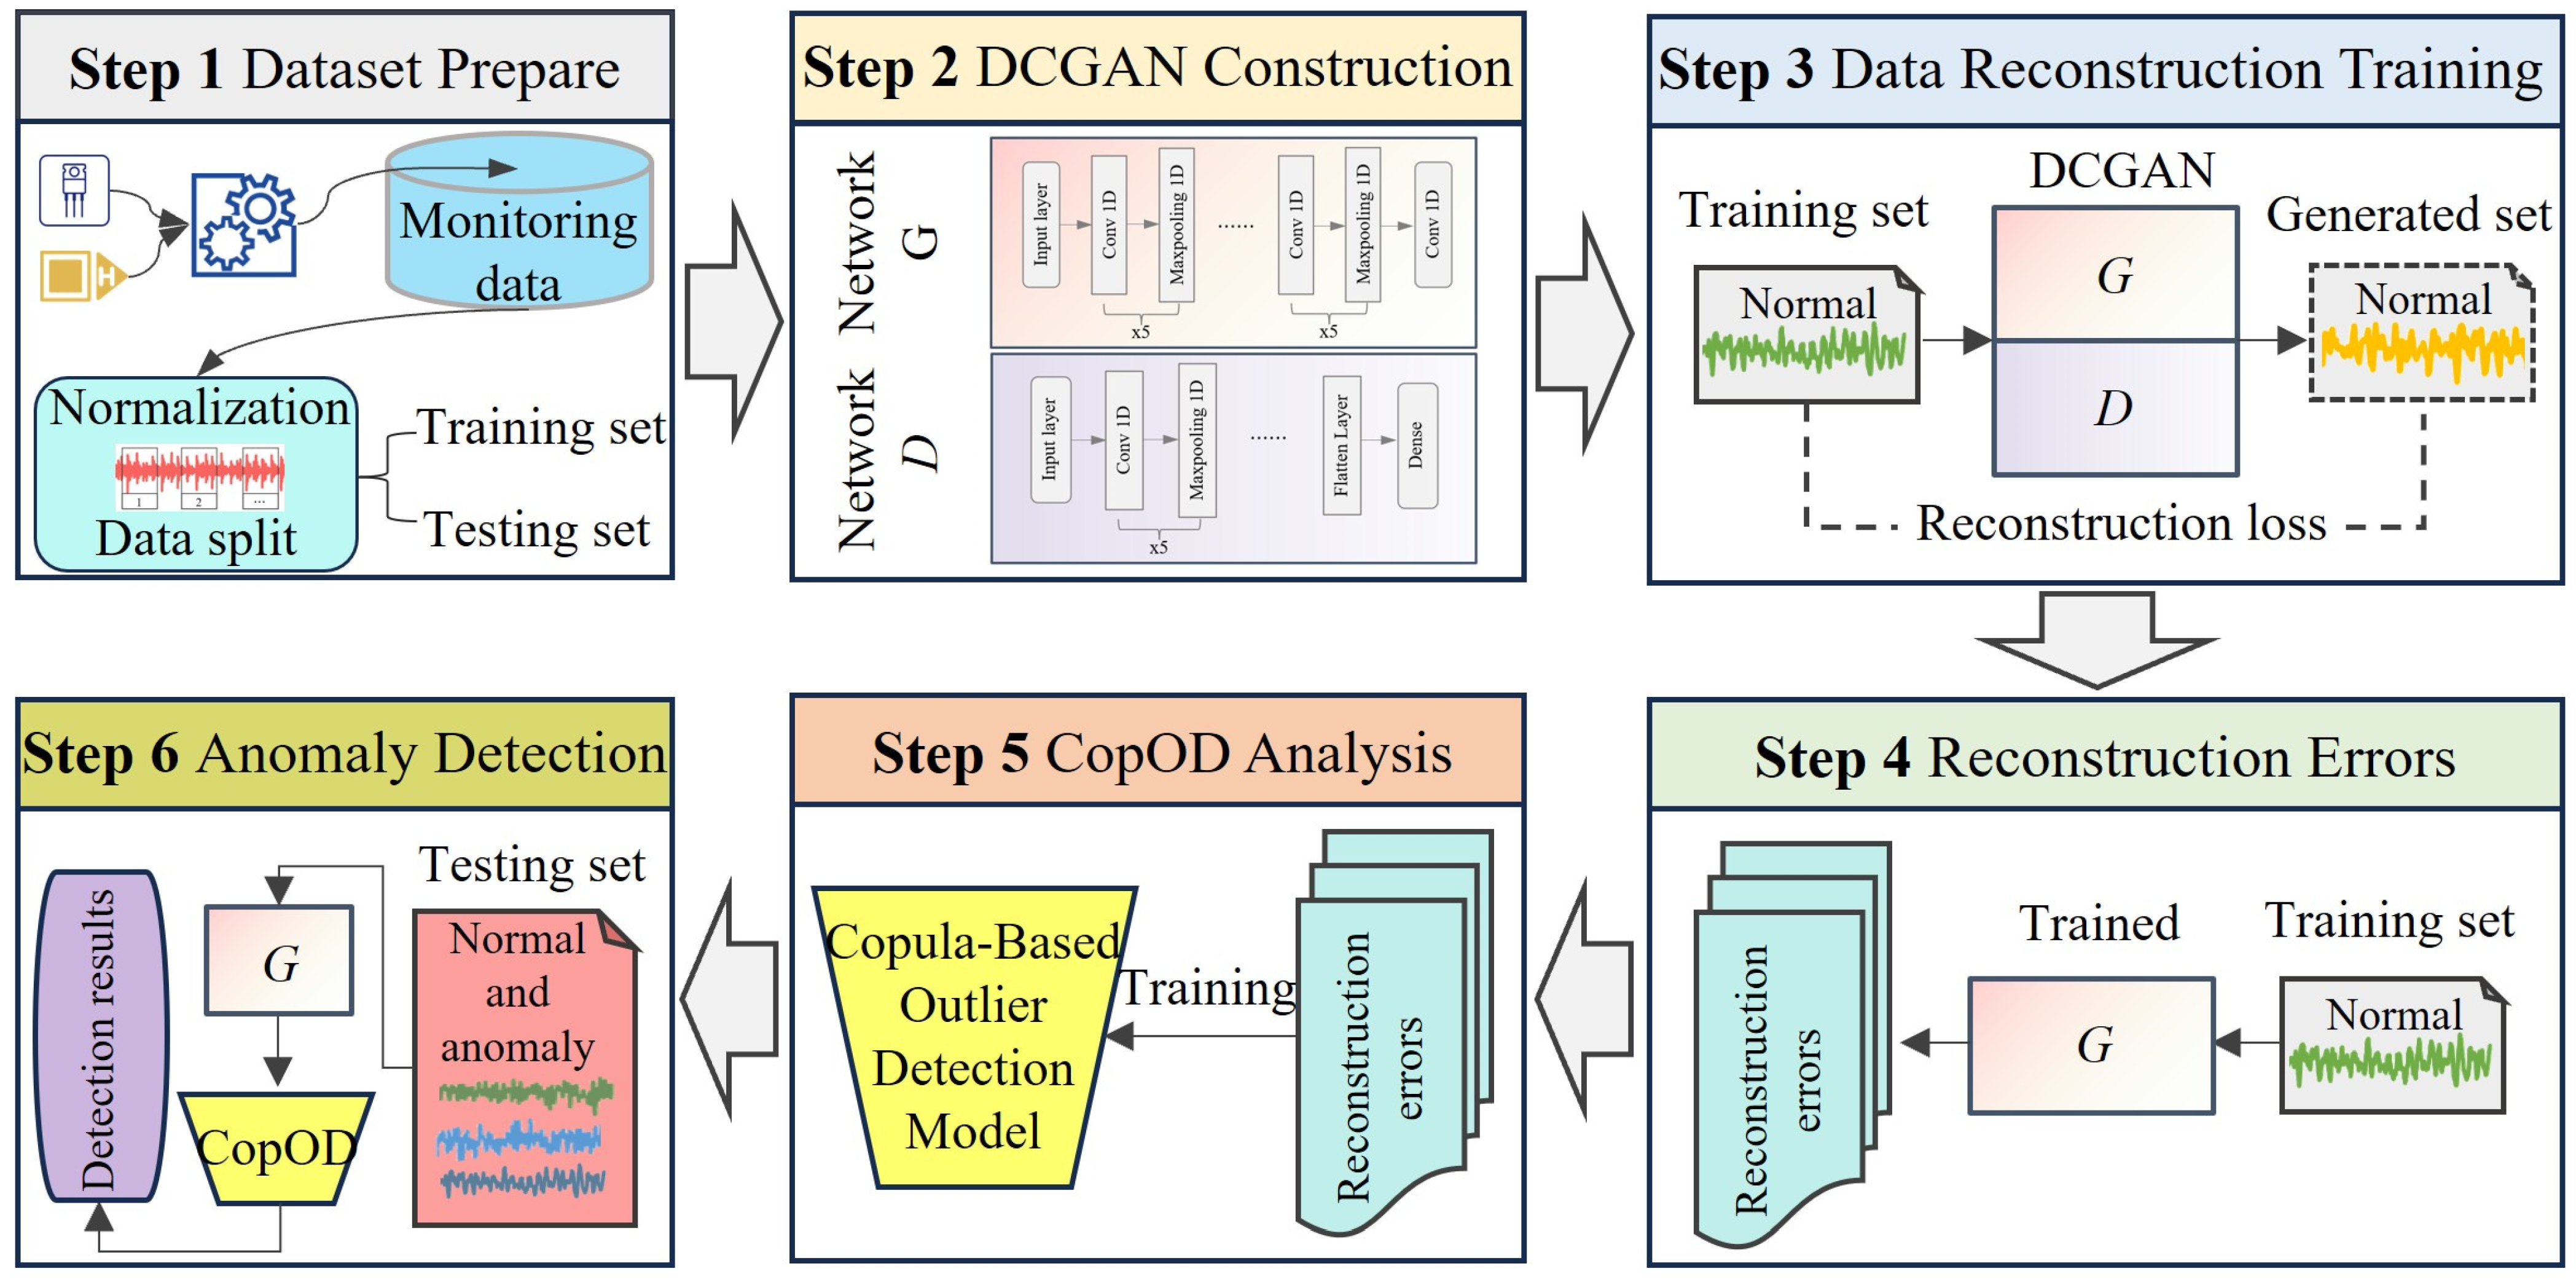
3. The Proposed DCCopGAN

The flowchart of the proposed Deep Convolutional Copula-Generative Adversarial Network (DCCopGAN) for anomaly detection is illustrated conceptually in Figure 3. The overall process can be outlined in the following steps:
Step 1: The dataset is loaded and subsequently normalized using Equations (1) and (2) to prepare the data for model input.
Step 2: Construct the DCGAN model, defining generator and discriminator networks based on Equations (3)–(5).
Step 3: Alternately train the generator G and discriminator D of DCGAN to achieve high-quality data reconstruction, guided by Equation (6).
Step 4: Calculate reconstruction errors for the normal sample from training set data using the trained DCGAN generator G, as per Equation (7).
Step 5: Analyze the reconstruction errors with CopOD, using its empirical copula-based tail probability assessment (Equations (9)–(11)) for unsupervised anomaly identification.
Step 6: Compute reconstruction errors for normal and anomaly samples from test data and use the CopOD mechanism for anomaly detection.

4. Experiments

To verify the validity of the proposed DCCopGAN under unsupervised conditions and high-dimensional monitoring data, two gearbox datasets are chosen. The following section describes the datasets used in the experiment, experimental setups, the comparative methods, and the details of DCCopGAN.

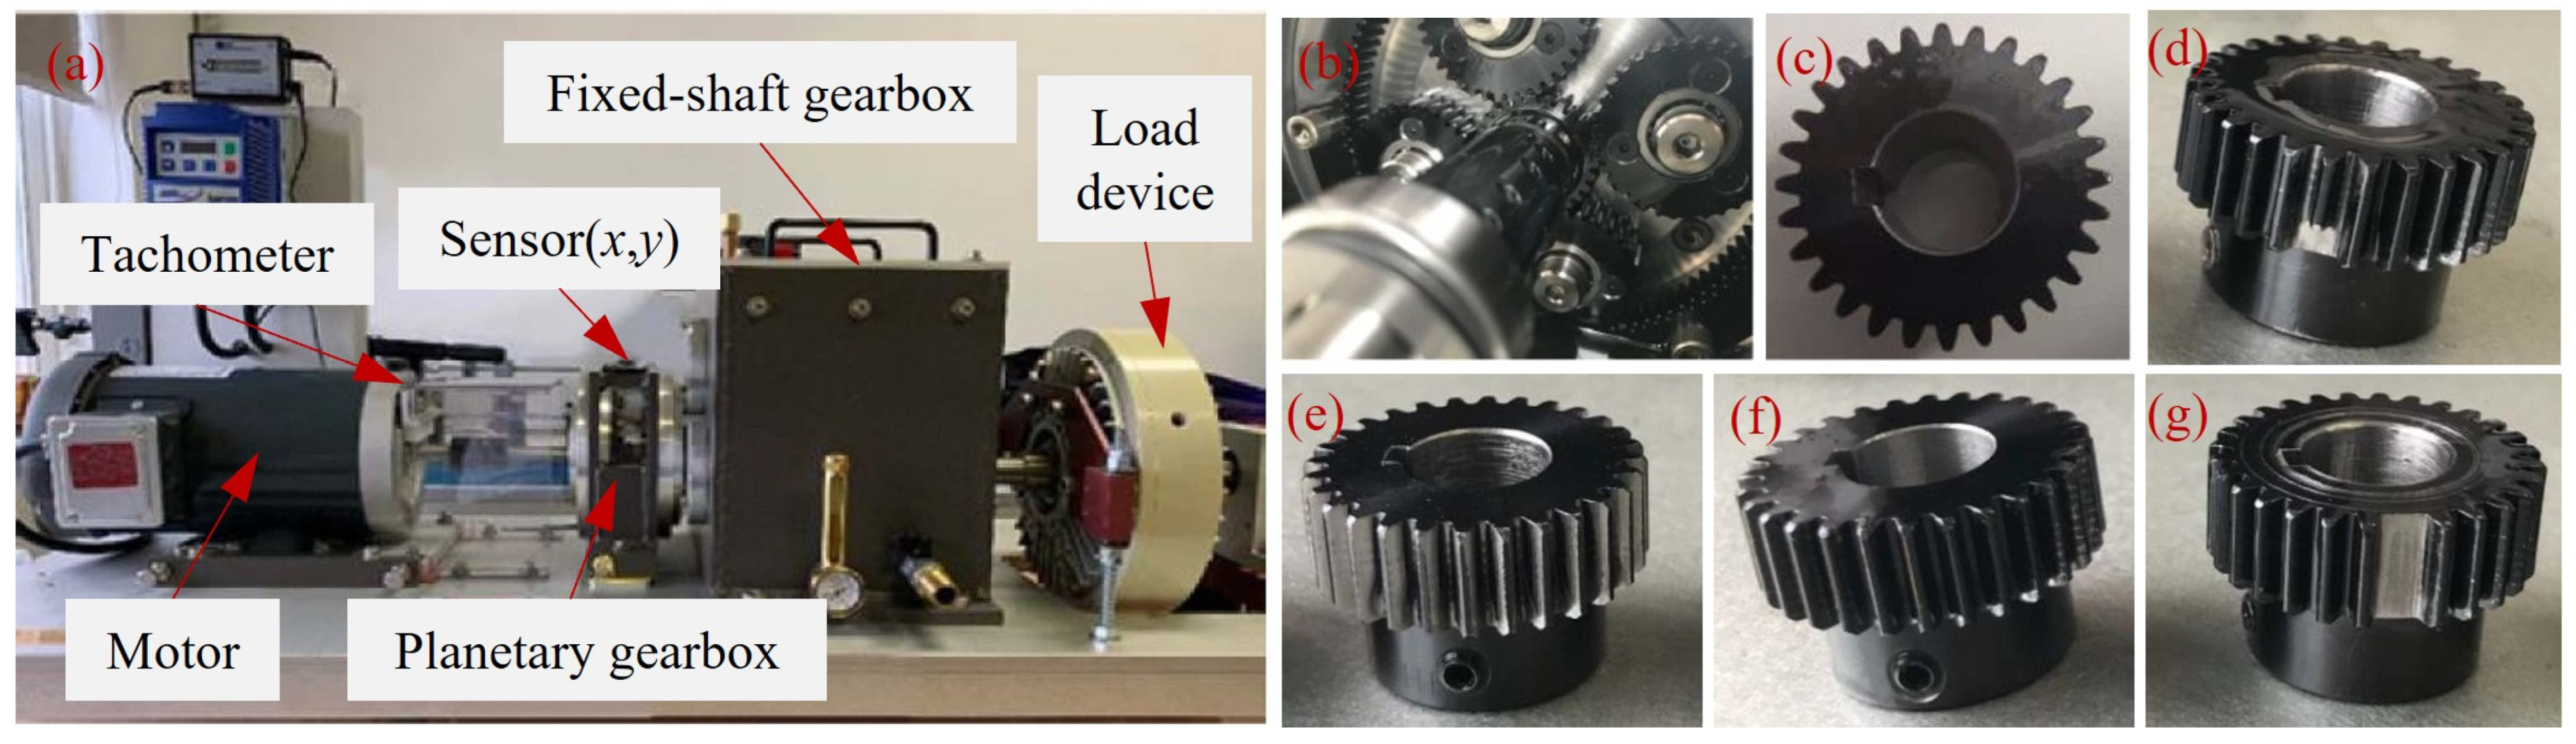
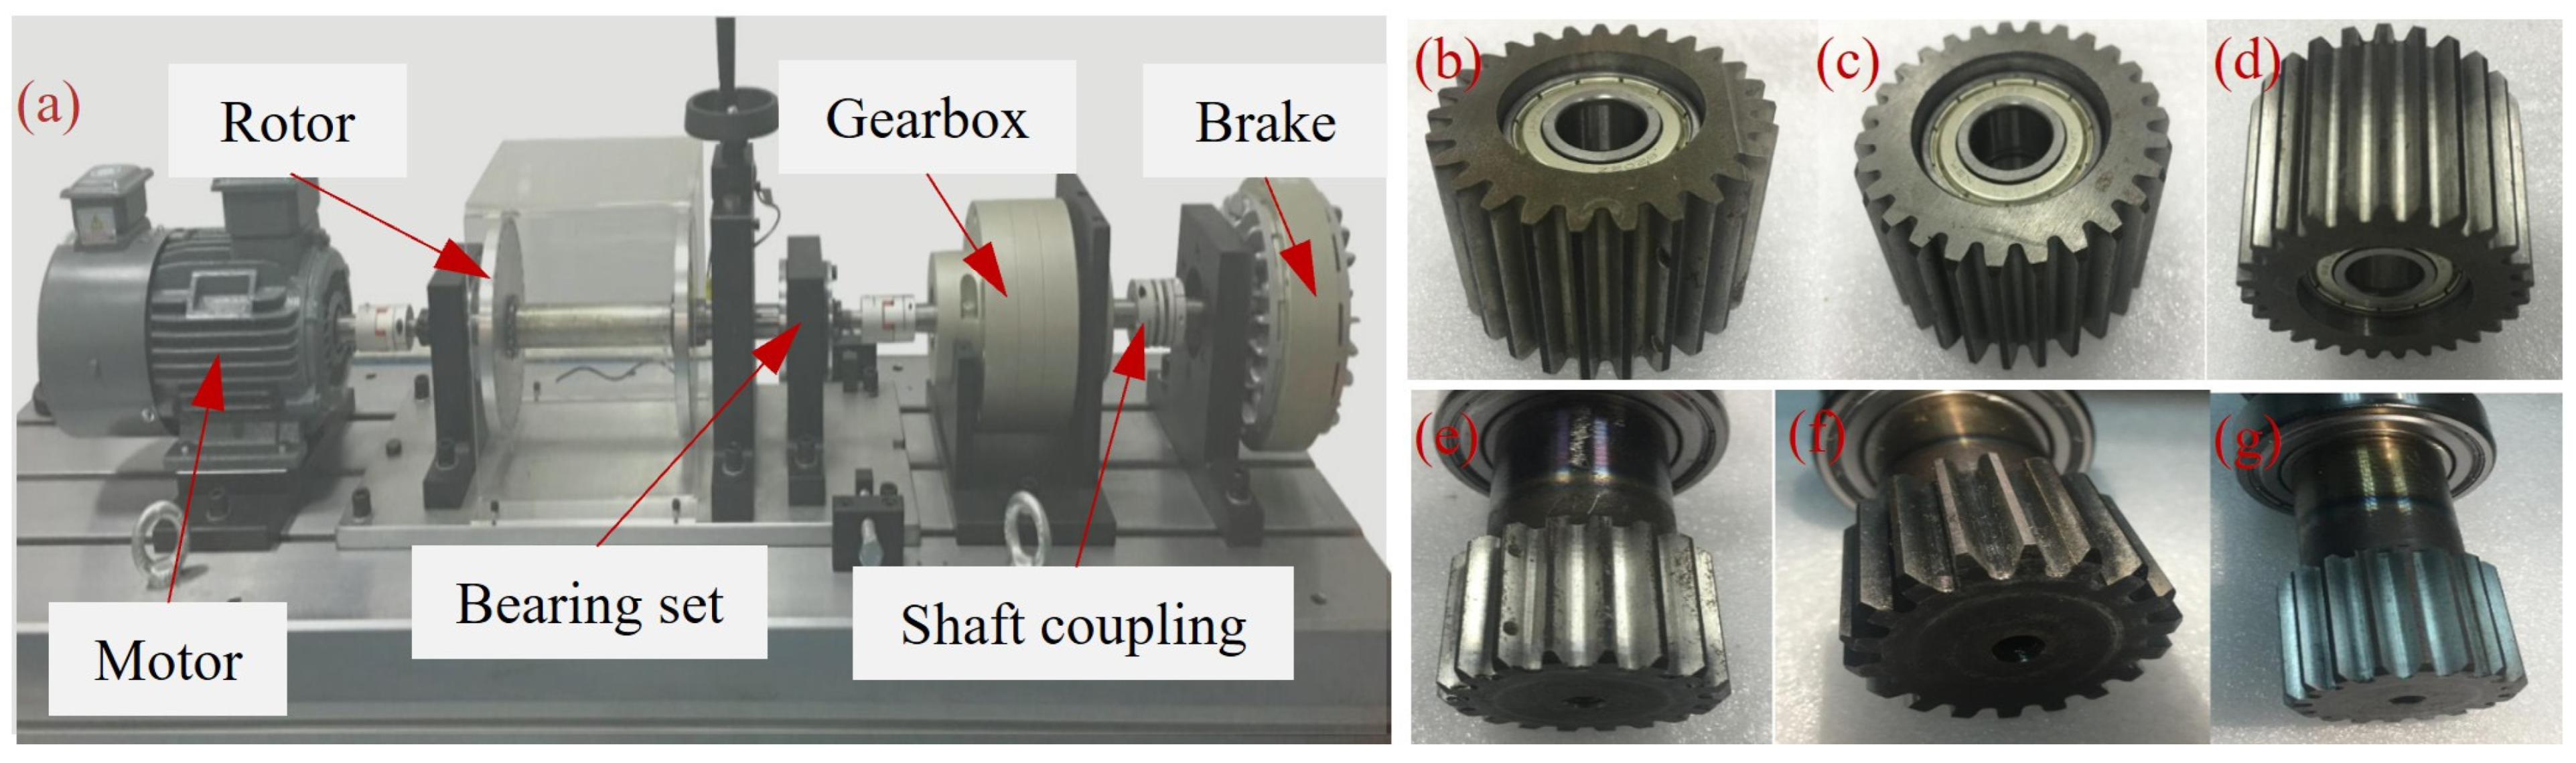
4.1. Dataset Description

The WT-Planetary gearbox dataset [32] was delicately collected, prepared, and publicly released by a research team from Beijing University of Technology to explore the intelligent detection and state recognition of wind turbine planetary gearboxes. The experimental test rig used to collect this dataset is illustrated in Figure 4. The test rig primarily consists of a motor, a planetary gearbox, a fixed-shaft gearbox, a tachometer, and a load device. The planetary gearbox contains four planet gears rotating around a sun gear. Additionally, the WT-Planetary gearbox dataset focuses on five distinct health states of the sun gear: healthy, broken tooth, wear, crack, and missing tooth, as depicted in Figure 4c–g.
During data acquisition, vibration signals are collected by a Sinocera CA-YD-1181 accelerometer (Yangzhou, China), and an encoder is used to capture the speed pulses of the input shaft. All signals are sampled at a frequency of 48 kHz. For each health condition, data was collected for over 5 min. The dataset includes data from two vibration channels (x and y directions) and one encoder channel; signals in each class contain at least 3 × 14,400,000 data points. The experimental data covers eight different speed conditions (20 Hz, 25 Hz, 30 Hz, 35 Hz, 40 Hz, 45 Hz, 50 Hz, and 55 Hz), which are considered for each health state. Furthermore, to account for the installation effect, data for all health conditions and operating speeds were collected twice, with disassembly and reinstallation between sessions.
Further, we conduct challenging experiments using the SDUST gear dataset [33] provided by Shandong University of Science and Technology. This dataset is acquired from a modular fault simulation platform, as illustrated in Figure 5a, which comprises an AC motor, a 6205 rolling bearing, a planetary gearbox, and a magnetic powder brake. The setup enables the simulation of various fault modes under controllable load and speed conditions. Artificially induced faults include pitting, cracking, and wear on both sun and planet gears, as shown in Figure 5b–g. The system operates under both steady and fluctuating rotational speeds (1000–3000 rpm) and various loads (0–0.5 A), making it representative of complex and dynamic industrial conditions. Data are collected via two tri-axial piezoelectric accelerometers installed on both the bearing seat and gearbox, yielding six-channel vibration signals sampled at 25.6 kHz for 40 s per trial.

4.2. Experimental Setups

To comprehensively evaluate the robustness and generalization of the proposed DCCopGAN, we designed two experiments, each containing two tasks, summarized in Table 1. Notably, both cross-scenario tasks (Task B and Task D) reflect real-world challenges in industrial monitoring, such as sensor reinstallation and operating conditions variability.
Specifically, in Experiment E1, the data under the condition of a speed of 40 Hz were selected for analysis in two different mounting positions. We obtained 500 samples of length 1024 using the truncation and random sampling provided in Section 2.1 in each health state, and finally, 5 × 500 × 3 × 1024 × 2 data points were obtained. The dataset division for Experiment E2 is the same as E1, with 400 training samples and 100 test samples. The details of anomaly detection task settings of Experiment E1 are shown in Table 2, and those for Experiment E2 are shown in Table 3.

4.3. Comparative Methods

The experimental evaluation compared five anomaly detection methods: (1) a standalone one-class support vector machine (OCSVM) [34]; (2) an integrated architecture combining a convolutional autoencoder [35] with OCSVM (CSVM); (3) a framework merging a variational autoencoder [36] and OCSVM (VSVM); (4) a hybrid system incorporating a graph autoencoder [37] with OCSVM (GSVM); and (5) our proposed deep convolutional copula-generative adversarial network (DCCopGAN). Comprehensive methodology comparisons and parameter configurations for all comparative methods are elaborated in Table 4.

4.4. The Details of DCCopGAN

The architectural configurations of generator G and discriminator D are detailed in Table 5, with components corresponding to specific neural network layers. Notably, the final layer of G utilizes convolution operations to ensure dimensional compatibility with input data. Regarding the discriminator structure, Block 6 performs dimensionality reduction through flattening, followed by dense layers, which implement a fully connected architecture.
To ensure fair comparison with the baseline models and facilitate reproducibility, the proposed DCCopGAN was trained under the same general training hyperparameters as the other comparative methods listed in Table 4. The generator was optimized using mean squared error (MSE) loss, while the discriminator used binary cross-entropy (BCE) loss. The generator adopts ReLU activation functions and incorporates batch normalization after each convolutional layer to stabilize training and accelerate convergence. The discriminator employs LeakyReLU activations to prevent dying neuron problems. All weights in both networks are initialized using the Xavier uniform initialization method.
Remarkably, encoder signals of the WT-Planetary gearbox dataset serve as embedded angular position sources containing rich mechanical state information [38]. Stiffness changes during faults cause speed fluctuations effectively captured in encoder signals, which also offer superior low-frequency response. In the proposed DCCopGAN, encoder signals are concatenated with vibration signals as input. These data from different sources exhibit distinct statistical and physical properties, reflecting lateral and torsional vibrations, respectively. This provides complementary multi-sensor information for more comprehensive health monitoring. While raw vibration signals are directly applied, second-order differences [39] of encoder signals are selected as input since they more directly reflect torsional vibrations caused by mechanical faults.

5. Results and Discussion

To rigorously assess the effectiveness of different unsupervised anomaly detection methods, we established multifaceted evaluation experiments, including model stability based on training and validation loss metrics, classification accuracy on anomaly detection, clustering effect on feature, and a scientific ablation study.

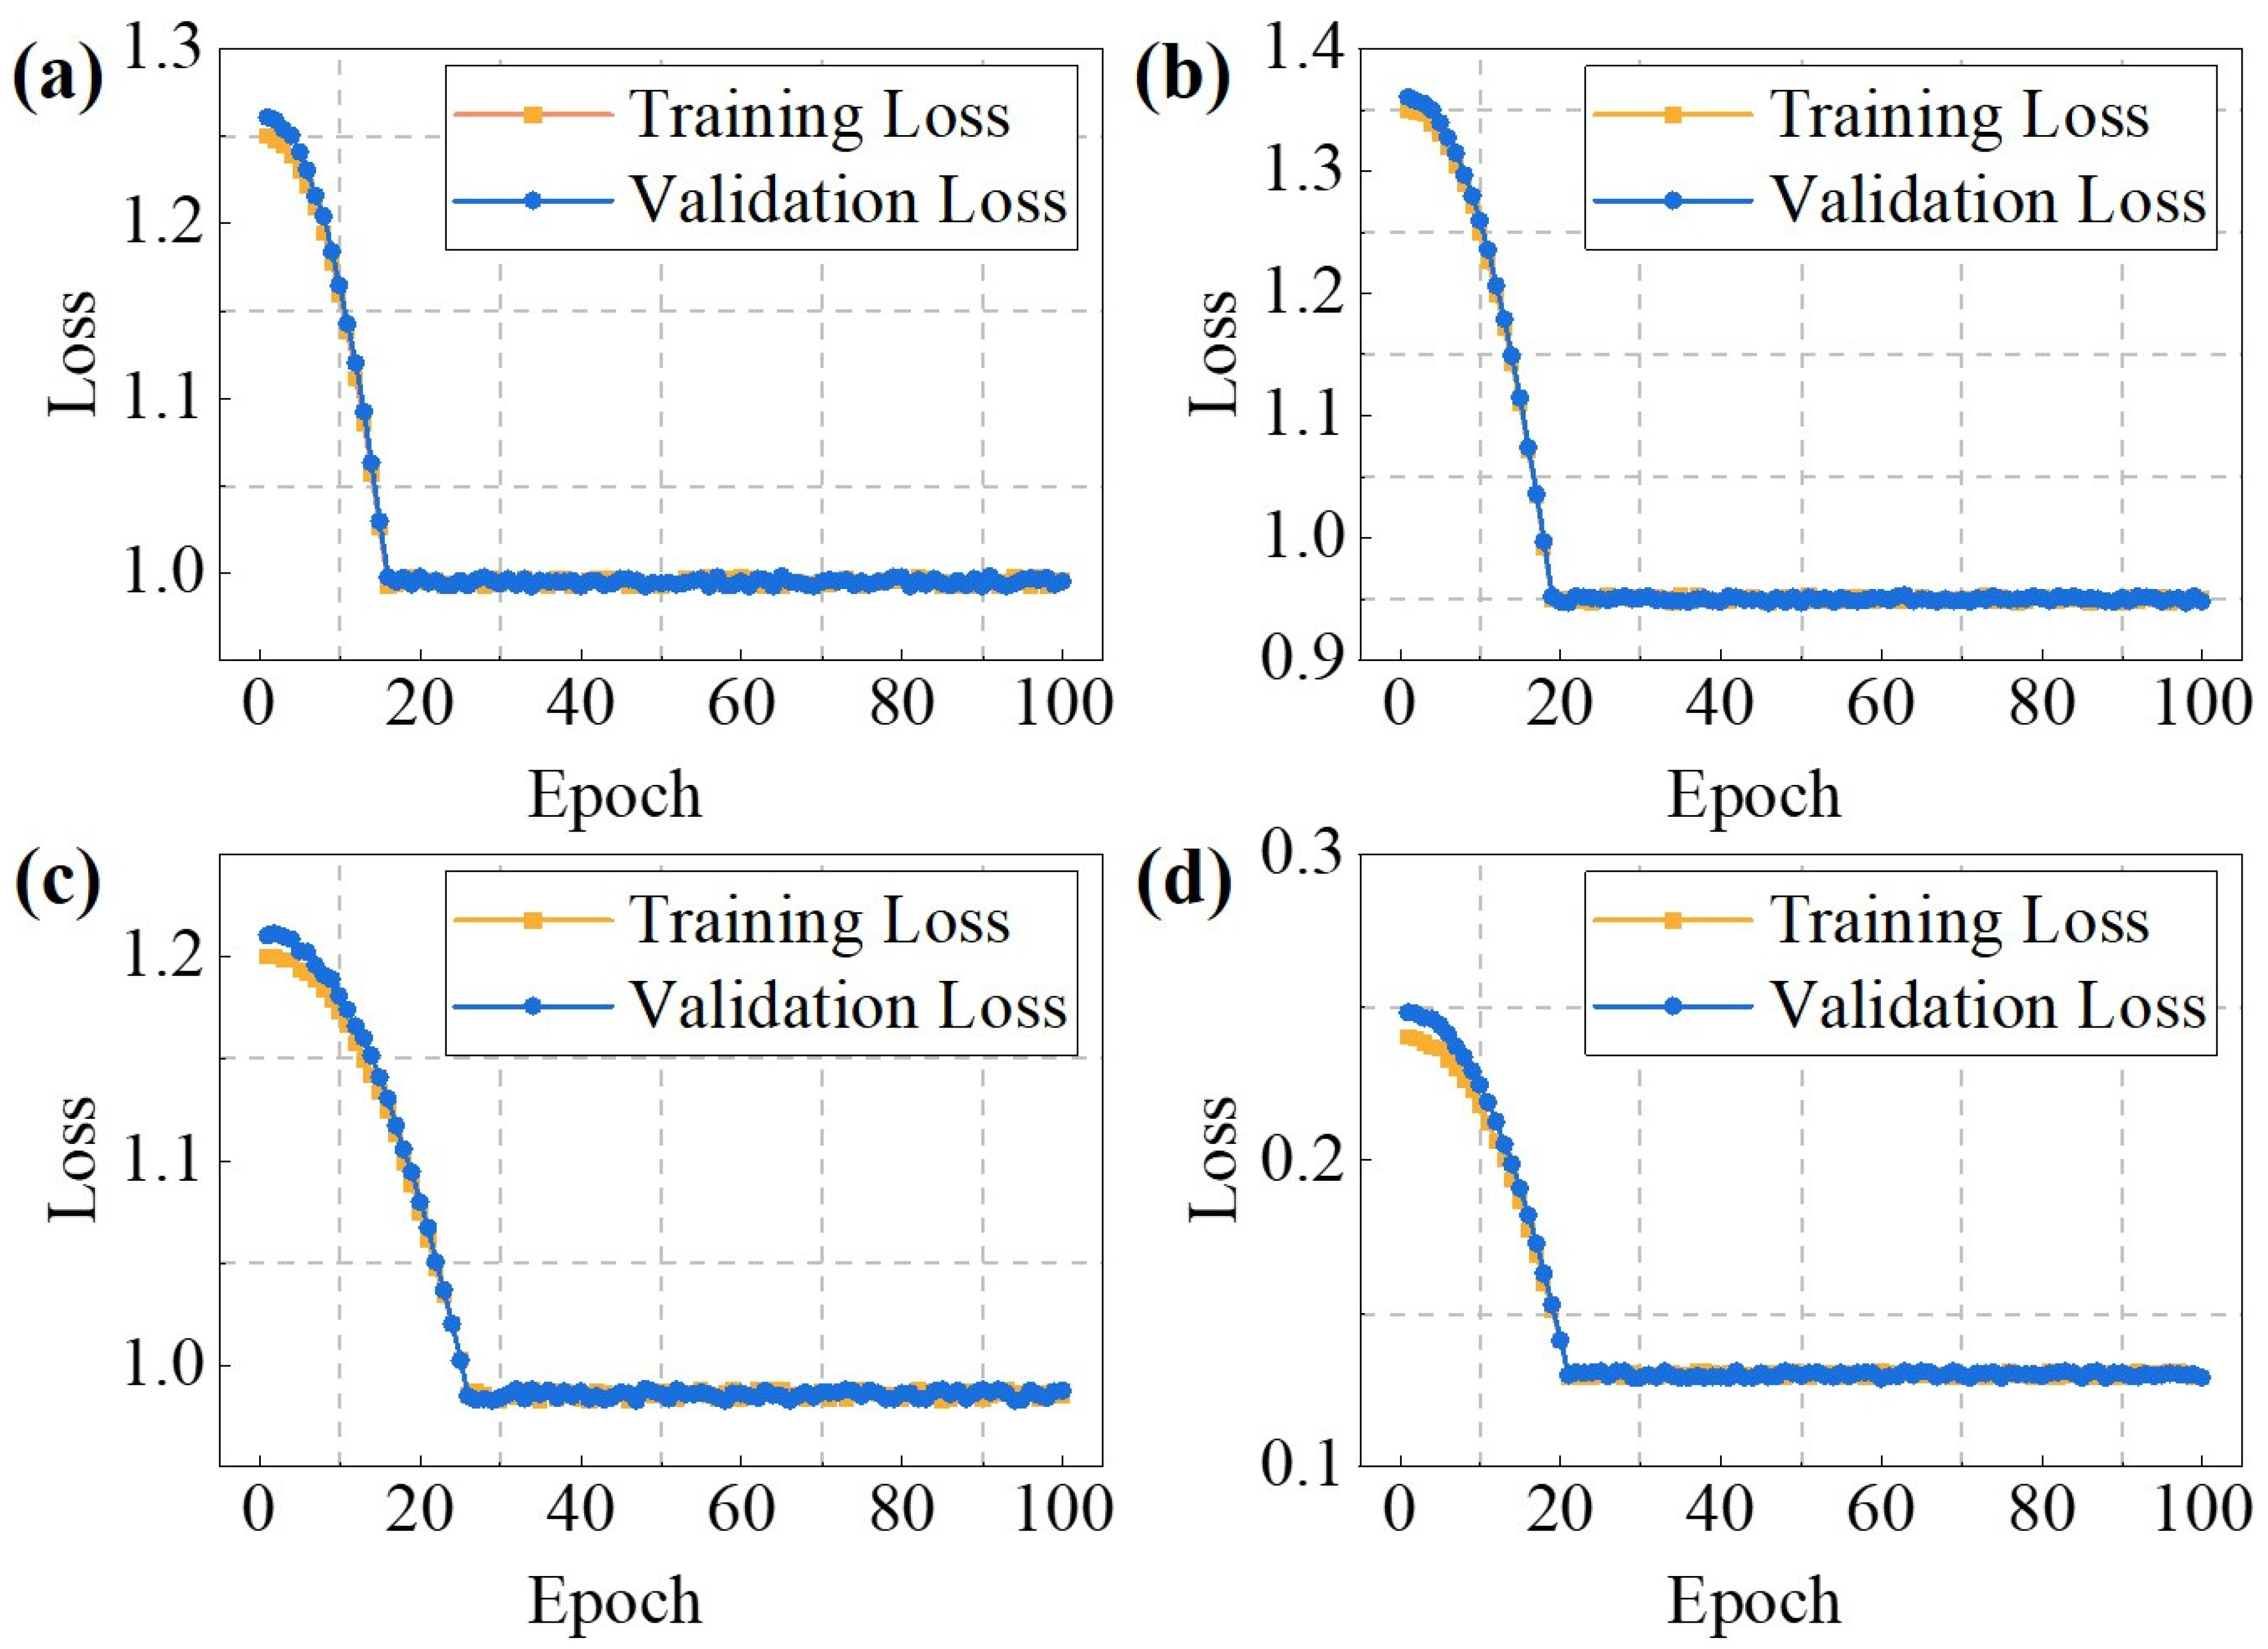
5.1. The Stability of Various Models

To assess the stability and learning capabilities of different models on normal data, we first evaluated their performance when trained and validated using only normal samples of the WT-Planetary Gearbox dataset. Specifically, 400 normal samples constituted the training set, while the remaining 100 normal samples formed the validation set. This setup allowed for a comparison between the proposed DCGAN’s ability to effectively capture the underlying distribution of healthy samples through reconstruction and that of established autoencoder architectures. These comparative autoencoders, namely the Convolutional Autoencoder (CAE), Variational Autoencoder (VAE), and Graph Autoencoder (GAE), are detailed in Section 4.3. Each model was tasked with learning from the training set, and its generalization ability was subsequently verified using the unseen healthy samples in the validation set.
The learning effect and stability on normal samples were evaluated by observing training and validation losses. Figure 6 shows these loss curves for each model. The proposed DCGAN model not only demonstrated good convergence and stability comparable to other models, but more importantly, its training and validation losses ultimately converged to a value of approximately 0.13, which is substantially lower than the approximate range of 0.985 to 1.000 observed for the CAE, VAE, and GAE models. This indicates it effectively learns normal sample features and maintains good generalization. Such stability suggests consistent performance on new normal samples without obvious overfitting or underfitting, which is crucial for the subsequent anomaly detection process.

5.2. The Anomaly Detection Accuracy

To validate the performance of the proposed method on real-world anomaly detection tasks, we choose Task A and Task B in Table 2 to compare the detection effects under different arrangements of sensor locations for highlighting the robustness of the proposed method. The anomaly detection accuracies of all models are listed in Table 6.
The results show that the proposed method obtains the best detection results, correctly detecting the states of 493 and 488 samples on the two tasks, respectively. Method 1 proved the least effective, indicating that applying OCSVM alone cannot accurately capture the difference between normal and abnormal samples. Methods 2–4 utilize variants based on an autoencoder to learn the latent distribution of normal samples, which significantly improves the performance compared to Method 1, but the detection ability of the model decreases significantly below 90% in the face of the interference of sensor position changes. In contrast, the proposed method has better robustness, with only a 1.0% decrease, and is more resistant to interference from changes in the external environment. This should be attributed to the deep convolutional structure of DCGAN, which gives it the ability to better fit the latent distribution, as demonstrated in Figure 6. In addition, the multi-sensors also provide comprehensive fault information.
Furthermore, we investigated the impact of increased fault diversity and time-varying operating conditions on anomaly detection performance in Tasks C and D. The results are summarized in Table 7. A comparison between Task A and Task C shows that the addition of more fault types leads to a significant performance drop in Methods 1–4, while our proposed method experiences only a 0.6% decrease. Additionally, comparing Task C and Task D reveals that time-varying conditions substantially increase the detection difficulty, resulting in an average accuracy drop of 7.0% for Methods 1–4. In contrast, our proposed method maintains an accuracy of over above 90% despite a slight decline.

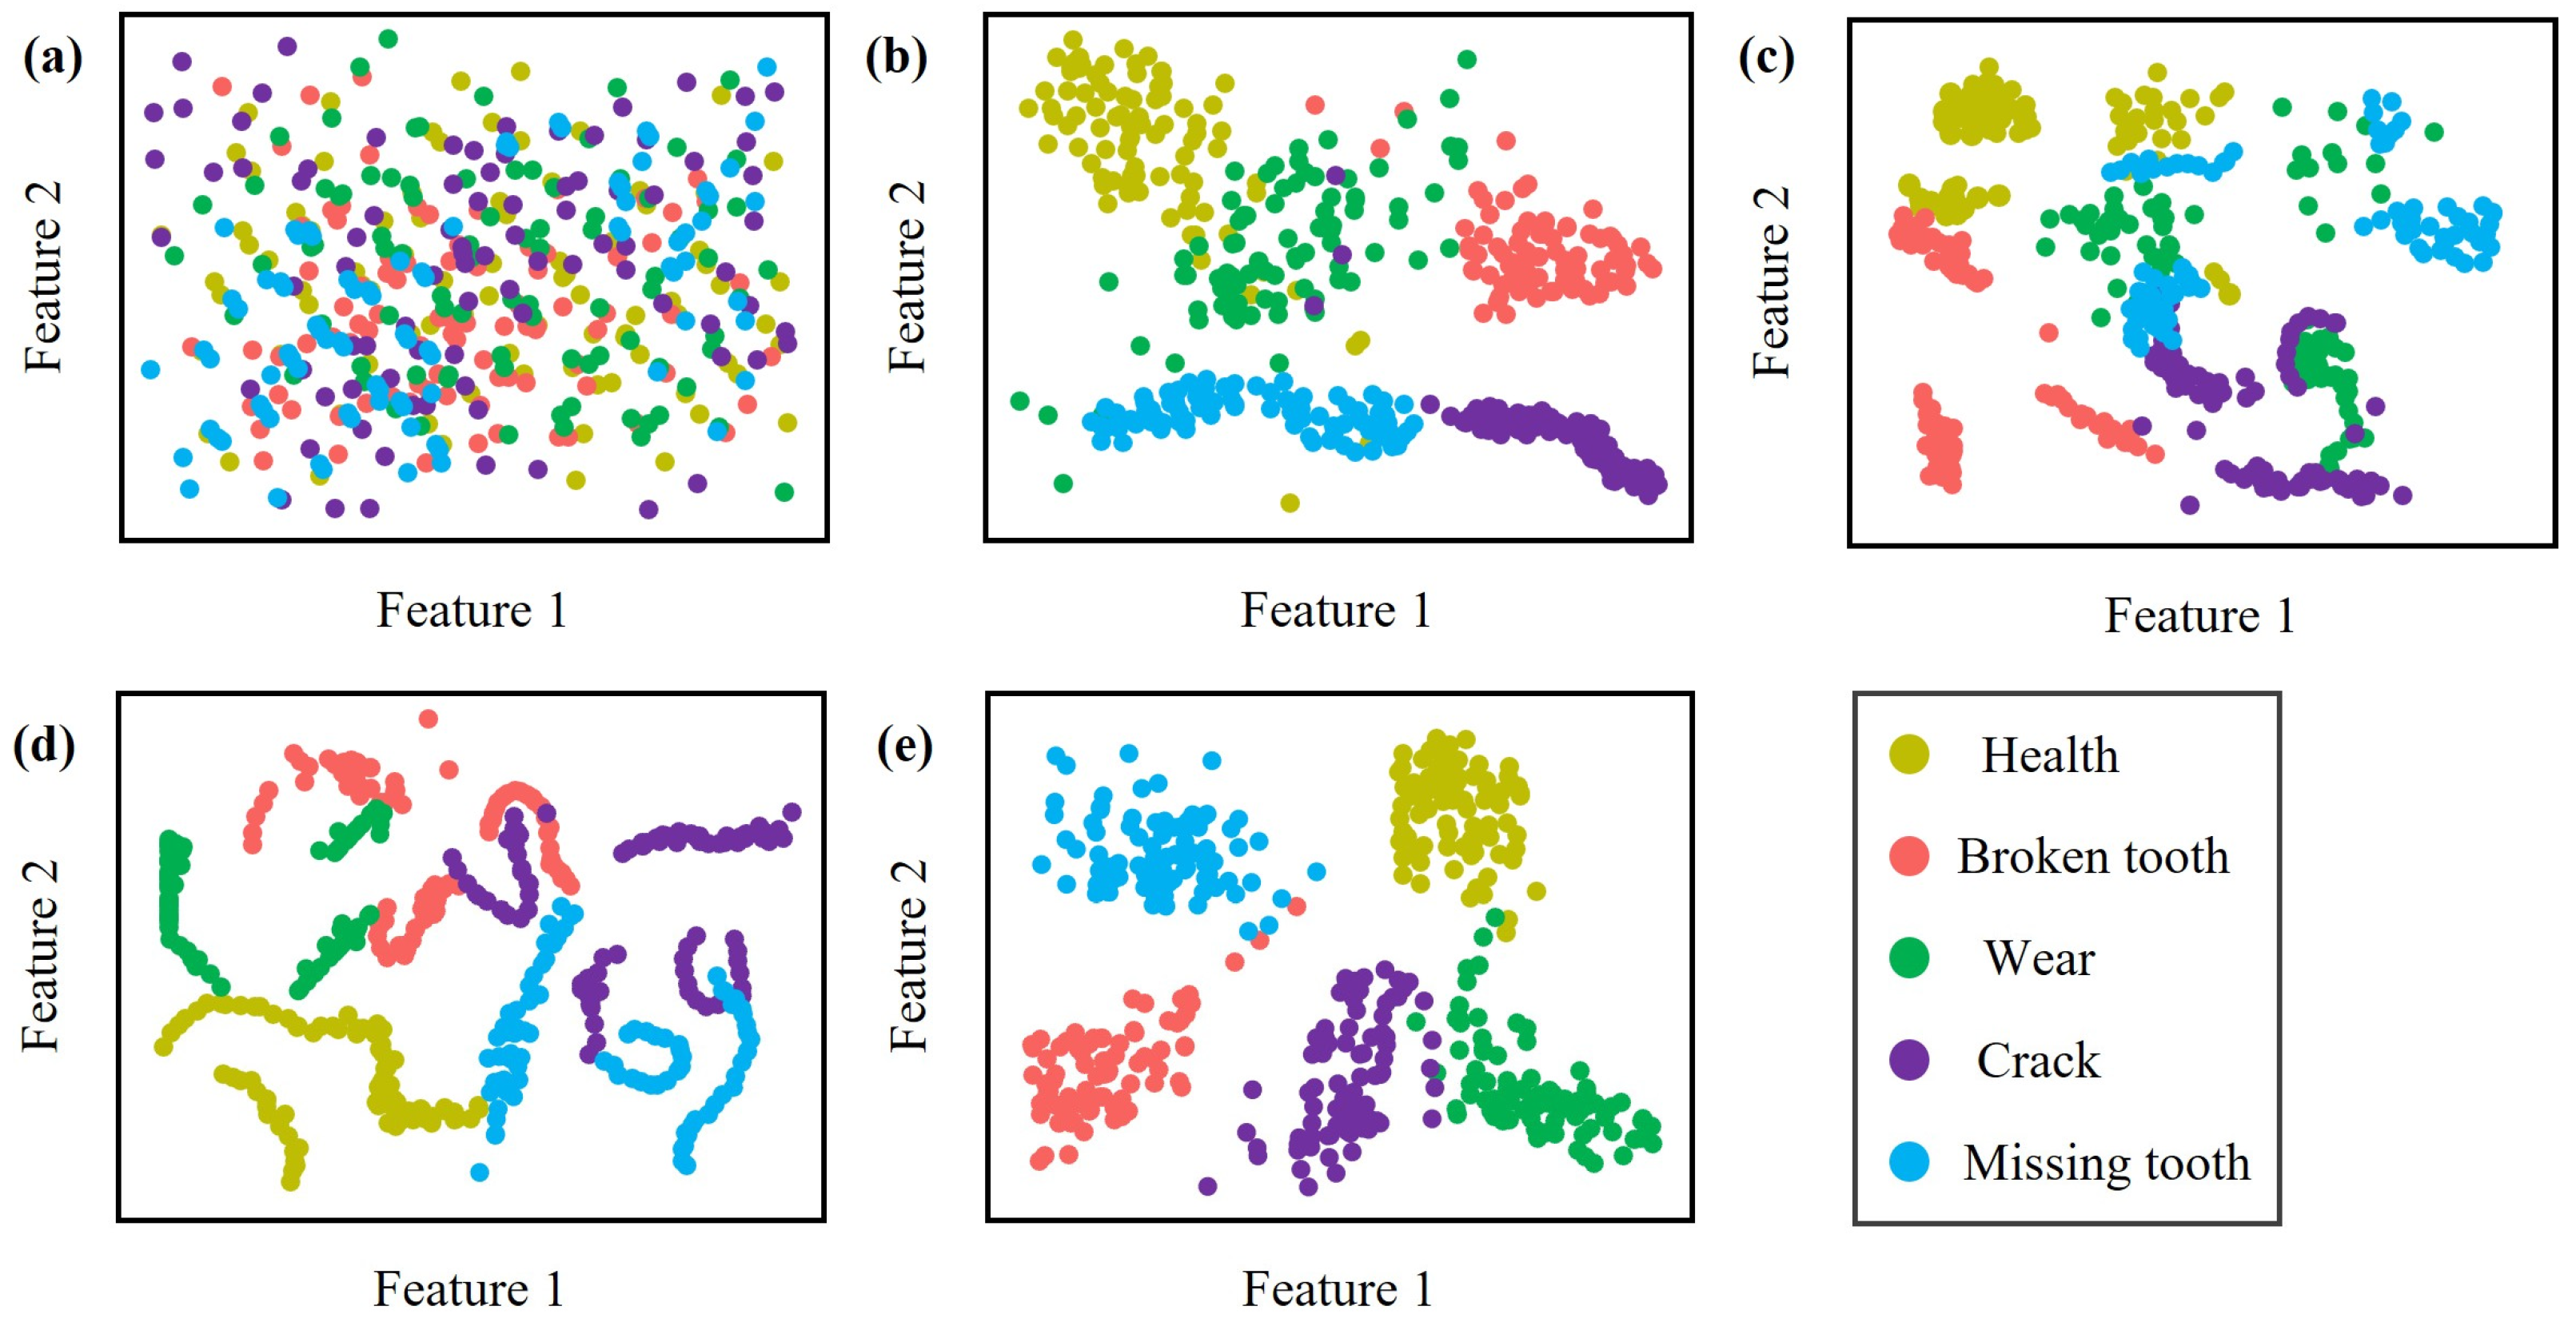
5.3. Comparison of Clustering Effect
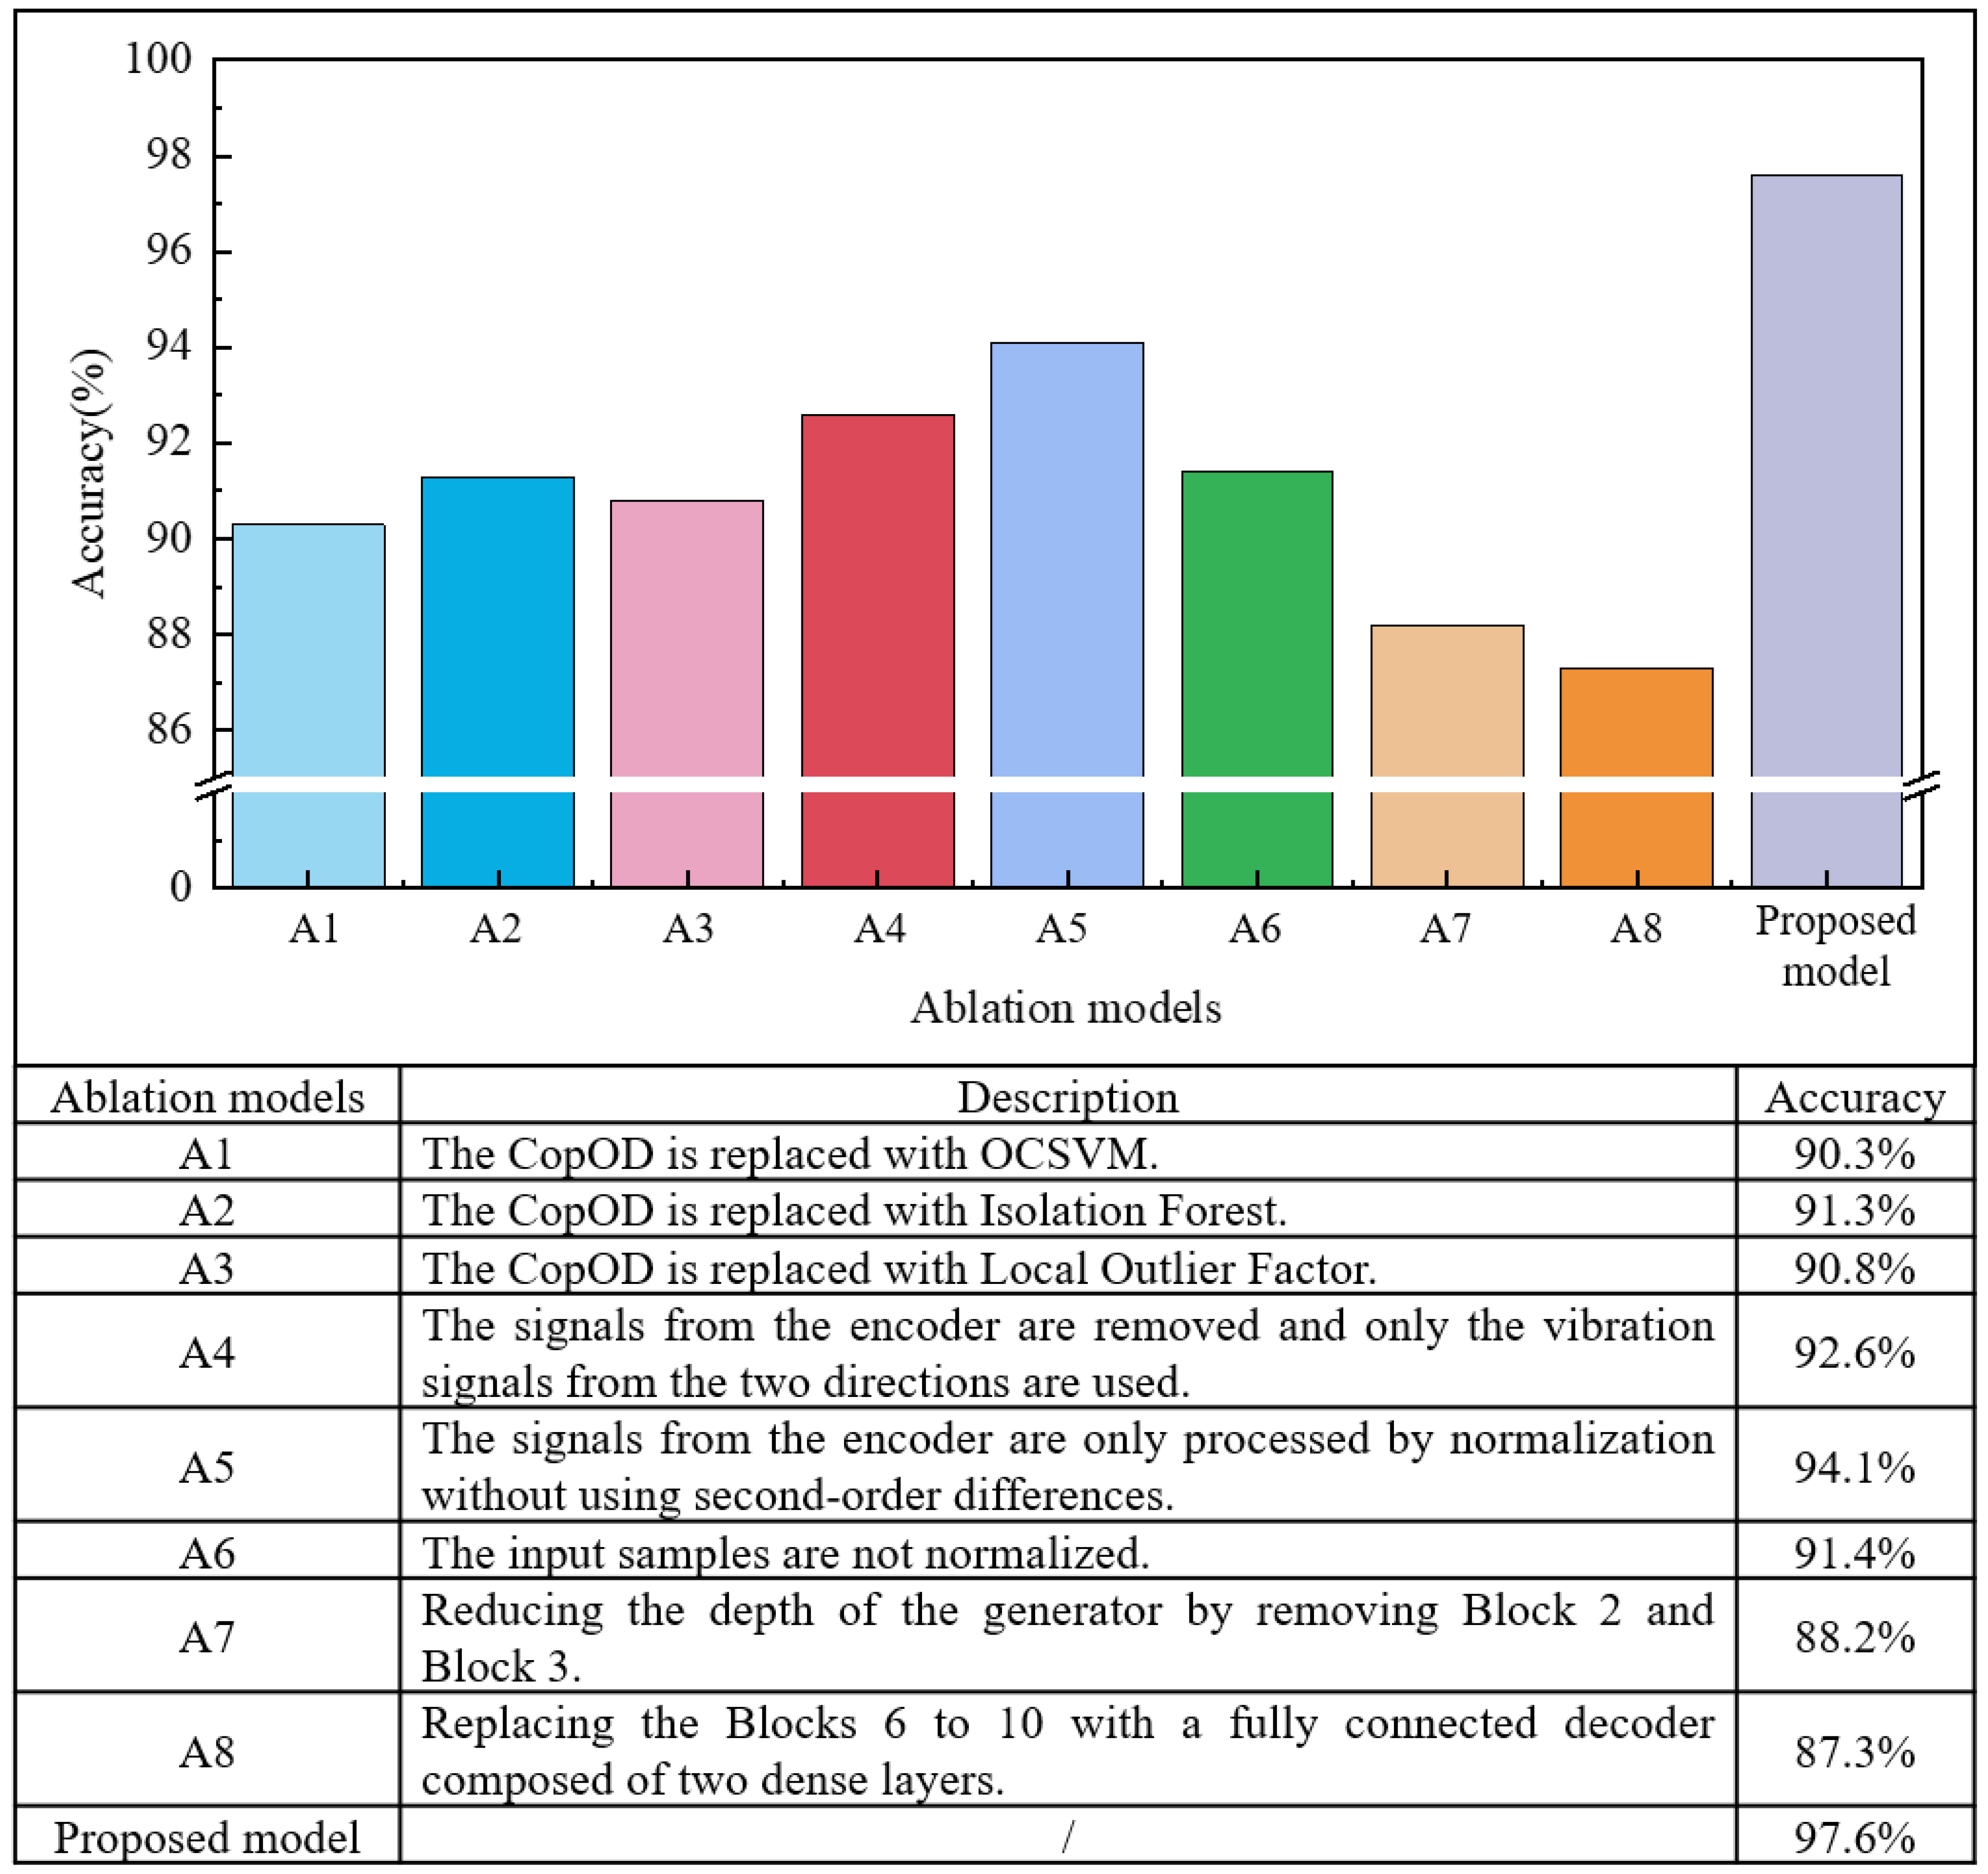
To visualize the ability of the model in capturing the discriminative features of the sample features under different methods, we used t-distributed stochastic neighbor embedding (t-SNE) [40] dimensionality reduction to visualize the distribution of different categories of samples on Task A in the latent space, as shown in Figure 7. The raw data distribution is more heterogeneous and without obvious classification boundaries, resulting in poor anomaly detection by OCSVM. The three models based on autoencoder, CAE, VAE, and GAE, demonstrate better classification boundaries, but there are still some classes of overlap. In contrast, the proposed model is capable of capturing the sample features of the anomaly classes and can effectively distinguish them from the normal samples. This obvious classification boundary facilitates the improvement of the accuracy of anomaly detection.

5.4. Ablation Study

To demonstrate the important contributions of the individual components of the proposed method, ablation studies are designed on Task B. The ablation experiments provide compelling evidence for the effectiveness of each component in our proposed method. As shown in Figure 8, all ablation models (A1–A8) demonstrated performance degradation compared to the complete model, validating the necessity of each design choice.
To assess the suitability of CopOD for scoring reconstruction errors, models A1, A2, and A3 replace CopOD with OCSVM, Isolation Forest (IF), and Local Outlier Factor (LOF), respectively. While three methods are widely used in unsupervised anomaly detection, they exhibit lower accuracy compared to CopOD when applied to high-dimensional reconstruction error vectors. Model A1 shows the most significant performance degradation, with a drop of 6.3%. Isolation Forest, though robust against outliers, lacks sensitivity to complex inter-feature relationships. LOF, in turn, relies on local density estimation, which can be unstable in high-dimensional spaces. The performance degradation observed in A2 and A3 underscores the superior adaptability and scoring capability of CopOD in multi-sensor fusion contexts. The advantage of CopOD likely stems from its ability to capture complex dependencies between features through the Kopra function. This capability becomes more prominent in multi-sensor fusion scenarios. Additionally, CopOD uses empirical cumulative distribution functions (ECDFs) to estimate marginal distributions. As a non-parametric method, ECDF makes no assumptions about the underlying distribution shape, allowing it to adapt well to various data patterns. The results from model A4 indicate that lateral and torsional vibrations extracted from encoder signals are effective for anomaly detection. Model A5, despite showing the least performance degradation, demonstrates the benefits of using second-order differences. This technique removes linear trends or slowly varying background noise in the original encoder signals, thus enhancing the extraction of torsional vibration features. Moreover, model A6 further shows that normalizing input samples improves model stability and enhances anomaly detection accuracy.
To further investigate the impact of the generator architecture on model performance, we designed structural ablation variants A7 and A8. The results show that both modifications significantly degrade anomaly detection accuracy, with A7 and A8 achieving 88.2% and 87.3%, respectively. These findings highlight the importance of deep convolutional encoding and spatially aware upsampling in effectively capturing and reconstructing the complex patterns in multi-sensor signals.
In conclusion, the ablation study results comprehensively demonstrate that each component and operation in our proposed method contributes meaningfully to the overall system performance, with their integration yielding optimal anomaly detection capabilities in planetary gearbox health monitoring.

6. Conclusions

This paper proposes DCCopGAN, a novel deep learning framework that integrates a Deep Convolutional GAN with Copula-Based Outlier Detection for robust and unsupervised anomaly detection in gearbox systems. By leveraging reconstruction errors and probabilistic modeling, the framework achieves high detection accuracy and generalization across varying installation conditions.
A key contribution of this work lies in the incorporation of multi-sensor fusion. By combining vibration and encoder signals, the model captures both lateral and torsional fault characteristics, thereby enriching the feature space and enhancing detection reliability. In addition, CopOD offers a distribution-agnostic approach to anomaly scoring, enabling the model to handle high-dimensional and heterogeneous sensor data. Its ability to capture inter-feature dependencies is particularly advantageous in complex operational environments. Overall, experimental results on a real-world gearbox dataset demonstrate that DCCopGAN outperforms several existing methods in both accuracy and robustness, confirming its potential for practical deployment in industrial condition monitoring applications.
Despite its promising results, the current DCCopGAN framework focuses on unsupervised anomaly detection based on vibration and encoder signals. Future research will pursue two main avenues. Firstly, we aim to move beyond detection to investigate methods for classifying specific fault types within identified anomalies, potentially by analyzing patterns in reconstruction errors or CopOD scores, or zero-shot learning based on fault semantics [41]. Secondly, we will integrate additional sensor modalities, such as temperature and infrared imagery, to enhance the framework’s robustness and diagnostic capabilities.

Author Contributions

Conceptualization, B.G. and Y.L.; methodology, B.G.; software, B.G. and G.Y.; validation, Y.L. and G.Y.; formal analysis, Y.L.; writing—original draft preparation, B.G.; writing—review and editing, Y.L. and G.Y.; visualization, B.G.; supervision, B.G.; project administration, B.G.; funding acquisition, B.G. All authors have read and agreed to the published version of the manuscript.

Funding

This research was funded by the Shanxi Province Basic Research Program grant number 202403021221353.

Data Availability Statement

Data are contained within the article.

Conflicts of Interest

The authors declare no conflicts of interest.

References

  1. Xu, Y.; Shu, R.; Li, S.; Feng, K.; Yang, X.; Zhao, Z. Imbalanced Learning for Gearbox Fault Detection via Attention-Based Multireceptive Field Convolutional Neural Networks with an Adaptive Label Regulation Loss. IEEE Trans. Instrum. Meas. 2024, 73, 3529211. [Google Scholar] [CrossRef]
  2. Liu, J.; Zhang, Q.; Xie, F.; Wang, X.; Wu, S. Incipient fault detection of planetary gearbox under steady and varying condition. Expert Syst. Syst. Syst. Appl. 2023, 233, 121003. [Google Scholar] [CrossRef]
  3. Su, C.; Bi, T.; Pan, A.; Gong, Y.; Luo, L.; Chen, J.; Yang, Z. Failure analysis on abnormal cracking of polycarbonate plates used in the gearbox oil level gauge for high-speed train. Eng. Fail. Anal. 2023, 143, 106871. [Google Scholar] [CrossRef]
  4. Li, S.; Zhao, M.; Ou, S.; Chen, D.; Wei, Y. A periodic anomaly detection framework based on matrix profile for condition monitoring of planetary gearboxes. Measurement 2023, 218, 113243. [Google Scholar] [CrossRef]
  5. Li, Z.; Duan, M.; Xiao, B.; Yang, S. A novel anomaly detection method for digital twin data using deconvolution operation with attention mechanism. IEEE Trans. Ind. Inform. 2022, 19, 7278–7286. [Google Scholar] [CrossRef]
  6. Zuo, Z.; Zhang, H.; Ma, L.; Liu, T.; Liang, S. Leak detection for natural gas gathering pipelines under multiple operating conditions using RP-1dConvLSTM-AE and multimodel decision. IEEE Trans. Ind. Electron. 2023, 71, 6263–6273. [Google Scholar] [CrossRef]
  7. Chang, Z.; Jia, K.; Han, T.; Wei, Y. Towards more reliable photovoltaic energy conversion systems: A weakly-supervised learning perspective on anomaly detection. Energy Convers. Manag. 2024, 316, 118845. [Google Scholar] [CrossRef]
  8. Kong, F.; Li, J.; Jiang, B.; Wang, H.; Song, H. Integrated generative model for industrial anomaly detection via bidirectional LSTM and attention mechanism. IEEE Trans. Ind. Inform. 2021, 19, 541–550. [Google Scholar] [CrossRef]
  9. Wang, J.; Jiang, G.; Wang, L.; Li, Y.; Li, X.; Xie, P. A novel impulse information-enhanced semi-supervised learning for few-label fault diagnosis of rotary machines. IEEE Sens. J. 2023, 23, 27658–27669. [Google Scholar] [CrossRef]
  10. Chuphal, M.; Singh, K.; Bisht, A.; Sharma, V.; Awasthi, S.; Vats, S. Anomaly Detection in Electro-Mechanical Devices Using MFCC. In Proceedings of the 2024 2nd International Conference on Disruptive Technologies (ICDT), Greater Noida, India, 15–16 March 2024; IEEE: Piscataway, NJ, USA, 2024; pp. 986–991. [Google Scholar]
  11. Wu, Y.; Sicard, B.; Gadsden S, A. Physics-informed machine learning: A comprehensive review on applications in anomaly detection and condition monitoring. Expert Syst. Appl. 2024, 255, 124678. [Google Scholar] [CrossRef]
  12. Fan, J.; Ji, Y.; Wu, H.; Ge, Y.; Sun, D.; Wu, J. An unsupervised video anomaly detection method via Optical Flow decomposition and Spatio-Temporal feature learning. Pattern Recognit. Lett. 2024, 185, 239–246. [Google Scholar] [CrossRef]
  13. Liu, J.; Li, Q.; Li, L.; An, S. Structural damage detection and localization via an unsupervised anomaly detection method. Reliab. Eng. Syst. Saf. 2024, 252, 110465. [Google Scholar] [CrossRef]
  14. Li, W.; Shang, Z.; Zhang, J.; Gao, M.; Qian, S. A novel unsupervised anomaly detection method for rotating machinery based on memory augmented temporal convolutional autoencoder. Eng. Appl. Artif. Intell. 2023, 123, 106312. [Google Scholar] [CrossRef]
  15. Wu, S.; Fang, L.; Zhang, J.; Sriram, T.; Coshatt, S.; Zahiri, F.; Mantooth, A.; Ye, J.; Zhong, W.; Ma, P. Unsupervised anomaly detection and diagnosis in power electronic networks: Informative leverage and multivariate functional clustering approaches. IEEE Trans. Smart Grid 2023, 15, 2214–2225. [Google Scholar] [CrossRef]
  16. Wu, J.; Zhao, Z.; Sun, C.; Yan, R.; Chen, X. Fault-attention generative probabilistic adversarial autoencoder for machine anomaly detection. IEEE Trans. Ind. Inform. 2020, 16, 7479–7488. [Google Scholar] [CrossRef]
  17. Tian, H.; Kong, H.; Lu, S.; Li, K. Unsupervised anomaly detection of multivariate time series based on multi-standard fusion. Neurocomputing 2025, 611, 128634. [Google Scholar] [CrossRef]
  18. Li, L.; Qu, H.; Li, Z.; Zheng, J.; Tang, X.; Liu, P. Data reconstruction via consensus graph learning for effective anomaly detection in industrial IoT. IEEE Trans. Ind. Inform. 2023, 20, 3996–4006. [Google Scholar] [CrossRef]
  19. Guo, H.; Mu, Y.; Wang, L.; Liu, X.; Pedrycz, W. Granular computing-based time series anomaly pattern detection with semantic interpretation. Appl. Soft Comput. 2024, 167, 112318. [Google Scholar] [CrossRef]
  20. Fan, T.; Li, P.; Qi, Z.; Zhao, Z.; Fang, X.; Yan, B.; Zhao, R.; Liu, L.; Li, Y.; Fang, Z. Borehole transient electromagnetic stereo imaging method based on horizontal component anomaly feature clustering. J. Appl. Geophys. 2022, 197, 104537. [Google Scholar] [CrossRef]
  21. Tsiktsiris, D.; Lalas, A.; Dasygenis, M.; Votis, K. Enhancing the safety of autonomous vehicles: Semi-supervised anomaly detection with overhead fisheye perspective. IEEE Access 2024, 12, 68905–68915. [Google Scholar] [CrossRef]
  22. Campos-Romero, M.; Carranza-García, M.; Riquelme J, C. Advancing unsupervised anomaly detection with normalizing flow and multi-scale ensemble learning. Eng. Appl. Artif. Intell. 2024, 137, 109088. [Google Scholar] [CrossRef]
  23. Zhong, H.; Yu, S.; Trinh, H.; Lv, Y.; Yuan, R.; Wang, Y. Fine-tuning transfer learning based on DCGAN integrated with self-attention and spectral normalization for bearing fault diagnosis. Measurement 2023, 210, 112421. [Google Scholar] [CrossRef]
  24. Li, Z.; Zhao, Y.; Hu, X.; Botta, N.; Ionescu, C.; Chen, G. Copod: Copula-based outlier detection. In Proceedings of the 2020 IEEE International Conference on Data Mining (ICDM), Sorrento, Italy, 17–20 November 2020; IEEE: Piscataway, NJ, USA, 2020; pp. 1118–1123. [Google Scholar]
  25. Mohammadrezaei, M.; Maleki, Z.; Tabesh, A.; Khajehoddin, S. A Framework for Normalizing Physical Features of Li-Ion Batteries to Form a Generic Health Estimation Model. IEEE Trans. Transp. Electrif. 2023, 10, 6880–6892. [Google Scholar] [CrossRef]
  26. Liu, S.; Zhou, B.; Ding, Q.; Hooi, B.; Zhang, Z.; Shen, H.; Chen, X. Time series anomaly detection with adversarial reconstruction networks. IEEE Trans. Knowl. Data Eng. 2022, 35, 4293–4306. [Google Scholar] [CrossRef]
  27. Sun, Y.; Li, S. Bearing fault diagnosis based on optimal convolution neural network. Measurement 2022, 190, 110702. [Google Scholar] [CrossRef]
  28. Chen, Q.; Dai, X.; Song, X.; Liu, G. ITSC fault diagnosis for five phase permanent magnet motors by attention mechanisms and multiscale convolutional residual network. IEEE Trans. Ind. Electron. 2023, 71, 9737–9746. [Google Scholar] [CrossRef]
  29. Song, X.; Chen, Y.; Xiao, Z.; Chen, Y. Analysis of BGA Lead-Free solder joints failure behavior based on thermal shock testing. Eng. Fail. Anal. 2024, 165, 108813. [Google Scholar] [CrossRef]
  30. Xia, X.; Pan, X.; Li, N.; He, X.; Ma, L.; Zhang, X.; Ding, N. GAN-based anomaly detection: A review. Neurocomputing 2022, 493, 497–535. [Google Scholar] [CrossRef]
  31. Lindstrom, M.R.; Jung, H.; Larocque, D. Functional kernel density estimation: Point and fourier approaches to time series anomaly detection. Entropy 2020, 22, 1363. [Google Scholar] [CrossRef]
  32. Liu, D.; Cui, L.; Cheng, W. A review on deep learning in planetary gearbox health state recognition: Methods, applications, and dataset publication. Meas. Sci. Technol. 2023, 35, 012002. [Google Scholar] [CrossRef]
  33. Han, B.; Yang, Z.; Zhang, Z.; Bao, H.; Wang, J.; Liu, Z.; Li, S. A novel rolling bearing fault diagnosis method based on generalized nonlinear spectral sparsity. Measurement 2022, 198, 111131. [Google Scholar] [CrossRef]
  34. Pang, J.; Pu, X.; Li, C. A hybrid algorithm incorporating vector quantization and one-class support vector machine for industrial anomaly detection. IEEE Trans. Ind. Inform. 2022, 18, 8786–8796. [Google Scholar] [CrossRef]
  35. Deng, C.; Deng, Z.; Lu, S.; He, M.; Miao, J.; Peng, Y. Fault diagnosis method for imbalanced data based on multi-signal fusion and improved deep convolution generative adversarial network. Sensors 2023, 23, 2542. [Google Scholar] [CrossRef] [PubMed]
  36. Tian, H.; Ju, B.; Feng, S. Reciprocating compressor health monitoring based on BSInformer with deep convolutional AutoEncoder. Measurement 2023, 222, 113575. [Google Scholar] [CrossRef]
  37. Gandhudi, M.; Alphonse, P.J.A.; Velayudham, V.; Nagineni, L.; G.R, G. Explainable causal variational autoencoders based equivariant graph neural networks for analyzing the consumer purchase behavior in E-commerce. Eng. Appl. Artif. Intell. 2024, 136, 108988. [Google Scholar] [CrossRef]
  38. Zhao, M.; Jia, X.; Lin, J.; Lei, Y.; Lee, J. Instantaneous speed jitter detection via encoder signal and its application for the diagnosis of planetary gearbox. Mech. Syst. Signal Process. 2018, 98, 16–31. [Google Scholar] [CrossRef]
  39. Jiao, J.; Zhao, M.; Lin, J.; Ding, C. Deep coupled dense convolutional network with complementary data for intelligent fault diagnosis. IEEE Trans. Ind. Electron. 2019, 66, 9858–9867. [Google Scholar] [CrossRef]
  40. Tu, D.; Zheng, J.; Jiang, Z.; Pan, H. Multiscale distribution entropy and t-distributed stochastic neighbor embedding-based fault diagnosis of rolling bearings. Entropy 2018, 20, 360. [Google Scholar] [CrossRef]
  41. Xu, J.; Zhou, L.; Zhao, W.; Fan, Y.; Ding, X.; Yuan, X. Zero-shot learning for compound fault diagnosis of bearings. Expert Syst. Appl. 2022, 190, 116197. [Google Scholar] [CrossRef]
Figure 1. The flowchart of data preprocessing and preparation.
Electronics 14 02631 g001
Figure 2. The structure of the DCGAN model. (a) Generator (b) Discriminator.
Electronics 14 02631 g002
Figure 3. The flowchart of the proposed DCCopGAN framework for anomaly detection.
Electronics 14 02631 g003
Figure 4. The experimental test rig of the WT-Planetary gearbox. (a) Test rig. (b) Internal structure of planetary gearbox. (c) Health. (d) Broken tooth. (e) Wear. (f) Crack. (g) Missing tooth.
Electronics 14 02631 g004
Figure 5. The experimental test rig of the SDUST gear dataset. (a) Test rig. (bd) Correspond to pitting, cracking, and wear of the planetary gear, respectively. (eg) Correspond to pitting, cracking, and wear of the sun gear.
Electronics 14 02631 g005
Figure 6. The training and validation losses. (a) CAE. (b) VAE (c) GAE (d) Proposed DCGAN.
Electronics 14 02631 g006
Figure 7. The clustering effect of different methods based on t-SNE. (a) OCSVM. (b) CAE. (c) VAE (d) GAE (e) Proposed DCGAN.
Electronics 14 02631 g007
Figure 8. The results of ablation studies on Task B.
Electronics 14 02631 g008
Table 1. The details of the experiment.
ExperimentsDatasetsTasksDescriptionsTraining SetupTesting Setup
E1WT-Planetary
Gearbox
ASame
position
Sensor position 1,
healthy data
Sensor position 1,
healthy + faulty data
BCross
position
Sensor position 2,
healthy + faulty data
E2SDUST Gear
Dataset
CSame
operating
conditions
Constant speed and load,
healthy Data
Constant speed and load,
healthy + faulty data
DCross
operating
conditions
Varying speed and load,
healthy + faulty data
Table 2. The anomaly detection task settings of Experiment E1.
Heath StatesLabelTask ATask B
Training SamplesTest SamplesTraining SamplesTest Samples
Health0400 100 400 100 *
Broken tooth1/100 /100 *
Wear2/100 /100 *
Crack3/100 /100 *
Missing tooth4/100 /100 *
Notes: represents the data collected under the first installation position. * corresponds to the second installation position.
Table 3. The anomaly detection task settings of Experiment E2.
Heath StatesLabelTask CTask D
Training SamplesTest SamplesTraining SamplesTest Samples
Health0400 100 400 100
Planetary gearpitting1/100 /100
cracking2/100 /100
wear3/100 /100
Sun gearpitting4/100 /100
cracking5/100 /100
wear6/100 /100
Notes: represents the data collected under 1500 rpm and 0.2 A. corresponds to 2000 rpm and 0–0.2 A, where the load varies between 0 and 0.2.
Table 4. The parameter configurations for all comparative methods.
MethodsDescriptionParameter Configurations
Method 1OCSVMEpochs = 100, batchsize = 32, optimizer = ‘adam’, beta1 = 0.9, beta2 = 0.99, loss = ‘mse’, kenrnel = ‘rbf’, learning rate = 0.001, momentum = 0.95, epsilon = 0.0001, scheduler = ‘ReduceLROnPlateau’, marginal_estimation = ‘KDE’, bandwidth = ‘scott’.
Method 2CSVM
Method 3VSVM
Method 4GSVM
Table 5. Layer-wise architecture configuration of the generator G and discriminator D in the DCCopGAN model.
ModelComponentsDescriptionFiltersKernel/Pool SizeStrideShape
GInput////3072 × 1
Block 1Conv 1D + Maxpooling 1D32 (32)3 (2)1 (2)1536 × 32
Block 2Conv 1D + Maxpooling 1D16 (16)3 (2)1 (2)768 × 16
Block 3Conv 1D + Maxpooling 1D8 (8)3 (2)1 (2)384 × 8
Block 4Conv 1D + Maxpooling 1D4 (4)3 (2)1 (2)192 × 4
Block 5Conv 1D + Maxpooling 1D2 (2)3 (2)1 (2)96 × 2
Block 6Conv 1D + UpSampling 1D2 (/)3 (2)1 (/)192 × 2
Block 7Conv 1D + UpSampling 1D4 (/)3 (2)1 (/)384 × 4
Block 8Conv 1D + UpSampling 1D8 (/)3 (2)1 (/)768 × 8
Block 9Conv 1D + UpSampling 1D16 (/)3 (2)1 (/)1536 × 16
Block 10Conv 1D + UpSampling 1D32 (/)3 (2)1 (/)3072 × 32
Block 11Conv 1D1313072 × 1
DInput////3072 × 1
Block 1Conv 1D + Maxpooling 1D32 (32)3 (2)1 (2)1536 × 32
Block 2Conv 1D + Maxpooling 1D16 (16)3 (2)1 (2)768 × 16
Block 3Conv 1D + Maxpooling 1D8 (8)3 (2)1 (2)384 × 8
Block 4Conv 1D + Maxpooling 1D4 (4)3 (2)1 (2)192 × 4
Block 5Conv 1D + Maxpooling 1D2 (2)3 (2)1 (2)96 × 2
Block 6Flatten///192
Block 7Dense///1
Notes: The values in parentheses correspond to the parameters of Maxpooling 1D or UpSampling 1D.
Table 6. The anomaly detection accuracies of all models on Task A and Task B.
ModelsTask ATask B
Correctly Detected SamplesTotal
Samples
Accuracy (%)Correctly Detected SamplesTotal SamplesAccuracy (%)
Method 144050088.042050084.0 (4.0)
Method 245550091.043250086.4 (4.6)
Method 346050092.043850087.6 (4.4)
Method 448250096.444050088.0 (8.4)
Proposed method49350098.648850097.6 (1.0)
Notes: () indicates the degree of performance degradation caused by the sensor installation position. Method 1 = OCSVM; Method 2 = CSVM; Method 3 = VSVM; Method 4 = GSVM.
Table 7. The anomaly detection accuracies of all models on Task C and Task D.
ModelsTask CTask D
Correctly Detected SamplesTotal
Samples
Accuracy (%)Correctly Detected SamplesTotal
Samples
Accuracy (%)
Method 141850083.6 [4.4]38150076.2 {7.4}
Method 244450088.8 [2.2]40950081.8 {7.0}
Method 344350088.6 [3.4]41250082.4 {6.2}
Method 446550093.0 [3.4]42850085.6 {7.4}
Proposed method49050098.0 [0.6]46850094.8 {3.2}
Notes: [] shows the degree of performance degradation caused by the increase in the number of fault types. {} denotes the degree of performance degradation caused by time-varying conditions. Method 1 = OCSVM; Method 2 = CSVM; Method 3 = VSVM; Method 4 = GSVM.
Disclaimer/Publisher’s Note: The statements, opinions and data contained in all publications are solely those of the individual author(s) and contributor(s) and not of MDPI and/or the editor(s). MDPI and/or the editor(s) disclaim responsibility for any injury to people or property resulting from any ideas, methods, instructions or products referred to in the content.

