Article

Data-Driven Predictive Modelling of Agile Projects Using Explainable Artificial Intelligence

by
Ali Akbar ForouzeshNejad
1,
Farzad Arabikhan
1,*,
Alexander Gegov
1,2,
Raheleh Jafari
3 and
Alexandar Ichtev
4
1
School of Computing, University of Portsmouth, Portsmouth PO1 3HE, UK
2
English Faculty of Engineering, Technical University of Sofia, 1000 Sofia, Bulgaria
3
School of Design, University of Leeds, Leeds LS2 9JT, UK
4
Department of Systems and Control, Technical University of Sofia, 1000 Sofia, Bulgaria
*
Author to whom correspondence should be addressed.
Electronics 2025, 14(13), 2609; https://doi.org/10.3390/electronics14132609 (registering DOI)
Submission received: 15 May 2025 / Revised: 12 June 2025 / Accepted: 18 June 2025 / Published: 27 June 2025

Abstract

One of the fundamental challenges in managing software and information technology projects is monitoring and predicting project status at the end of each sprint, release or project. Agile project management has emerged over the past two decades, significantly impacting project success. However, no comprehensive approach based on the features of this approach has been found in studies to monitor and predict the status of a sprint, release or project. This study aims to develop a data-driven approach for predicting the status of software projects based on agility features. For this purpose, 22 agility features were first identified to evaluate and predict the status of projects in four aspects: Endurance, Effectiveness, Efficiency, and Complexity. The findings indicate that the aspects of Effectiveness and Efficiency have the greatest impact on project success. Additionally, the results show that features related to team work, team capacity, experience and project objectives have the most significant impact on project success. An artificial neural network algorithm was then used, and a model was developed to predict project status, which was optimized using the Neural Architecture Search algorithm with a 93 percent accuracy rate. The neural network model was interpreted using the SHapley Additive exPlanations (SHAP) algorithm, and sensitivity analysis was performed on the important components. Finally, the behavior of the projects in each category was analyzed and evaluated using the Apriori algorithm.

1. Introduction

Project management in organizations is a key factor in their success, and project managers are responsible for leading, planning, executing and monitoring various processes to ensure that projects are delivered on time and with high quality [1]. Over the past two decades, the agile approach has been introduced as an innovative methodology in project management, significantly impacting project success [2]. Agile methodologies emphasize iterative development, incremental delivery, continuous feedback, and adaptive planning [3]. These methodologies (i.e., Scrum, Kanban, XP, Scrumban, etc.) promote regular conversations between team members and allow teams to respond rapidly to modifications in customer needs and market environments [4,5]. Agile teams organize their work into short cycles incrementally referred to as sprints [6]. These short cycles enable agile teams to continually provide value and continually improve product quality based on continuous feedback from stakeholders [7].
Predictive modeling grounded in agile principles is becoming critical in emerging technological fields such as the industrial Internet of Things (IoT), smart grids, and robotic systems, where iterative development, rapid adaptation, and continuous delivery are fundamental [8]. Accurate prediction of project outcomes in these dynamic sectors enables effective risk management, optimized resource allocation, and enhanced strategic decision-making, making our transparent, interpretable predictive approach highly relevant and adaptable to these domains [9].
Despite these advantages, project managers and product managers still rely on traditional methods for monitoring agile project features, which are mainly based on intuition and subjective judgment [10]. Such an approach can be prone to errors, and with the increasing number of projects and human resource teams, managing multiple projects simultaneously and accurately evaluating them has become a significant challenge. In this context, leveraging data-driven methods and machine learning algorithms can enhance monitoring accuracy and enable project status prediction [11]. Given the vast amount of data generated in organizations today, developing models that can assist project managers in evaluating and predicting project success with greater precision is essential.
Previous studies have primarily focused on analyzing relationships between various factors influencing agile project success [12] or predicting specific project metrics such as time, cost, and quality [13]. However, a comprehensive study that predicts the overall status of projects while considering all agile attributes is still lacking. In this regard, the present study introduces several fundamental innovations. First, this study is the first to develop a predictive model for agile project success based on agile features. Second, a comprehensive framework for analysis of project success, incorporating three main components—Endurance, Effectiveness, and Efficiency—has been introduced for the first time. Additionally, this study examines the impact of project Complexity on success, a factor that has received limited attention in previous research. Furthermore, the use of explainable artificial intelligence (X-AI) algorithms in this study enhances decision-making transparency and provides a detailed analysis of the features affecting project outcomes.
To establish a structured approach for analyzing and predicting project statuses, this study is organized into two main sections. The first section focuses on identifying and categorizing key project evaluation features, derived from a literature review and expert consultations. The second section is dedicated to developing a data-driven model for project status prediction, encompassing data collection, data processing, machine learning model development, and sensitivity analysis of project features. This framework, illustrated in Figure 1, represents the interconnections between different research processes and provides a structured approach for developing a project evaluation model.
Although earlier studies such as [14,15] used machine learning methods to predict the outcomes of agile projects, there has not been a study comprehensively using explicitly defined and expert-validated agility features (Delphi method) with interpretable algorithms (SHAP) and pattern analysis (Apriori). The integrated model developed in this research offers a unique approach to achieving predictive transparency, actionable interpretability, and rich managerial insights, thereby addressing the limitations found in prior predictive studies.
This paper makes the following specific essential contributions:
Establishes and verifies a full set of 22 agile project success indicators in a structured Delphi-based expert consensus process.
Creates a highly accurate predictive model of agile project status using an artificial neural network (ANN) and optimizes it with Neural Architecture Search (NAS).
Utilizes explainable AI (SHAP algorithm) to clearly explain the contributions of each feature to the project or outcome.
Implements Apriori pattern analysis to extract practical managerial insights from project feature combinations.
In the remainder of the paper, Section 2 reviews the literature, Section 3 discusses the methodology and model development, Section 4 presents the results, and Section 5 provides managerial insights. Finally, the overall research conclusions are presented in Section 6.

2. Literature Review

2.1. Success: From General Definitions to Agile Mindset

Success is generally defined as the achievement of desired goals or expected results. According to the Cambridge Dictionary, success is “the attainment of desired or hoped-for results”. It refers to a positive outcome indicating that a specific goal or expectation has been met [16]. This goal-oriented perspective underpins both traditional and agile conceptualizations of success, although agile emphasizes stakeholder involvement and adaptability, refining the criteria for what constitutes success. Thus, success is not an absolute term but rather a goal-oriented and contextual condition where results align with original intentions.
In project management, success is a multidimensional concept. It extends beyond the classic “iron triangle” of time, cost, and scope to include stakeholder satisfaction, realization of business value, and long-term impact [17]. Therefore, a project is truly successful only when it meets performance criteria and delivers value and satisfaction to its stakeholders.
Within the agile mindset, stakeholders are regarded as the best judges of project success, highlighting the importance of involving end-users and customers in iterative evaluations (Serrador & Pinto, 2015) [7]. In agile environments, project success is primarily defined by delivering customer value and the ability to respond to change (Lalic et al., 2022) [18]. Agile success focuses on continuous delivery, collaboration, and stakeholder engagement rather than strict adherence to a fixed plan (Van Waardenburg & Van Vliet, 2013) [19].

2.2. Agile Methodologies and Their Implications for Success

Agile is a value-driven project management approach emphasizing customer collaboration, adaptability, and continuous delivery through iterative development cycles (Beck et al., 2001) [20]. Rooted in the Agile Manifesto, agile methodologies—such as Scrum, Kanban, Lean, Extreme Programming (XP), and the Scaled Agile Framework (SAFe)—prioritize responding to change and delivering business value early and frequently [21].
While agile has transformed project delivery across many industries, it also presents unique challenges in defining and measuring success. Traditional metrics like time, cost, and scope often fail to capture agile’s fluid, stakeholder-driven, and value-centric nature [22]. The iterative and non-linear progression of agile complicates success evaluation, especially as goals evolve during the project lifecycle. This creates a critical need for frameworks and metrics aligned with agile values that provide actionable insights for continuous improvement in dynamic contexts.
Scrum, the most widely adopted agile framework, is well-suited for complex projects with evolving requirements [23]. Its structured roles, ceremonies, and time-boxed sprints offer disciplined iteration while accommodating emergent stakeholder needs. Scrum’s balance of structure and flexibility has made it popular in software engineering and product development, where uncertainty and rapid feedback loops prevail [24]. Nevertheless, evaluating success in Scrum projects remains challenging due to the same issues of evolving goals and stakeholder variability. Furthermore, inconsistent Scrum implementations across organizations can hinder reliable performance assessments [25].
In contrast, Kanban is a flow-based agile method emphasizing workflow visualization, limiting work-in-progress (WIP), and maximizing throughput Efficiency. Originating from lean manufacturing, Kanban suits continuous delivery environments like IT support and DevOps, where flexible, incremental optimization is key [25]. However, Kanban’s lack of structured planning and defined roles often hinders the ability to set clear success metrics and track progress reliably, especially in complex, cross-functional, or large-scale settings (Ikonen et al., 2011) [26].
A hybrid approach, such as combining Scrum’s structured iterations with Kanban’s flow-based flexibility, offers adaptive success frameworks ideal for fast-changing industries like fintech and digital innovation [27,28]. Though balancing predictability with responsiveness, these hybrids can introduce Complexity in role clarity and progress tracking, making consistent success measurement difficult [25]. This highlights a broader challenge: the absence of universally accepted, context-sensitive success metrics in agile management limits effective evaluation and continuous improvement, especially in adaptive hybrid models like Scrumban [29].
In summary, key challenges in measuring agile project success include evolving goals, variability in stakeholder expectations, inconsistencies in practice implementation, and the difficulty of balancing flexibility with structured evaluation. Addressing these challenges requires tailored, context-aware frameworks that reflect agile’s dynamic and value-driven nature.

2.3. Related Works

Numerous studies have been conducted on the assessment and prediction of project status, utilizing various methodologies such as machine learning, neural networks, Bayesian analysis, and structural equation modeling. Some research has developed predictive models for project success using artificial intelligence algorithms; for example, [30] introduced a hybrid model based on the Evolutionary Support Vector Machine (ESIM) for project success prediction, while [31] employed machine learning models to predict project cost performance.
In the field of crowdfunding project success prediction, studies such as [32] have analyzed the influencing variables using artificial neural networks (ANNs) and deep learning algorithms. Additionally, project Complexity has been identified as a key factor affecting project success. For instance, [33] demonstrated that information and goal Complexity negatively impact success rates in construction projects. Other studies, such as [18], have emphasized the influence of human and organizational factors on the success of agile projects.
A summary of these studies is provided in Table 1.

2.4. Research Gaps

Previous studies have primarily focused on predicting project success in the construction industry, while a model based on agile features for evaluating project status in other industries has not been developed. Therefore, developing a comprehensive model based on agile principles, incorporating the components of Endurance, Effectiveness, Efficiency, and Complexity, addresses a significant research gap. Furthermore, previous studies lack quantitative models for predicting project status based on evaluation indicator inputs. In this regard, this study utilizes machine learning algorithms, particularly artificial neural networks (ANNs), to develop a framework that enables project status prediction based on its features. Additionally, while most previous studies have treated neural networks as black-box models, no research has yet applied explainable artificial intelligence (X-AI) algorithms to analyze and interpret the data labeling process. In this study, the SAHP algorithm is used to interpret the ANN model, providing a detailed analysis of project behavior and a transparent explanation of project status.

3. Methodology

3.1. Model Setup and Data Preprocessing

This study employs a hybrid approach based on machine learning and explainable artificial intelligence (X-AI) to predict the status of agile projects. The problem-solving process consists of four main stages, as illustrated in Figure 2. In the first stage, an initial model based on an artificial neural network (ANN) is designed, where the basic structure includes determining the number of layers, neurons, and activation functions. Selecting an appropriate architecture plays a crucial role in prediction accuracy. Therefore, in the next step, Neural Architecture Search (NAS) is utilized to optimize the ANN architecture. This algorithm evaluates multiple architectures to identify the most efficient structure. If the designed model does not yield satisfactory results, the design process is iterated until the optimal configuration is achieved. Once the model is finalized, in the next stage, the ANN model is interpreted using the SHAP algorithm to determine which features have the most significant impact on project success or failure. This method enhances transparency in neural networks, which are often regarded as “black-box” models, making their decision-making process more interpretable. In the final stage, the Apriori algorithm is applied to analyze project behavior across different categories. This algorithm identifies recurring patterns and common characteristics among successful, failed, and delayed projects, offering valuable insights for improving project management. Figure 2 illustrates the overall workflow of this study, encompassing model design, optimization, interpretation, and data analysis as an integrated process. The projects were labeled as ‘successful,’ ‘delayed,’ or ‘failed’ based on historical project outcomes recorded in organizational databases. In a more specific sense, successful projects were those that were finished on time and within budget and met or exceeded the scope and goals designated for them. Delayed projects exceeded the planned time and/or budget but ultimately completed the work. Failed projects could not meet major milestones or objectives or stopped before completion. Subject matter experts also reviewed these labels to ensure consistency with definitions and two additional review steps to ensure accuracy. Upon analysis, minor class imbalances were noted, specifically that fewer instances were marked with the ‘failed’ label. Stratified sampling was then used for data splitting (80% training and 20% testing) to preserve proportional class representation. Although SMOTE and other oversampling procedures were considered viable options, stratified sampling was considered sufficient for balanced representation with reasonable potential risk given a moderate imbalance and the relatively larger dataset size.
Detailed explanations of each method used in this study, including the specifics of the NAS, SHAP, and Apriori algorithms, are provided in sections below.

3.2. Feature Extraction and Justification

A systematic, literature-driven, and expert-validated process was employed for the extraction and selection of relevant agile-related features utilized in this study; this process comprised three main phases.
  • Phase 1: Review of the Literature for Initial Identification
A comprehensive review of the existing literature pertaining to agile and success factors within agile-based projects was initially undertaken. This review included an analysis of peer-reviewed research articles, conference papers, and reputable industry reports published primarily between 2015 and 2025. From the literature review, an initial catalogue of approximately 40 potential agile features was produced that addressed components of Efficiency, Effectiveness, Endurance, and Complexity. The selection criteria for the initial catalogue were based on frequency of occurrence in the literature, applicability to an agile-based project context, and utility of the feature to agile project management practice.
  • Phase 2: Expert Consultation with the Delphi Method
After completion of the literature-based extraction, a Delphi panel was constructed in order to validate and confirm the features. The panel consisted of 12 experts specializing in agile project management, including senior agile coaches, Scrum Masters, and project managers. Each expert had experience managing agile projects in diverse roles across a wide range of industries, particularly within the telecommunications and software sectors.
The Delphi method utilized three repeated phases:
Step 1 (Evaluation of Features): experts were presented the original 40 features and were requested to rate the relevance and importance of the 40 features utilizing a Likert scale (1 = not relevant, to a score of 5 = highly relevant).
Step 2 (Refinement of Features): features receiving a consistently low rating (average rating scale value below 3) were removed, and we received qualitative features to retain or remove features.
Step 3 (Consensus Building): a final rating and ranking of all remaining features occurred to produce a new final set of agile project success features that were streamlined and promoted consensus building.
The research team concluded the Delphi process once the experts indicated that panelists agreed in consensus at an appropriate level (>80%).
  • Phase 3: Final Validation and Confirmation of Selected Features
In the end, the Delphi panel indicated that 22 features were most appropriate to the final consensus process. The features were categorized clearly into four main agile-related dimensions (usage in an agile context) of Efficiency, Effectiveness, Endurance, and Complexity, along with validation across more of the literature to ensure applicability of the features to agile project management scholarship and practice. Each feature was clearly defined and articulated and provided a clear methodology or approach to how the feature would be measured and definitions provided to strengthen applicability across projects represented in the dataset.
Table 2 provides a final set of the agile features, term definitions, and the development criteria of the measurement lists (it is an organized, easy to read table clearly demonstrating the 22 initial features and the definitional grounds and terms utilized in the methodology to measure successful attainability in agile projects).
The structured transparency and rigor of the process for extraction and validation enhances the likelihood of tenability for the final determination of features, ensuring they were theoretically grounded, practically applicable, and methodologically justified for the predictive modeling that was developed in this research.

3.3. Neural Architecture Search (NAS) Procedure

A Neural Architecture Search (NAS) procedure was performed to systematically discover the best neural network architecture. The various combinations evaluated during the search process included hidden layers (varying from one to three layers), neuron counts (50, 100, 150) per layer, activation type (Sigmoid, Tanh, ReLU), and optimization algorithms (Adam, SGD, L-BFGS). To formally evaluate each candidate architecture, a grid search strategy was applied to explore the performance across different configurations. Models were evaluated using cross-validation methods. Evaluation metrics included (but were not limited to) accuracy, precision, recall, and F1-score. The NAS procedure concluded when the best model was identified with no significant improvement over the model during evaluation.

3.4. Integration of SHAP for Explainability

Following the completion of training the final ANN model, the next step was the implementation of the SHapley Additive exPlanations (SHAP) method to improve the interpretability and transparency of the model’s predictions. SHAP is the latest X-AI methodology based on cooperative game theory; it can measure the contribution (i.e., impact) of each feature to individual predictions and the global behavior of the model. SHAP enables stakeholders, including project managers and decision-makers, to have a better understanding of the contributing factors to the predictions made by the ANN model. In this study, the implementation of SHAP into our predictive workflow can be broken down into three steps, which are outlined below.
Step 1 (Computation of SHAP Values)—after NAS optimization produced the best performing ANN model, SHAP values for each of the input features were computed for the entire dataset using the Python v3.12.5 SHAP package.
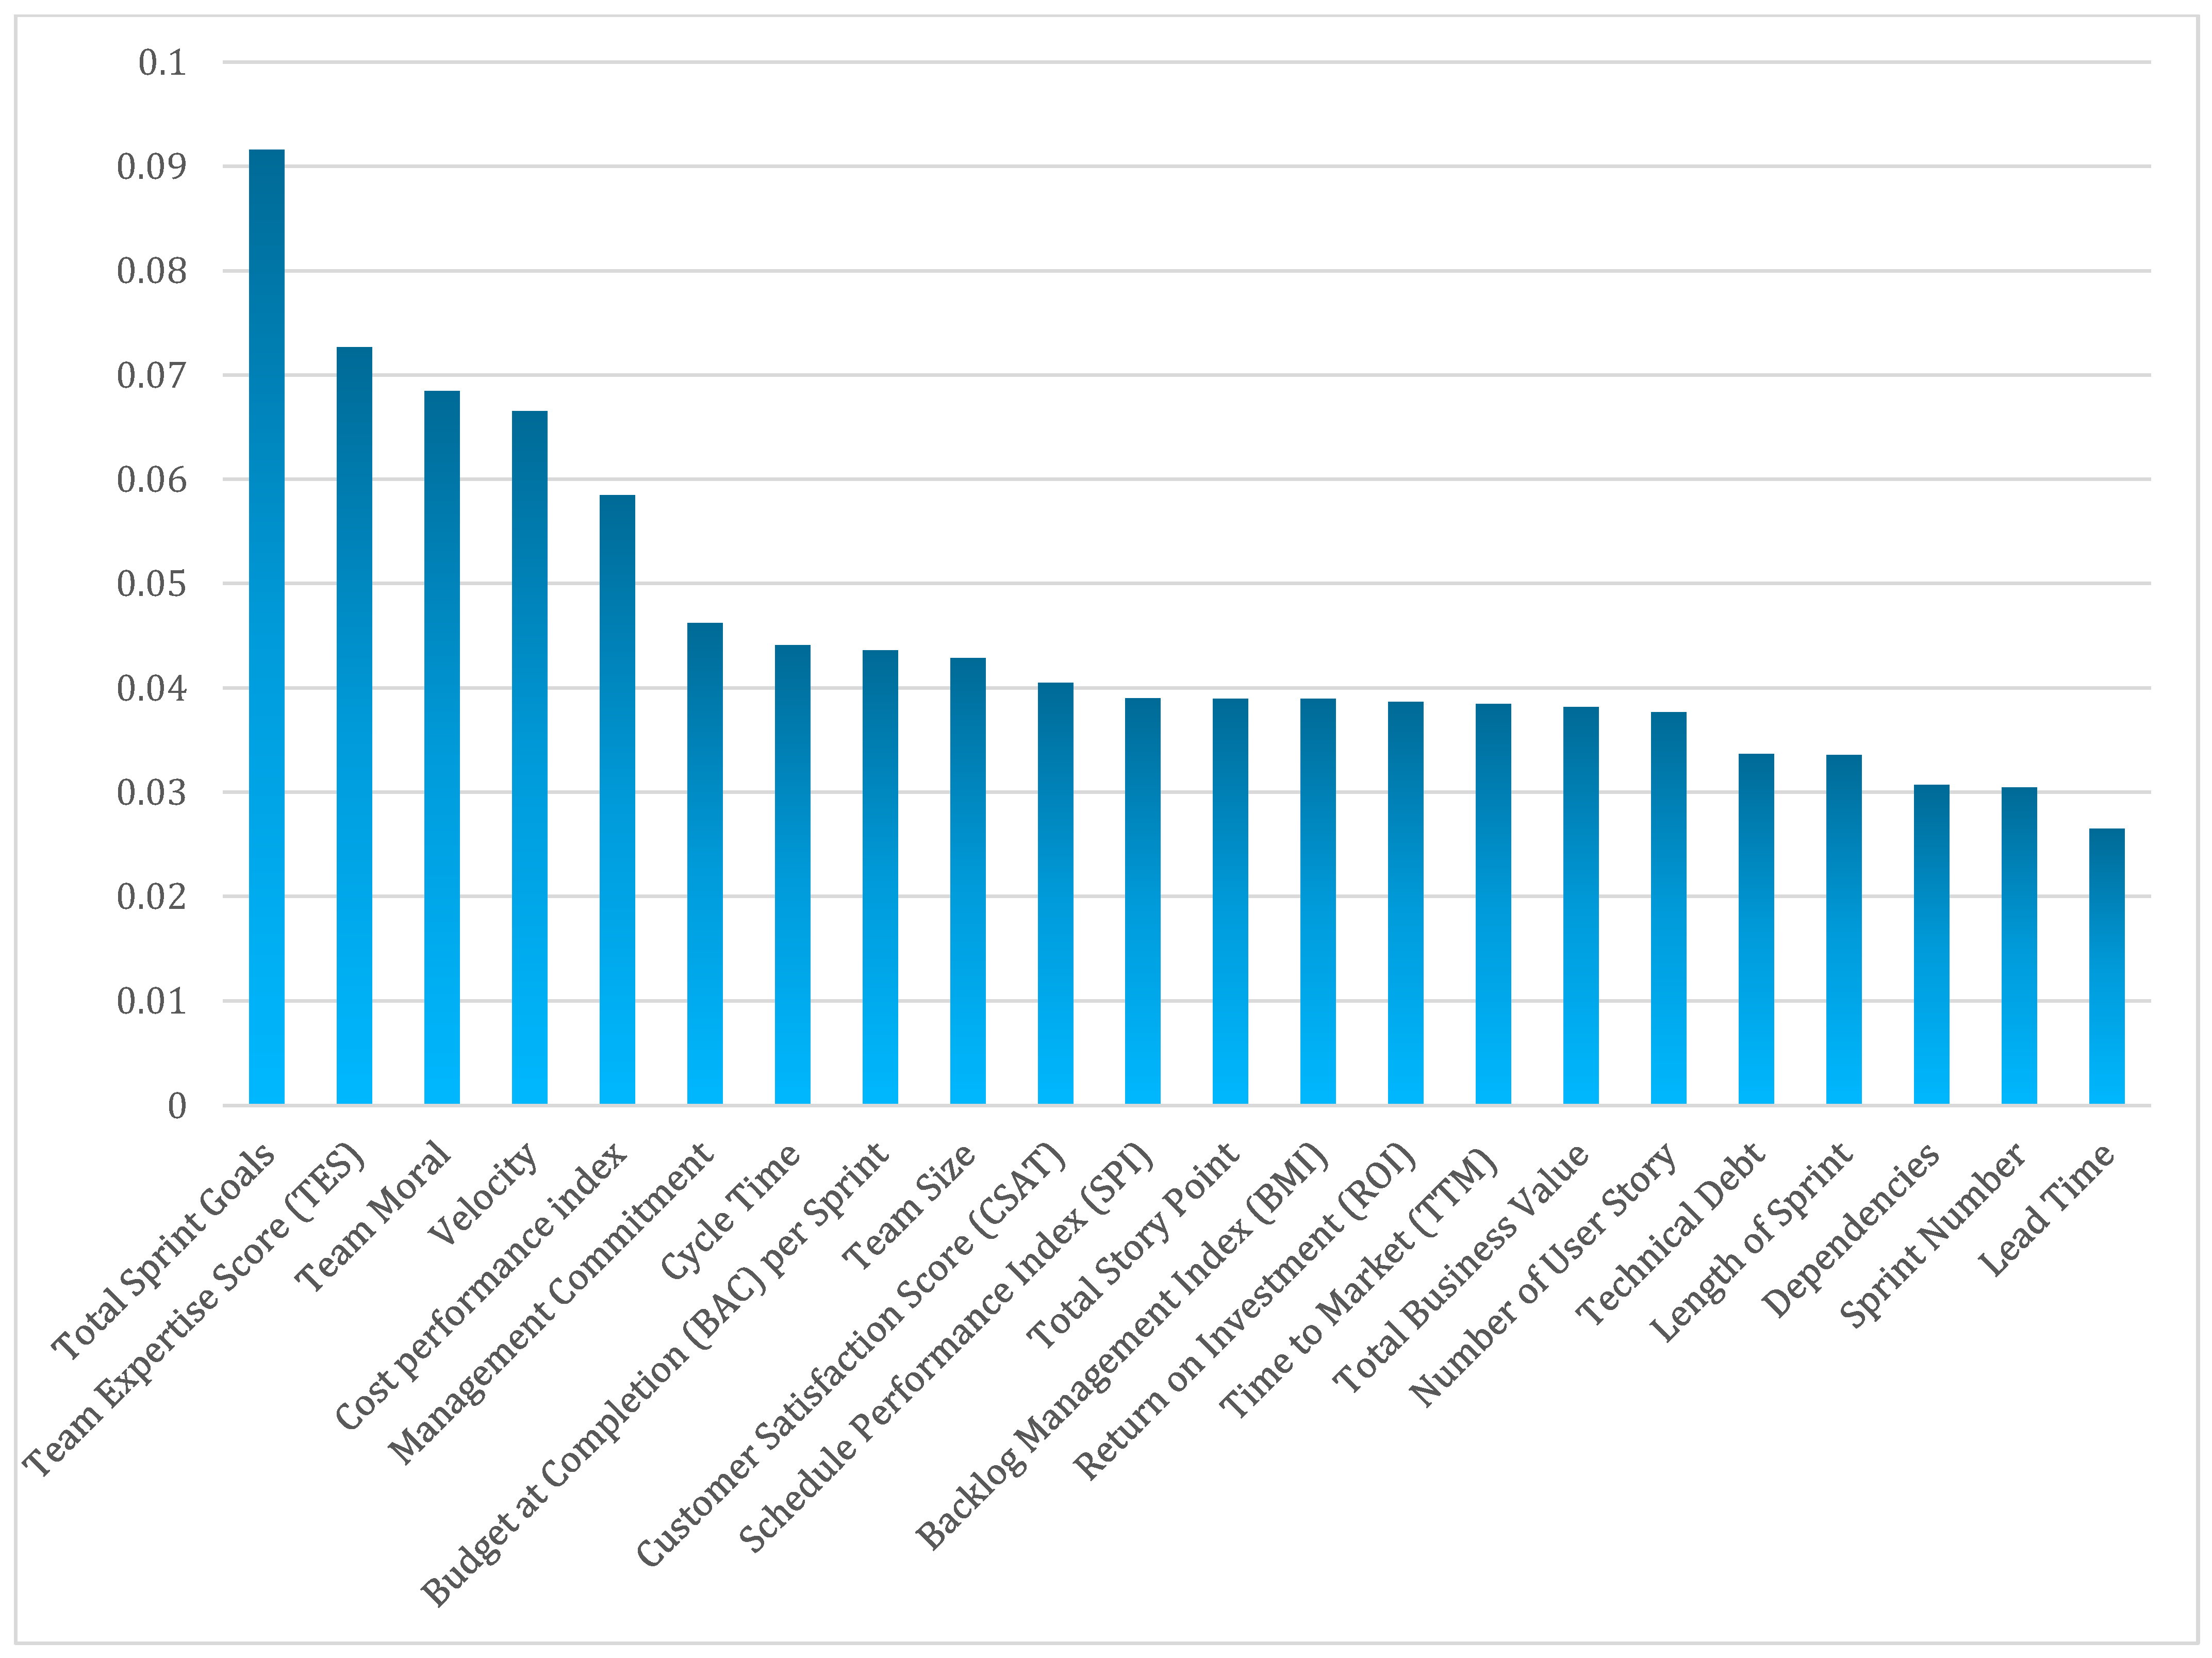
Step 2 (Global Interpretability)—The computed SHAP values for each feature were aggregated together in order to create global feature importance rankings. This analysis provided insight into which agile features (e.g., sprint goals, velocity, team morale, etc.) were significantly impacting the overall success or failure of individual projects across the dataset.
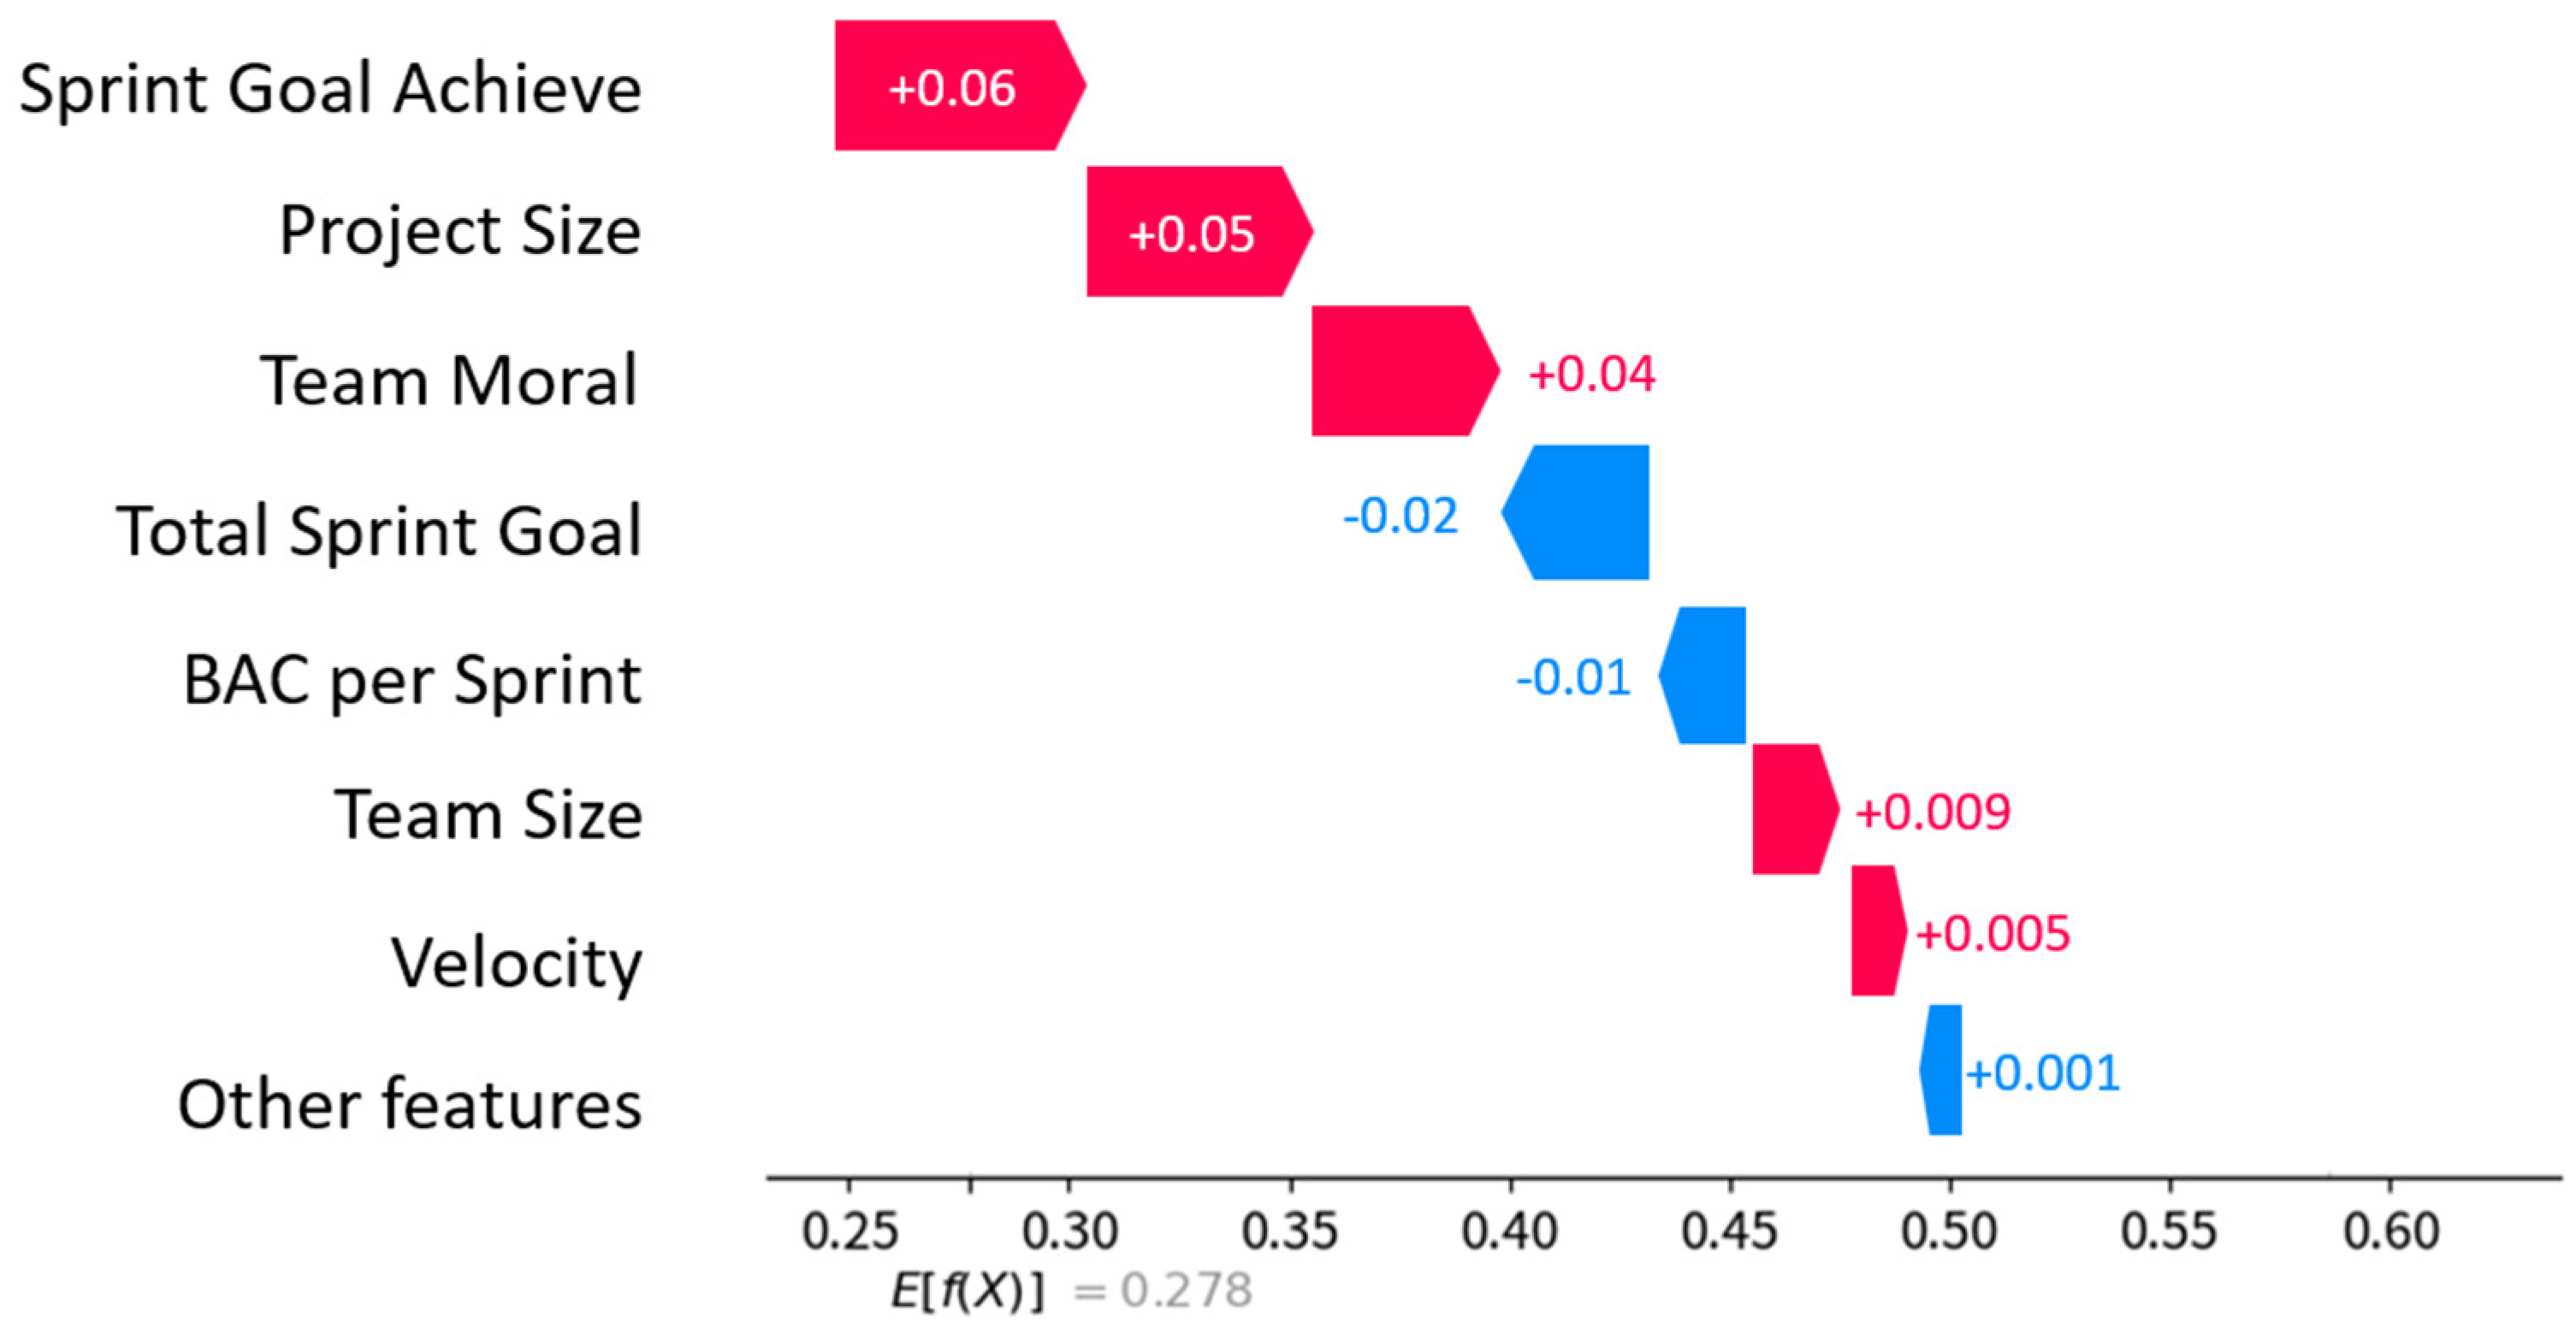
Step 3 (Local Interpretability)—the SHAP framework also provided local explanations of each individual project prediction, which enabled managers to understand the rationale for those specific predictions and enabled them to develop targeted corrective actions.
Visual summaries were provided in the form of SHAP summary plots, which were used to provide a visual representation of the relative impact of each feature on the predictions of the ANN model. These visualization plots were able to provide significant improvements to the interpretability and actionable insights derived from ANN predictions, and implementing these as part of the SHAP methodology is helpful, especially for stakeholders with minimal technical expertise.

3.5. Integration of Apriori Analysis

In order to further the analytic understanding of agile project behaviors, a well-established data mining technique, the Apriori algorithm, was employed in our methodology. The objective of Apriori analysis was to identify frequent sets of agile project features (feature-value sets) that were significantly related to a variety of project outcomes (successful, delayed, and failed). This aligns with the principles of predictive modeling, which aim to identify recurring feature patterns and support managerial interpretation through explainable insights—often leading to statements such as: "It is reasonable to conclude that..." or through rule-based reasoning.
The following outlines the process involved in identifying and implementing the Apriori algorithm into the analysis:
Step 1 (Prepare and Group Data):
In step 1, the sample was clearly grouped into three categories based on the final ANN predictions:
  • Successful project.
  • Delayed project.
  • Failed project.
Second, once project features were adequately grouped together, the feature values of numerical and continuous characteristics were converted to the easily represented categorical groupings. For example, the numerical features of team morale scores, velocity, or total sprint numbers were converted to groupings of categorical levels—high, medium, and low. These categorical levels were easily measurable thresholds of ratio measures that were defined from suggested percentile criteria (e.g., cutoffs of the 25th and 75th percentiles). The combination of groupings of categorical value levels enabled precise frequent itemset mining, as opposed to simply finding frequent associations within the observables.
Step 2 (Running the Apriori Algorithm):
The Apriori algorithm was completed separately per project outcome category (thus, the successful category was analyzed completely for successful projects in step 2, and so forth). The iteration aimed to identify frequent combinations of displayed credible features that appeared within the project outcome category. During analysis,
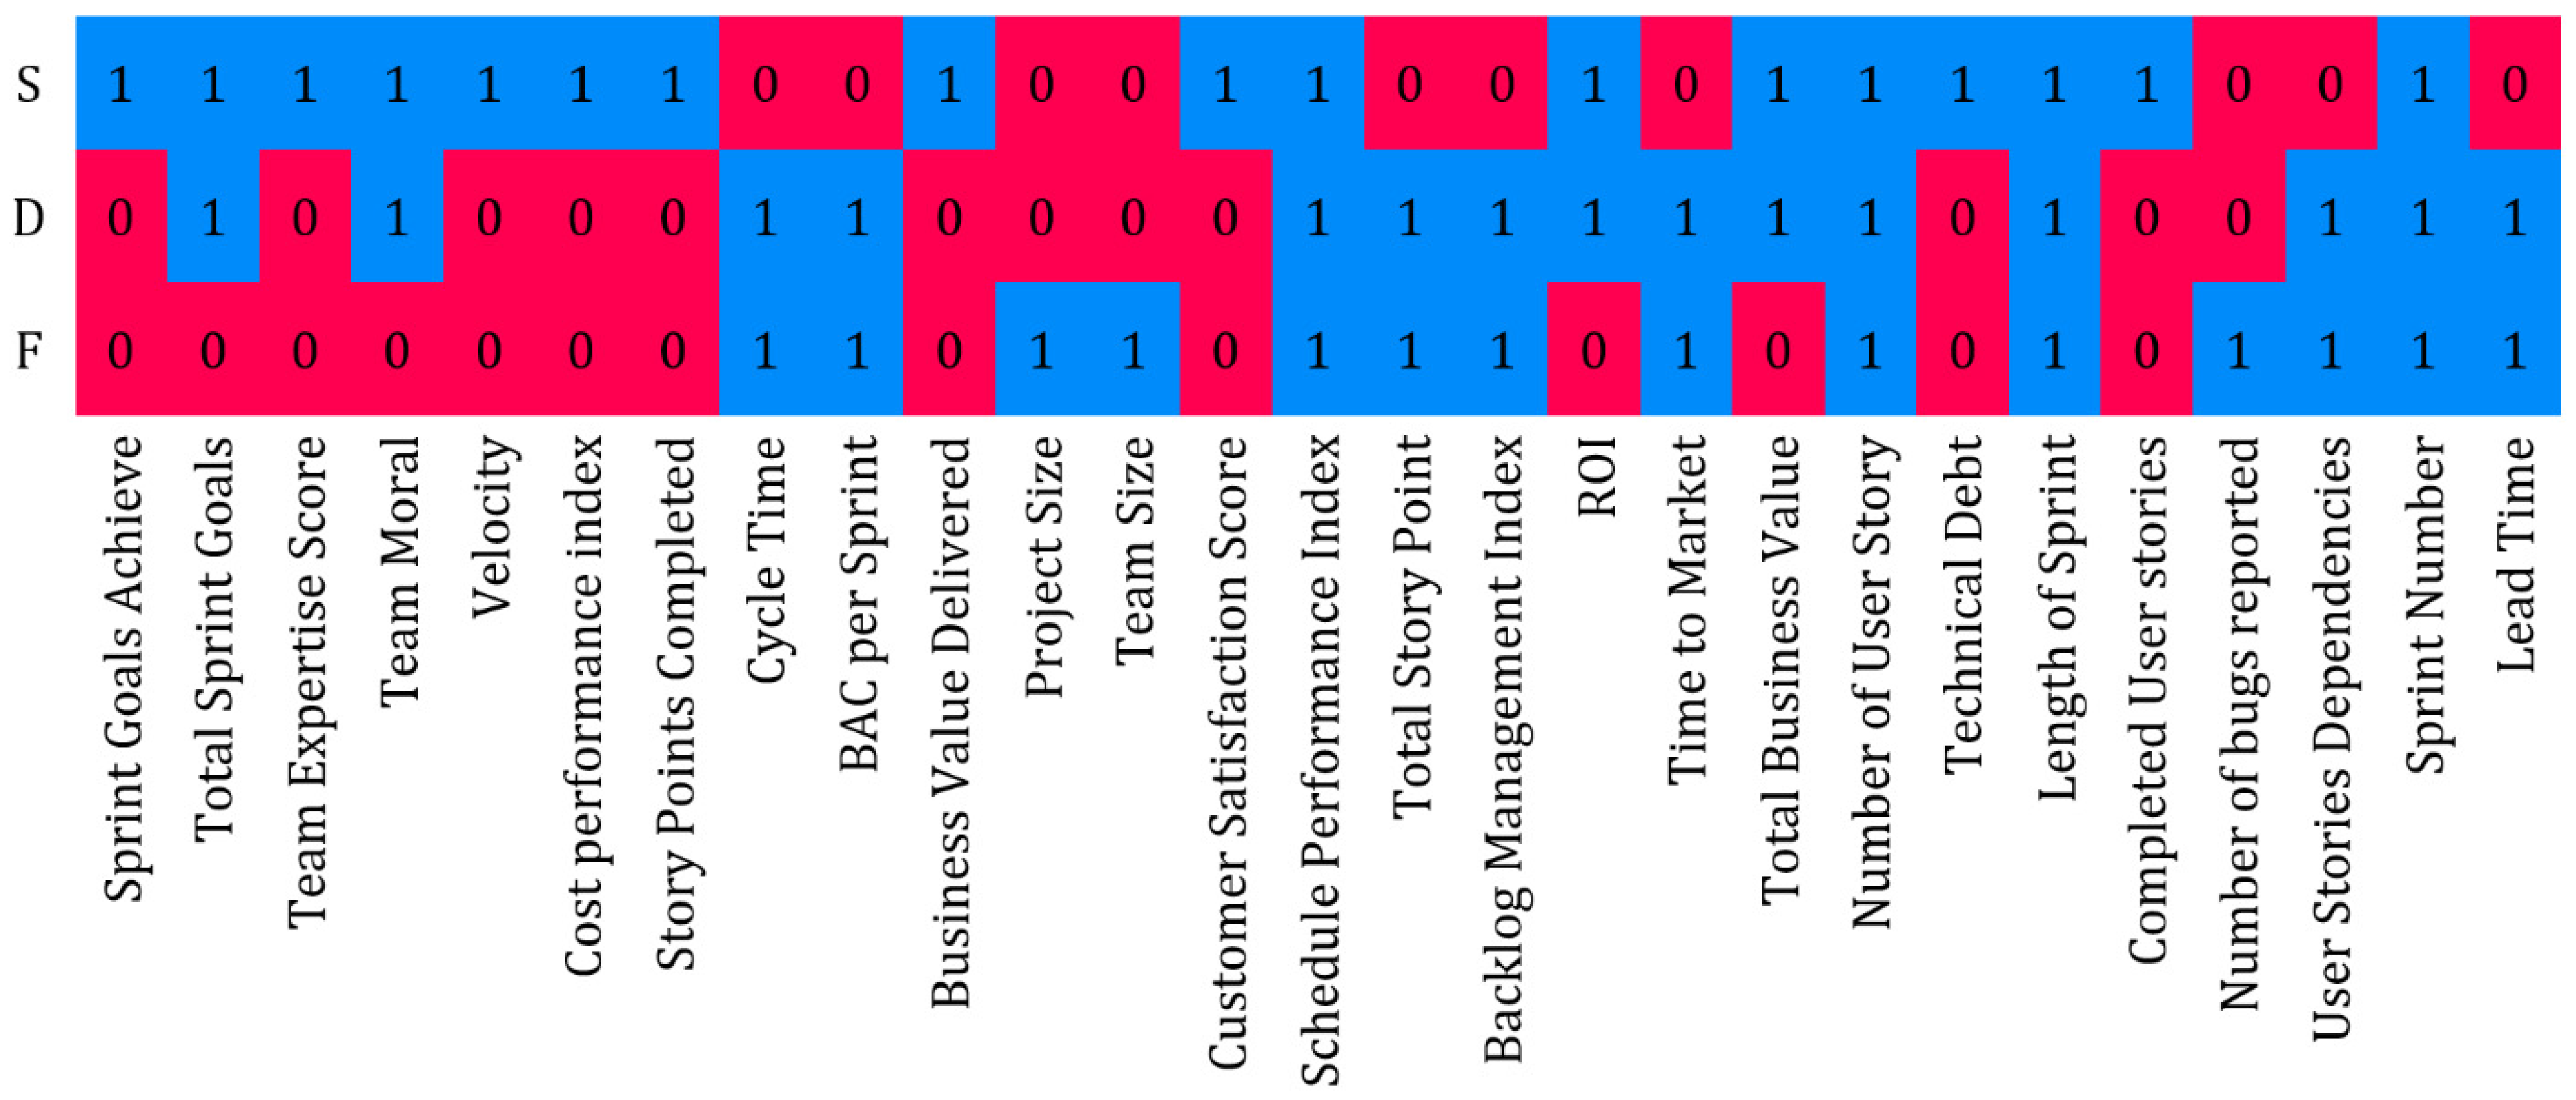
  • Apriori consistently searched for iterated frequent feature-value sets (i.e., itemsets) across project records, within each category for successful, delayed, and failed projects.
  • Once the itemsets were produced, the frequent itemsets were filtered out with minimum support thresholds in terms of relevance [sample size] and significance (i.e., accepted based on statistical confidence).
Step 3 (Produce Association Rules):
The frequently identified itemsets were converted into association rules that exhibited conditional relationships: the antecedent of the rule and action will inform the decision under construction for a project outcome. Each rule will encourage action (or not, depending on the rule) towards certain combinations of features predicting an outcome with articulated confidence. Examples of some of the generated rules were
  • “If Team Morale = High AND Total Sprint Goals = Clearly Defined THEN Project Outcome = Successful”
  • “If Technical Debt = High AND Number of Dependencies = High THEN Project Outcome = Delayed or Failed.”
All identified association rules were filtered based on the minimum confidence (the probability of an outcome given the conditions) and lift (the degree to which the combination occurred more frequently than random occurrences). Appropriate filtering was applied to extract meaningful rules based on their relevance (e.g., confidence levels) and to identify key practices relevant to decision-making. This approach illustrates how the use of the Apriori algorithm in the current study can enhance decision-making practices.
Step 4 (Visualizing and Interpreting Analysis):
In the final communication and inquiry phase, visuals were also provided (e.g., picto-graphs of network graphs or heatmaps) to improve local interpretations about the rounded associations between project features in any of the defined outcome categories (deciding if the features are more significantly categorical with weak or strong relationships). For example, the visuals provided were
  • Visually represented well-defined sets of features that frequently co-occur together
  • Assigned strength of association rules represented by either color or line thickness
This was intended to enhance documents for managers and other participants to cognitively intuit which combinations of project features can inform project outcomes in a project.
Stage 5 (Linking Insights to Managerial Recommendations):
In the fifth stage, the focus transitioned explicitly to integrating insights from the Apriori analysis with actionable recommendations for agile project management practice, thereby producing an operationalizable form of the analytic constituting an empirical derivative of theory. The identified patterns and association rules represented practical, real-world guidance for agile project managers, enabling them to make informed decisions, proactively manage risks, and plan strategically. The results of the Apriori analysis enabled practitioners to
  • Support and repeat successful feature combinations:
For example, project teams who consistently had excellent results tended to have clear sprint goals, high team morale, and stable project velocity. The recommendation here is for project teams to recognize these examples as standard practices contributing to better performance and adopt them accordingly to consistently produce successful outcomes.
  • Proactively monitor and mitigate identified risk factors:
Risk factors predictive of delays or project failure, identified through common association rules, included significant technical debt, a high number (or extent of overall project) of tasks and dependencies, and a long project cycle or sprint duration. Managers should be aware of these indicators and take steps to address them early, e.g., by addressing technical debt or establishing better dependency management practices on projects.
  • Targeted Training and Resource Provisioning:
The identified patterns and rules produced by the Apriori analysis can also support targeted training and better resource provisioning decisions. For example, projects identified as being at high risk of difficulty—even if such patterns have not yet resulted in failure—could benefit from targeted interventions such as additional training programs or staffing focused on managing technical debt. Moreover, professionals could be assigned to deliver specialized training on managing dependencies, with the aim not merely of avoiding failure but of fostering improved practices in defining and managing project requirements.
  • Ongoing Improvement Process:
Applying Apriori analysis, on an ongoing basis, also creates a feedback loop that is informative to retrospective processes or phases of agile practices where review and planning phases occur. Continuous iterative improvement aims to create consistent improvements in agile cycles, agile processes and methods, and team performance.
Thus, by clearly identifying managerial recommendations linked to insights from the Apriori analysis, the fifth step makes a clear connection between actionable insights from the Apriori analysis, practice, and ongoing evaluation of project management implications, continuity, and fidelity. Therefore, this step reinforces the value of integrating Apriori analysis with project management practices. It highlights the potential to implement specific actions that strengthen proposed changes and help bridge the gap between theoretical insights and practical application.

4. Results

In this section, the features used in the project status prediction model are first introduced and analyzed. Then, the prediction process is examined using an artificial neural network (ANN) with an optimized architecture selected by the NAS algorithm. Next, the SHAP algorithm is applied to interpret the ANN model, identifying the impact of each feature on the prediction results. Finally, project behavior within each category is analyzed using the Apriori algorithm, extracting key patterns among successful and unsuccessful projects.

4.1. Data Description and Model Development Features

This section describes the data used in this study. The dataset consists of software projects from the telecommunications industry, which are fully labeled. It includes 360 records, with 80% (288 records) used for training and 20% (72 records) reserved for testing. Due to the structured data collection process, no data cleaning or preprocessing was required.
The dataset comprises 22 key indicators for evaluating agile projects, categorized into four main groups:
  • Efficiency: focuses on cycle time, sprint count, cost, and planned performance (Moyano et al., 2022; French et al., 2018) [59,60].
  • Effectiveness: relates to goal management, business value, and return on investment (ROI) [61].
  • Endurance: includes factors such as team morale, customer satisfaction, and team experience, which contribute to long-term project success (Keshta & Morgan, 2017; Kropp et al., 2018) [55,62].
  • Complexity: examines project Complexity in terms of task dependencies, technical debt, and time to market (Groß et al., 2019) [57].
The project evaluation features and their corresponding sources are provided in Table 2.

4.2. Analysis of Features and Their Importance

To develop a predictive model for project status, data from 360 projects in the telecommunications industry were utilized. These projects were at different stages in terms of their progress and contained a diverse range of values for each feature, enabling the creation of a comprehensive model. The data were clean, free of noise or outliers, and required no preprocessing. In total, 80% of the data were used for training, while 20% were reserved for model testing.
A key step in model development is feature analysis and determining their importance, which was conducted using the Pearson correlation coefficient to examine relationships between features. The correlation heatmap, presented in Figure 3, illustrates how Efficiency, Effectiveness, Endurance, and Complexity are interrelated and influence each other. For instance, Endurance, represented by factors like team morale and customer satisfaction, plays a significant role in enhancing the Effectiveness of the agile process, improving productivity through key indicators such as velocity and return on investment (ROI). Conversely, challenges such as technical debt and project dependencies can negatively impact business performance. Effective management of these challenges is crucial for maintaining time to market (TTM) and Budget at Completion (BAC).
Another crucial point is identifying the extent of the impact that features have on the model’s objective, which is the project’s success level. In the artificial neural network algorithm, the impact of each feature on the model’s output is calculated using the partial derivatives of the loss function concerning each feature. In this regard, by examining the importance of the feature within the designed algorithm, Figure 4 illustrates the significance of these features.
The most important features are “total sprint goals”, “team expertise score (TES)”, and “team morale”. These findings highlight important features that contribute to the success of accelerator strategies. “Total sprint goals” focuses on setting clear, measurable goals for each sprint cycle. It involves iterative and continuous improvement, with each sprint building on the previous one to incrementally increase the project’s productivity. Its distinguished reputation emphasizes the vital role that the individual skills and competencies of the team members play in successfully managing agile projects. A well-qualified team helps to overcome the challenges that often arise during the rapid implementation of agile projects. Furthermore, “team morale” is also an essential feature. Furthermore, team morale is identified as a critical factor. A team’s well-being and ethical culture are strongly linked to enhanced productivity and collaboration—both of which are vital for sustaining growth and fostering innovation throughout the project lifecycle.

4.3. Project Status Prediction with ANN and Optimal Architecture with NAS

To implement the artificial neural network (ANN) model for predicting agile project statuses, the goal is first defined, and a suitable neural network type, such as a multilayer perceptron (MLP), is selected. Then, the number of hidden layers and the number of neurons in each layer are determined based on potential values. At this stage, activation functions like Sigmoid, Tanh, and Relu are also selected for each architecture. Afterward, an appropriate cost function is chosen for the model based on the nature of the problem, which is classification. Next, the optimization algorithm and training parameters, such as the learning rate and learning type, are set. Optimizers like adam, sgd, and lbfgs, specified in the table, are used for each architecture.
Once the model is trained, its performance is evaluated on test data, and various results are obtained based on the different architectures. At this stage, the Neural Architecture Search (NAS) algorithm is employed to generate and evaluate more optimized architectures. This algorithm produces new architectures and selects the best one based on performance indicators. Finally, the final settings are applied to the chosen architecture, and the model is optimized to achieve the desired accuracy. The final selected architectures are presented in Table 3.
One of the approaches in neural network algorithms is the use of the ROC Curve to evaluate different architectures. The ROC Curve represents the model’s ability to distinguish between different classes (e.g., positive and negative classes) across various decision thresholds. In Figure 5, the ROC Curve for different architectures is shown. This chart indicates that Model 5, with an AUC of approximately 0.95, has the best performance among the nine different neural network architectures. Model 5 demonstrates good capability for correctly identifying positive instances and reducing type I errors, while the other models show weaker performance.
To select the best model among the nine mentioned architectures, the metrics of accuracy, precision, recall, and F1-score are employed, which are computed according to Formulas (1)–(4) (Yacouby & Axman 2020) [63].
A c c u r a c y = i = 1 l T P i i = 1 l T P i + F P i
P r e c i s i o n = i = 1 l T P i i = 1 l T P i + F N i
R e c a l l = i = 1 l T P i i = 1 l T P i + F P i
F 1 S c o r e = 2 × ( p r e c i s i o n × r e c a l l ) ( p r e c i s i o n + r e c a l l )
In these formulas, TPᵢ represents the data points labeled as Pᵢ, and the predicted values also correspond to the same; FPᵢ refers to instances where the data points are labeled as Pi but have different predicted values. In Table 4, the metric values for the selected nine architectures are calculated, and it can be observed that Architecture 5 exhibits the best performance among the chosen architectures. Consequently, data interpretation and findings are based on these values.
Additionally, to evaluate the performance of the selected architecture compared to other algorithms, the Support Vector Machine (SVM), eXtreme Gradient Boosting (XGBoost), k-Nearest Neighbor (k-NN), and Random Forest (RF) algorithms were executed on the dataset. The evaluation metrics for the four algorithms are presented in Table 5. The findings show that the optimized ANN algorithm outperforms the other algorithms, thus validating the algorithm developed in this study.
To conduct a thorough comparison of performance across models, 95% confidence intervals were determined for accuracy and F1-scores. Paired t-tests were also used to evaluate statistical significance for performance differences between the ANN model and the benchmark algorithms (XGBoost, Random Forest, and SVM). The ANN model, on average, outperformed the others with statistical significance (p < 0.05).
This research selected a multilayer perceptron (MLP) due to the dataset’s non-sequential structure, comprising independent sprint-level features without significant temporal dependencies. Advanced sequential architectures, such as recurrent neural networks or attention-based models, while powerful for temporal data, were not applied due to the absence of sequential patterns in the dataset. Future studies involving sequential or longitudinal data could explore these architectures further.

4.4. Interpretation of ANN Model with SHAP Algorithm

Upon identifying the optimal neural network architecture, the status of projects was examined using the SHAP algorithm to attain various target labels. In Figure 6, an analysis of feature behavior concerning project labels within the successful project group is presented. It can be observed that the most significant feature contributing to the improvement of successful project statuses is “sprint number,” where each one percent change in this feature results in a 0.1 percent shift away from achieving success for a project. Positive values are observed for features such as “total sprint goal”, “team moral”, “velocity,” and “ customer satisfaction score”, with each one percent change in these features leading to success probabilities of 0.06, 0.04, 0.01, and 0.006, respectively. Additionally, an increase in the “time to market” and “project size” features by one percent results in projects deviating from the success label with probabilities of 0.02 and 0.01 percent, respectively. The analysis shows that the “sprint number” is the most critical factor influencing project success, where an increase negatively impacts success probabilities. On the other hand, features like “total sprint goal,” “team morale,” and “customer satisfaction score” positively contribute to success, emphasizing the need for management to focus on these areas.
Figure 7 presents an analysis of the chart related to projects labeled as “D.” It can be observed that the features “sprint goal achieve,” “project size,” “team moral,” “team size,” and “velocity” lead to projects reaching the label “D” with probabilities of 0.06, 0.05, 0.04, 0.009, and 0.005 percent, respectively, for a one percent change in each feature. Furthermore, the features “total sprint goal” and “BAC per sprint” remove projects from the “D” label with probabilities of 0.02 and 0.01 percent, respectively, for a one percent increase in each feature. The analysis in Figure 7 shows that features like “sprint goal achieve,” “project size,” and “team morale” significantly contribute to projects being labeled as “D,” while “total sprint goal” and “BAC per sprint” reduce the likelihood of projects falling into this category.
Figure 8 provides an analysis of the behavior of features regarding projects labeled as “F.” According to the findings, it can be observed that features such as “project size,” “cycle time,” and “total sprint goal” lead to projects entering this label. For each one percent increase in these features, the probabilities of projects entering group “F” increase by 0.08, 0.03, and 0.008, respectively. On the other hand, features like “velocity,” “team size,” “team expertise score,” and “sprint goal achieve” result in projects exiting this label. With a one percent increase in each of these features, the probabilities of projects leaving group “F” are 0.05, 0.04, 0.01, and 0.006, respectively. Figure 8 shows that features like “project size,” “cycle time,” and “total sprint goal” increase the likelihood of projects being labeled as “F.” In contrast, features such as “velocity,” “team size,” “team expertise score,” and “sprint goal achieve” help projects exit this label.
Despite the capacity of artificial neural networks (ANNs) as predictive instruments, they remain conceptually challenging. This Complexity may impede interpretation for project managers lacking technical expertise. To alleviate this risk and improve interpretation of our predictive model, we implemented the SHapley Additive exPlanations (SHAP) algorithm. Typically used in the field of data science to measure the impact of features on overall predictive output, SHAP explicitly enumerates the manner in which each feature provides a positive or negative contribution to the predicted value and provides an accessible graphical and intuitive approach to communicate those contributions to project success, delay, or failure.
For project management to guide actionable decisions, project managers must understand the practical implications of the SHAP results and develop actionable courses of response where possible. Thus, we will be explicit in translating the SHAP results directly into project management implications.
  • Positive Influence Towards Project Success:
    (i)
    Total Sprint Goals: A higher total number of sprint goals that are concisely stated positively influenced project success probability, as expected. Practically, project managers should focus on collaboratively establishing a significantly higher total number of sprint goals with the development team that align closely with the business’ objectives in terms of the detail and specificity of the sprint goals.
    (ii)
    Team Morale: Teams with higher morale completed projects with better end outcomes. Project managers can increase morale through regular feedback, team-building activities, and recognition and by fostering an inclusive and supportive work environment.
    (iii)
    Velocity: Continuously sustained or increasing velocity (as measured by the number of story points delivered per sprint) is positively correlated with the likelihood of project success. While project managers need to consider velocity more in terms of administration monitoring, they should still keep velocity in mind for discussion with teams since some of the likelihood of the project’s success is contingent on proactively addressing factors that affect team performance or productivity.
  • Negative Influence Towards Poor Project Success (delays and failures):
    (i)
    Sprint Number: A higher number of sprints (indicating projects that lasted longer than planned or too many sprits where the goals were not met) negatively influenced project success. A critical task for project managers is to carefully manage how the project duration progresses and how effective sprint planning is for maintaining a rational pace.
    (ii)
    Technical Debt and Dependencies: High levels of technical debt and numerous outstanding task dependencies are typically associated with delayed or incomplete project outcomes. Project managers should co-locate with these two aspects to track them effectively and ensure significantly more resources are made available to process work to mitigate and reduce technical debt and track task dependencies.
Additionally, we provide visuals throughout the report that are easy to digest. Additionally, we provide visuals throughout the report—such as SHAP summary plots and individual causal plots (Figure 6, Figure 7 and Figure 8)—that clearly illustrate feature impact and causal relationships. These interpretable visualizations help project managers identify which project characteristics or decisions most strongly contribute to or hinder project success, thereby supporting informed and data-driven decision-making.
Overall, by explicitly anchoring the SHAP analysis into practical and managerial actions in non-technical terms, the explicated nature of the analysis has facilitated greater transparency, interpretability, and actionable utility of the ANN-based predictive model for agile project managers.

4.5. Analysis of the Behavior of Projects of Each Category with Apriori

In this section, an analysis is conducted on the features related to each category of project. In the preceding sections, an artificial neural network model was designed to predict project statuses, and then the SHAP algorithm was utilized to interpret the models’ behavior, precisely determining how changes in important features within each category of algorithms lead to specific changes in those category projects. In this section, the behavior of projects in each category is analyzed and examined using the Apriori algorithm.
The Apriori algorithm analyzes the behavior of categories based on the average values of features within each category. Figure 9 illustrates the behavior of each project category concerning each feature. A value of 1 signifies a feature’s value being higher than the overall average, while a value of 0 indicates a feature’s value being lower. In category S, most projects are small in size with small team sizes, yet exhibit high profitability margins and value creation. They also reach their conclusions quickly. Projects in this category are characterized by experienced teams with high velocity and team morale, enabling them to meet deadlines. On the other hand, in category D, projects are larger compared to category S, with larger team sizes and increased Complexity, resulting in lower achievement levels. While these projects are appealing from a value creation perspective, they encounter significant delays. Projects in category F consistently have values above the average concerning time aspects, experiencing substantial delays. Additionally, category F projects are generally large-scale projects with large team sizes, resulting in significantly lower team output and experience compared to the average.

5. Management Insight

This study presents a model for predicting agile project performance using agile features and advanced artificial intelligence (X-AI) algorithms. The analyzed projects in the telecommunications industry reveal that small-scale projects, professional teams, and high motivation significantly contribute to project success. Additionally, precise financial planning and clear operational goal-setting are critical success factors. Analytical findings from the SHAP-level analysis reported in Section 4.4 provide empirical support for these observations. First, the analysis indicated that the variables ‘total sprint goals’, ‘team morale’, and ‘velocity’ all had essential effects on project success, indicating that operational goal-setting, through clear communication of the message, team motivation, and team productivity via sprint velocity, should all be operational priorities. Additionally, SHAP findings identified ‘technical debt’, ‘dependencies’, and ‘sprint numbers’ as the most highly salient predictors of project delay/failure. As such, the recommendation to project managers is to address this through strategic allocation of resources for technical debt purposes, managing dependencies, and managing planning of the team schedule.
To enhance project performance, several practical recommendations have been identified based on industry best practices:
  • Utilizing Data-Driven Models: Companies like Fluor Corporation and Shell use AI-powered predictive models to identify potential risks early, allowing project managers to intervene before delays or failures occur. Agile teams in IT and telecom should leverage neural networks and Neural Architecture Search (NAS) to enhance project monitoring and early risk detection.
  • Focusing on Key Features: Organizations such as Salesforce and Microsoft have demonstrated that prioritizing sprint goals, team expertise score (TES), and customer satisfaction (CSAT) leads to better project outcomes. By emphasizing high-value deliverables, experienced teams, and continuous feedback, agile projects can optimize performance.
  • Flexibility in Planning: Case studies from British Telecom (BT) and Sony show that embracing agile flexibility reduces time to market (TTM) and improves adaptability. Companies implementing iterative planning approaches can quickly adjust to changes, leading to more efficient project execution and faster product releases.
  • Data-Driven Decision-Making: Leveraging explainable AI (X-AI) techniques, such as SHAP, provides transparency in machine learning-based project assessments. Companies like IBM use AI governance tools to interpret project risks and drive informed decision-making, ensuring managers understand the impact of each factor on project success.
  • Investing in Team Training: Experience and expertise play a crucial role in agile project success. PayPal and Telstra have demonstrated that large-scale agile transformations require continuous training programs for team members. Organizations that invest in agile education, such as Scrum and DevOps certifications, achieve higher Efficiency, better team coordination, and improved project outcomes.
By implementing these strategies, agile teams in telecommunications and it industries can enhance performance, mitigate risks, and sustain long-term project success in an evolving business landscape.

6. Conclusions

The objective of this work is to develop a comprehensive model aimed at predicting project statuses in the telecom industry. Project status in this context refers to whether a project encounters failure or delays or successfully reaches completion within the planned time frame. To achieve this, project management features grounded in the agile methodology are utilized, and prediction labels are categorized into three distinct classes: Endurance, Effectiveness, and Efficiency. These labels provide a clear framework for evaluating project outcomes. Furthermore, specific variables that correspond to these agile features are identified and defined as key complexities that could impact project performance. In total, 22 distinct features are selected, and data related to these features are collected from 360 real-world telecom projects. Analysis of these features reveals that having an experienced and capable team, which can effectively steer projects, is the most critical factor influencing project success.
Building on this feature analysis, a neural network model is designed to predict project performance, leveraging an artificial neural network (ANN) algorithm. The architecture of this model is optimized using the Neural Architecture Search (NAS) algorithm, which identifies the best-performing structure for the task. Following this, the SHAP algorithm is applied to explain the behavior of the ANN model, making it more interpretable and transparent—a technique that falls under the expanded field of explainable artificial intelligence (X-AI). This step is crucial as it allows for an in-depth understanding of how key features and indicators influence project outcomes across different categories. This X-AI approach, introduced for the first time in this article, represents an innovative method for assessing project statuses specifically within the telecom sector, providing new insights into project management dynamics.
Moreover, the study goes a step further by employing the Apriori algorithm to conduct a detailed analysis of project behaviors within each identified category, offering valuable managerial insights. The performance of the developed model is evaluated through accuracy, precision, recall, and F1-score metrics, achieving values of 0.93, 0.93, 0.94, and 0.93, respectively. These high scores demonstrate the model’s robustness and reliability in predicting project outcomes.
One limitation of this research is its primary focus on software and telecommunications projects, limiting the generalizability of findings. Future research should extend the analysis to other industries, such as healthcare, manufacturing, and finance, to validate and potentially expand the current feature rankings and importance.
To expand the application of this predictive model beyond the telecom industry, it is proposed that the model be implemented in various other sectors to assess its broader Effectiveness. Additionally, hybrid techniques such as Fuzzy Inference Systems (FIS) and Data Envelopment Analysis (DEA) could be integrated into future studies to better assess project statuses using historical data and, when combined with machine learning algorithms, enhance the model’s ability to predict future project statuses with greater accuracy.

Author Contributions

Writing—original draft, A.A.F.; Writing—review & editing, F.A., R.J. and A.I.; Supervision, F.A. and A.G. All authors have read and agreed to the published version of the manuscript.

Funding

This work has been realized with financial support by the European Regional Development Fund within the Operational Programme “Bulgarian national recovery and resilience plan” and the procedure for direct provision of grants “Establishing of a network of research higher education institutions in Bulgaria”, under the Project BG-RRP-2.004-0005 “Improving the research capacity and quality to achieve international recognition and resilience of TU-Sofia.

Data Availability Statement

The datasets generated and analyzed during the current study are not publicly available due to organizational confidentiality agreements but are available from the corresponding author on reasonable request.

Conflicts of Interest

The authors declare that they have no competing interests.

References

  1. Karlsson, G.; Lundén, P. Agile Education Imagined: A report from the Cybercampus workshop on Agile Education. 2023. Available online: https://www.diva-portal.org/smash/record.jsf?dswid=5339&pid=diva2%3A1728060 (accessed on 17 June 2025).
  2. Nejad, A.A.F.; Arabikhan, F.; Williams, N.; Gegov, A.; Sari, O.; Bader, M. Agile Project Status Prediction Using Interpretable Machine Learning. In Proceedings of the 2024 IEEE 12th International Conference on Intelligent Systems (IS), Varna, Bulgaria, 1–8 August 2024; pp. 1–8. [Google Scholar] [CrossRef]
  3. Meso, P.; Jain, R. Agile Software Development: Adaptive Systems Principles and Best Practices. Inf. Syst. Manag. 2006, 23, 19–30. [Google Scholar] [CrossRef]
  4. Kuhrmann, M.; Tell, P.; Hebig, R.; Klünder, J.; Münch, J.; Linssen, O.; Pfahl, D.; Felderer, M.; Prause, C.R.; MacDonell, S.G.; et al. What Makes Agile Software Development Agile? IEEE Trans. Softw. Eng. 2022, 48, 3523–3539. [Google Scholar] [CrossRef]
  5. Gemino, A.; Reich, B.H.; Serrador, P.M. Agile, traditional, and hybrid approaches to project success: Is hybrid a poor second choice? Proj. Manag. J. 2021, 52, 161–175. [Google Scholar] [CrossRef]
  6. Anand, A.; Kaur, J.; Singh, O.; Alhazmi, O.H. Optimal Sprint Length Determination for Agile-Based Software Development. Comput. Mater. Contin. 2021, 68, 3693–3712. [Google Scholar] [CrossRef]
  7. Serrador, P.; Pinto, J.K. Does Agile work?—A quantitative analysis of agile project success. Int. J. Proj. Manag. 2015, 33, 1040–1051. [Google Scholar] [CrossRef]
  8. Tang, M.; Cai, S.; Lau, V.K.N. Over-the-Air Aggregation With Multiple Shared Channels and Graph-Based State Estimation for Industrial IoT Systems. IEEE Internet Things J. 2021, 8, 14638–14657. [Google Scholar] [CrossRef]
  9. Li, H.; Yazdi, M.; Nedjati, A.; Moradi, R.; Adumene, S.; Dao, U.; Moradi, A.H.; Haghighi, A.; Obeng, F.E.; Huang, C.-G.; et al. Harnessing AI for Project Risk Management: A Paradigm Shift. Stud. Syst. Decis. Control 2024, 518, 253–272. [Google Scholar] [CrossRef]
  10. ForouzeshNejad, A.A.; Arabikhan, F.; Aheleroff, S. Optimizing Project Time and Cost Prediction Using a Hybrid XGBoost and Simulated Annealing Algorithm. Machines 2024, 12, 867. [Google Scholar] [CrossRef]
  11. Arrieta, A.B.; Díaz-Rodríguez, N.; Del Ser, J.; Bennetot, A.; Tabik, S.; Barbado, A.; García, S.; Gil-López, S.; Molina, D.; Benjamins, R.; et al. Explainable Artificial Intelligence (XAI): Concepts, taxonomies, opportunities and challenges toward responsible AI. Inf. Fusion 2020, 58, 82–115. [Google Scholar] [CrossRef]
  12. Chuang, S.-W.; Luor, T.; Lu, H.-P. Assessment of institutions, scholars, and contributions on agile software development (2001–2012). J. Syst. Softw. 2014, 93, 84–101. [Google Scholar] [CrossRef]
  13. Navada, A.; Ansari, A.N.; Patil, S.; Sonkamble, B.A. In Overview of use of decision tree algorithms in machine learning. In Proceedings of the 2011 IEEE Control and System Graduate Research Colloquium, ICSGRC, Shah Alam, Malaysia, 27–28 June 2011; pp. 37–42. [Google Scholar] [CrossRef]
  14. Müller, R.; Turner, R. The Influence of Project Managers on Project Success Criteria and Project Success by Type of Project. Eur. Manag. J. 2007, 25, 298–309. [Google Scholar] [CrossRef]
  15. Tominc, P.; Oreški, D.; Rožman, M. Artificial Intelligence and Agility-Based Model for Successful Project Implementation and Company Competitiveness. Information 2023, 14, 337. [Google Scholar] [CrossRef]
  16. Locke, E.A. Relationship of Success and Expectation to Affect on Goal-Seeking Tasks. J. Personal. Soc. Psychol. 1967, 7, 125–134. [Google Scholar] [CrossRef]
  17. Pollack, J.; Helm, J.; Adler, D. What is the Iron Triangle, and how has it changed? Int. J. Manag. Proj. Bus. 2018, 11, 527–547. [Google Scholar] [CrossRef]
  18. Lalic, D.C.; Lalic, B.; Delić, M.; Gracanin, D.; Stefanovic, D. How project management approach impact project success? From traditional to agile. Int. J. Manag. Proj. Bus. 2022, 15, 494–521. [Google Scholar] [CrossRef]
  19. Van Waardenburg, G.; Van Vliet, H. When agile meets the enterprise. Inf. Softw. Technol. 2013, 55, 2154–2171. [Google Scholar] [CrossRef]
  20. Beck, K.; Beedle, M.; Van Bennekum, A.; Cockburn, A.; Cunningham, W.; Fowler, M.; Grenning, J.; Highsmith, J.; Hunt, A.; Jeffries, R.; et al. Manifesto for Agile Software Development. 2001. Available online: https://ai-learn.it/wp-content/uploads/2019/03/03_ManifestoofAgileSoftwareDevelopment-1.pdf (accessed on 17 June 2025).
  21. Dingsøyr, T.; Nerur, S.; Balijepally, V.; Moe, N.B. A decade of agile methodologies: Towards explaining agile software development. J. Syst. Softw. 2012, 85, 1213–1221. [Google Scholar] [CrossRef]
  22. Schwaber, K.; Sutherland, J. Der Visuelle Scrum Guide. Available online: https://scrumguides.org/docs/scrumguide/v2020/2020-Scrum-Guide-US.pdf (accessed on 17 June 2025).
  23. Rubin, K.S. Essential Scrum: A Practical Guide to the Most Popular Agile Process; Kenneth, S.R., Google, B., Eds.; Addison-Wesley: Upper Saddle River, NJ, USA, 2012. [Google Scholar]
  24. Hossain, E.; Babar, M.A.; Paik, H.Y. In Using scrum in global software development: A systematic literature review. In Proceedings of the 2009 4th IEEE International Conference on Global Software Engineering, ICGSE, Limerick, Ireland, 13–16 July 2009; pp. 175–184. [Google Scholar] [CrossRef]
  25. Conforto, E.C.; Salum, F.; Amaral, D.C.; Da Silva, S.L.; De Almeida, L.F.M. Can Agile Project Management be Adopted by Industries Other than Software Development? Proj. Manag. J. 2014, 45, 21–34. [Google Scholar] [CrossRef]
  26. Ikonen, M.; Pirinen, E.; Fagerholm, F.; Kettunen, P.; Abrahamsson, P. In on the impact of Kanban on software project work: An empirical case study investigation. In Proceedings of the 2011 16th IEEE International Conference on Engineering of Complex Computer Systems, ICECCS, Las Vegas, NV, USA, 27–29 April 2011; pp. 305–314. [Google Scholar] [CrossRef]
  27. Alqudah, M.; Razali, R. An Empirical Study of Scrumban Formation based on the Selection of Scrum and Kanban Practices. Int. J. Adv. Sci. Eng. Inf. Technol. 2018, 8, 2315–2322. [Google Scholar] [CrossRef]
  28. Corey, L. Scrumban and Other Essays on Kanban System for Lean Software Development; Modus Cooperandi Press: Seattle, WA, USA, 2009; Available online: https://www.researchgate.net/publication/234815689_Scrumban_-_Essays_on_Kanban_Systems_for_Lean_Software_Development (accessed on 19 April 2025).
  29. Scrumban: Mastering Two Agile Methodologies Atlassian. Available online: https://www.atlassian.com/agile/project-management/scrumban (accessed on 26 April 2025).
  30. Müller, R.; Locatelli, G.; Holzmann, V.; Nilsson, M.; Sagay, T. Artificial Intelligence and Project Management: Empirical Overview, State of the Art, and Guidelines for Future Research. Proj. Manag. J. 2024, 55, 9–15. [Google Scholar] [CrossRef]
  31. Shakya, S. Analysis of Artificial Intelligence based Image Classification Techniques. Artic. J. Innov. Image Process. 2020, 2, 44–54. [Google Scholar] [CrossRef]
  32. McLean, S.; Read, G.J.M.; Thompson, J.; Baber, C.; Stanton, N.A.; Salmon, P.M. The risks associated with Artificial General Intelligence: A systematic review. J. Exp. Theor. Artif. Intell. 2023, 35, 649–663. [Google Scholar] [CrossRef]
  33. Bui, D.T.; Khosravi, K.; Tiefenbacher, J.; Nguyen, H.; Kazakis, N. Improving prediction of water quality indices using novel hybrid machine-learning algorithms. Sci. Total Environ. 2020, 721, 137612. [Google Scholar] [CrossRef]
  34. Sheffield, J.; Lemétayer, J. Factors associated with the software development agility of successful projects. Int. J. Proj. Manag. 2013, 31, 459–472. [Google Scholar] [CrossRef]
  35. Shenhar, A.J.; Dvir, D.; Levy, O.; Maltz, A.C. Project Success: A Multidimensional Strategic Concept. Long Range Plann. 2001, 34, 699–725. [Google Scholar] [CrossRef]
  36. Albert, M.; Balve, P.; Spang, K. Evaluation of project success: A structured literature review. Int. J. Manag. Proj. Bus. 2017, 10, 796–821. [Google Scholar] [CrossRef]
  37. Amani, M.A.; Behdinian, A.; Sheikhalishahi, M. Evaluating factors affecting project success: An agile approach. J. Ind. Eng. Int. 2022, 18, 82. [Google Scholar]
  38. Binboga, B.; Gumussoy, C.A. Factors Affecting Agile Software Project Success. IEEE Access 2024, 12, 95613–95633. [Google Scholar] [CrossRef]
  39. Hassani-Alaoui, S.; Cameron, A.-F.; Giannelia, T. “We use scrum, but…”: Agile modifications and project success. In Proceedings of the Hawaii International Conference on System Sciences, Grand Wailea, HI, USA, 7–10 January 2020. [Google Scholar]
  40. Hnatchuk, Y.; Pavlova, O.; Havrylyuk, K. Method of Forecasting the Characteristics and Evaluating the Implementation Success of IT Projects Based on Requirements Analysis. In Proceedings of the IntelITSIS’2021: 2nd International Workshop on Intelligent Information Technologies and Systems of Information Security, Khmelnytskyi, Ukraine, 24–26 March 2021; pp. 248–258. [Google Scholar]
  41. Misra, S.C.; Kumar, V.; Kumar, U. Identifying some important success factors in adopting agile software development practices. J. Syst. Softw. 2009, 82, 1869–1890. [Google Scholar] [CrossRef]
  42. Ghayyur, S.A.K.; Ahmed, S.; Ali, M.; Razzaq, A.; Ahmed, N.; Naseem, A. A systematic literature review of success factors and barriers of Agile software development. Int. J. Adv. Comput. Sci. Appl. 2018, 9, 278–291. [Google Scholar]
  43. Tam, C.; da Costa Moura, E.J.; Oliveira, T.; Varajão, J. The factors influencing the success of on-going agile software development projects. Int. J. Proj. Manag. 2020, 38, 165–176. [Google Scholar] [CrossRef]
  44. Siddique, L.; Hussein, B. A qualitative study of success criteria in Norwegian agile software projects from suppliers’ perspective. Int. J. Inf. Syst. Proj. Manag. 2016, 4, 63–79. [Google Scholar] [CrossRef]
  45. Petersen, K. An empirical study of lead-times in incremental and agile software development. Lecture Notes in Computer Science (including subseries Lecture Notes in Artificial Intelligence and Lecture Notes in Bioinformatics). In Proceedings of the International Conference on Software Process, Paderborn, Germany, 8–9 July 2010; pp. 345–356. [Google Scholar] [CrossRef]
  46. Aoyama, M. Agile software process and its experience. In Proceedings of the International Conference on Software Engineering, Kyoto, Japan, 19–25 April 1998. [Google Scholar] [CrossRef]
  47. Boschetti, M.A.; Golfarelli, M.; Rizzi, S.; Turricchia, E. A Lagrangian heuristic for sprint planning in agile software development. Comput. Oper. Res. 2014, 43, 116–128. [Google Scholar] [CrossRef]
  48. Vierlboeck, M.; Gövert, K.; Trauer, J.; Lindemann, U. Budgeting for Agile Product Development. Proc. Des. Soc. Int. Conf. Eng. Des. 2019, 1, 2169–2178. [Google Scholar] [CrossRef]
  49. Kim, B.-C. Probabilistic Evaluation of Cost Performance Stability in Earned Value Management. J. Manag. Eng. 2016, 32, 04015025. [Google Scholar] [CrossRef]
  50. Moreira, M.E. Working with Story Points, Velocity, and Burndowns. In Being Agile; Apress: Berkeley, CA, USA, 2013; pp. 187–194. [Google Scholar] [CrossRef]
  51. Bakalova, Z.; Daneva, M. A comparative case study on clients participation in a ‘traditional’ and in an agile software company. In Proceedings of the 12th International Conference on Product Focused Software Development and Process Improvement, Torre Canne Brindisi, Italy, 20–22 June 2011. [Google Scholar] [CrossRef]
  52. Bumbary, K.M. Using velocity, acceleration, and jerk to manage agile schedule risk. In Proceedings of the 2016 International Conference on Information Systems Engineering, ICISE, Los Angeles, CA, USA, 20–22 April 2016; pp. 73–80. [Google Scholar] [CrossRef]
  53. Sedano, T.; Ralph, P.; Peraire, C. The Product Backlog. In Proceedings of the International Conference on Software Engineering, Montreal, QC, Canada, 25–31 May 2019; pp. 200–211. [Google Scholar] [CrossRef]
  54. Kropp, M.; Anslow, C.; Meier, A.; Biddle, R. Satisfaction, practices, and influences in agile software development. In Proceedings of the 22nd International Conference on Evaluation and Assessment in Software Engineering 2018, Christchurch, New Zealand, 28–29 June 2018. [Google Scholar] [CrossRef]
  55. Keshta, N.; Morgan, Y. In Comparison between traditional plan-based and agile software processes according to team size & project domain (A systematic literature review). In Proceedings of the 2017 8th IEEE Annual Information Technology, Electronics and Mobile Communication Conference, IEMCON, Vancouver, BC, Canada, 3–5 October 2017; pp. 567–575. [Google Scholar] [CrossRef]
  56. Behutiye, W.N.; Rodríguez, P.; Oivo, M.; Tosun, A. Analyzing the concept of technical debt in the context of agile software development: A systematic literature review. Inf. Softw. Technol. 2017, 82, 139–158. [Google Scholar] [CrossRef]
  57. Groß, S.; Mandelburger, M.M.; Mendling, J.; Mandelburger, M.; Gross, S.; Malinova, M. Dependency Management in Large-Scale Agile: A Case Study of DevOps Teams. In Proceedings of the 52nd Hawaii International Conference on System Sciences (HICSS 2019), Grand Wailea, Maui, HI, USA, 8–11 January 2019; pp. 6270–6279. Available online: https://sintef.brage.unit.no/sintef-xmlui/handle/11250/2644833 (accessed on 19 March 2024).
  58. Reifer, D.J. How good are agile methods? IEEE Softw. 2002, 19, 16–18. [Google Scholar] [CrossRef]
  59. Moyano, F.D.; Eggenberger, P.; Meynet, G.; Gehan, C.; Mosser, B.; Buldgen, G.; Salmon, S.J.A.J. Asteroseismology of evolved stars to constrain the internal transport of angular momentum-V. Efficiency of the transport on the red giant branch and in the red clump. Astron. Astrophys. 2022, 663, A180. [Google Scholar] [CrossRef]
  60. French, K.A.; Dumani, S.; Allen, T.D.; Shockley, K.M. A meta-analysis of work–family conflict and social support. Psychol. Bull. 2018, 144, 284–314. [Google Scholar] [CrossRef]
  61. Hyväri, I. Project management effectiveness in project-oriented business organizations. Int. J. Proj. Manag. 2006, 24, 216–225. [Google Scholar] [CrossRef]
  62. Kropp, M.; Meier, A.; Anslow, C.; Biddle, R. Satisfaction and its correlates in agile software development. J. Syst. Softw. 2020, 164, 110544. [Google Scholar] [CrossRef]
  63. Yacouby, R.; Axman, D. Probabilistic extension of precision, recall, and f1 score for more thorough evaluation of classification models. In Proceedings of the First Workshop on Evaluation and Comparison of NLP Systems, Online, 20 November 2020; pp. 79–91. [Google Scholar]
Figure 1. Framework of this article.
Electronics 14 02609 g001
Figure 2. Hybrid algorithm of this paper.
Electronics 14 02609 g002
Figure 3. Heatmap diagram related to the relationship between features.
Electronics 14 02609 g003
Figure 4. Diagram of the importance of features in determining the status of the project.
Electronics 14 02609 g004
Figure 5. ROC Curve diagram for different architectures.
Electronics 14 02609 g005
Figure 6. Behavior analysis diagram of features in ANN model for projects labeled S.
Electronics 14 02609 g006
Figure 7. Analysis diagram of the behavior of features in the ANN model for projects labeled D.
Electronics 14 02609 g007
Figure 8. Analysis diagram of the behavior of features in the ANN model for projects labeled F.
Electronics 14 02609 g008
Figure 9. Behavior of features in each category of projects.
Electronics 14 02609 g009
Table 1. Summary of this research’s literature review.
StudyAimPrediction AspectsMethodologyCase Study
EnduranceEffectivenessEfficiencyComplexity
[18]Predicting project successUsedSupport Vector Machine and combination with genetic algorithmConstruction projects
[34]Project cost performance forecastingUsedThe combined method of Support Vector Machine (SVM) and principal component analysis (PCA)Commercial construction projects
[15]Predicting the probability of success of projectsUsedGaussian process regression, Bayesian inference and particle swarm optimization algorithmConstruction projects
[15]Predicting project successUsedRegression algorithmsFinancing projects
[35]Predicting the probability of project successUsedUsedBayesian networksResearch and development projects
[36]Examining the relationship between project Complexity and project successUsedStructural equations and questionnairesConstruction projects
[37]Project safety performance predictionUsedHuman factors engineering and biz networkConstruction projects
[38]Predicting project successUsedNeural network and decision tree and Random ForestCrowdfunding projects
[38]Predicting the success of a crowdfunding projectUsedArtificial neural networkCrowdfunding projects
[39]Estimating the importance of the factors affecting the success of international projectsUsedNeural networkInternational IT projects
[40]Predicting the characteristics and evaluating the success of project implementationUsedUsedNeural networkInformation technology projects
[41]The effect of project Complexity, leadership integrity, performance readiness, and management stability on financial stabilityUsedStructural equations and questionnairesIndonesian Project Management Institute
[42]Predicting the success rate of softwareUsedStatistical analysis and questionnaireSoftware projects
[43]Investigating the impact of financial policies on project performanceUsedUsedDynamic systemConstruction projects
[44]Evaluation of factors affecting the success of agile software projects UsedUsedSmart-PLSSoftware projects
This studyPredicting the success status of projects considering Complexity and agility criteriaUsedUsedUsedUsedANN—SHAP—AprioriSoftware projects
Table 2. Project evaluation features.
AspectFeatureDeceptionQuantitative Measurement
Definition
Reference
EfficiencyLead Timelead time is the time from the start of a task to its completion, focusing on rapid response to changeDays[45]
Cycle Timecycle time is the time taken from the start to the completion of a work item, focusing on streamlining processes and reducing delaysDays[46]
Length of Sprintthe length of a sprint is a fixed period of time during which a specific set of work has to be completed and made ready for review, typically ranging from one to four weeksWeeks[6]
Sprint Numberthe “sprint number” refers to the sequential identifier assigned to each sprint or iteration within a project, marking its order and often used for planning, tracking, and referencing specific periods of workInteger number[47]
Number of User Storya user story is a brief, simple description of a feature told from the perspective of the person who desires the new capability, usually a user or customer of the system.Count per sprint[48]
Budget at Completion (BAC) per Sprint“Budget at Completion” refers to the total projected budget required to complete a project, emphasizing flexible and adaptive financial planning to accommodate changing requirements and prioritiesCurrency unit (Rial)[48]
Cost performance index (CPI)the Cost Performance Index (CPI) is a measure of the financial Efficiency of project execution, reflecting the ratio of work accomplished versus work cost incurredNumeric index[49]
Schedule Performance Index (SPI)Schedule Performance Index (SPI) is a measure of schedule efficiency in a project. It reflects the ratio of earned value (EV) to planned value (PV), indicating how closely the project is adhering to its scheduled timeline.Numeric index[49]
Total Story Pointa Story Point is a unit of measure for expressing the overall effort required to fully implement a piece of work (such as a user story) in a way that accounts for Complexity, risks, and efforts involvedInteger number[50]
EffectivenessTotal Sprint Goalsobjectives set for a sprint that align with the product goal, guiding the development team on what to focus on during the sprintInteger number[7]
Total Business Valuethe perceived worth or benefit that a project or feature delivers to the stakeholders, often guiding prioritization in agile projectsNumeric score[51]
Velocitya metric that measures the amount of work a team completes during a sprint, used to forecast future sprint capacitiesInteger number[52]
Backlog Management Index (BMI)a measure or approach to evaluate the Efficiency and Effectiveness of managing the product backlog in agile developmentPercentage[53]
Return on Investment (ROI)an evaluation of the profitability of an investment relative to its cost in agile projects, often calculated for features or projects to determine their financial valuePercentage[7]
Management Commitmentthe support and involvement of management in ensuring agile practices are implemented and sustained, crucial for the success of agile transformationsScore (1–5)[51]
EnduranceTeam Moralreflects the overall attitude, satisfaction, and motivation of the development team, crucial for sustaining productivity and quality in agile projectsScore (1–5)[52]
Customer Satisfaction Score (CSAT)a metric used to quantify the degree to which a product or service meets customer expectations, often used in agile to measure the success of iterations or releasesPercentage[54]
Team Sizenumber of individuals in a development team, with agile methodologies typically recommending small, cross-functional teams for optimal performance and collaborationInteger number[55]
Team Expertise Score (TES)while not directly identified in the literature, it generally would refer to a measure of the collective skills and competencies of the agile team membersScore (1–10)[55]
ComplexityTechnical Debtthe implied cost of additional rework caused by choosing an easy solution now instead of using a better approach that would take longerInteger number[56]
Dependenciesrelationships between tasks or stories where one cannot start or finish until another has been completed, which can impact sprint planning and execution.Integer number[57]
Time to Market (TTM)the duration it takes from a product being conceived until it is available for sale, with agile aiming to minimize TTM through iterative development and frequent releasesDays[58]
Table 3. Different artificial neural network architectures have been implemented.
HyperparameterANN 01ANN 02ANN 03ANN 04ANN 05ANN 06ANN 07ANN 08ANN 09
Number of hidden layers111222333
Number of neurons per Layer501001505010015050100150
Activation functionidentifySigmoidReluTanhSigmoidSigmoidReluTanhTanh
Number of training epochs501001505010015050100150
Learning rate value0.0010.0050.010.010.0010.0050.010.10.1
Learning rate scheduleconstantinvscalingadaptiveconstantinvscalingadaptiveconstantinvscalingadaptive
Optimization algorithmadamadamsgdsgdadamsgdlbfgslbfgslbfgs
Momentum value0.10.20.50.90.50.20.50.90.95
Table 4. Comparison of accuracy and Efficiency of different architectures.
ANN Architecture A c c u r a c y P r e c i s i o n R e c a l l F 1 S c o r e
10.890.900.910.90
20.880.890.880.87
30.870.880.880.88
40.910.900.920.91
50.930.930.940.93
60.920.920.910.90
70.900.910.900.89
80.910.910.920.92
90.890.900.890.89
Table 5. Comparing the performance of the ANN algorithm with other algorithms.
Algorithm A c c u r a c y P r e c i s i o n R e c a l l F 1 S c o r e
ANN (NAS optimized)0.930.930.940.93
XGBoost0.890.890.900.89
Random Forest0.860.860.870.86
SVM0.810.800.810.81
k-NN0.760.770.770.76
Disclaimer/Publisher’s Note: The statements, opinions and data contained in all publications are solely those of the individual author(s) and contributor(s) and not of MDPI and/or the editor(s). MDPI and/or the editor(s) disclaim responsibility for any injury to people or property resulting from any ideas, methods, instructions or products referred to in the content.

