1. Introduction
Portfolio optimization is a fundamental tool in the field of quantitative finance, enabling the efficient allocation of capital based on the risk-return trade-off and aligned with each investor’s preferences [
1]. Achieving this requires a thorough understanding of underlying economic principles at both individual and corporate levels. For individuals, this knowledge facilitates savings planning, inflation protection, and anticipation of adverse scenarios. In the corporate sphere, it supports strategic decision-making in investment, financing, and diversification. Mastering these principles enhances financial autonomy and promotes responsible decision-making, oriented toward realistic and sustainable goals.
For decades, traditional models such as Markowitz’s Modern Portfolio Theory (MPT) have served as the theoretical foundation for optimal asset allocation [
2]. Its mean-variance formulation is based on three main assumptions: (1) the existence of perfect and efficient markets with symmetric information among all agents; (2) a single investment horizon and homogeneous expectations among investors; and (3) unrestricted borrowing and lending at a risk-free rate. However, these assumptions are often unrealistic in contexts like the Spanish market, which is characterized by volatility and practical constraints. Furthermore, the Markowitz model does not account for important measures such as skewness, kurtosis, Conditional Value at Risk (CVaR), or drawdown, which limits its applicability in real-world scenarios [
3,
4].
In response to these limitations, recent developments in artificial intelligence techniques have opened new possibilities for portfolio optimization [
5]. Tools such as reinforcement learning (RL) [
6], support vector machines (SVMs), random forests (RFs), and Long Short-Term Memory (LSTM) neural networks have been explored. While these methods have shown high predictive potential (especially in time series analysis), they also present significant challenges: high data requirements, elevated computational costs, and, in many cases, limited interpretability. Moreover, their application has mainly focused on price prediction, without directly addressing the construction of investment portfolios [
7].
In this context, genetic algorithms (GAs) have emerged as a robust, flexible, and interpretable alternative for portfolio optimization. Recent advances confirm their ability to tackle real-world investment problems under uncertainty and market volatility, especially in multi-objective and constraint-rich environments. For instance, accelerated GAs have been developed to improve convergence and group detection in diversified portfolios [
8], while robust mean-variance formulations combined with GAs have proven effective across global markets under high uncertainty [
9]. Furthermore, hybrid approaches integrating evolutionary algorithms and multi-criteria decision-making mechanisms—such as Pareto-front exploitation—have demonstrated improved solution quality in complex financial settings [
10]. Their heuristic nature allows them to address nonlinear and multi-objective problems; incorporate realistic constraints such as investment limits, cardinality, or ESG (Environmental, Social, and Governance) criteria; and adapt to different risk profiles offering near-optimal solutions with manageable computational cost. ESG investing has gained significant attention in recent years due to its potential to influence capital allocation and promote sustainability goals [
11]. Recent studies have emphasized that ESG integration can lead not only to risk mitigation but also to competitive financial performance across diverse market conditions [
12]. Moreover, meta-analytical reviews confirm a generally positive relationship between ESG ratings and firm performance, although methodological differences among rating agencies remain a challenge [
13]. From a portfolio optimization perspective, ESG factors are increasingly being integrated as a third objective alongside risk and return, often using evolutionary algorithms and external archiving techniques to find efficient trade-offs [
14]. These findings highlight the relevance of GAs and other metaheuristics as suitable tools to model the inherent complexity and multidimensionality of ESG-aware investment strategies. Despite their potential, many previous studies show methodological shortcomings: the use of simulated data; absence of clearly defined training, validation, and testing phases; or limited integration of practical and ethical constraints. Consequently, there remains a gap between the theoretical performance of these models and their applicability in real-world settings.
This project addresses that very challenge through the design, analysis, and implementation of a portfolio optimization model based on genetic algorithms, focused on the Spanish financial market and using as an asset universe the companies included in the IBEX 35 index. The main goal was to build a model capable of generating efficient portfolios, adapting to diverse risk profiles, and integrating constraints specific to real markets. Ultimately, a heuristic alternative is proposed to support more personalized, informed, and sustainable financial decisions.
To that end, two configurations of simple genetic algorithms were designed, both incorporating a complex optimization function that included higher-order moments of returns (expected return, volatility, skewness, and kurtosis) [
4]. In addition, an ESG-constrained variant was implemented to reflect the preferences of socially responsible investors in the second model (SGA-COF-ESG).
The models were validated using real market data from the companies that make up the IBEX 35 index segmenting the historical dataset into three time phases: training (2017–2022), validation (2022–2023), and testing (2023–2025). This structure allowed for proper model calibration, hyperparameter tuning, and performance evaluation through backtesting on unseen data.
During the analysis, advanced evaluation metrics were employed, including average daily return, volatility, 5% CVaR, maximum drawdown, semivariance, and cumulative return [
3]. These measures enabled an objective comparison of the various genetic configurations against a naïve reference strategy. As will be shown in the results, the proposed model outperformed this benchmark in terms of risk-adjusted return, while maintaining adequate diversification and stability over time.
The main contributions of this work can be summarized in three aspects: (i) the design of modular, interpretable, and adaptable SGAs; (ii) the flexible integration of ESG criteria as an ethical constraint, without negatively affecting the model’s efficiency; and (iii) empirical validation on real data from the Spanish market, structured across differentiated temporal phases. Altogether, these contributions position the model as a viable and replicable alternative to both classical approaches and data-intensive predictive solutions-particularly appealing to investors who value personalization, sustainability, and transparency in their financial decisions.
2. Related Work
This section presents a comprehensive review of the theoretical and methodological background in the field of investment portfolio optimization, analyzing both classical models and modern techniques based on artificial intelligence. The objective is to identify existing research gaps and to position the contribution of this project within the academic context. Economics [
15], as the science that studies the management of scarce resources, provides the fundamental framework for understanding investment decisions. At the individual, corporate, and governmental levels, economic knowledge is essential for rational planning, risk mitigation, and informed decision-making [
16]. Within this framework, portfolio management is a key discipline that seeks to maximize risk-adjusted returns through the optimal selection and combination of financial assets. It is crucial to understand basic concepts such as financial assets (equity and fixed income) and liabilities, as well as stock market indices that serve as market benchmarks. For example, the IBEX 35 is the benchmark index of the Spanish market and has been a recurrent universe of analysis in portfolio theory studies [
17].
2.1. Investment Portfolio Management
An investment portfolio, as defined in [
18], is “A combination of individual assets or securities (including stocks, bonds, etc.) such that a combination of securities is almost always less risky than any individual security.” In this context, portfolio management becomes a fundamental task, aiming to maximize expected return for an acceptable level of risk or, alternatively, to minimize risk to achieve a target return. Various optimization methods have been developed to this end and are presented below.
Based on their risk tolerance, investors can be classified into four main profiles, as proposed by Bernstein [
19]: conservative, moderate, growth-oriented, and aggressive. Each of these profiles prioritizes differently between capital preservation and return generation, directly influencing the optimal construction and management of investment portfolios. Conservative investors prioritize stability and accept limited returns, whereas aggressive investors seek higher profits by assuming greater exposure to risk. This segmentation is essential when designing strategies tailored to each profile. In this context, it is also relevant to incorporate the ethical investor [
20], whose presence has been scarcely addressed in the technical literature but is explicitly considered in the present study.
2.1.1. Classical Methods
Portfolio management has long been a key challenge in finance. A major breakthrough came with Markowitz’s Portfolio Selection (1952), which laid the groundwork for Modern Portfolio Theory (MPT) [
2].
At its core is the mean-variance model, where expected return and risk (variance) guide asset allocation [
21]. Using quadratic programming, this model identifies optimal portfolios through diversification, giving rise to the efficient frontier [
22]. To simplify computations, Sharpe introduced the single-index model (1963), reducing the need for full covariance matrices [
23].
This led to the Capital Asset Pricing Model (CAPM) [
16], which integrates investor rationality, market efficiency, and a risk-free asset. CAPM’s key contribution is the Capital Market Line (CML), offering a unique optimal portfolio for all investors.
Yet, classical models are sensitive to parameter estimation errors. Robust optimization methods, like covariance shrinkage [
18] and models like Black–Litterman (1992) [
24], which blend CAPM with subjective views using Bayesian techniques, were developed to improve stability.
Behavioral approaches, such as Behavioral Portfolio Theory (BPT) [
25], incorporate psychological biases like loss aversion. Other dynamic models include the Kelly Criterion [
26], maximizing capital growth with logarithmic utility, and Universal Portfolio Theory [
27], which adapts weights without assuming return distributions. Risk Parity [
28], meanwhile, focuses on equalizing risk contributions rather than maximizing return.
2.1.2. Modern Methods
In recent years, artificial intelligence (AI) has transformed portfolio optimization by overcoming the limitations of classical models such as Markowitz and CAPM. Among the most influential techniques are machine learning (ML) algorithms, which enable the detection of complex patterns, dynamic market adaptation, and the processing of large volumes of financial data. This section reviews four representative approaches: SVM, random forests, LSTM, and reinforcement learning.
Support vector machines (SVMs), originally designed for classification tasks, have been widely applied to the financial domain. In investment contexts, they are used for asset selection, market entry, and exit signal detection, and return estimation through their regression variant (SVR). Their ability to operate with nonlinear kernels such as RBF allows them to identify hidden relationships among financial variables, adding value in environments with nonlinear structures [
7]. Huang [
29] reported a 57% accuracy in stock index prediction using SVMs, outperforming traditional models like ARIMA. Furthermore, Liang [
30] and Ashraf Faheem [
7] showed that SVMs enhance the efficiency of subsequent models by filtering out erratic assets. However, they exhibit computational limitations and require manual hyperparameter tuning (e.g., C or ε) [
7].
Random forest algorithms, on the other hand, have proven to be particularly robust to market noise and effective in tasks such as price prediction or asset classification. Their ability to mitigate overfitting by assembling multiple weak learners grants them high reliability [
7]. They are especially effective in multi-asset portfolios, although their low interpretability may pose a barrier in regulated environments such as MiFID II [
31]. Research by Y. Ma, R. Han, and W. Wang has shown their capability to form asset clusters with more stable correlations, thus enhancing diversification. Nonetheless, their performance tends to decline when handling complex time series, where models like LSTM or GRU present clear advantages [
32].
Recurrent Neural Networks (RNNs), particularly advanced variants such as LSTM and GRU, have demonstrated strong potential in financial time series prediction. LSTMs are notable for their ability to capture long-term dependencies, such as economic cycles, through their memory mechanisms. Recent studies report MSE errors as low as 0.00116, outperforming models like ARIMA, and in Liang’s work [
30], LSTMs achieved the highest annualized performance among all the models analyzed. However, they require large volumes of data and careful calibration to avoid overfitting, and their use is primarily limited to prediction rather than portfolio construction. Moreover, LSTM-based predictions are highly sensitive to noise and regime shifts, often resulting in unreliable portfolio allocations when used as inputs for optimization algorithms. The integration of LSTM models also entails a significant increase in computational cost without a proportional improvement in risk-adjusted returns, and their black-box nature complicates auditability and transparency in portfolio construction: an important concern for institutional investors [
33,
34]. GRU models offer performance comparable to LSTMs with lower computational overhead, making them attractive for real-time applications.
Finally, reinforcement learning (RL) represents an innovative paradigm in portfolio optimization. Unlike supervised models, RL enables an agent to learn asset allocation strategies through direct interaction with the environment, optimizing reward functions such as the Sharpe ratio [
7]. By framing the task as a sequential decision-making problem, the agent improves its policy over time. Studies have demonstrated its high adaptability to changing environments and resilience to abrupt losses. Nevertheless, it presents significant technical challenges, including high computational cost, complexity in designing the training environment, and difficulty in defining suitable reward functions without inducing undesirable behaviors (reward hacking). Despite these challenges, RL is at the forefront of research in computational finance [
35].
While LSTM models are effective for forecasting asset prices, their predictive outputs do not directly translate into optimal portfolio weights, especially when combined with evolutionary algorithms such as GAs.
2.2. Genetic Algorithm: Fundamentals and Applications
Genetic algorithms (GAs) are optimization methods inspired by the principles of biological evolution, such as natural selection, sexual reproduction, and survival of the fittest [
36]. They operate on a population of solutions (chromosomes), which evolve iteratively through genetic operators without explicit memory of previous generations. Their ability to tackle complex and multimodal search spaces, as well as their ease of hybridization, makes them particularly attractive compared to deterministic approaches.
Each candidate solution, or individual, is internally represented as a genotype (chromosome) composed of genes that take values known as alleles. Its observable manifestation, or phenotype, is obtained via an interpretation function and evaluated through a fitness function, which assesses the quality of the solution according to the problem’s objectives [
36]. This separation between representation and evaluation facilitates the modular and adaptable design of the algorithm.
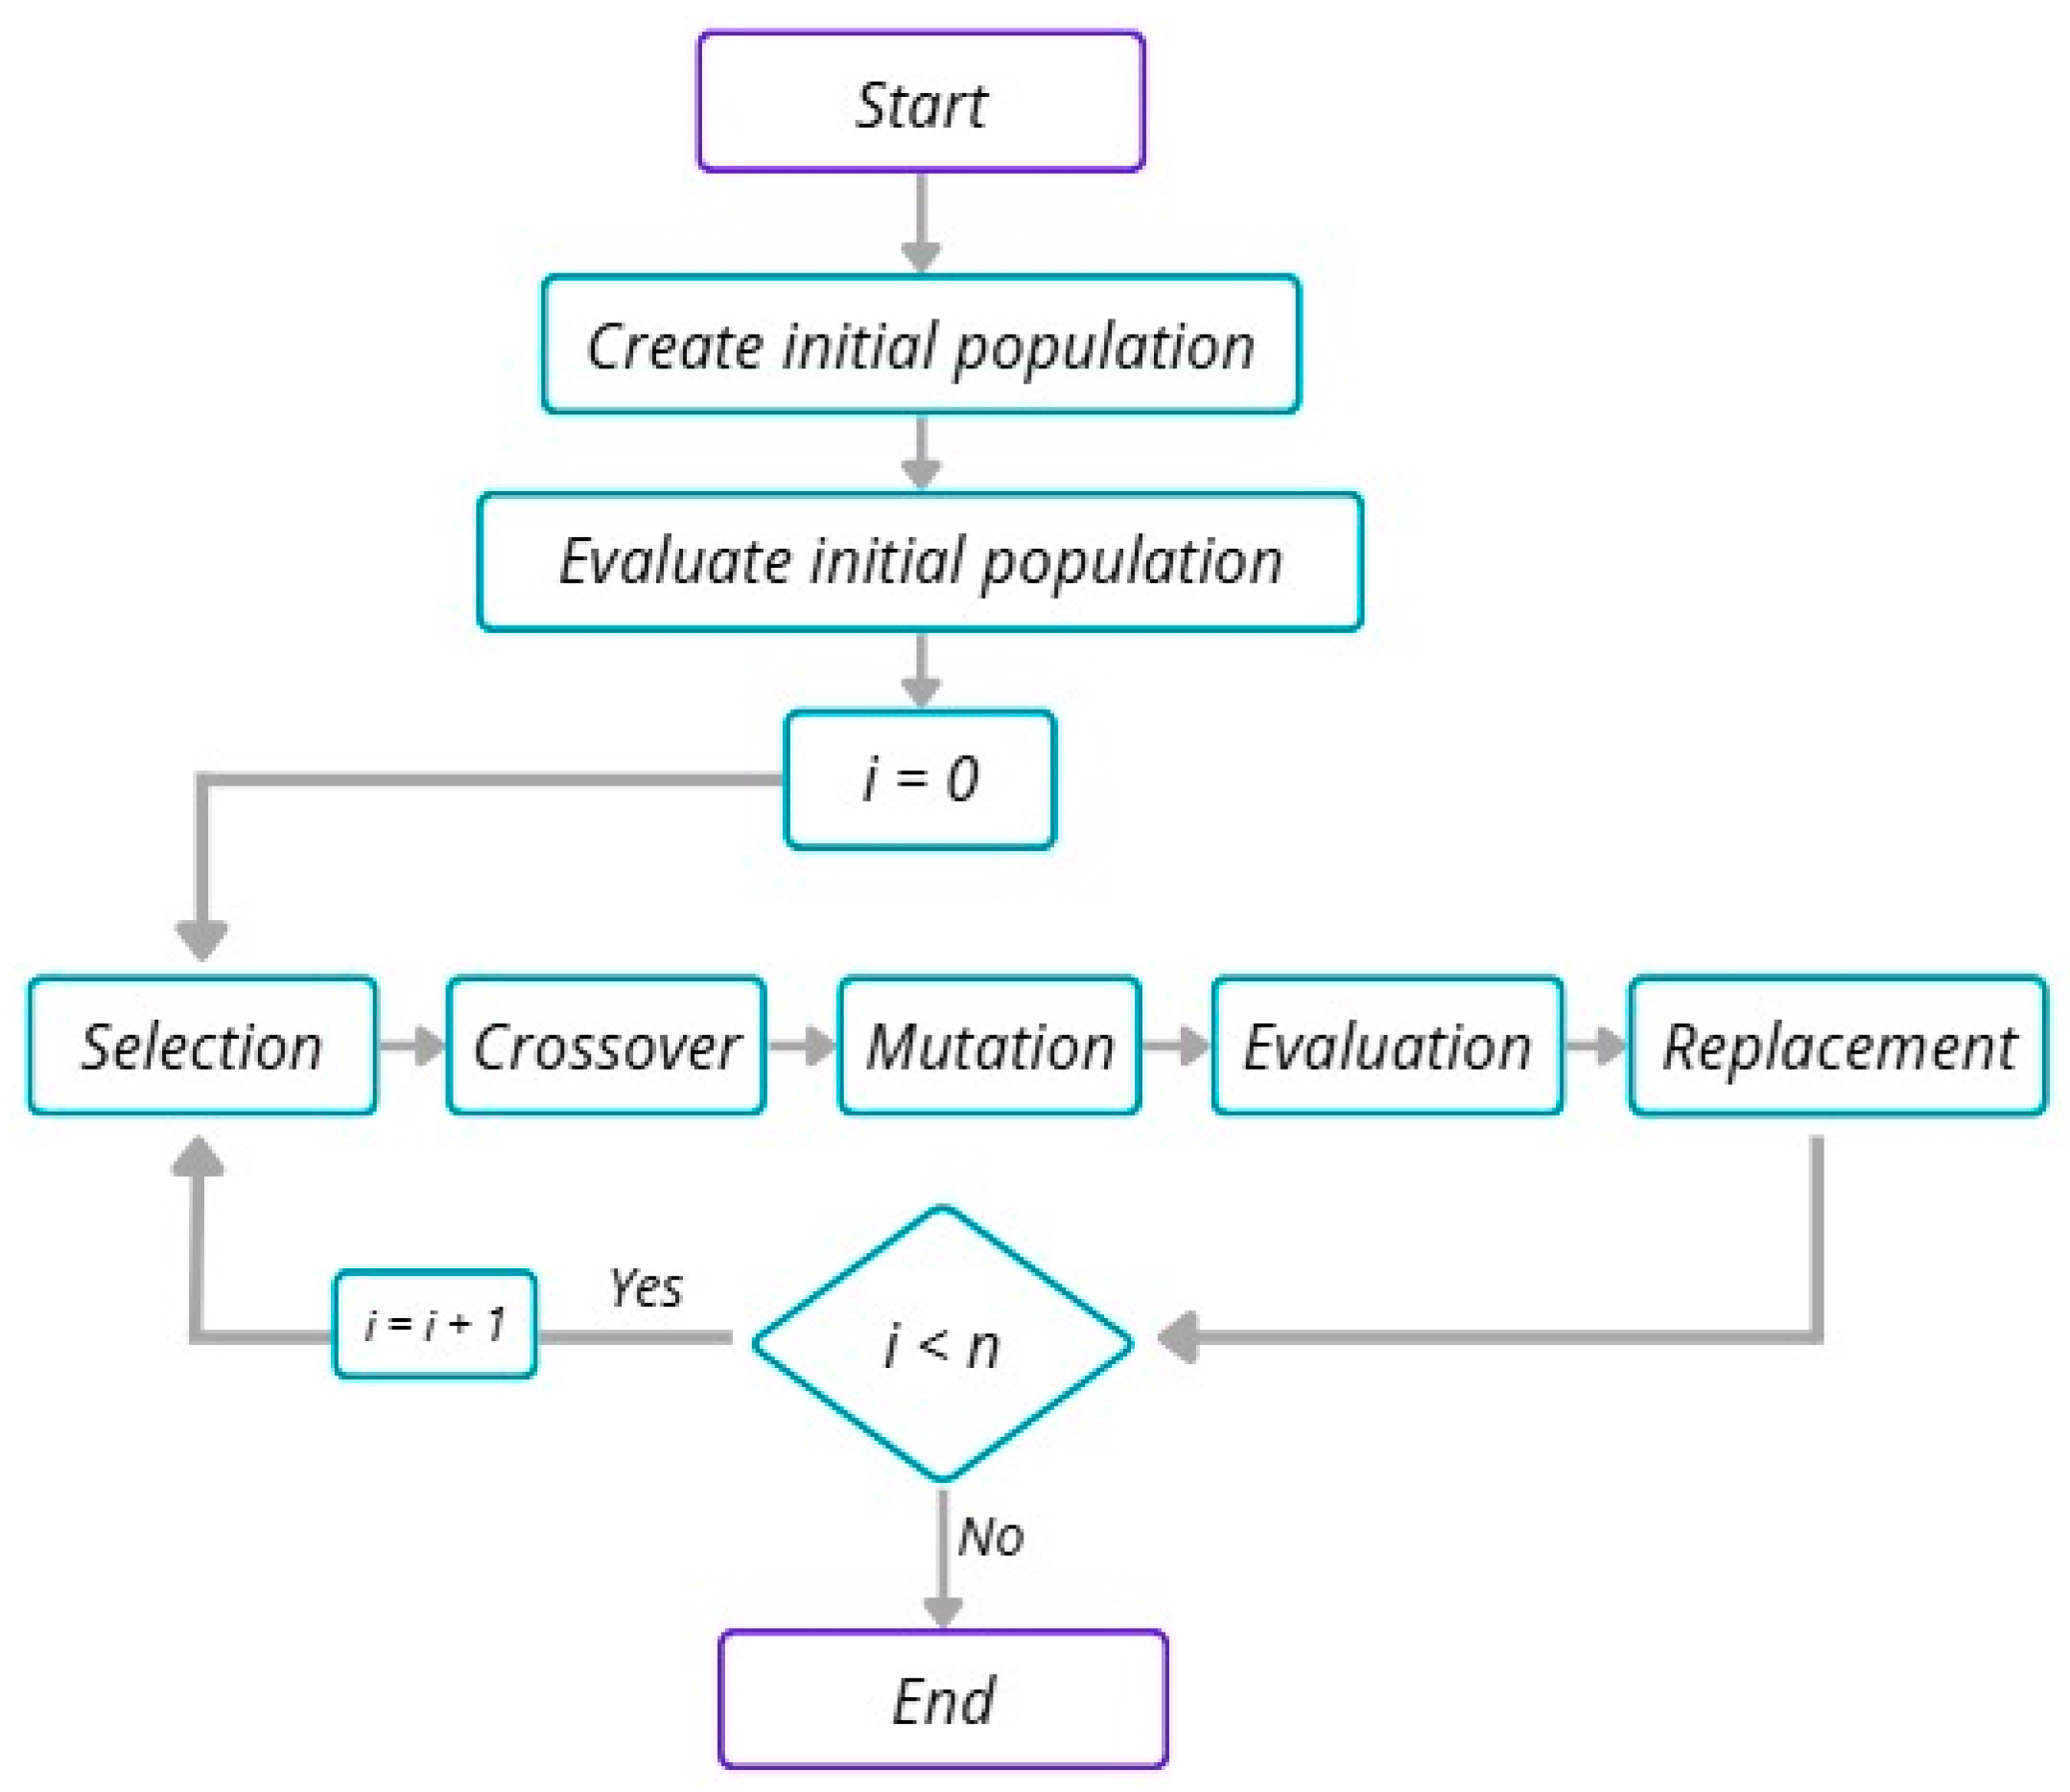
The evolutionary cycle of a GA includes several phases [
37]: (1) random initialization of the population; (2) evaluation of each individual using the fitness function; (3) stochastic selection based on fitness to preserve diversity; (4) reproduction, which includes crossover (genetic recombination) and mutation (random perturbations to maintain diversity); and (5) replacement to generate a new population. This process repeats until a stopping criterion is met, such as stable convergence, a quality threshold, or a computational limit.
Figure 1 shows the scheme of a GA with its different phases.
In multi-objective contexts (MOGAs), the algorithm’s structure is preserved but adjustments are made in the selection and evaluation mechanisms to account for aspects such as Pareto dominance and diversity preservation in the face of potentially conflicting objectives [
38]. However, caution is required when multiple objectives are involved. Attempting to optimize four metrics simultaneously without prioritization mechanisms leads to the problem of the Pareto front dimensionality curse [
38]. In contrast, focusing solely on return and risk may fail to capture the full complexity of the portfolio optimization problem.
GAs may present limitations: premature convergence (loss of diversity), inefficient exploitation (low intensification), or dependency on hyperparameter tuning. Their performance is also constrained by the computational cost of the fitness function. Thus, achieving an appropriate balance between exploration and exploitation, as well as having domain-specific expertise, is essential [
36]. Despite these challenges, GAs exhibit implicit parallelism by evaluating multiple solutions simultaneously and exploring different regions of the search space.
Genetic algorithms (GAs), popularized by Holland in the 1970s, stand out for their ability to explore complex search spaces without requiring derivatives, making them useful in nonlinear or constraint-laden financial contexts. In portfolio optimization, applications range from simple to sophisticated variants.
Single-objective genetic algorithms (SGAs) allow for the optimization of composite functions such as return and risk. For example, in [
39], an SGA was applied to a mean-variance model for the LQ45 index, yielding better results than the Lagrange multiplier method.
For more realistic contexts, Multi-Objective Genetic Algorithms (MOGAs) allow the simultaneous optimization of risk and return. In [
40], metrics such as variance, VaR, and CVaR are used alongside Monte Carlo simulations to build Pareto fronts tailored to investor profiles. In [
41], the NSGA-II is extended to tackle mixed-integer problems, incorporating cardinality constraints or asset dependencies and compared against models such as MOEAAWAWL and CCS/MOEAS, with the latter yielding better results, though without validation on real data.
Models like EvoFolio [
42] introduce dynamic re-optimization and investor interaction, achieving more diversified portfolios applied to real markets (NYSE, NASDAQ, and Borsa Italiana). However, the analysis is limited to using a single dataset. Similarly, algorithms such as DTDPMOEA and DTDP-EAMO [
43] incorporate dual time scales for short- and long-term objectives, improving convergence compared to models like MOEA/D_AWA or LMOCSO, albeit at higher computational costs. The SEAMS approach [
44], meanwhile, reduces this cost using surrogate models, although its validation remains confined to simulated environments.
Finally, hybrid approaches with AI techniques have been developed. In [
45], an SGA is combined with BERT to adjust portfolio weights based on Twitter sentiment, improving the information ratio by 17%. Similarly, in [
46], integration with LSTM networks enables return forecasting, although the high sensitivity to hyperparameters limits its direct applicability.
3. Materials and Methods
This chapter describes the data sources, preprocessing steps, and experimental setup used to train and evaluate the portfolio optimization models (SGA-COF-1 and SGA-COF-ESG). It includes a detailed explanation of the dataset construction, performance metrics, and the configuration of the genetic algorithms applied.
3.1. Analysis of IBEX 35 Data and Dataset Construction
Historical data from the IBEX 35 index were collected using the yfinance Python yfinance 0.2.63 library for training and evaluating the portfolio optimization model. Daily closing prices, representing market value adjusted for dividends and stock splits, were obtained for a filtered set of companies with complete records from 2017 to 2025, ensuring data transparency and reproducibility. Although the IBEX 35 comprises 35 companies, only 33 were analyzed. Meliá Hotels International was excluded due to its index exit during the study period and replacement by Puig. Puig Brands, which joined the IBEX 35 and the Madrid Stock Exchange in 2024, lacked a sufficient historical record for reliable statistical metric computation. Acciona Energía, listed in 2021, also had an insufficient trading history; however, its market exposure was indirectly considered through its parent company, Acciona.
While the dataset included several columns, only the Close column (closing price) [
47] was used, as it is essential for computing return, volatility, skewness, and kurtosis. After reviewing the integrity of the time series, all data were found to be complete except for one date (20 September 2018) which was corrected using a centered moving average with a window of three. The analysis period was divided into three phases:
Training period: 1 July 2017–1 July 2022;
Validation period: 2 July 2022–26 April 2023;
Test period (final evaluation): 27 April 2023–26 April 2025.
This division allowed for the tuning of hyperparameters without compromising the final evaluation of the model. Daily returns were calculated from these prices. These returns were subsequently used to construct the covariance matrix and the vectors of return, skewness [
48], and kurtosis [
49] employed in the objective function.
3.2. Simple Genetic Algorithm
This section describes the configuration and application of a simple genetic algorithm for a portfolio optimization problem. The algorithm adheres to the standard evolutionary framework, comprising initialization, evaluation, selection, crossover, and mutation steps. Its simplicity facilitates a clear analysis of the fitness landscape and serves as a baseline for future enhancements.
3.2.1. Initialization
An initial population of 660 individuals was randomly generated, each representing a potential portfolio optimization solution. Every individual consisted of a list of 33 genes, corresponding to each IBEX 35 asset, with positive integer or decimal values indicating the relative investment intensity in each stock. This encoding defined the individual’s position in the search space and efficiently stored its fitness value.
The population size was set to 660 individuals (33 assets multiplied by a factor of 20). This size increase did not incur significant computational costs and fostered greater genetic diversity within the population.
3.2.2. Evaluation
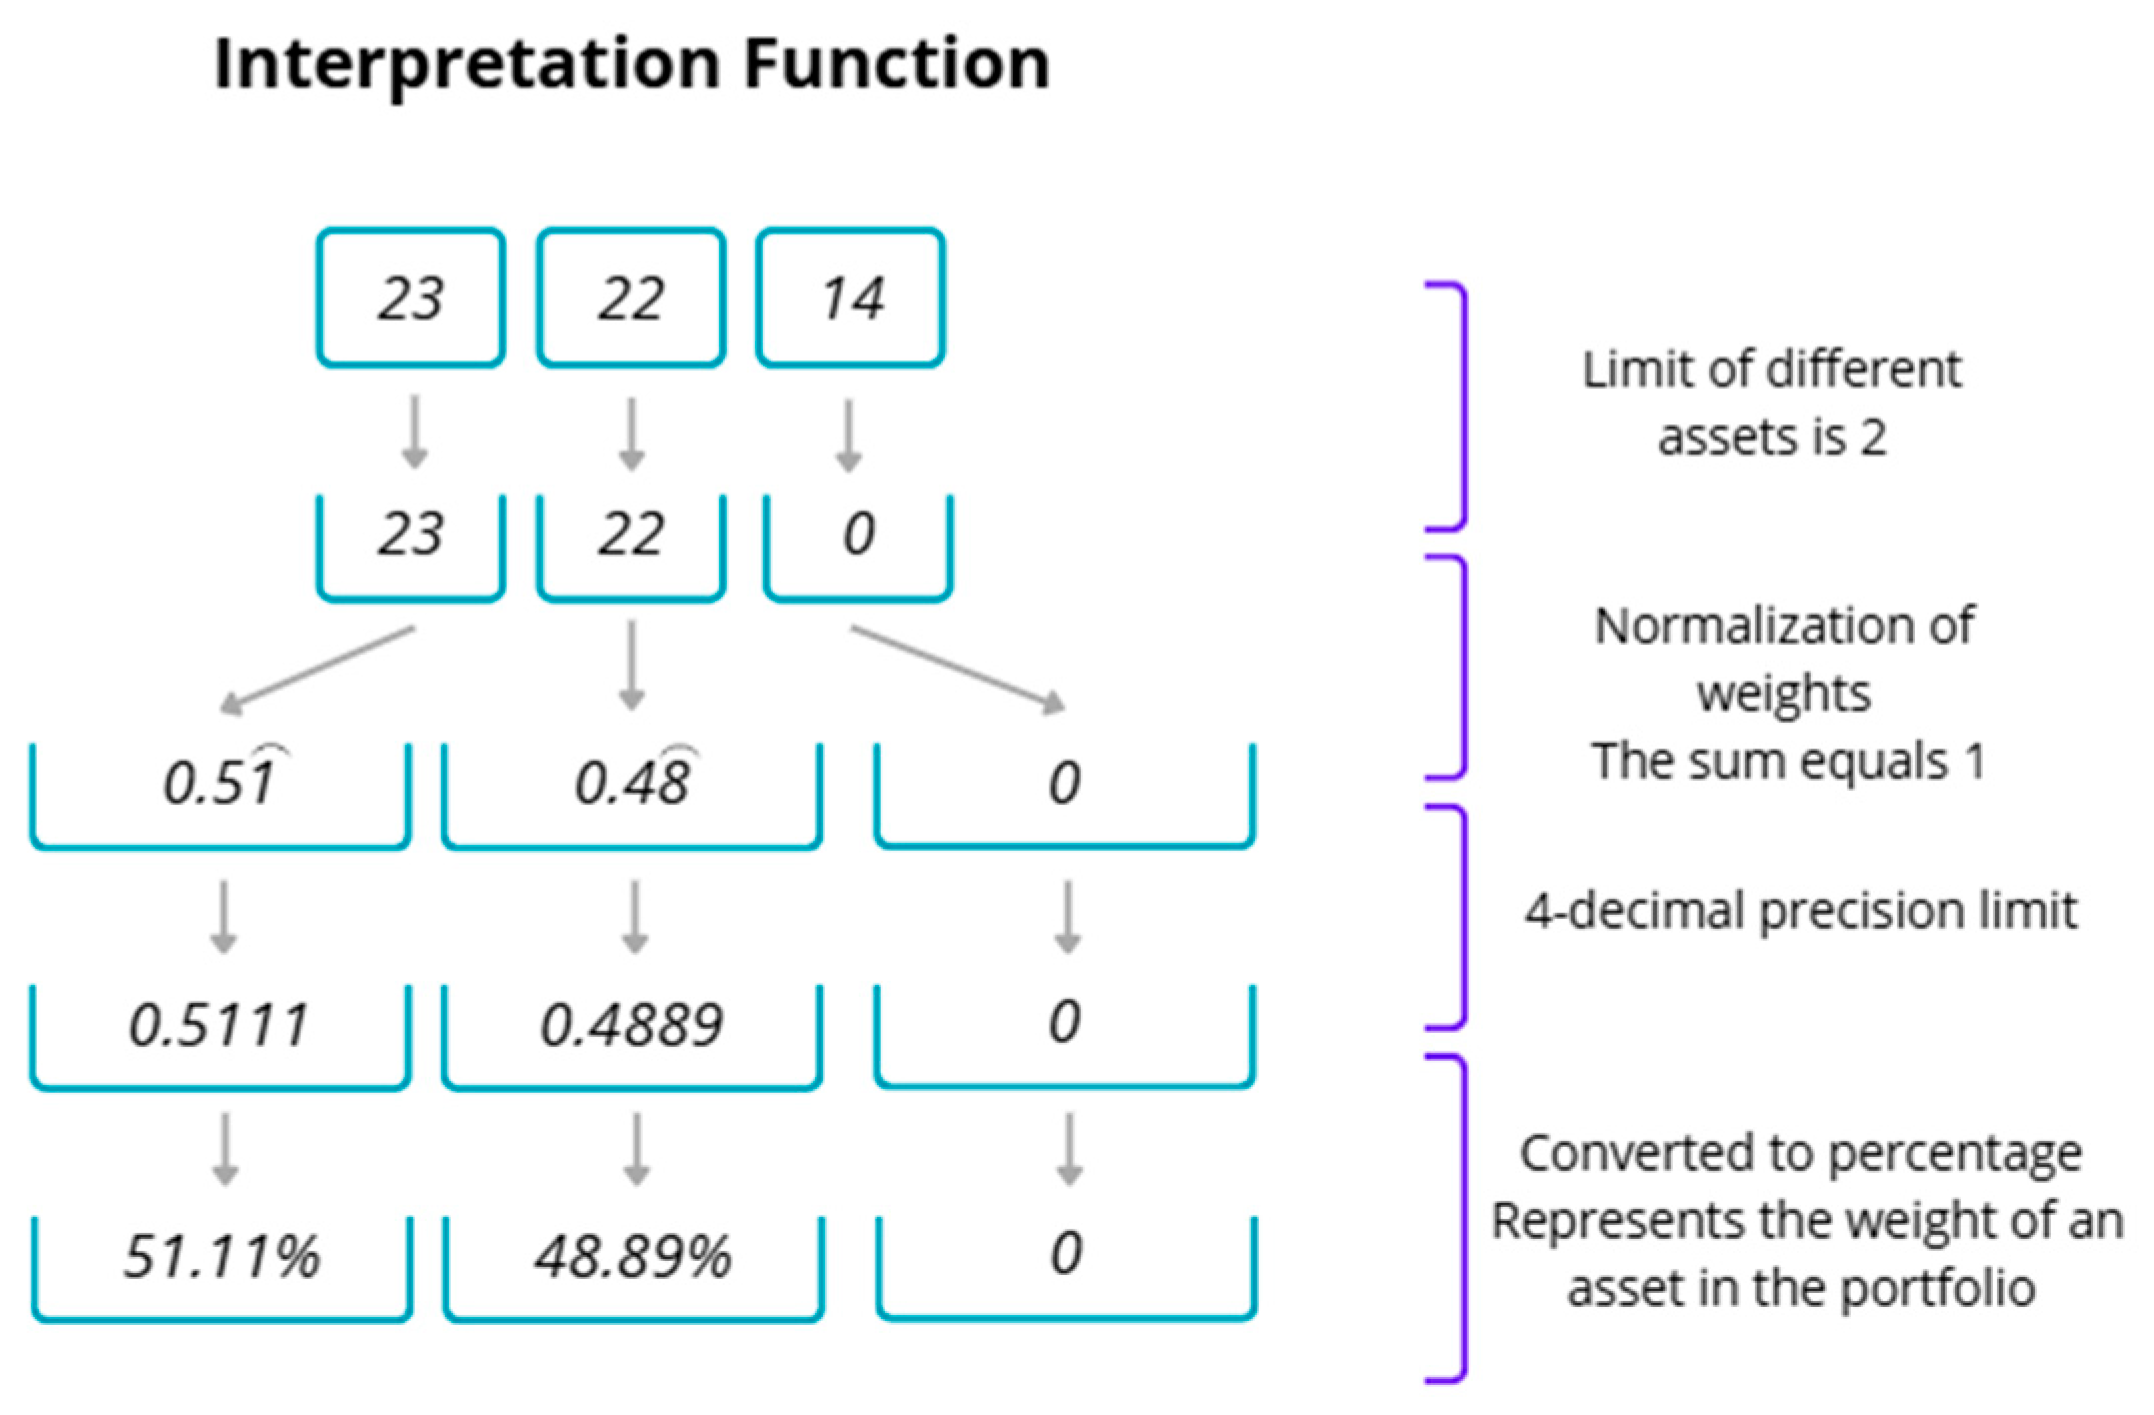
Each individual underwent a two-stage evaluation: first, genotype interpretation into a phenotype; second, objective function application to the phenotype to calculate its fitness. A custom interpretation function was developed (See
Figure 2). The fitness function was designed to evaluate the quality of each candidate portfolio by integrating expected return, volatility, skewness, and kurtosis of returns. To ensure that the weights assigned to these criteria (return, volatility, skewness, and kurtosis) were not arbitrary and to maximize the model’s robustness and performance, a rigorous hyperparameter calibration process was conducted. During this phase, various weight combinations were tested iteratively, systematically assessing their impact on key performance and risk-adjusted metrics of the resulting portfolios. This iterative procedure enabled the identification of the optimal configuration that best balanced the desired financial objectives under different market conditions, providing empirical justification for the final values adopted.
Individual chromosomes contained values indicating relative investment priority, not final portfolio weights, representing the proportion of capital allocated to each asset while satisfying feasibility constraints.
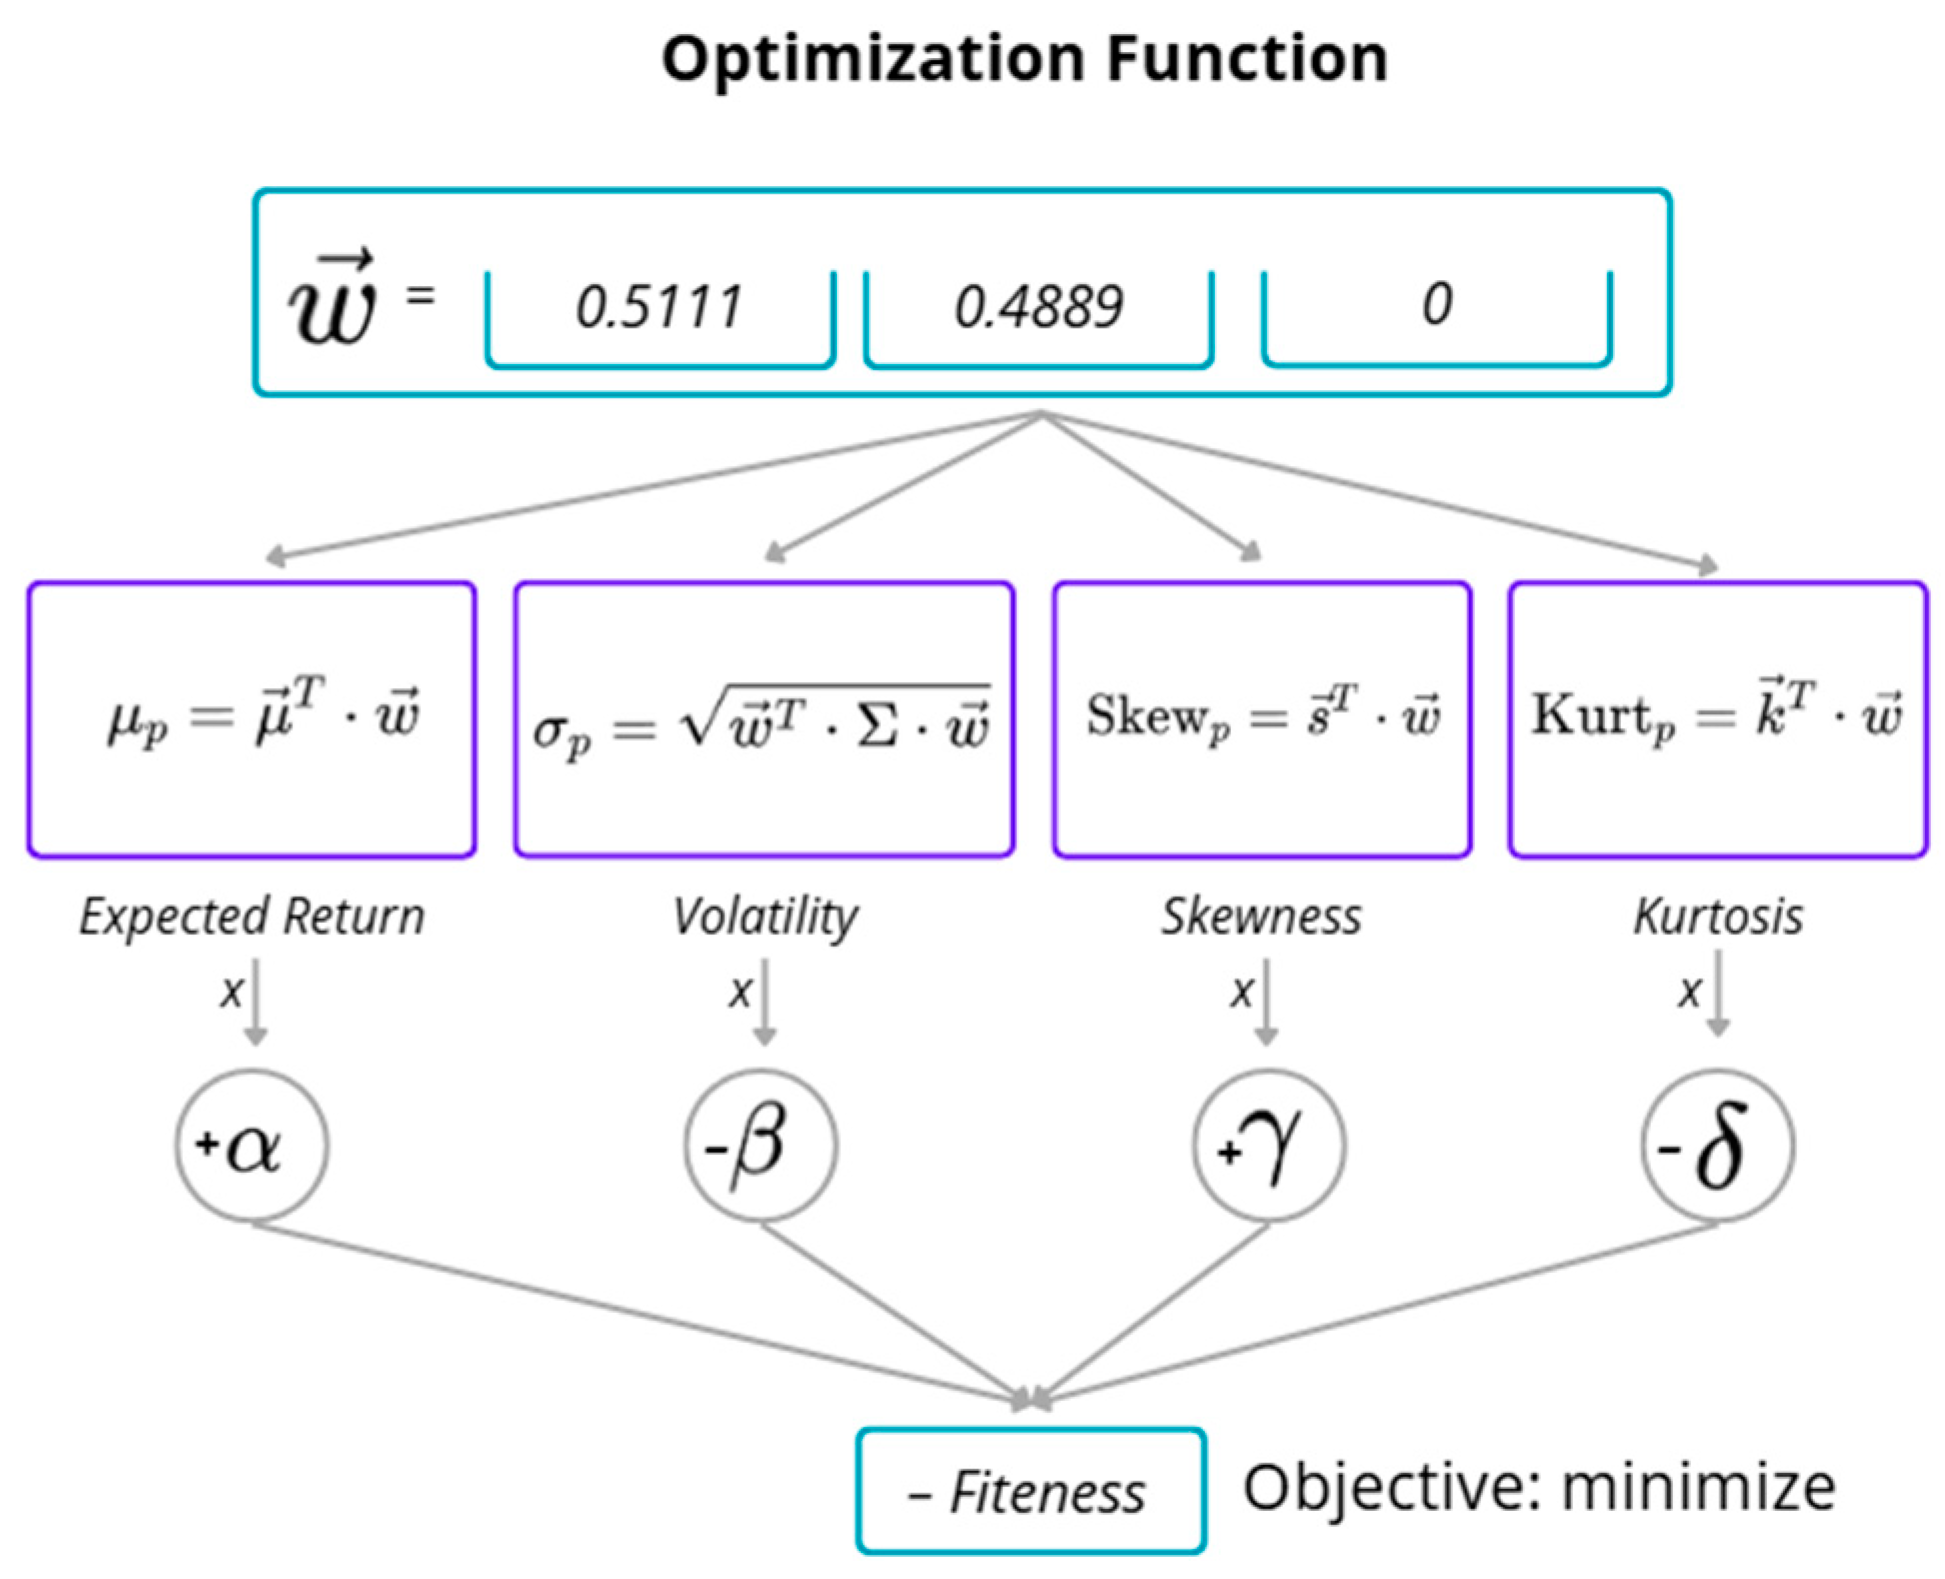
Subsequently, the objective function assigned a numerical value to each portfolio based on its expected return (0.6), volatility (0.3), skewness (0.2), and kurtosis (0.1). These weights reflect the relative importance of each metric in the optimization process (see
Figure 3 for a visual example):
The aim was to maximize expected return and positive skewness while minimizing volatility and kurtosis—thereby capturing both the performance and relevant statistical properties of asset returns. This formulation prioritized portfolios with reduced exposure to extreme events and a higher likelihood of achieving substantial gains.
Several constraints were applied to ensure the validity of the solutions:
Upper bound on gene values to avoid extreme differences between genes (moderate penalty of 99 in fitness if violated).
Limit on the number of assets per portfolio and decimal adjustment of weights, handled during the genotype-to-phenotype conversion. This was implemented through individual reconstruction.
Maximum investment per asset (e.g., 30% or 50%), strictly enforced with a severe penalty (fitness = 9999) if violated.
An ESG constraint was introduced to promote responsible investment. A bonus was applied when investing in ESG leaders from the IBEX ESG top 5 [
15] (Santander, Iberdrola, Inditex, BBVA, and CaixaBank). If a non-zero weight was assigned to any of these companies, 0.02 was subtracted from the fitness value, since the objective was minimization. This incentive encouraged (but did not impose) the selection of sustainable assets. Thereby creating the SGA-COF-ESG model.
3.2.3. Genetic Algorithm Iteration
Selection: Tournament selection was applied. Groups of three individuals were randomly drawn (with replacement), and the one with the lowest fitness was selected. This process was repeated until the required number of parents (between 100 and 150 individuals) was obtained to form the new population using the eaSimple operator.
Crossover: The Blend Crossover operator (BLX-α) was used. It generates offspring by creating linear combinations between corresponding genes from both parents. This technique allows the exploration of a broader space than that defined strictly by the parents.
Mutation: Mutation involved replacing one or more genes with random values within a permissible range. Uniform mutation was employed, where each gene had a probability of being modified if a randomly assigned value exceeded a threshold (indpb), always respecting the problem’s constraints.
Replacement: Full generational replacement was used: the entire population was substituted in each iteration. In addition, a Hall of Fame (HOF) structure was implemented to record the best individuals found throughout any generation. This archive did not interfere directly with the evolutionary process but enabled subsequent analysis.
3.3. Hyperparameter Tuning
To select the optimal hyperparameters, a validation process was conducted. The aim was to identify the configurations yielding the best performance during the validation period and demonstrating stable convergence throughout training. Over 600 different parameter combinations were evaluated, ensuring a broad exploration of the design space. Validation used data from 2 July 2022, to 26 April 2023, with training and test sets strictly separated to avoid overfitting. The tuned parameters were as follows:
CXPB (crossover probability): 0.1 to 0.9;
MUTPB (mutation probability): 0.1 to 0.9;
indpb (per-gene mutation probability): 0.05 and 0.15.
The models selected were SGA-COF-1 and SGA-COF-ESG, whose configurations are shown in
Table 1.
Both models employed a high crossover rate, which favored effective recombination among individuals, and a controlled mutation rate that introduced variability without degrading the quality of solutions. The low per-gene mutation probability allowed precise adjustments without destabilizing the evolutionary process.
3.4. Execution Environment
The genetic algorithms were developed in Python 3.10 in a local environment, using an HP Pavilion Laptop 16-af0xxx running 64-bit Windows 11 Home (24H2). The system is equipped with an Intel Core Ultra 7 155U processor at 1.70 GHz, 16 GB of RAM, and a 954 GB SSD drive, with 154 GB in use during the tests. The integrated graphics card is an Intel Graphics with 128 MB of allocated memory.
Various specialized libraries were employed, chosen for their robustness and adaptability to the problem addressed. Specifically, DEAP 1.4.3 (Distributed Evolutionary Algorithms in Python) was the core tool for implementing SGAs. This library allows for the modular and efficient construction of evolutionary algorithms. It was used to define the individual structures (investment vectors), configure genetic operators (crossover, mutation, and selection), execute the full evolutionary cycle, and manage statistics and elite solutions. Its compatibility with the NSGA-II approach was key for correctly implementing multi-objective algorithms and generating Pareto fronts.
The yfinance 0.2.59 library was used for the automatic download of historical IBEX 35 data directly from Yahoo Finance. For data processing, NumPy 2.0.2 and Pandas 2.2.2 libraries were employed, while Matplotlib 3.10.0 was used for visualization of the results.
3.5. Experimentation and Evaluation
To verify the results obtained and the fulfillment of the specific objectives of this research, a comprehensive evaluation was designed encompassing both the financial performance of the generated portfolios and the stability, efficiency, and robustness of the proposed genetic algorithm. To this end, three complementary validation approaches were employed: backtesting, convergence analysis, and comparison with benchmarks.
3.5.1. Backtesting Validation
The retrospective validation consisted of applying the model over a historical period not used during training, in order to assess its generalization capability under unseen market conditions. Portfolios were optimized using training period data and evaluated over a subsequent period. Standard financial metrics were used to analyze portfolio efficiency and risk:
3.5.2. Stability and Convergence Analysis
To ensure the consistency of the algorithm and avoid results driven by chance or specific configurations, a convergence and stability analysis was performed. This consisted of running the algorithm multiple times with the same configuration, observing the following:
The number of generations required to converge.
The variability of results across runs.
The persistence of key assets in the final portfolios.
Additionally, a sensitivity analysis was conducted by modifying various hyperparameters, such as population size, mutation rates (MUTPB), crossover rates (CXPB), individual mutation probability (indpb), and the type of selection operator.
3.5.3. Comparison with Benchmark Models
The performance of the optimized portfolios was compared against a naïve strategy that assigns an equal proportion of capital to each asset. This strategy served as a basic benchmark to analyze whether the genetic algorithms provide a significant improvement over a passive and well-diversified solution. For the multi-objective algorithms, the obtained Pareto front was also analyzed, evaluating its shape and the distribution of efficient solutions. This allowed an assessment of the evolutionary approach’s ability to offer portfolios adapted to different risk profiles, providing a set of optimal solutions according to varying levels of risk aversion.
The results obtained from these three validation approaches are presented below, with the aim of empirically analyzing the performance, stability, and comparative capability of the proposed model against benchmark strategies.
4. Results and Analysis
This section presents the results obtained from applying different genetic algorithms to the portfolio optimization problem on the IBEX 35. It is structured into two main blocks: firstly, a backtesting validation of the generated portfolios is carried out, comparing their performance against a reference (naïve) model in terms of return, risk, and out-of-sample behavior (
Table A1 in
Appendix A shows the weights and companies in each portfolio generated by the two GAs using the training data). Secondly, the convergence and stability of the employed algorithms are analyzed, observing their generational evolution and their ability to consistently find optimal solutions. Through this dual approach, the aim is not only to measure the final quality of the obtained portfolios but also to understand the efficiency, robustness, and internal behavior of the evolutionary processes employed.
4.1. Backtesting Validation and Comparison with Benchmark Models
The comparison of the three analyzed portfolios, summarized in
Table 2, shows notable differences in terms of return and risk. Regarding average daily return, both algorithm versions outperformed the naïve strategy. The highest value corresponded to SGA-COF-ESG (0.00100), while naïve achieved the lowest (0.00079).
Regarding daily volatility, the naïve strategy presented the lowest (0.00902), indicating a lower overall return variability. However, when isolating negative variability through semivariance, it was also lower for naïve, whereas SGA-COF-1 reached the highest value (0.00006482), reflecting greater exposure to downside risk.
In terms of cumulative performance, SGA-COF-1 obtained the highest value (1.22740), followed by SGA-COF-ESG, and finally the naïve strategy. Nonetheless, this growth improvement was associated with a higher risk of maximum losses. The most pronounced drawdown was observed in SGA-COF-1 (−0.17011), while naïve showed the smallest (−0.12839).
Finally, when analyzing extreme risk through the daily 5% CVaR, the naïve strategy exhibited the lowest expected loss in worst-case scenarios (−0.02021) compared to more adverse values recorded by SGA-COF-1 and SGA-COF-ESG.
4.2. Stability and Convergence Analysis
Once the genetic algorithm is implemented, it is essential to analyze its behavior throughout the generations. This section evaluates the evolution of fitness values (minimum and average), aiming to verify the progression of the evolutionary process and detect possible premature stagnations.
The convergence study allows for assessing the algorithm’s stability and efficiency, as well as identifying opportunities for improvement in its configuration. The convergence rate is also analyzed: rapid stabilization may reflect efficiency or risk of falling into local optima, while slower convergence may favor greater exploration of the solution space at the expense of increased computational time. Evaluating this balance is key to adapting the algorithm to the problem’s objectives and environmental constraints.
4.2.1. Algorithms with Rapid Convergence
Figure 4 shows the evolution of the minimum fitness value during the first 15 generations for the SGA-COF-1 model. A clear downward trend is observed, with a rapid improvement in fitness during the initial generations. Between generation 0 and generation 3, the minimum fitness value decreases significantly, indicating the effective exploration of the solution space in the early stages. From that point onward, improvements continue more gradually, stabilizing around generation 13. The minimum fitness reaches a threshold close to 0.66, suggesting convergence toward an optimal or near-optimal solution.
The fact that the best individual is selected through a final evaluation function (Hall of Fame), which considers all generations and populations, reinforces this conclusion. The evolutionary process was, therefore, stopped at generation 15, as later generations did not contribute further improvements and only increased computational cost. The stability of the algorithm was enhanced by using a fixed seed and a temporal validation strategy with one year of data, which enabled the selection of appropriate hyperparameters. An exploration-oriented configuration was used in the SGA-COF-1 model (crossover probability = 0.5, mutation probability = 0.4), which proved effective in promoting diversity without compromising the quality of the solutions obtained.
4.2.2. Algorithms with Slow Convergence
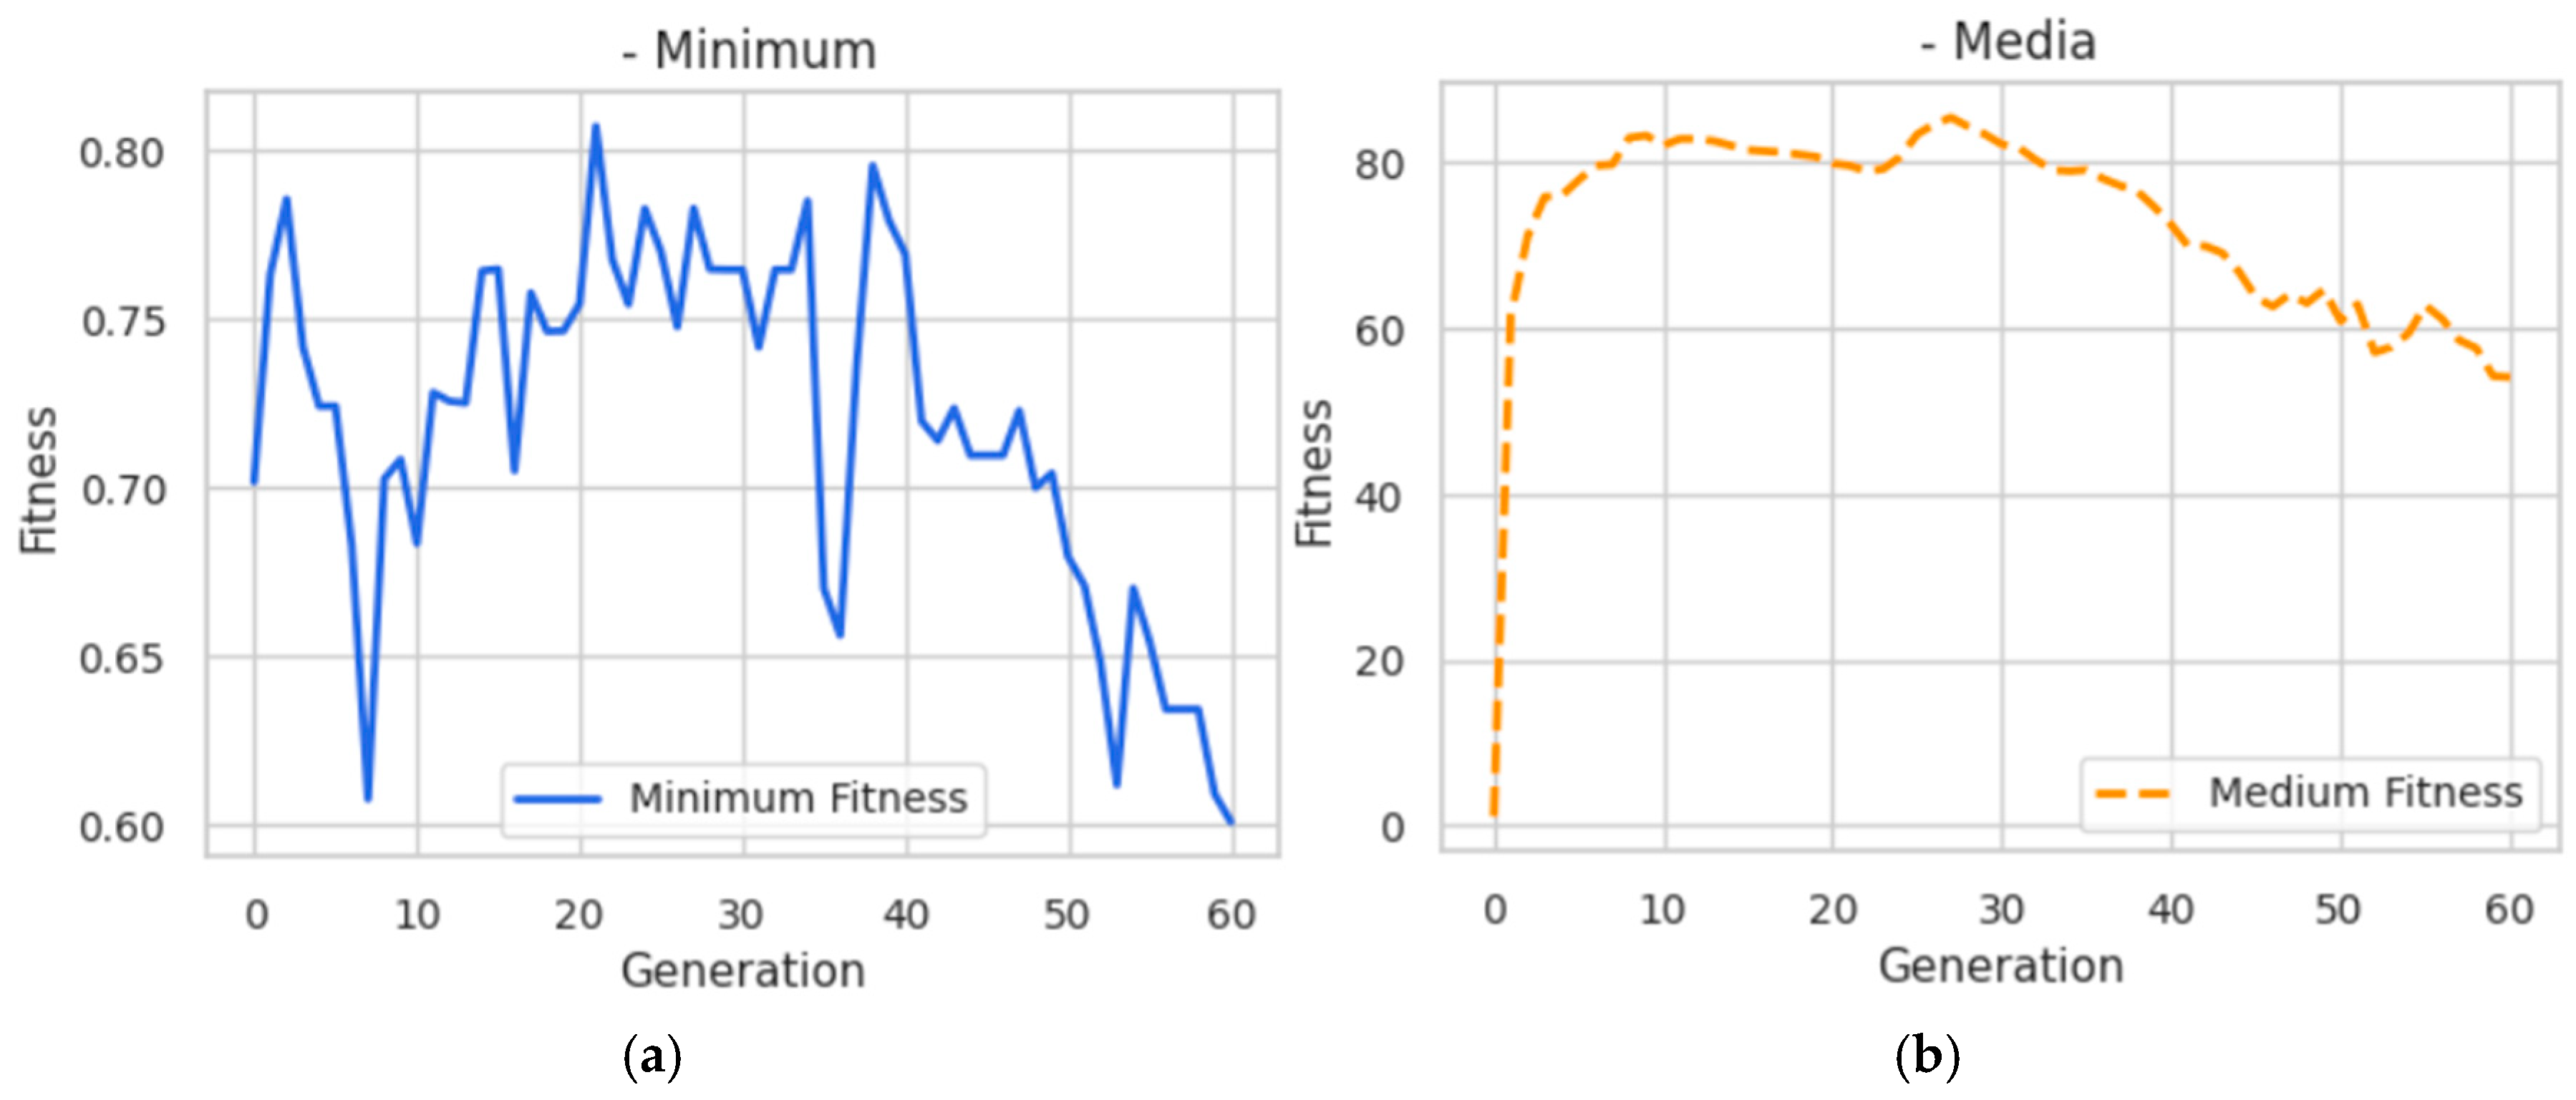
The SGA-COF-ESG model exhibits significantly different behavior compared to the previously analyzed configuration. In this case, the convergence of the genetic algorithm is slower and more irregular, with frequent occurrences of multiple local minima. Nevertheless, these are progressively overcome thanks to the exploratory component inherent in the algorithm, although the fitness improvement slope is substantially more gradual.
In this context, it has been observed that classical genetic algorithm configurations (with moderate crossover probabilities and a high mutation probability that introduces noise but lacks a clear directional bias) may be sufficient to effectively explore a more complex space solution. The SGA-COF-ESG model shown in
Figure 5 follows a similar pattern of slow decline in both the average and minimum fitness values. However, the high mutation rate (MUTPB = 0.9) and increased crossover rate (CXPB = 0.7) appear to have induced greater exploration but also lower stability in the direction of improvement. This can be attributed to the excessive exploration of the solution space, with mutations introducing disruptive variations that hinder the consolidation of evolutionary progress.
5. Discussion
The results obtained in this study demonstrate the viability and effectiveness of using genetic algorithms (GAs) as an optimization tool for constructing investment portfolios, applied to the Spanish market context via the IBEX 35 index. Unlike many previous studies, this research has designed a methodological proposal from scratch that incorporates key decisions at both technical and conceptual levels, enabling the model to adapt to different investor profiles (adjusting the hyperparameters during model validation or the hyperparameters of the objective function), including those with ethical and sustainable (ESG) restrictions.
From the state-of-the-art perspective, this work has addressed key limitations highlighted in earlier studies: reliance on traditional metrics, low integration of realistic constraints, limited external validity, and lack of adaptability to non-financial criteria. To overcome these, we proposed an evolutionary approach featuring advanced objective functions that integrate higher moments of distribution (skewness and kurtosis), plausible operational constraints, and a flexible architecture. This approach enabled the generation of more diversified portfolios better aligned with investors’ real preferences, and improved upon traditional as well as naïve models.
While the recent literature explores various combinations of risk-return metrics using evolutionary techniques, few studies have incorporated a systematic hyperparameter tuning or an out-of-sample validation process as structured as ours. This study introduces a three-phase split (training, validation, and testing) that enhances the model’s generalization capability and enables the identification of convergence points that optimize efficiency without compromising performance. Notably, the SGA-COF-1 model achieved the highest cumulative return (122.74%), distinguished by its stability and early convergence, suggesting an adequate exploration of the solution space without evident overfitting risk.
Analysis of the stability and convergence of the proposed genetic algorithms highlights two distinct behaviors depending on the applied configuration. The SGA-COF-1 model demonstrated rapid convergence and early stabilization, requiring a limited number of generations to reach high-quality solutions. This behavior, reinforced by using a fixed seed and a final evaluation mechanism (Hall of Fame), contributed to computational efficiency without compromising result quality. In contrast, the SGA-COF-ESG model exhibited slower and more irregular convergence, reflecting the increased complexity introduced by ESG constraints. Although high mutation and crossover rates favored exploration, they also led to reduced stability and a less directed search process. These findings suggest that the chosen configuration must align with the structural characteristics of the problem and the optimization goals, particularly when incorporating ethical or multi-dimensional criteria.
Although not included in the Results Section due to their poor performance, two additional implementations of the NSGA-II algorithm were designed and tested: a bi-objective version (MOGA-2), focused on return and volatility, and a four-objective version (MOGA-4), which also incorporated skewness and kurtosis. MOGA-2 produced a more conservative portfolio with the best risk control (CVaR −2.12%, drawdown −10.92%), though with lower cumulative returns than the naïve model (109.38% vs. 116.26%) and limited diversification due to overweighting assets that performed well during training but not during evaluation. MOGA-4, in turn, did not outperform the naïve model on any metric and showed the lowest cumulative return (107.18%). These findings reinforce the idea that in the absence of proper objective weighting (a manifestation of the Pareto front dimensionality curse), increased complexity in the objective function can lead to internal conflicts and hinder convergence, making simpler models, such as the classical genetic algorithm with a single-objective function, more effective and robust in practice.
However, several limitations must be acknowledged. The study did not incorporate transaction costs, taxes, or liquidity constraints—factors that significantly affect applicability in real-world applicability. Additionally, the analysis was limited to the Spanish market, excluding international dynamics or more volatile contexts. Neither was the integration with predictive models explored, nor was performance evaluated over longer time horizons or higher-frequency scales (e.g., intraday data).
These limitations suggest multiple avenues for future research. Expanding the approach to other markets or sectors, introducing additional constraints such as cardinality or minimum holdings per asset, and incorporating predictive models (such as LSTM, ARIMA, or Prophet) would strengthen the evolutionary process and anticipate market behaviors. It would also be interesting to evaluate more advanced algorithmic variants like MOEA/D, SPEA2, or island architecture with coevolution, as well as robust optimization strategies or copula-based approaches to model nonlinear correlations. From a computational perspective, parallelization, dimensionality reduction, and the use of hybrid techniques could significantly improve execution times. A crucial direction for future research involves a more in-depth exploration of the trade-offs between ethical investing and financial performance within the developed portfolios. This would entail quantifying the exact impact of different ESG integration levels on key financial metrics (e.g., returns, risk, and Sharpe ratio) and analyzing the effects of implementing multiple ESG tiers or more dynamic ESG screening methodologies. Such an analysis would provide more actionable insights for sustainability-focused investors, allowing for a clearer understanding of the economic implications of ethical investment choices. Finally, adopting additional financial metrics and explainability tools (XAI) would enrich the interpretation of results and facilitate adoption by non-expert users.
6. Conclusions
This work demonstrates that genetic algorithms constitute a promising and versatile tool for optimizing investment portfolios, especially when advanced objective functions and realistic constraints are incorporated. While the results are encouraging, they should be interpreted with caution given the limitations discussed. The methodological proposal developed, applied to the IBEX 35, has overcome several limitations identified in the previous literature, offering solutions tailored to diverse investor profiles, including those with ESG criteria.
The SGA-COF-1 model stood out for its performance and stability, and the division into training, validation, and testing phases strengthened the approach’s generalization capability. Although the study presents some limitations (such as the absence of real transaction costs or analysis in international markets), it lays the groundwork for future research. Future work could specifically focus on the following: (1) integrating predictive models such as LSTM or ARIMA to anticipate market behavior, (2) extending the optimization to international markets and higher-frequency data, (3) incorporating real-world constraints like transaction costs or liquidity, (4) enhancing interpretability using explainable AI techniques to foster trust among practitioners and non-expert users, and (5) quantifying the exact impact of different ESG integration levels on key financial metrics.
Overall, the proposed architecture offers a flexible and scalable framework aligned with the current trends in quantitative and sustainable investing. Nevertheless, further empirical validation in real-world and dynamic market settings is required before asserting its full practical applicability.


