Abstract
To address the issue that existing GNSS spoofing detection methods are not suitable for intermittent minor spoofing detection and spoofing duration identification, this paper theoretically analyzes the shortcomings of existing detection algorithms in terms of minor spoofing termination detection performance, and proposes comprehensively utilizing two types of control charts and robust estimation to detect the spoofing end moment, laying a foundation for spoofing duration identification and intermittent minor spoofing detection. The Shewhart control chart-based spoofing detection algorithm (M1) is proposed to achieve rapid spoofing termination detection, serving as one of the baseline algorithms for the joint algorithm. The strengths and weaknesses of the two baseline algorithms (M1 and existing EWMA control chart and robust estimation-based detection algorithm (M2)) in minor spoofing detection are analyzed. Under the robust estimation mechanism, a joint spoofing detection metric that can effectively indicate spoofing termination is constructed by combining their respective spoofing test statistics; then, anomaly detection on the joint detection metric is performed based on sample quantiles to identify the spoofing end moment. The experimental results under various typical abrupt spoofing and slowly varying spoofing scenarios demonstrate that the proposed joint spoofing detection algorithm based on dual control charts and robust estimation satisfies the spoofing alert time requirements specified by the International Civil Aviation Organization (ICAO) for the cruise phase. Compared with existing detection algorithms, the joint algorithm maintains excellent spoofing initiation detection performance while significantly improving both the speed and accuracy of spoofing termination detection. This effectively integrates the advantages of the two baseline algorithms and compensates for their individual limitations when operating independently. Upon timely and effective detection of the start and end moments of minor spoofing, it becomes possible to achieve spoofing duration identification and intermittent minor spoofing detection.
1. Introduction
Although Global Navigation Satellite Systems (GNSSs) possess advantageous characteristics such as global coverage, all-weather operation, and high positioning accuracy, their signals exhibit inherent vulnerabilities, including low power and open modulation structures, making them susceptible to spoofing attacks that seriously threaten aircraft navigation integrity [1,2]. In light of the increasing frequency of spoofing attack incidents induced by global geopolitical conflicts, the 41st Assembly of the International Civil Aviation Organization (ICAO) held in 2022 once again prioritized discussions on mitigating GNSS threats posed by spoofing and other interferences [3].
Based on their variation characteristics, GNSS spoofing can be categorized into abrupt spoofing and slowly varying spoofing. Spoofing detection technologies mainly include detection techniques based on abnormal signal feature variations [4,5] and sensor-aided detection techniques [6,7]. The former solely utilizes inherent signal characteristics such as power and Doppler frequency for spoofing detection, but cannot determine applicable detection methods when the spoofing strategy is unknown. The latter integrates GNSS positioning information with other sensor data to evaluate the navigation output from receivers, remaining unaffected by spoofing strategies. Inertial navigation systems (INSs) are commonly employed for auxiliary spoofing detection [8]. As an autonomous navigation system, an INS remains immune to external radio interference but suffers from accumulated navigation errors over time. In contrast, a GNSS offers higher navigation accuracy but is vulnerable to interference in electromagnetic propagation environments. A GNSS/INS integrated navigation system overcomes the limitations of standalone systems by fusing navigation data from both systems through Kalman filtering, making it the primary approach for airborne navigation. A GNSS/INS integrated navigation system operates in three modes: loosely coupled, tightly coupled, and deeply coupled integration. Different spoofing test statistics can be constructed using Kalman filter innovations from these integration mechanisms, enabling spoofing detection techniques with varying structural complexities. Comparatively, tightly coupled integration demonstrates better spoofing detection performance than loosely coupled integration while maintaining a simpler structure and lower computational load than deeply coupled integration [9].
Spoofing detection methods based on coupled navigation mechanisms construct test statistics using Kalman filter innovations, with performance dependent on both test statistics and detection thresholds [10]. Research indicates that Kalman filter innovations have Minimum Detectable Blunders (MDBs) [11], and spoofing with a magnitude below the MDB can be considered minor spoofing. Detecting minor spoofing attacks poses significant challenges, making the improvement in detection performance for such attacks a current research focus [12]. Traditional innovation sequence-based spoofing detection algorithms construct test statistics by normalizing, squaring, and summing innovations to enhance detection sensitivity for minor spoofing attacks [13]. However, due to the linearly increased degree of freedom (DOF) in the chi-square distribution of the test statistic with extended filtering time, this method exhibits limited effectiveness in detecting small-magnitude spoofing [14]. Reference [15] theoretically analyzes the measurement averaging and innovation averaging techniques employed within the detection window of the Autonomous Integrity Monitored Extrapolation (AIME) method from a spoofing detection perspective. It demonstrates that the AIME detection algorithm outperforms traditional innovation sequence-based detection algorithms in detecting slowly varying spoofing, but its detection performance depends on the length of the detection window. Reference [16] proposed a spoofing detection method utilizing INS error propagation characteristics and Kalman filter prediction estimates, which shows good detection performance for minor spoofing while reducing positioning errors. However, due to the time-accumulated errors of INSs, its performance degrades over time. Moreover, due to the GNSS/INS tightly coupled mechanism, Kalman filtering exhibits an error tracking effect [17], resulting in reduced detection sensitivity of the detection algorithm. To mitigate the adverse effects of the error tracking effect, Reference [18] introduces an additional INS unit into the tightly coupled system. This unit is calibrated using the averaged innovations output by an extended Kalman filter every N epochs, thereby constructing an augmented AIME test statistic for spoofing detection. Compared to traditional AIME test statistics, this algorithm enhances detection capability for minor spoofing but requires manual configuration of both the calibration window and detection window. Reference [19] reduces the impact of error tracking on minor spoofing detection through innovation rate optimization and robust estimation. However, detection can only be performed after the filter computes the innovation rate.
Current research in minor spoofing detection predominantly focuses on continuous spoofing attacks, with limited attention paid to intermittent spoofing attacks requiring spoofing end detection. Due to the lag effect in test statistic evolution, existing detection algorithms struggle to rapidly converge below detection thresholds following spoofing termination, resulting in significant detection delays for spoofing termination. The real-time precise detection of the spoofing end constitutes not only the foundation for intermittent spoofing detection but also the prerequisite for spoofing duration identification. Under complex electromagnetic interference scenarios, failure to promptly identify spoofing termination directly impacts navigation strategies. This causes airborne navigation systems to persistently rely on the INS-dominant mode, prevents the timely recovery of filter parameters, and leads to the gradual accumulation of positioning errors—ultimately compromising flight decision-making and safety. Inaccurate spoofing duration identification evidently hinders post-attack forensics and potential liability attribution for safety incidents.
A control chart, one of the most commonly used tools in statistical process control (SPC), establishes a center line and upper/lower control limits based on the statistical characteristics of data under normal conditions. When data exceed these control limits, it indicates a change in the statistical characteristics of the data, triggering an anomaly alert from the control chart. While control charts have been applied to fault detection in various fields, including navigation [20] and photovoltaic systems [21], few studies have explored their use for improving minor spoofing detection performance. To enhance detection capability for minor spoofing attacks, this paper utilizes Kalman filter innovations as spoofing detection samples and constructs a novel test statistic and a spoofing detection method building upon previous work on exponentially weighted moving average (EWMA) control chart and robust estimation-based spoofing detection algorithm. This leads to the proposal of a joint spoofing detection algorithm based on dual control charts and robust estimation, achieving timely and effective detection of both initiation and termination moments for minor spoofing attacks.
2. Mathematical Models
This section first introduces two fundamental mathematical models within the spoofing detection framework based on GNSS/INS tightly coupled navigation: the Spoofing Attacks Model and the GNSS/INS Tightly Coupled Navigation System Model. Subsequently, it analyzes the adverse impacts of spoofing on Kalman filter innovations and innovation-based spoofing detection methods, with particular emphasis on the effects on the traditional innovation sequence-based detection algorithm. Finally, the EWMA control chart- and robust estimation-based spoofing detection algorithm—a critical baseline component of the proposed joint detection algorithm—is introduced and analyzed.
2.1. Spoofing Attacks Model
At the pseudorange level of GNSS/INS tightly coupled navigation systems, the original pseudorange measurement of the jth visible satellite measured by the receiver, denoted by , is defined as [22]
where denotes the actual distance between the jth visible satellite and the receiver; c represents the speed of light; and correspond to the receiver clock bias and satellite clock bias, respectively; and denotes the sum of noise following a Gaussian distribution with a zero mean.
The impact of spoofing signals on tightly coupled systems manifests as alterations in pseudorange measurements at the pseudorange level. When subjected to spoofing, becomes
where represents the pseudorange spoofing bias imposed on the jth visible satellite. For abrupt spoofing, can be expressed as (b is a constant). For slowly varying spoofing, can be expressed as , where denotes the spoofing initiation epoch, k represents the current epoch, and a is the pseudorange spoofing rate.
2.2. GNSS/INS Tightly Coupled Navigation System Model
Based on the system’s state equation and measurement equation, the tightly coupled system typically employs a Kalman filter to optimally estimate the state vector. Under the closed-loop correction structure, the estimated state vector is fed back to the INS for correction, and the corrected INS navigation parameters serve as the output of the tightly coupled system [16].
The discrete state equation and discrete measurement equation of the tightly coupled system are shown in Equations (3) and (4), respectively.
where the subscript k denotes the current epoch, and represents the previous epoch. is the system state vector, is the state transition matrix, and is the system noise at epoch following a zero-mean Gaussian distribution with corresponding covariance matrix . is the system observation vector, is the measurement matrix, and is the measurement noise following a zero-mean Gaussian distribution with a corresponding covariance matrix .
The 17-dimensional state vector consists of INS navigation parameter errors and GNSS clock bias/clock drift, and can be expressed as
where and represent, respectively, the angular error and velocity error of the INS platform in three directions (the superscripts N, E, and D represent the north, east, and ground directions, respectively). denotes the position error (the superscripts L, , and H represent latitude, longitude, and altitude, respectively). and indicate the accelerometer bias and gyroscope bias, respectively (the superscripts x, y, and z denote, respectively, the three directions of the body frame). These state variables collectively constitute the INS navigation parameter errors, while represents the GNSS clock bias, and represents the GNSS clock drift.
The system observation vector consists of the differences between GNSS and INS estimates of the pseudorange and pseudorange rate, expressed as
where n is the number of visible satellites; and represent the GNSS-measured pseudorange and pseudorange rate, respectively; and and denote the INS-predicted pseudorange and pseudorange rate, respectively, where .
Kalman filter operations include the time update process and measurement update process. The time update process is as follows:
where ^ denotes the estimated value, while and represent the one-step predicted state vector and the one-step predicted state estimation error covariance matrix from epoch to epoch k, respectively.
The measurement update process is as follows:
here, represents the filter gain, denotes the system state estimate, and represents the state estimation error covariance matrix.
The deviation between the system observation vector and the one-step predicted measurement is defined as the Kalman filter innovation [13].
The innovation covariance matrix is
2.3. Analysis of Impact of Spoofing on Kalman Filter Innovation
Under nominal conditions, the innovation sequence follows a zero-mean normal distribution. When satellites are subjected to spoofing attacks, the mean of the innovation sequence shifts while retaining its normal distribution, with the variance remaining nearly constant. Consequently, changes in the statistical characteristics of the innovation sequence can indicate whether the system is under spoofing attacks [18]. Current innovation-based spoofing detection algorithms can be categorized into two primary approaches: the “snapshot method” and the “sequential method”. The former constructs test statistics solely using current-epoch innovations, demonstrating higher sensitivity to large-magnitude abrupt spoofing. The latter leverages innovations over a time window to build test statistics, exhibiting enhanced sensitivity to small-magnitude spoofing, with the traditional innovation sequence-based detection algorithm representing a typical implementation of this approach.
Reference [14] shows that spoofing introduced at epoch k not only affects the innovation at epoch k, but also reduces the innovation offset at epoch by (where denotes the pseudorange spoofing bias at epoch k, equivalent to s in Equation (2)). This reduction stems from the error tracking effect of Kalman filtering. As Kalman filtering iteratively updates, accumulated filtering errors progressively diminish the innovation offset, ultimately attenuating the spoofing magnitude on spoofed satellites. This significantly degrades the performance of innovation-based spoofing detection methods.
The traditional innovation sequence-based detection algorithm employs the chi-square test principle: it constructs a chi-square-distributed test statistic by accumulating squared normalized innovations across all epochs, then compares it against a detection threshold corresponding to a given false alarm probability. However, the normalization process compresses innovation amplitudes, preserving only partial spoofing information. Subsequent squaring of normalized innovations further reduces the magnitude of spoofed innovations. This increases the time required for the test statistic to accumulate to the threshold, causing excessive delays or even failure for minor spoofing attacks detection, while impeding timely identification of the spoofing termination moment.
2.4. Spoofing Detection Algorithm Based on EWMA Control Chart and Robust Estimation
To address the limitation of traditional innovation sequence-based detection algorithms in effectively detecting minor spoofing attacks, the authors introduced control charts into spoofing detection in previous work, proposing the EWMA control chart- and robust estimation-based detection algorithm [14]. This approach is a kind of ”sequential method” and achieves the rapid and accurate identification of minor spoofing attacks, serving as one of the baseline algorithms for the joint detection algorithm proposed in this paper. Below, we recapitulate its key procedures using the jth visible satellite as an example.
The innovation sequence of the jth visible satellite is taken as the detection sample for the algorithm, with the mean and variance of the detection sample at epoch k being denoted by and , respectively, where represents the element in the jth row and jth column of . We set up a binary hypothesis test where the event of no spoofing is H0: , and the event of under-spoofing is H1: . The spoofing test statistic at epoch k is
where , and is the smoothing factor which determines the weight of the current data and historical data, with the weight of historical innovations decreasing exponentially over time. The further back in time the innovation is, the smaller its weight [23]. Assume that the satellite is not spoofed at the initial epoch, and thus, , where denotes the initial value of the test statistic. From Equation (11), the mean and variance of the test statistic sequence at epoch k are and , respectively, where denotes expectation operation, and denotes variance operation. Given a false alarm probability of , and denoting as the upper quantile of the standard normal distribution, the upper detection threshold and lower detection threshold of the algorithm at epoch k are
where takes the mean of the innovations under nominal conditions, denoted as , namely . The smaller the value of , the smaller the distance between the upper and lower detection thresholds becomes, making the algorithm more sensitive to changes in the test statistic and enhancing its ability to detect minor spoofing.
Introducing robust estimation can effectively mitigate the adverse effects of Kalman filter error tracking on innovations. Test statistics are categorized into three classes: normal, suspicious, and eliminated. The equivalent weight for the normal class is set to 1, while weights for the suspicious class are reduced according to a predetermined scheme. The eliminated class receives an equivalent weight of 0 [24]. The equivalent weight matrix is computed using the IGG-III equivalent weight function:
where denotes the equivalent weight corresponding to the test statistic at epoch k, and and are thresholds distinguishing normal, suspicious, and eliminated test statistics at epoch k. Let be a linear transformation of the detection threshold , where , and . The equivalent weight matrix at epoch k is expressed as , forming a robust estimation-based Kalman filter gain matrix at epoch k: . Under the adaptive equivalent weight mechanism, the following occur: (1) The nominal Kalman filter update process remains operational for unspoofed satellites. (2) When satellites are under spoofing attacks with between thresholds and , the corresponding equivalent weight is reduced below 1, which diminishes the interference of historical spoofing with current innovations, thereby amplifying their offsets to enhance spoofing detectability. Simultaneously, it attenuates the impact of spoofed measurements on state estimation during the Kalman filter measurement update, thereby reducing innovation deviations for unspoofed satellites and then suppressing false alarms. (3) When satellites are under spoofing attacks with exceeding , the equivalent weight is set to 0, effectively blocking the contamination of spoofing on subsequent innovations for affected satellites while suppressing the propagation of spoofing effects to state estimates corresponding to unspoofed satellites.
The EWMA control chart- and robust estimation-based detection algorithm employs a smoothing factor to perform exponential weighted moving averaging on the innovation linear term sequence, enabling the differentiated weighting of historical and current innovations. By incorporating a robust estimation-based gain matrix, the algorithm enhances detection capability for slowly varying innovation shifts while preventing false alarms upon spoofing termination and on unspoofed satellites. The detection workflow is illustrated in Figure 1 [14]. However, the algorithm still presents limitations requiring improvement: the persistent contamination from past spoofed innovations causes the test statistic to exhibit protracted recovery toward nominal conditions following minor spoofing termination, substantially diminishing the algorithm’s sensitivity to spoofing end and precluding accurate determination of the spoofing termination moment. Consequently, precise spoofing attack duration identification becomes compromised, while the detection efficacy for intermittent spoofing attacks is significantly undermined. This limitation stems fundamentally from the algorithm’s inherent performance trade-off: reducing parameter m enhances spoofing initiation detection sensitivity at the expense of exacerbating detection delays for spoofing termination—an inescapable contradiction for the algorithm.
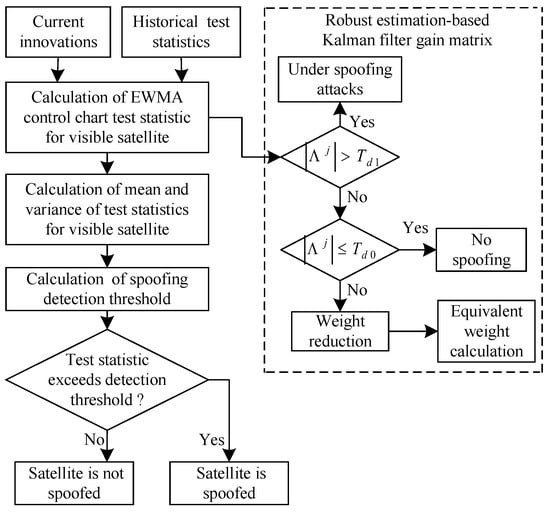
Figure 1.
Flowchart of detection algorithm based on EWMA control chart and robust estimation.
3. Spoofing Detection Algorithm Based on Shewhart Control Chart
The fundamental principle underpinning control chart-based spoofing detection algorithms is to derive test statistics from the normally distributed innovation linear term data and to define control limits using the nominal-condition mean of these statistics and their current variance. An anomaly alert is triggered whenever the current-epoch test statistic exceeds these limits. Beyond the EWMA control chart, another prevalent technique in anomaly detection is the Shewhart control chart [25]. While the EWMA control chart leverages both past and current data to cumulatively amplify subtle shifts, thereby enhancing detection capability for slowly varying offsets [21], the Shewhart control chart operates distinctly. It directly monitors current data assumed to follow a normal distribution [26], exhibiting high sensitivity to abrupt data shifts that enables the precise identification of drastic changes. However, this approach demonstrates limited effectiveness in detecting slowly varying shifts [20]. Crucially, innovations frequently undergo abrupt shifts upon spoofing termination. To address the excessive delays in existing methods for detecting spoofing end, this paper capitalizes on the Shewhart control chart’s inherent sensitivity to abrupt data deviations, proposing a Shewhart control chart-based spoofing detection algorithm designed for the rapid and precise detection of minor spoofing termination.
The Shewhart control chart-based detection algorithm belongs to the “snapshot method,” directly using the innovation linear term at the current epoch as the test statistic. The upper and lower detection thresholds are determined based on the mean of the test statistic in unspoofed conditions, the variance in the test statistic at the current epoch, and normal distribution quantiles. If the test statistic at the current epoch falls within the control limits, the satellite is determined to be unaffected by spoofing; otherwise, it is considered spoofed. Compared with detection algorithms based on the chi-square test principle, this algorithm can promptly detect abrupt shifts in innovation.
In the Shewhart control chart-based detection algorithm, the innovation of the jth visible satellite at epoch k is used as the detection sample and spoofing test statistic , namely . The mean and variance of the test statistic sequence at epoch k are and , respectively. We set up a binary hypothesis test where the event of no spoofing is H0: , and the event of under-spoofing is H1: . Given a false alarm probability of , and denoting as the upper quantile of the standard normal distribution, the upper detection threshold and lower detection threshold of the algorithm at epoch k are
similarly, in the two equations above, .
The performance of the Shewhart control chart-based detection algorithm is analyzed as follows: After spoofing initiation, the minor spoofing only slightly biases the innovation, causing minimal changes in the innovation used as the test statistic. Due to the influence of the error tracking effect of the Kalman filter, the test statistic is unlikely to exceed the control limits, leading to a high missed alarm probability for minor spoofing detection. At the end of spoofing, the innovation decreases rapidly, allowing the test statistic to quickly fall within the control limits, enabling the algorithm to promptly detect spoofing termination. However, due to the error tracking effect of the Kalman filter, the algorithm is prone to false alarms after the end of minor spoofing. The standalone implementation of the Shewhart control chart-based detection algorithm fails to meet the 30 s spoofing alert time frame mandated by ICAO Annex 10 [27] for cruise phase operations, primarily due to its unacceptably high missed detection probability.
Our experimental results demonstrate that without robust estimation, the test statistic exhibits a characteristic sharp plunge below zero upon spoofing termination. Following the introduction of robust estimation to mitigate Kalman filter error tracking effects, the magnitude of downward shift upon spoofing end diminishes to near zero. Nevertheless, the overall variation pattern and the defining abrupt shift characteristic upon the spoofing end moment remain fundamentally preserved.
4. Joint Spoofing Detection Algorithm Based on Dual Control Charts and Robust Estimation
The standalone application of the EWMA control chart- and robust estimation-based detection algorithm (M2) enables the efficient and rapid detection of various minor spoofing attacks. However, it exhibits excessive detection delays for spoofing termination, triggering false alarms during the post-spoofing recovery period. Conversely, while the Shewhart control chart-based detection algorithm (M1) suffers from higher missed detection rates for minor spoofing and may generate false alarms after spoofing end, it demonstrates superior performance in detecting spoofing termination. Thus, combining these two algorithms presents a promising approach to mitigating their respective limitations—analogous to the synergistic integration of GNSSs and INSs in coupled navigation systems. Nevertheless, naively combining the two baseline algorithms still fails to resolve post-spoofing false alarms. To overcome this, building upon the joint utilization of both test statistics, this paper proposes a joint spoofing detection algorithm based on dual control charts and robust estimation (M3). The algorithm defines the ratio of spoofing test statistics from the aforementioned baseline algorithms as the joint spoofing detection metric . By applying the sample quantile principle to detect anomalies in , it achieves enhanced precision in identifying the termination moment of minor spoofing attacks while effectively preventing false alarms after spoofing end.
4.1. Joint Spoofing Detection Metric for Spoofing End Moment Detection
4.1.1. Construction of Joint Spoofing Detection Metric
Under the robust estimation mechanism, the changes in the statistical characteristics of the EWMA control chart-based test statistic and Shewhart control chart-based test statistic (innovation at the current epoch) are analyzed. When satellites are unspoofed, and exhibit similar statistical characteristics. Following the onset of minor spoofing attacks, evolves gradually due to the influence of historical innovations, while (the current innovation) follows the same trend as . After spoofing termination, shows no significant change due to residual historical spoofing effects, whereas rapidly reverts to the nominal state, exhibiting a distinct jump. Leveraging the variation patterns of and during spoofing persistence and termination periods, a novel joint spoofing detection metric is defined:
as intuitively derived from the above analysis, the joint detection metric remains relatively stable during spoofing persistence; at spoofing termination, exhibits intense fluctuations. Thus, the moment when the sequence shows significant disturbance can be identified as the end moment of minor spoofing. A brief mathematical analysis of the dynamic characteristics of the joint detection metric at spoofing termination follows.
Assuming spoofing ends at time , the innovation sequence reverts to a zero-mean Gaussian distribution, with its fluctuation range determined by . Hence, . The recursive formula for expands as follows: . After , returns to the nominal state, but historical spoofing data () continues to influence through the exponential weight . At this moment, can be decomposed into two components:
the weight of the historical spoofing residue term decays exponentially as k increases, and the convergence rate of is determined by the smoothing factor . In practical applications, must be set to a small value to ensure good detection performance, but a small leads to slower convergence, exacerbating the lag effect of . Based on the above analysis, after the spoofing end time , the difference in the rates of change between the numerator and the denominator of will cause its value to change abruptly. Specifically, rapidly converges to zero, i.e., , while remains high due to historical spoofing residue, i.e., , leading to . In subsequent moments, decays slowly, while remains close to zero, causing to fluctuate near zero. The ratio sufficiently amplifies the difference between the lagged change in and the abrupt change in at the spoofing end moment, providing timely and accurate indication of spoofing termination with low computational complexity.
In the proposed joint detection algorithm, spoofing detection is handled by M2. When spoofing occurs, exceeds the detection threshold and thus does not reach zero. In the absence of spoofing, varies near zero and may reach zero. To prevent ill-defined conditions in Equation (17) when the denominator becomes zero, the algorithm assigns 0 to when no spoofing is detected by M2. After spoofing is detected, is calculated according to Equation (17). Consequently, is redefined in a piecewise form:
4.1.2. Validation of Joint Spoofing Detection Metric Effectiveness
Under the robust estimation mechanism, simulation experiments are designed to validate the joint detection metric’s effectiveness in indicating spoofing termination across various typical spoofing scenarios.
- Experiment 1: Slowly varying spoofing with a pseudorange spoofing rate of 0.2 m/s and abrupt spoofing with a pseudorange bias of 15 m are separately applied to visible satellite PRN1. These scenarios represent typical slowly varying and abrupt spoofing attacks that present high detection difficulty. During the spoofing period, the curves of , , and are shown in Figure 2 and Figure 3, where Figure 2b and Figure 3b provide magnified views of , specifically marking the abrupt change around 350 s when spoofing terminates.
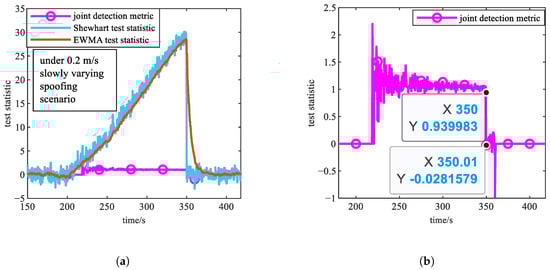 Figure 2. Simulation results of Experiment 1 (under 0.2 m/s slowly varying spoofing scenario). (a) Curves of , , and during spoofing period. (b) Magnified views of curve around spoofing termination. The two black points in this subfigure indicate that the joint detection metric changed drastically within 0.01 s after the spoofing ended.
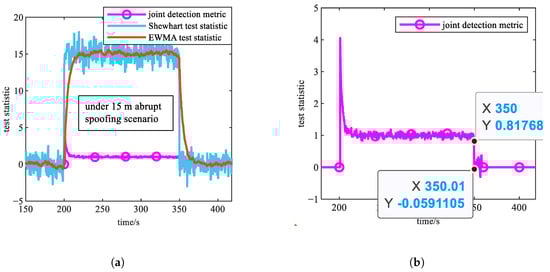 Figure 3. Simulation results of Experiment 1 (under 15 m abrupt spoofing scenario). (a) Curves of , , and during spoofing period. (b) Magnified views of curve around spoofing termination. The two black points in this subfigure indicate that the joint detection metric changed drastically within 0.01 s after the spoofing ended.
 - Experiment 2: Under conditions where the pseudorange observation noise standard deviation is 2.5 m (favorable signal conditions), curves across different spoofing intensities and types are compared, as shown in Figure 4a.
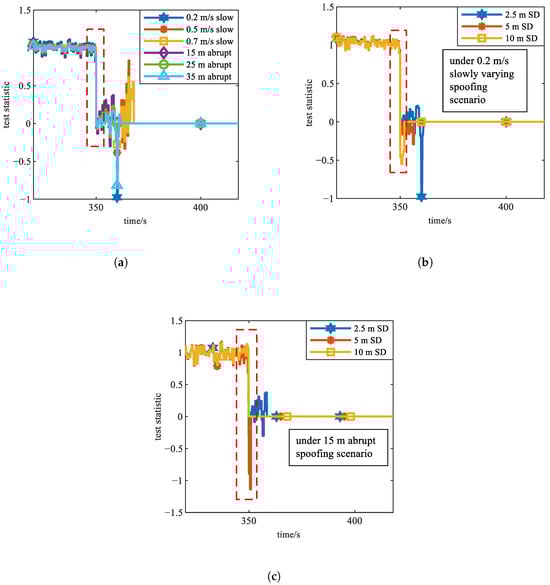 Figure 4. Simulation results of Experiments 2–4. The legends "SD" denote standard deviation. (a) curves across different spoofing intensities and types under conditions of pseudorange observation noise standard deviation being 2.5 m. (b) curves corresponding to different pseudorange observation noise levels under a 0.2 m/s slowly varying spoofing scenario. (c) curves corresponding to different pseudorange observation noise levels under a 15 m abrupt spoofing scenario.
 - Experiment 3: Under a slowly varying spoofing scenario with a pseudorange rate of 0.2 m/s, the curves are compared across different pseudorange observation noise levels, as shown in Figure 4b.
- Experiment 4: Under a abrupt spoofing scenario with a pseudorange bias of 15 m, curves are compared across different pseudorange observation noise levels, as shown in Figure 4c.
All spoofing scenarios are summarized in Table 1, including Experiment 5 in Section 4.2 for validating spoofing end moment detection method.

Table 1.
Spoofing scenario settings for Experiments 1–5.
Based on Figure 2 and Figure 3, both the steady-state and transient properties of the three types of test statistics align with theoretical expectations. As evident from the curves under the two typical scenarios, following spoofing termination at 350 s, the joint detection metric rapidly plummets to near zero almost immediately, demonstrating no significant detection delay. This proves its capability to promptly indicate the end of spoofing.
Based on Figure 4, the sequence consistently exhibits abrupt change characteristics at the moment spoofing ends under all six typical scenarios of slowly varying spoofing and abrupt spoofing. Notably, under the particularly challenging scenario of 0.2 m/s slowly varying spoofing, the sequences across all three noise intensity levels maintain this abrupt change characteristics at the end of spoofing. These results collectively verify that the joint detection metric effectively indicates spoofing termination across all noise intensity and spoofing intensity scenarios. The reason consistently guarantees abrupt change characteristics across diverse scenarios lies in the excellent robustness of the statistical property of the two baseline test statistics.
4.2. Spoofing End Moment Detection Method Based on Sample Quantiles
4.2.1. Anomaly Detection Based on Sample Quantiles
To detect anomalies in the joint detection metric sequence for determining the spoofing end moment, it is necessary to employ targeted statistical methods based on the random distribution characteristics of the metric sequence. Due to the interdependence between and , the statistical properties of cannot be determined, making conventional prior knowledge-based parametric testing methods inapplicable for anomaly detection in . Therefore, this paper adopts a non-parametric testing method based on sample quantiles.The sample quantile is a non-parametric statistic capable of reflecting the fluctuation characteristics of data over a given time interval even in the absence of prior information about the data distribution [28]. This property makes it particularly suitable for detecting abrupt changes in the joint detection metric.
Sample Quantile (generally referring to the upper quantile): For a dataset A, given a probability (), if there exists a data element such that (where P denotes probability), then is termed the upper quantile of the dataset A. The sample quantile offers a simple structure and can characterize the local distribution characteristics of data. It is one of the commonly used methods for anomaly detection. Under a sliding window mechanism, the sample quantile (e.g., the median) can effectively sense abrupt changes in sequences by leveraging the dynamic variations in local data distributions [28]. For instance, it identifies abrupt change points in non-stationary signals during time-series anomaly detection. The median within a sliding window reflects the “typical” state of the window’s data. The deviation between the current value and the median directly quantifies the anomaly intensity. Furthermore, the median exhibits robustness against extreme values, thereby reducing false alarms induced by noise.
4.2.2. Procedures of Spoofing End Moment Detection Method Based on Sample Quantiles
Upon the spoofing end moment, exhibits abrupt fluctuations. This paper proposes a sample quantile-based spoofing end moment detection method. By calculating the sample median of several joint detection metric values within a sliding window and monitoring the absolute deviations between and each joint detection metric value in the window, the abrupt change in the sequence can be captured. Specifically, the abrupt change in at spoofing termination causes these absolute deviations within the window to significantly exceed a preset threshold , thereby indicating the spoofing end moment.
Assuming minor spoofing has been detected at epoch , the spoofing end moment detection method based on sample quantiles operates as follows:
- Compute at each epoch after spoofing onset detection, generating sequence Y:
- Select a sliding time window size l to form multiple sequence segments like . The choice of l depends on the employed sample quantile and the distribution characteristics of the time-series data. If the window is too large, the calculation of sample quantiles may miss anomalies; if it is too small, it cannot determine the statistical significance of sample quantiles. This paper selects .
- A new sequence is formed based on all of the obtained sequence segments:
- For each sequence segment in Equation (21), the sample quantile is calculated. Considering the characteristics of sequence Y, this paper employs the 50% sample quantile (also known as the median) for computation. The median corresponds to the 50th percentile value when all sample data are sorted in ascending order. The resulting sequence composed of all calculated medians M is
- For each sequence segment in Equation (21), compute the absolute difference between every element and the corresponding median of that segment, and take out the maximum value among all the absolute differences. Take the ith sequence segment as an example. That is, , . The values corresponding to each sequence segment are combined in time order to obtain the absolute difference sequence :compare each absolute difference value in sequentially with the preset threshold . When an absolute value exceeds , it can be identified as an outlier, and the corresponding epoch is the spoofing end moment .
The reasonable determination of the threshold is crucial for the spoofing end moment detection method. Considering six spoofing scenarios and three levels of pseudorange observation noise intensity, simulation parameters were configured according to typical airborne receiver performance requirements. Monte Carlo experiments revealed that during spoofing attacks, the absolute values remain consistently below 0.6, while at the spoofing termination instant, the absolute differences consistently exceed 0.6. Therefore, the threshold is established in this paper.
4.2.3. Validation of Spoofing End Moment Detection Method Based on Sample Quantiles
Experiment 5: As shown in Table 1, under three levels of pseudorange observation noise standard deviation, slowly varying spoofing and abrupt spoofing at six typical intensities were applied to visible satellite PRN1 from 200 s to 350 s, validating the effectiveness of the proposed spoofing end moment detection method. Due to excessive curves, Figure 5 only displays the absolute difference sequence for the scenarios of slowly varying spoofing at 0.2 m/s and abrupt spoofing at 15 m under a pseudorange noise standard deviation of 2.5 m, with Figure 5b providing local magnification near the spoofing end moment.
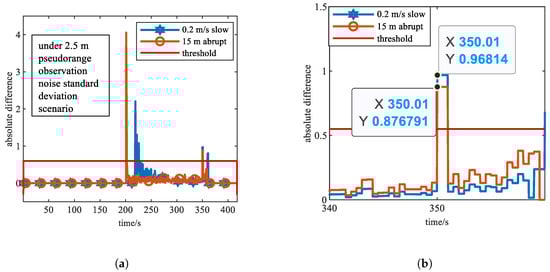
Figure 5.
Simulation results of Experiment 5. (a) Absolute difference sequence curves under two typical spoofing scenarios. (b) Magnified views of absolute difference sequence curve near the spoofing end moment.
As shown in Figure 5, the absolute difference sequence remained at 0 until the joint algorithm detected spoofing. After spoofing detection by the joint algorithm, rapidly exceeded the threshold but gradually decreased and stabilized near a small positive value close to 0, remaining below the threshold. At spoofing termination (350 s), surged abruptly at 350.01 s, exceeding the threshold, leading the joint algorithm to mark 350 s as the spoofing end moment. These results perfectly align with the experimental setup, confirming the validity of identifying spoofing end moments through outliers. Furthermore, the sample quantile-based spoofing end moment detection method efficiently captures anomalies in with low computational complexity. Given spoofing alert time requirements, this approach minimizes resource consumption, avoiding integration challenges in avionics systems.
4.3. Process of Joint Spoofing Detection Algorithm Based on Dual Control Charts and Robust Estimation
The joint spoofing detection algorithm based on dual control charts and robust estimation, under the robust estimation mechanism, first employs the EWMA test statistic to detect minor spoofing. Upon detecting spoofing at moment , it calculates the joint detection metric for spoofing end moment detection by combining and the Shewhart test statistic . Subsequently, the spoofing end moment is determined by detecting anomalies in . Both and are then reset to zero, and spoofing detection continues based on starting at moment . The algorithm flowchart is shown in Figure 6, with corresponding pseudo-code descriptions provided in Appendix A.
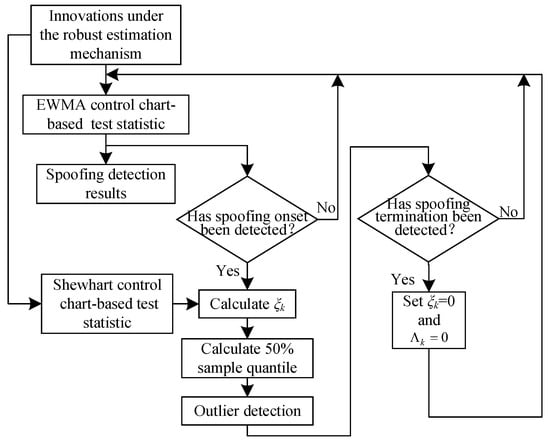
Figure 6.
Flowchart of joint spoofing detection algorithm based on dual control charts and robust estimation.
5. Experiments and Results
To validate the detection performance of the proposed joint spoofing detection algorithm based on dual control charts and robust estimation (M3), this study compares the key performance of M3 against the Shewhart control chart-based detection algorithm (M1) and the EWMA control chart- and robust estimation-based detection algorithm (M2) under multiple typical spoofing scenarios, with focused analysis on each algorithm’s capability in detecting intermittent minor spoofing attacks, effectiveness in spoofing duration identification, and compliance with ICAO’s 30 s spoofing alert time requirement for cruise phases. Simulation experiments are conducted on a GNSS/INS tightly coupled navigation simulation system, and three experiments are designed as follows:
- Experiment 6: satellites subjected to abrupt spoofing attacks at varying intensities.
- Experiment 7: satellites subjected to slowly varying spoofing attacks at varying intensities.
- Experiment 8: satellites subjected to intermittent spoofing attacks across multiple time intervals.
Detection delay is defined as the time interval between the spoofing initiation epoch and the epoch when spoofing is detected, as well as the time interval between the spoofing termination epoch and the epoch when spoofing end is detected. In M3, a smaller factor m enhances the ability of robust estimation to mitigate spoofing-induced adverse effects on innovations, thereby reducing spoofing initiation detection delay while preventing false alarms for unspoofed satellites—fully demonstrating M3’s advantages. The value was applied uniformly in all subsequent experiments.
It should be noted that reference [14] has already conducted a systematic performance comparison between M2 and traditional innovation sequence-based detection algorithms, demonstrating M2’s superiority in spoofing initiation detection, spoofing termination detection, false alarm probability, and missed alarm probability. Consequently, this paper refrains from repeating comparisons between M3 and traditional algorithms, instead focusing solely on performance evaluations contrasting M3 against M2 and M1.
5.1. Simulation Settings
Simulations were conducted using MATLAB2020 on a work station equipped with the Windows 10 operating system. The GNSS/INS tightly coupled navigation open-source solution constructed in Reference [29] has been widely applied and exhibits good scalability. Similarly to [29], here, satellites were uniformly distributed on six orbital planes, with an elevation mask angle of 10°, and eight visible satellites; the false alarm probability was set to , and the key GNSS parameters and sensor parameters were configured as shown in Table 2. The spoofing scenarios were set as shown in Table 3. The aircraft flight had a total duration of 418 s, involving two 45-degree turn maneuvers and one 500 m climb. The flight trajectory is illustrated in Figure 7. In all the figures within this section, the legends "U. Thres." and "L. Thres." denote the upper detection threshold and lower detection threshold of a certain detection algorithm, respectively. It is particularly noted that all experiments in Section 4 were conducted under an identical simulation setup to the one described in this section.
Table 2.
Simulation parameters.
Table 3.
Spoofing scenario settings.
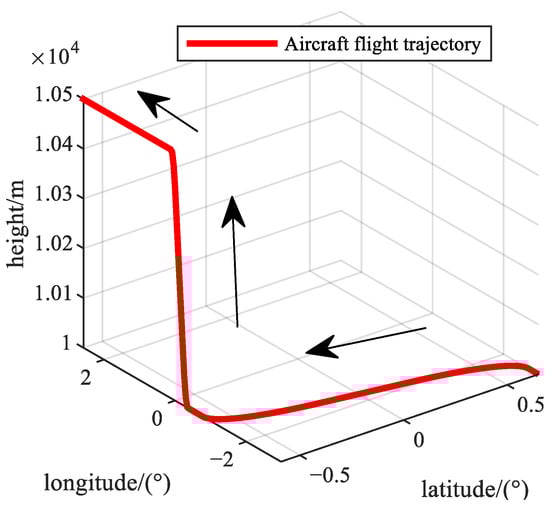
Figure 7.
Aircraft flight trajectory in simulations.
5.2. Results and Analysis
5.2.1. Experiment 6
Between 200 s and 350 s, abrupt spoofing attacks with pseudorange biases of 15 m, 25 m, and 35 m were imposed on visible satellite PRN1, and simulations were conducted. The variations of the test statistics for M1, M2, and M3 over time are shown in Figure 8, while Table 4 summarizes the simulation results.
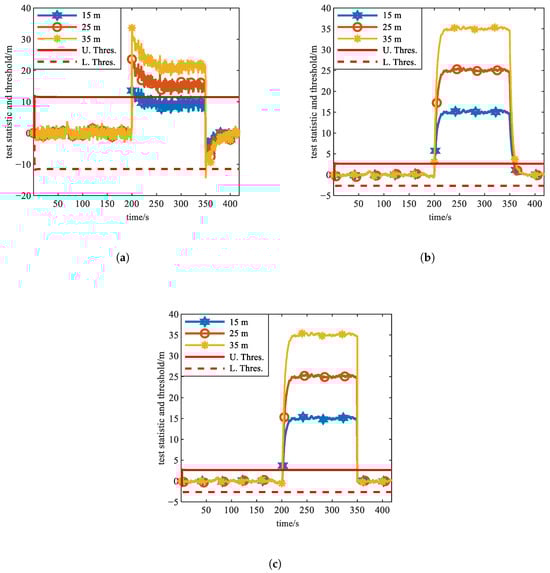
Figure 8.
Simulation results of Experiment 6 (under scenario of abrupt spoofing). (a) Curves of test statistics and threshold of M1. (b) Curves of test statistics and threshold of M2. (c) Curves of test statistics and threshold of M3.
Table 4.
Comparison of detection performance under abrupt spoofing scenarios.
Based on Figure 8a,b, and Table 4, it can be observed that M2 achieves rapid detection of all types of abrupt spoofing attacks, and due to robust estimation reducing the adverse influence of spoofing on innovations, no missed alarms occur. M1 achieves almost a 0 s detection delay for 25 m, and 35 m abrupt spoofing attacks, demonstrating exceptional detection capability for abrupt spoofing with instantaneous identification upon spoofing activation. In the 25 m and 35 m scenarios, benefiting from being solely influenced by the current epoch’s innovation, the test statistic of M1 immediately returns to a non-spoofed state following spoofing termination at 350 s, allowing M1 to promptly detect the end of spoofing. However, when the abrupt bias is 15 m, the effect of Kalman filter error tracking causes historical spoofing to reduce the deviation at the current epoch, resulting in the early detection of spoofing termination by 92.5 s and leading to a missed alarm. Compared to M1, M2 shows increased detection delay for small-magnitude spoofing; its test statistic, influenced by historical spoofed innovations, cannot quickly revert to the nominal state after spoofing termination at 350 s, and consequently, M2 fails to promptly detect the spoofing end.
Figure 8c and Table 4 demonstrate that M3 delivers abrupt spoofing detection capability equivalent to M2. Upon spoofing end at 350 s, M3 instantly detects termination in all typical abrupt cases. The joint detection metric fully capitalizes on the abrupt characteristics of the M1 test statistic at spoofing termination, endowing M3 with exceptional performance in detecting minor spoofing termination under abrupt spoofing scenarios. In abrupt spoofing scenarios, all three methods successfully satisfy the ICAO alert time requirement. Regarding spoofing duration identification accuracy, while M1 exhibits exceptional capability for high-magnitude abrupt spoofing, its missed-detection problem remains non-negligible. M3 achieves significantly higher identification accuracy than M2 while approaching M1’s performance level, concurrently eliminating missed alarm and false alarm issues.
5.2.2. Experiment 7
Between 200 s and 350 s, slowly varying spoofing attacks with pseudorange spoofing rates of 0.2 m/s, 0.5 m/s, and 0.7 m/s were imposed on the visible satellite PRN1, and a simulation was conducted. The variations in the test statistics for M1, M2, and M3 over time are shown in Figure 9, while Table 5 summarizes the simulation results.
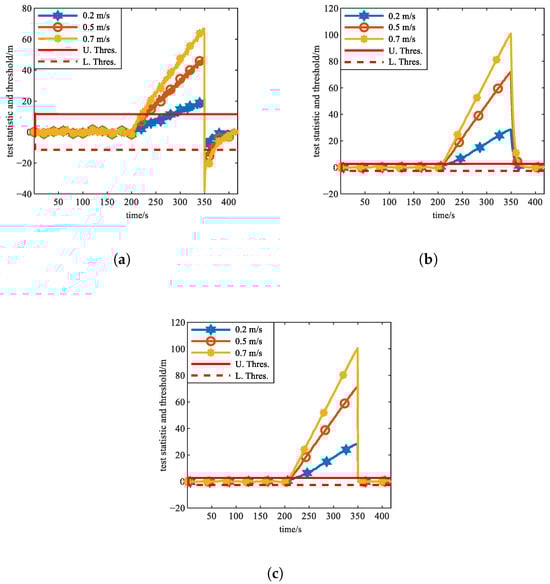
Figure 9.
Simulation results of Experiment 7 (under scenario of slowly varying spoofing). (a) Curves of test statistics and threshold of M1. (b) Curves of test statistics and threshold of M2. (c) Curves of test statistics and threshold of M3.
Table 5.
Comparison of detection performance under slowly varying spoofing scenarios.
Based on Figure 9 and Table 5, M1 exhibits weaker detection performance for slowly varying spoofing attacks, while both M2 and M3 demonstrate stronger detection performance for such scenarios. After spoofing termination at 350 s, both M1 and M3 can rapidly detect the spoofing end, while M2 fails to promptly do so. The spoofing detection delay of all three algorithms decreases as the slowly varying spoofing rate increases. When the spoofing rate remains the same, M2 and M3 have a significantly reduced detection delay compared to M1. Additionally, both M3 and M1 can rapidly detect the end of slowly varying spoofing, whereas M2 exhibits a considerable delay in identifying spoofing termination. M3 fully integrates the sensitivity of M2 to slowly varying spoofing with the advantage of M1 in rapidly detecting spoofing termination, thereby enhancing the detection performance for both the onset and termination of minor spoofing in slowly varying scenarios. Regarding spoofing duration identification performance, M3 achieves significantly more accurate identification than both alternatives.
5.2.3. Experiment 8
Between 200 s and 270 s, slowly varying spoofing attacks with a pseudorange rate of 0.5 m/s were imposed on the visible satellite PRN1, and between 280 s and 350 s, abrupt spoofing attacks with pseudorange bias of 25 m were imposed on PRN1. The simulation was conducted, and the variations in the test statistics for M1, M2, and M3 over time are shown in Figure 10.
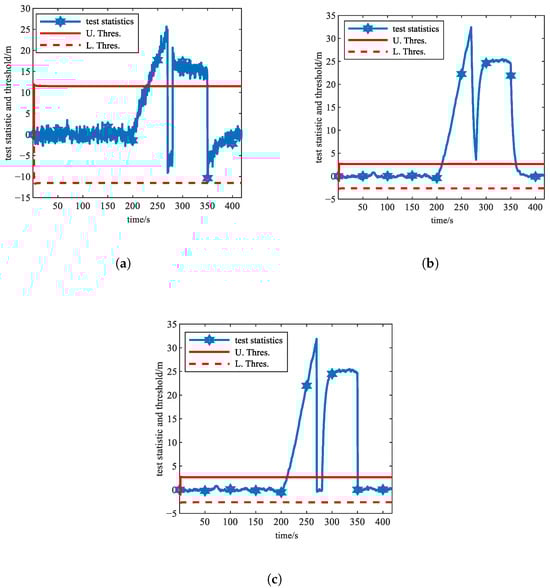
Figure 10.
Simulation results of Experiment 8 (under the scenario of intermittent spoofing attacks). (a) Curves of test statistics and threshold of M1. (b) Curves of test statistics and threshold of M2. (c) Curves of test statistics and threshold of M3.
Figure 10a demonstrates the detection performance of M1 under intermittent spoofing attacks. Since M1 calculates the test statistic solely based on the current epoch’s innovation, it is highly sensitive to abrupt occurrences and terminations of spoofing. It detects the spoofing within 0.01 s after the abrupt spoofing is introduced at 280 s and detects the spoofing termination within 0.01 s after spoofing ends at 270 s and 350 s, respectively. However, its detection performance for slowly varying spoofing introduced at 200 s is poor, as it detects the spoofing only 32.5 s after its introduction, not satisfying the ICAO alert time frame requirement.
Figure 10b illustrates that M2 is more sensitive to the occurrence of slowly varying spoofing. It detects spoofing within 10.01 s after the slowly varying spoofing is introduced at 200 s. However, due to the influence of historical innovations, the test statistic fails to quickly return to a nominal state after spoofing ends at 270 s, leading to false alarms between 270 s and 280 s. Therefore, both M1 and M2 are ill-suited for the real-time detection of intermittent spoofing attacks and accurate spoofing duration identification.
Figure 10c demonstrates that M3, by integrating M2’s robust detection capability for both abrupt and slowly varying spoofing with M1’s exceptional spoofing termination detection characteristics, accurately identifies the initiation and termination of multiple spoofing attacks. This effectively resolves M2’s excessive spoofing end detection latency while eliminating false alarms. Consequently, M3 not only complies with ICAO spoofing alert time frame requirements but also proves highly suitable for detecting multiple spoofing attacks and achieving precise spoofing duration identification under intermittent spoofing scenarios.
6. Conclusions
To enhance the detection performance for minor spoofing termination and thereby enable intermittent minor spoofing detection and spoofing duration identification, this work accomplishes the following:
- A Shewhart control chart-based detection algorithm is proposed to achieve the rapid and precise detection of minor spoofing termination, later utilized as a baseline method for the joint algorithm.
- The limitations of the individually applied EWMA control chart- and robust estimation-based algorithm (M2) and Shewhart control chart-based detection algorithm (M1) are analyzed. A joint spoofing detection algorithm is introduced, integrating dual control charts and robust estimation. Two components, including a joint detection metric for indicating spoofing termination and a spoofing end moment detection method based on sample quantiles, are designed.
- Simulation are subsequently conducted, demonstrating the proposed joint algorithm’s superiority over M1 and M2 across slowly varying, abrupt, and intermittent spoofing attack scenarios due to three key advantages: (1) the timely detection of all minor spoofing while complying with ICAO’s 30 s cruise phase alert requirement; (2) significantly accelerated spoofing termination detection; and (3) effective intermittent minor spoofing detection and accurate duration identification.
Validation was necessarily limited to simulations based on spoofing attacks models due to experimental constraints prohibiting access to authentically captured intermittent minor spoofing data; consequently, testing the joint algorithm’s detection performance using real captured spoofing data will be the focus of future work.
Author Contributions
Conceptualization, L.Z. and X.Y.; Data Curation, W.Y.; Formal Analysis, L.Z., X.Y. and W.Y.; Funding Acquisition, L.Z.; Investigation, X.Y. and W.Y.; Methodology, L.Z. and W.Y.; Software, X.Y.; Validation, X.Y. and W.Y.; Writing—Original Draft, L.Z.; Writing—Review and Editing, L.Z., X.Y. and W.Y. All authors have read and agreed to the published version of the manuscript.
Funding
This research was funded by the National Key Research and Development Program of China (grant number 2020YFB0505603) and the Graduate Student Research Innovation Program of Civil Aviation University of China (grant number 2024YJSKC02004).
Data Availability Statement
The raw data supporting the conclusions of this article will be made available by the authors upon request.
Conflicts of Interest
The authors declare no conflicts of interest.
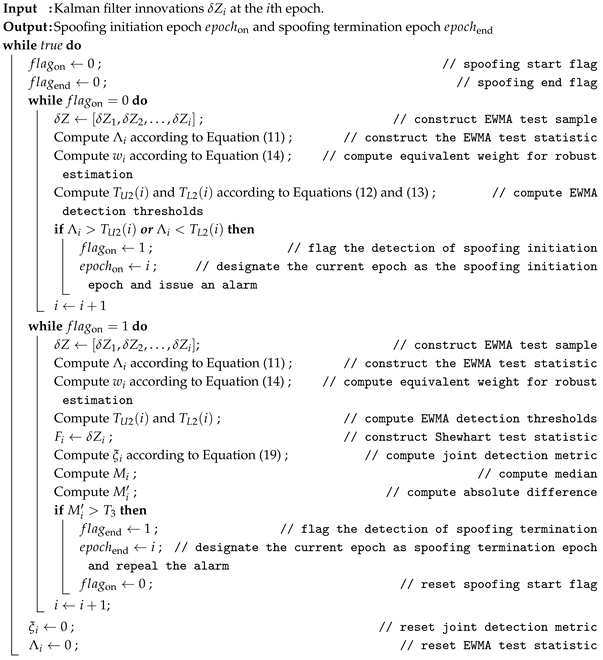
Appendix A. Pseudocode Description of the Joint Spoofing Detection Algorithm
Using single-satellite spoofing detection as an example, a pseudocode description of the joint spoofing detection algorithm is provided.
| Algorithm 1: Joint Spoofing Detection Algorithm Based on Dual Control Charts and Robust Estimation |
 |
References
- Rothmaier, F.; Chen, Y.H.; Lo, S.; Walter, T. GNSS spoofing detection through spatial processing. Navigation 2021, 68, 243–258. [Google Scholar] [CrossRef]
- Jeong, S.; Lee, J. Synthesis algorithm for effective detection of GNSS spoofing attacks. Int. J. Aeronaut. Space Sci. 2020, 21, 251–264. [Google Scholar] [CrossRef]
- Habler, E.; Bitton, R.; Shabtai, A. Assessing Aircraft Security: A comprehensive survey and methodology for evaluation. ACM Comput. Surv. 2023, 56, 96. [Google Scholar] [CrossRef]
- Miralles, D.; Bornot, A.; Rouquette, P.; Levigne, N.; Akos, D.M.; Chen, Y.H.; Lo, S.; Walter, T. An assessment of GPS spoofing detection via radio power and signal quality monitoring for aviation safety operations. IEEE Intell. Transp. Syst. Mag. 2020, 12, 136–146. [Google Scholar] [CrossRef]
- Li, J.; Zhu, X.; Ouyang, M.; Li, W.; Chen, Z.; Dai, Z. Research on multi-peak detection of small delay spoofing signal. IEEE Access 2020, 8, 151777–151787. [Google Scholar] [CrossRef]
- Gu, N.; Xing, F.; You, Z. GNSS Spoofing Detection Based on Coupled Visual/Inertial/GNSS Navigation System. Sensors 2021, 21, 6769. [Google Scholar] [CrossRef]
- Jeong, S.; Kim, M.; Lee, J. CUSUM-based GNSS spoofing detection method for users of GNSS augmentation system. Int. J. Aeronaut. Space Sci. 2020, 21, 513–523. [Google Scholar] [CrossRef]
- Shang, X.; Sun, F.; Liu, B.; Zhang, L.; Cui, J. GNSS spoofing mitigation with a multicorrelator estimator in the tightly coupled INS/GNSS integration. IEEE Trans. Instrum. Meas. 2022, 72, 8500112. [Google Scholar] [CrossRef]
- Jin, X.; Zhang, X.; Li, S.; Zheng, S. Detection of slowly varying spoofing using weighted Kalman gain in GNSS/INS tightly coupled systems. GPS Solut. 2024, 28, 54. [Google Scholar] [CrossRef]
- Liu, Y.; Li, S.; Fu, Q.; Liu, Z. Impact assessment of GNSS spoofing attacks on INS/GNSS integrated navigation system. Sensors 2018, 18, 1433. [Google Scholar] [CrossRef]
- Zhang, C.; Zhao, X.; Pang, C.; Wang, Y.; Zhang, L.; Feng, B. Improved fault detection method based on robust estimation and sliding window test for INS/GNSS integration. J. Navig. 2020, 73, 776–796. [Google Scholar] [CrossRef]
- Yimin, W.; Hong, L.; Mingquan, L. Spoofing profile estimation-based GNSS spoofing identification method for tightly coupled MEMS INS/GNSS integrated navigation system. IET Radar Sonar Navig. 2020, 14, 216–225. [Google Scholar] [CrossRef]
- Kim, D.; Lee, J. Kalman-filter-based integrity evaluation considering fault duration: Application to GNSS-based attitude determination. GPS Solut. 2022, 26, 51. [Google Scholar] [CrossRef]
- Zhong, L.; Yue, W.; Xueyan, L. Spoofing interference detection algorithm based on EWMA control chart and robust estimation. Acta Aeronaut. Astronaut. Sin. 2024, 45, 329655. [Google Scholar]
- Liu, Y.; Li, S.; Fu, Q.; Liu, Z.; Zhou, Q. Analysis of Kalman filter innovation-based GNSS spoofing detection method for INS/GNSS integrated navigation system. IEEE Sens. J. 2019, 19, 5167–5178. [Google Scholar] [CrossRef]
- Liang, W.; Li, K.; Li, Q. Anti-spoofing Kalman filter for GPS/rotational INS integration. Measurement 2022, 193, 110962. [Google Scholar] [CrossRef]
- Zhong, L.; Liu, J.; Li, R.; Wang, R. Approach for detecting soft faults in GPS/INS integrated navigation based on LS-SVM and AIME. J. Navig. 2017, 70, 561–579. [Google Scholar] [CrossRef]
- Zhang, L.; Zhao, H.; Sun, C.; Bai, L.; Feng, W. Enhanced GNSS spoofing detector via multiple-epoch inertial navigation sensor prediction in a tightly-coupled system. IEEE Sens. J. 2022, 22, 8633–8647. [Google Scholar] [CrossRef]
- Ke, Y.; Lv, Z.; Zhang, C.; Deng, X.; Zhou, W.; Song, D. Tightly Coupled GNSS/INS Integration Spoofing Detection Algorithm Based on Innovation Rate Optimization and Robust Estimation. IEEE Access 2022, 10, 72444–72457. [Google Scholar] [CrossRef]
- Jorani, R.M.; Haddar, M.; Chaari, F.; Haddar, M. Gear Crack Detection Based on Vibration Analysis Techniques and Statistical Process Control Charts (SPCC). Machines 2023, 11, 312. [Google Scholar] [CrossRef]
- Harrou, F.; Taghezouit, B.; Khadraoui, S.; Dairi, A.; Sun, Y.; Hadj Arab, A. Ensemble Learning Techniques-Based Monitoring Charts for Fault Detection in Photovoltaic Systems. Energies 2022, 15, 6716. [Google Scholar] [CrossRef]
- Gao, Y.; Li, G. A slowly varying spoofing algorithm avoiding tightly-coupled GNSS/IMU with multiple anti-spoofing techniques. IEEE Trans. Veh. Technol. 2022, 71, 8864–8876. [Google Scholar] [CrossRef]
- Roberts, S. Control chart tests based on geometric moving averages. Technometrics 2000, 42, 97–101. [Google Scholar] [CrossRef]
- Chai, D.; Ning, Y.; Wang, S.; Sang, W.; Xing, J.; Bi, J. A robust algorithm for multi-gnss precise positioning and performance analysis in urban environments. Remote Sens. 2022, 14, 5155. [Google Scholar] [CrossRef]
- Marais, H.L.; Zaccaria, V.; Odlare, M. Comparing statistical process control charts for fault detection in wastewater treatment. Water Sci. Technol. 2022, 85, 1250–1262. [Google Scholar] [CrossRef]
- Morales, V.H.; Panza, C.A. Control Charts for Monitoring the Mean of Skew-Normal Samples. Symmetry 2022, 14, 2302. [Google Scholar] [CrossRef]
- ICAO. International Standards and Recommended Practices: Annex 10 to the Convention on International Civil Aviation, Volume I—Radio Navigation Aids, Amendment 89. International Civil Aviation Organization. 2018. Available online: https://www.icao.int (accessed on 10 March 2025).
- Umsonst, D.; Ruths, J.; Sandberg, H. Finite sample guarantees for quantile estimation: An application to detector threshold tuning. IEEE Trans. Control Syst. Technol. 2022, 31, 921–928. [Google Scholar] [CrossRef]
- Groves, P.D. Principles of GNSS, Inertial, and Multisensor Integrated Navigation Systems, 2nd ed.; Book Review; IEEE Aerospace and Electronic Systems Magazine; Artech: Morristown, NJ, USA, 2015; Volume 30, pp. 26–27. [Google Scholar]
Disclaimer/Publisher’s Note: The statements, opinions and data contained in all publications are solely those of the individual author(s) and contributor(s) and not of MDPI and/or the editor(s). MDPI and/or the editor(s) disclaim responsibility for any injury to people or property resulting from any ideas, methods, instructions or products referred to in the content. |
© 2025 by the authors. Licensee MDPI, Basel, Switzerland. This article is an open access article distributed under the terms and conditions of the Creative Commons Attribution (CC BY) license (https://creativecommons.org/licenses/by/4.0/).