Article

AgriTransformer: A Transformer-Based Model with Attention Mechanisms for Enhanced Multimodal Crop Yield Prediction

by
Luis Jácome Galarza
1,
Miguel Realpe
1,
Marlon Santiago Viñán-Ludeña
2,*,
María Fernanda Calderón
1 and
Silvia Jaramillo
3
1
Escuela Superior Politécnica del Litoral, ESPOL, Facultad de Ingeniería en Electricidad y Computación, CIDIS, Campus Gustavo Galindo, km 30.5 Vía Perimetral, P.O. Box 09-01-5863, Guayaquil 090112, Ecuador
2
Escuela de Ingeniería, Universidad Católica del Norte, Coquimbo 1781421, Chile
3
Business School, Universidad Internacional del Ecuador, Loja 110111, Ecuador
*
Author to whom correspondence should be addressed.
Electronics 2025, 14(12), 2466; https://doi.org/10.3390/electronics14122466
Submission received: 13 May 2025 / Revised: 6 June 2025 / Accepted: 9 June 2025 / Published: 18 June 2025

Abstract

A more accurate crop yield estimation is essential for optimizing agricultural productivity and resource management. Traditional machine learning models, such as linear regression and convolutional neural networks (CNNs), often struggle to integrate multimodal data sources effectively, limiting their predictive accuracy. In this study, we propose the AgriTransformer model, a transformer-based model that enhances crop yield prediction by leveraging attention mechanisms for multimodal data fusion. The AgriTransformer model incorporates tabular agricultural data and vegetation indices (VI), allowing dynamic feature interaction and improved interpretability. Experimental results have demonstrated that AgriTransformer significantly outperforms conventional approaches, achieving an R2 of 0.919, compared to 0.884 for the best-performing linear regression model. The findings highlight the importance of structured tabular data in yield estimation, while VI serves as a complementary feature that increases the prediction capability and confidence. This study highlights the potential of transformer-based architectures in precision agriculture, offering a scalable and adaptable framework for crop yield forecasting. The AgriTransformer model enhances predictive accuracy and generalization across diverse agricultural conditions by prioritizing relevant features through attention mechanisms.

1. Introduction

Estimating crop yield accurately remains a fundamental challenge in agriculture, having a big impact on assuring food security, planting and harvest planning, and the use of pesticides and fertilizers. However, many factors influence crop yield, including soil condition, weather, crop management practices, diseases, and pests. The presence of these elements causes the harvest to present great spatial-temporal variability and is difficult to model jointly, especially in extensive areas [1,2]. Moreover, precise estimation of agricultural production is essential for feeding our growing population [3]. reveals that food demand also refers to producing quality food that contains proteins, vitamins, or minerals. His work encourages us to change our perspective on sustainable agriculture; in these circumstances, forecasting food production is highly pertinent and recommendable.
Traditional prediction models, such as mathematical and statistical methods applied to weather, soil, and management data, or vegetation indices obtained from remote data, often fail to generalize across different regions and crop types. These approaches usually rely on a single data modality and assume linear relationships between variables, limiting their predictive capacity. Following this approach [4], explain that vegetation indices are used with regression methods to forecast the yield of crops, and data mining techniques add information like weather, soil status, or management practices that improve the production estimation.
Likewise [5], explain that satellite images are improving the accuracy of crop production estimation. In their experiments, they used images with resolutions of 250 m, 500 m, and 1 km, where the resolution of 250 m means that a pixel represents an area of 250 × 250 m. The prediction model used regression to estimate the yield having the NDVI (Normalized Difference Vegetation Indices) values as the independent variable, obtaining a coefficient of determination r2 value up to 0.615; this metric is improved when they use higher resolution images; however, it is explained that using satellite images faces challenges like the storage demand, cloudiness, or lack of high-quality images.
Recent studies have utilized machine learning and deep learning approaches, such as random forests, convolutional neural networks, and long short-term memory models, to improve yield estimation [6,7]. While these methods have shown improvements, they often miss the full potential of multimodal data fusion, which is combining structured tabular information (e.g., soil, climate, crop type, water information, or plant data) with unstructured sources like satellite imagery or vegetation indices [8]. Moreover, most models process these modalities independently or simply concatenate them, which fails to capture cross-modal interactions that are crucial for understanding plant development and health.
In this work, we propose AgriTransformer, a deep learning architecture based on cross-modal attention that jointly models tabular data and vegetation indices [9]. By employing a co-attention mechanism, the model can learn interdependencies between variables such as irrigation conditions, crop type, or management practices, and on the other hand, vegetation indices, enabling more accurate yield predictions. Our approach addresses key challenges in yield estimation, including:
  • Integration of heterogeneous data sources.
  • Modeling nonlinear relationships and latent interactions.
  • Enhancing robustness across diverse field conditions.
The AgriTransformer model was evaluated using real-world data from Telangana, India, and demonstrated that it significantly outperforms baseline models in terms of mean squared error and coefficient of determination (R2).

1.1. Related Work

Crop yield estimation has been studied exhaustively using statistical, machine learning, and remote sensing techniques. Early approaches relied on linear regression models using climatic and agronomic variables [10], but these methods usually failed to capture the complex, nonlinear interactions between soil, weather, and crop characteristics.
In order to improve the accuracy of yield estimation, researchers are using machine learning models such as Random Forest [11], Support Vector Regression [12], and Gradient Boosting Machines [13]. Even though these models capture more complex patterns than traditional statistical techniques, they require extensive feature engineering and still operate mainly on tabular data, without taking advantage of spatial and temporal information of imagery from remote sensors.
On the other hand, methods that utilize remote sensor data have been used to monitor crop conditions through vegetation indices such as NDVI, EVI, and SAVI [14]. These indices help assess plant vigor and photosynthetic activity. Although these models provide useful information, they suffer from saturation in dense canopies and are sensitive to atmospheric noise, cloud cover, and low-quality images.
Furthermore, recent deep learning approaches have improved modeling complex data modalities. Convolutional Neural Networks (CNNs) have been applied to satellite imagery for yield prediction [15,16], while Recurrent Neural Networks (RNNs) and LSTMs have been used to capture temporal patterns [17]. However, these methods often treat different modalities (such as images and tabular features) independently or merge them using simple concatenation, ignoring the latent interactions of diverse data modalities.

1.2. The Attention Mechanism in AgriTransformer

The attention mechanism is a key technique in deep learning models like the Transformer architecture, and it assigns different weights to the most relevant parts of the input information. In the context of crop yield estimation, the attention mechanism is used to merge multiple sources of data, such as satellite images, field sensors, and time-series weather data [18].

1.2.1. Types of Attention in Deep Learning

First, we have the Self-Attention mechanism, which is used in models such as Vision Transformers (ViTs) and BERT, which has been widely used in social media data processing, and it allows each input element to interact with every other element, assigning weights according to their importance. The key technique is the scaled-dot product attention, which computes the relevance of each element [19].
Next, we have the Cross-Modal Attention, which has emerged as a powerful solution to fuse multimodal data by learning where and how different modalities influence the outcome [20]. The formula for obtaining cross-attention is similar to the formula of self-attention, with the difference that in cross-attention, the information comes from different sources, where the model uses the decoder’s output to generate the query (Q), and it looks for keys (K) and values (V) that come from the encoder to obtain the answers.
A t t e n t i o n Q , K , V = s o f t m a x Q K T d K V
Certain studies have used the Transformer architecture with agricultural tasks, but their application to yield estimation remains limited. Our work extends this line of research by introducing a co-attention mechanism adapted to the agricultural domain, enabling the model to learn dynamic relationships between vegetation indices and tabular features, such as crop type, irrigation, and crop management practices. This approach allows the model to learn

1.2.2. Comparison with Traditional Methods

Unlike traditional methods that analyze each modality separately, AgriTransformer uses Cross-Modal Attention in order to learn complex relationships between diverse modalities of data, improving the accuracy of yield estimation and being more adaptive to changes in weather and geographic conditions.
This paper continues as follows: in Section 2, we explain the methodology that were used in the project, describe the dataset, and explain the algorithms in detail; in Section 3, we expose the empirical results of the experiments; in Section 4, we analyze the results and support our ideas; finally, in Section 5, we present the conclusions of the research project.

2. Materials and Methods
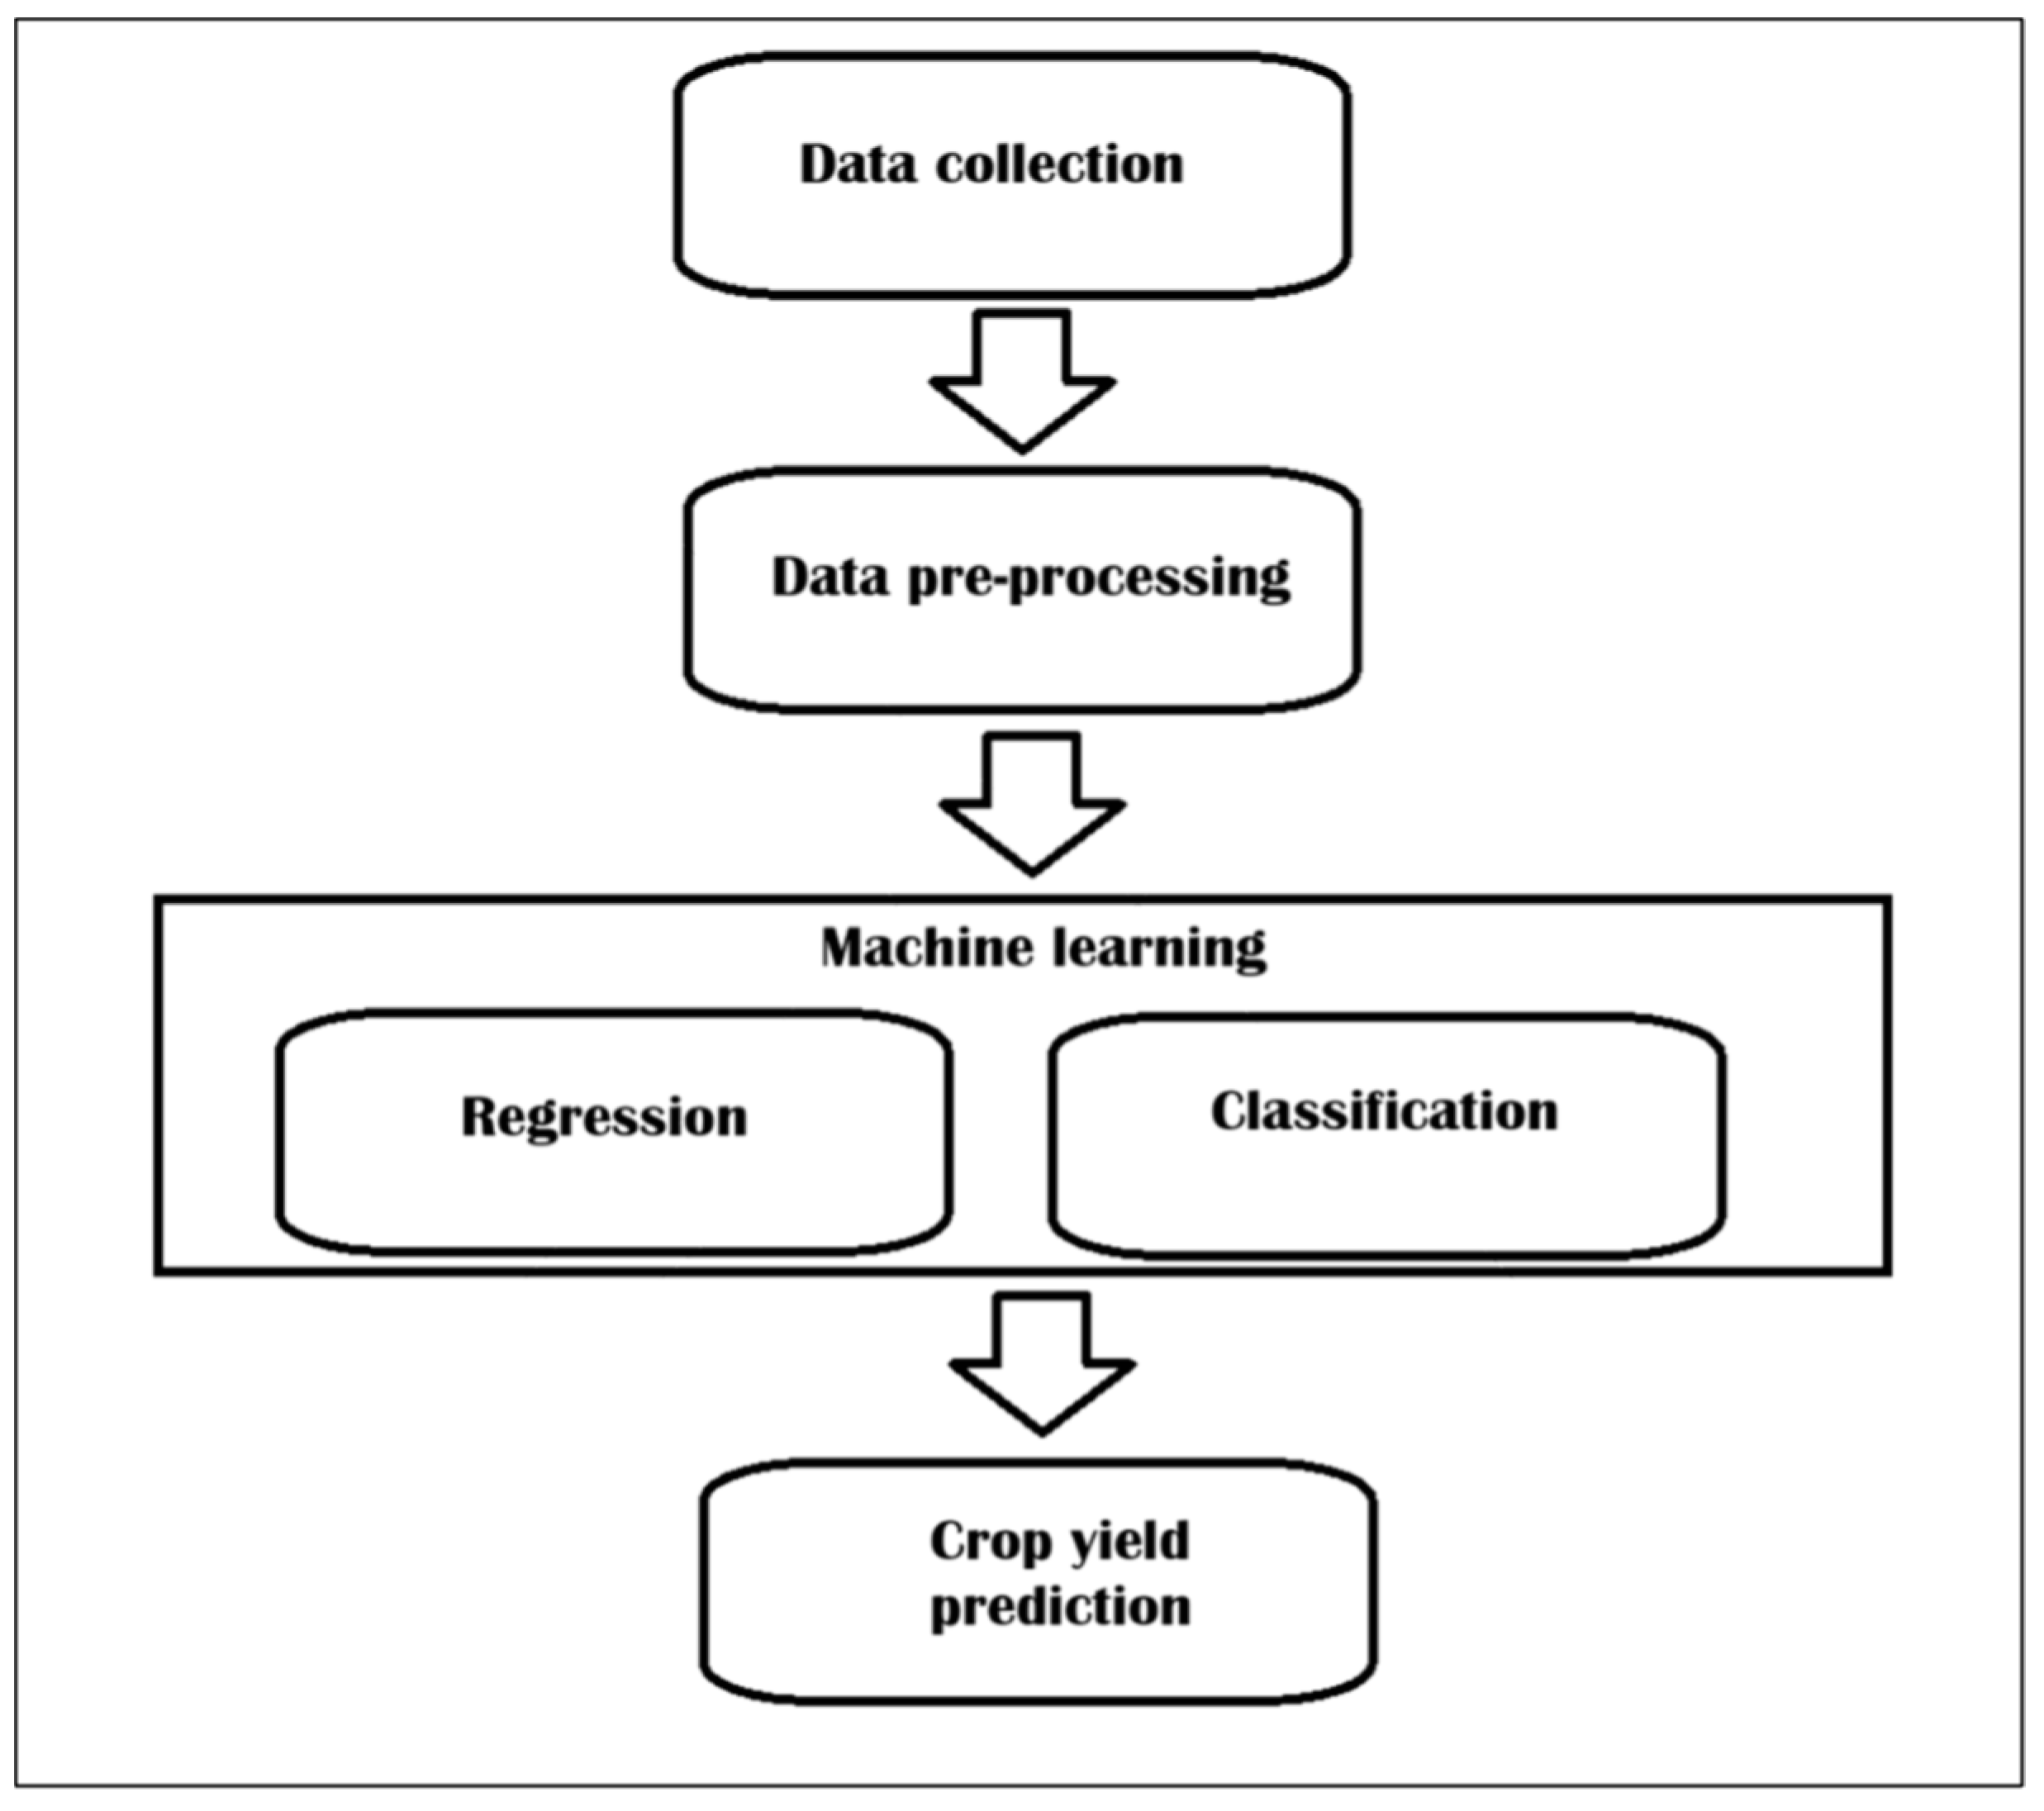
2.1. Methodology

According to [21], the process of machine learning-based crop yield prediction consists of stages like data collection, data pre-processing, building the machine learning model (in this case, it can be a regression model for estimating yield or a classification model for estimating the health of a crop), and making crop yield predictions in a real-world scenario. Figure 1 illustrates the steps taken in the present project for crop yield prediction using machine learning.

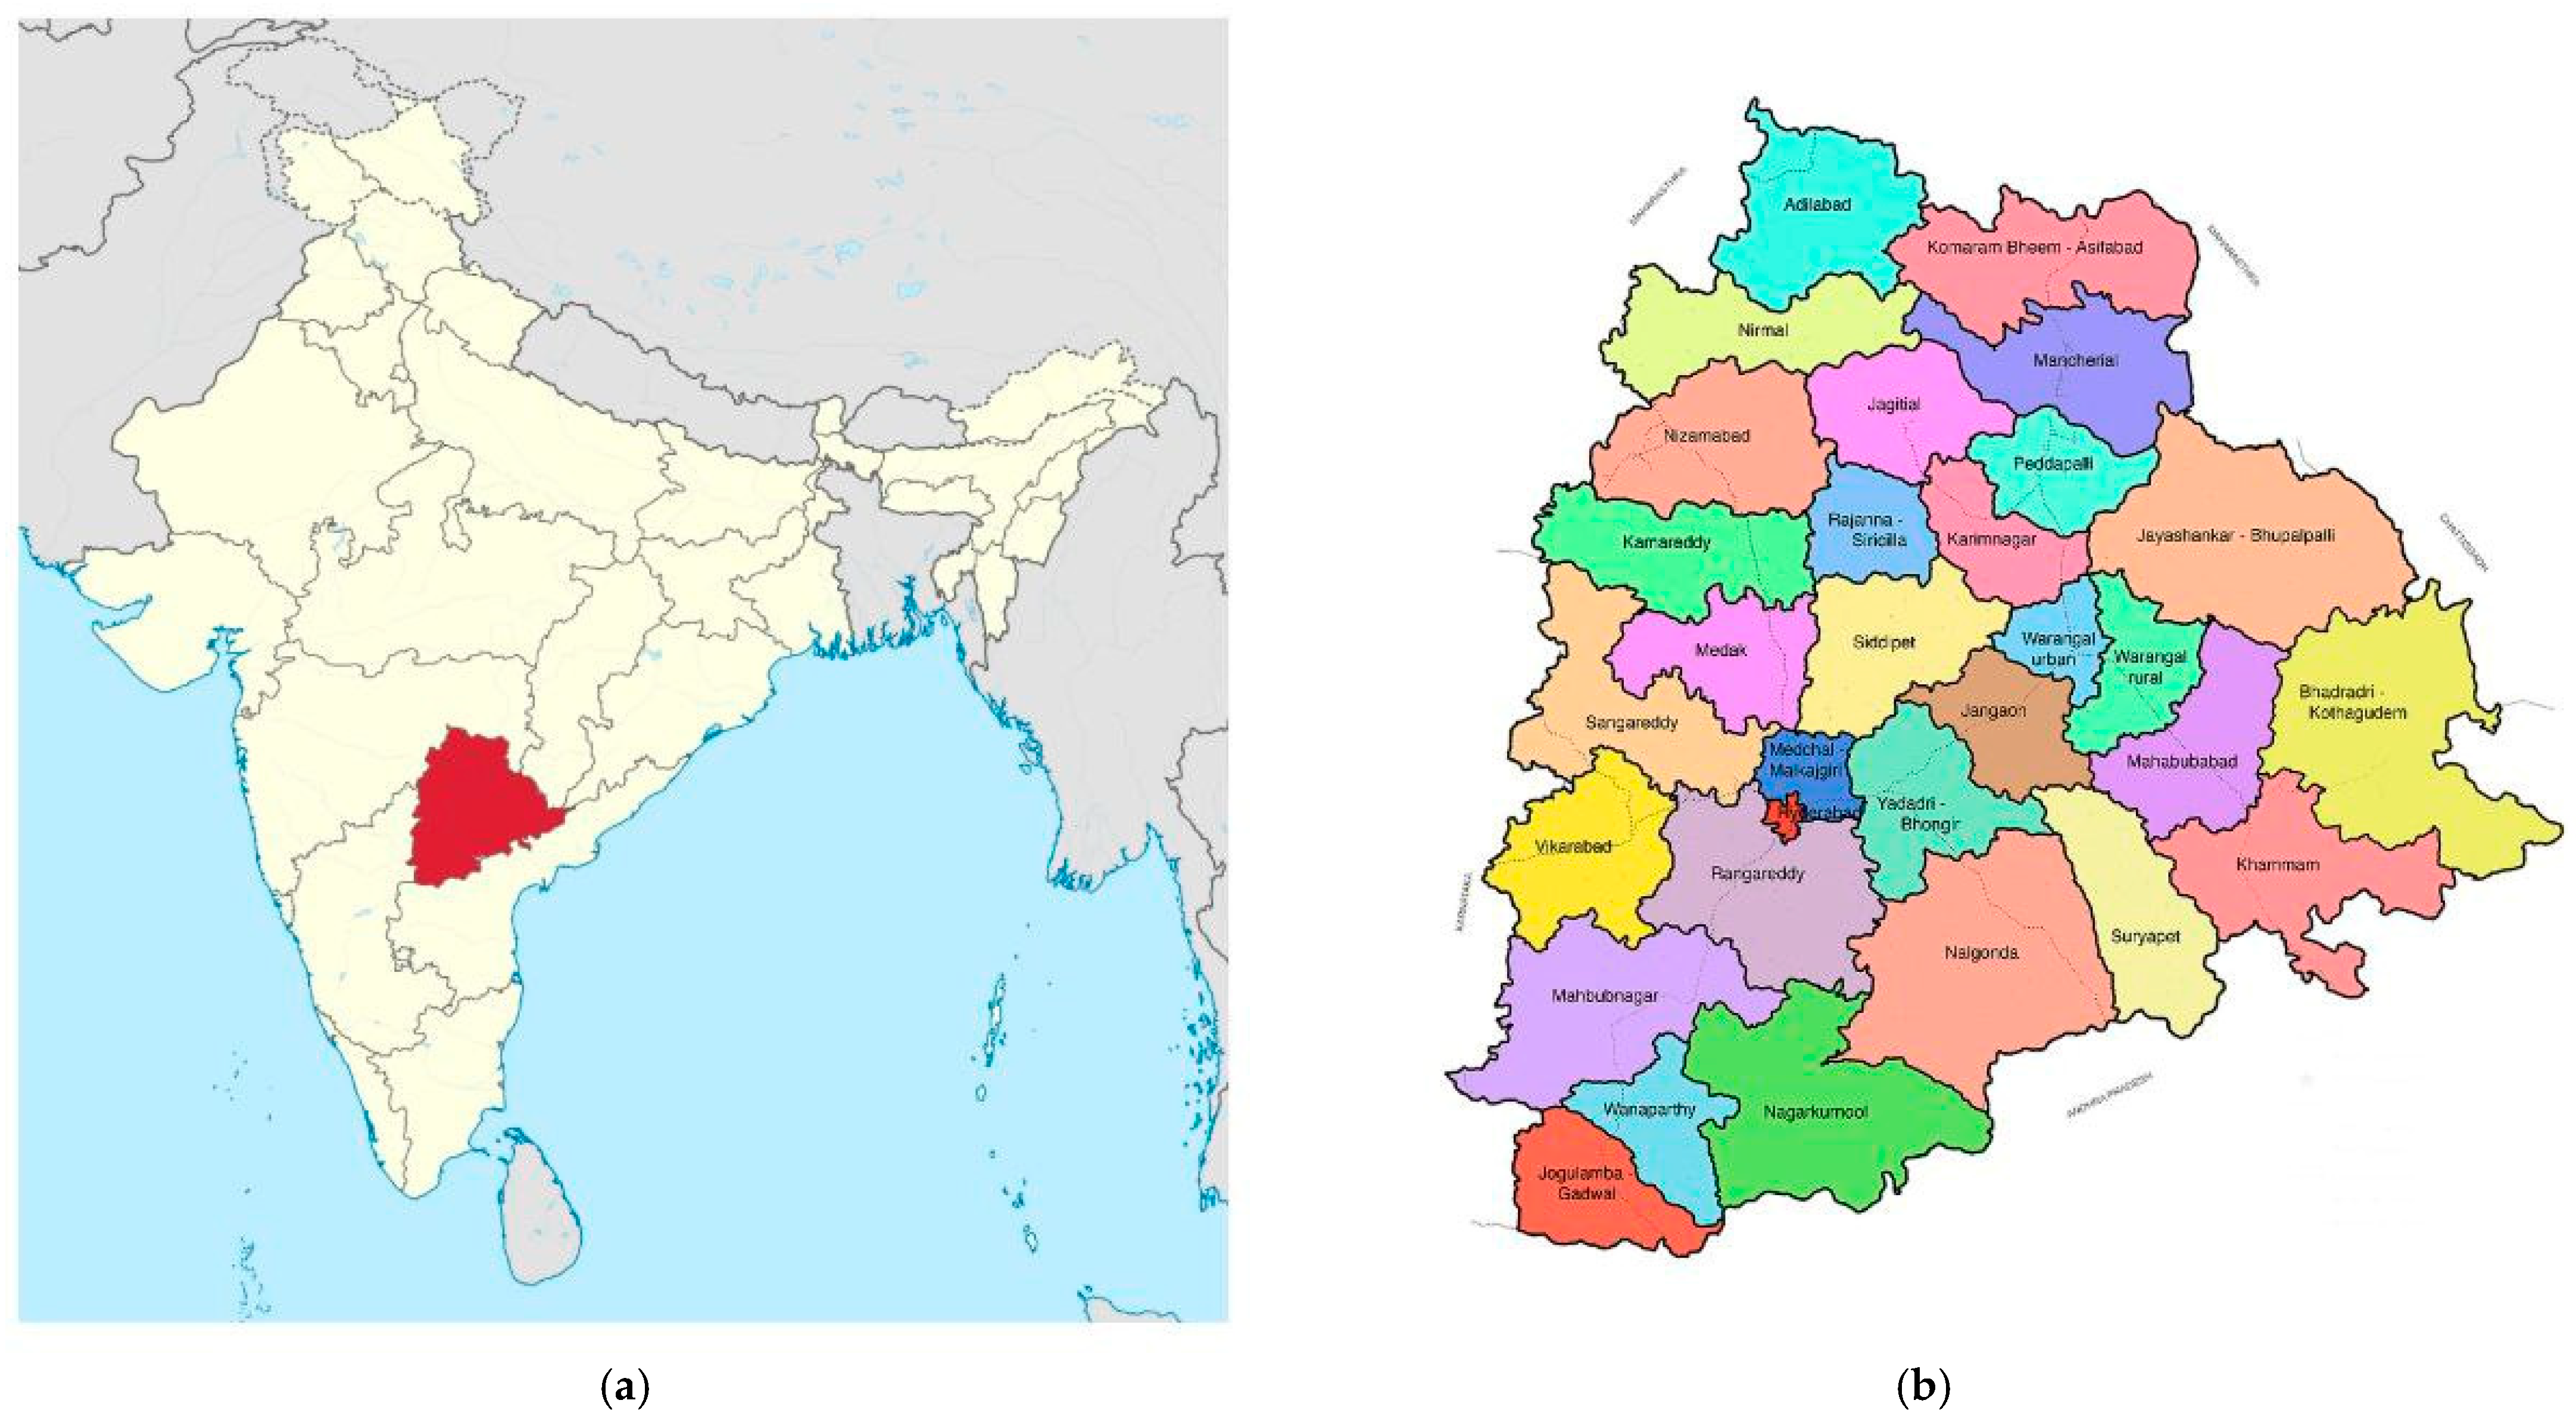
2.2. Description of the Utilised Dataset

The data used for the experiments is the dataset from the Telangana Crop Health Challenge, available on [22]. The dataset contains 10,037 rows with information about the same number of farms located in diverse locations in Telangana state, India (Figure 2).
The dataset contains, on the one hand, farm tabular data such as type of crop, crop cover area, sowing date, harvest date, crop height, condition of crop transpiration, type of irrigation method, irrigation type (possible values: drip, sprinkler, or surface), irrigation source (possible values: canal, borewell, or rainfall), number of times the farm has been irrigated, estimated percentage of the area covered with water due to irrigation, season in which the crop is cultivated, geographical data such as state, district, and sub-district. Among those fields, we considered the “expected yield” field as the target variable, which consists of a numeric value in the unit of hundred weight per acre, which is used in the United Kingdom, where 100 weight equals 112 pounds or 50.8 kg, and an acre equals 4047 square meters. On the other hand, the dataset has the geometry field, which contains the physical coordinates or spatial geometry of the farm location, as seen in Table 1.
With the use of the Shapely library 2.0.3 and the Python language 3.11.13, we could scale those geometries around their centroid point. Having those geographical coordinates and shapes, we used the Google Earth Engine script to download the multispectral images from the Sentinel-2 satellite system. These multispectral images have a spatial resolution of 10 m, and the image for each farm is taken depending on its availability between the crop sowing and harvesting dates. The tabular data, which is a CSV file, was stored in Google Drive, and then we used Google Colaboratory to execute the aforementioned Python script for downloading the multispectral images and storing them in Google Drive.

2.3. Data Pre-Processing

Once we have the data, it comes to the pre-processing stage. We proceeded to remove those rows that had null values and those that had invalid information about the geographical coordinates of the farm. After this step, our dataset contained 7796 rows with tabular information about the agricultural management of the crop and a link to the multispectral image of each row. Figure 3 shows some RGB images and near-infrared images of the farms in the dataset.
As seen in Figure 3, we conducted the processing of multispectral images for obtaining the vegetation indices and used the blue, red, green, and near-infrared channels to obtain the vegetation indices, as shown in Table 2.
After calculating the vegetation indices for each row of the dataset, we included those values and obtained the final dataset with 2 groups of fields: the management practices of the farm (Table 3) and the vegetation indices of that farm (Table 4). It is worth noting that these 2 groups of fields come from heterogeneous sources: tabular data and multispectral images.

2.4. AgriTransformer: Model Description

AgriTransformer is a deep learning architecture designed to improve crop yield estimation by leveraging cross-modal attention [30] to integrate two distinct data sources: tabular agricultural features (e.g., soil, weather, and management) and vegetation indices such as NDVI. The model is inspired by transformer-based attention mechanisms, which have demonstrated strong performance in capturing dependencies across complex, structured inputs.
Our core hypothesis is that joint modeling of these heterogeneous modalities can better capture the plant–environment interaction dynamics that influence yield. Unlike previous methods that treat these modalities independently or combine them through simple concatenation, AgriTransformer employs co-attention blocks to learn relationships between features dynamically.

2.4.1. Input Modalities

  • Tabular data: Structured features such as crop type, irrigation, and management practices.
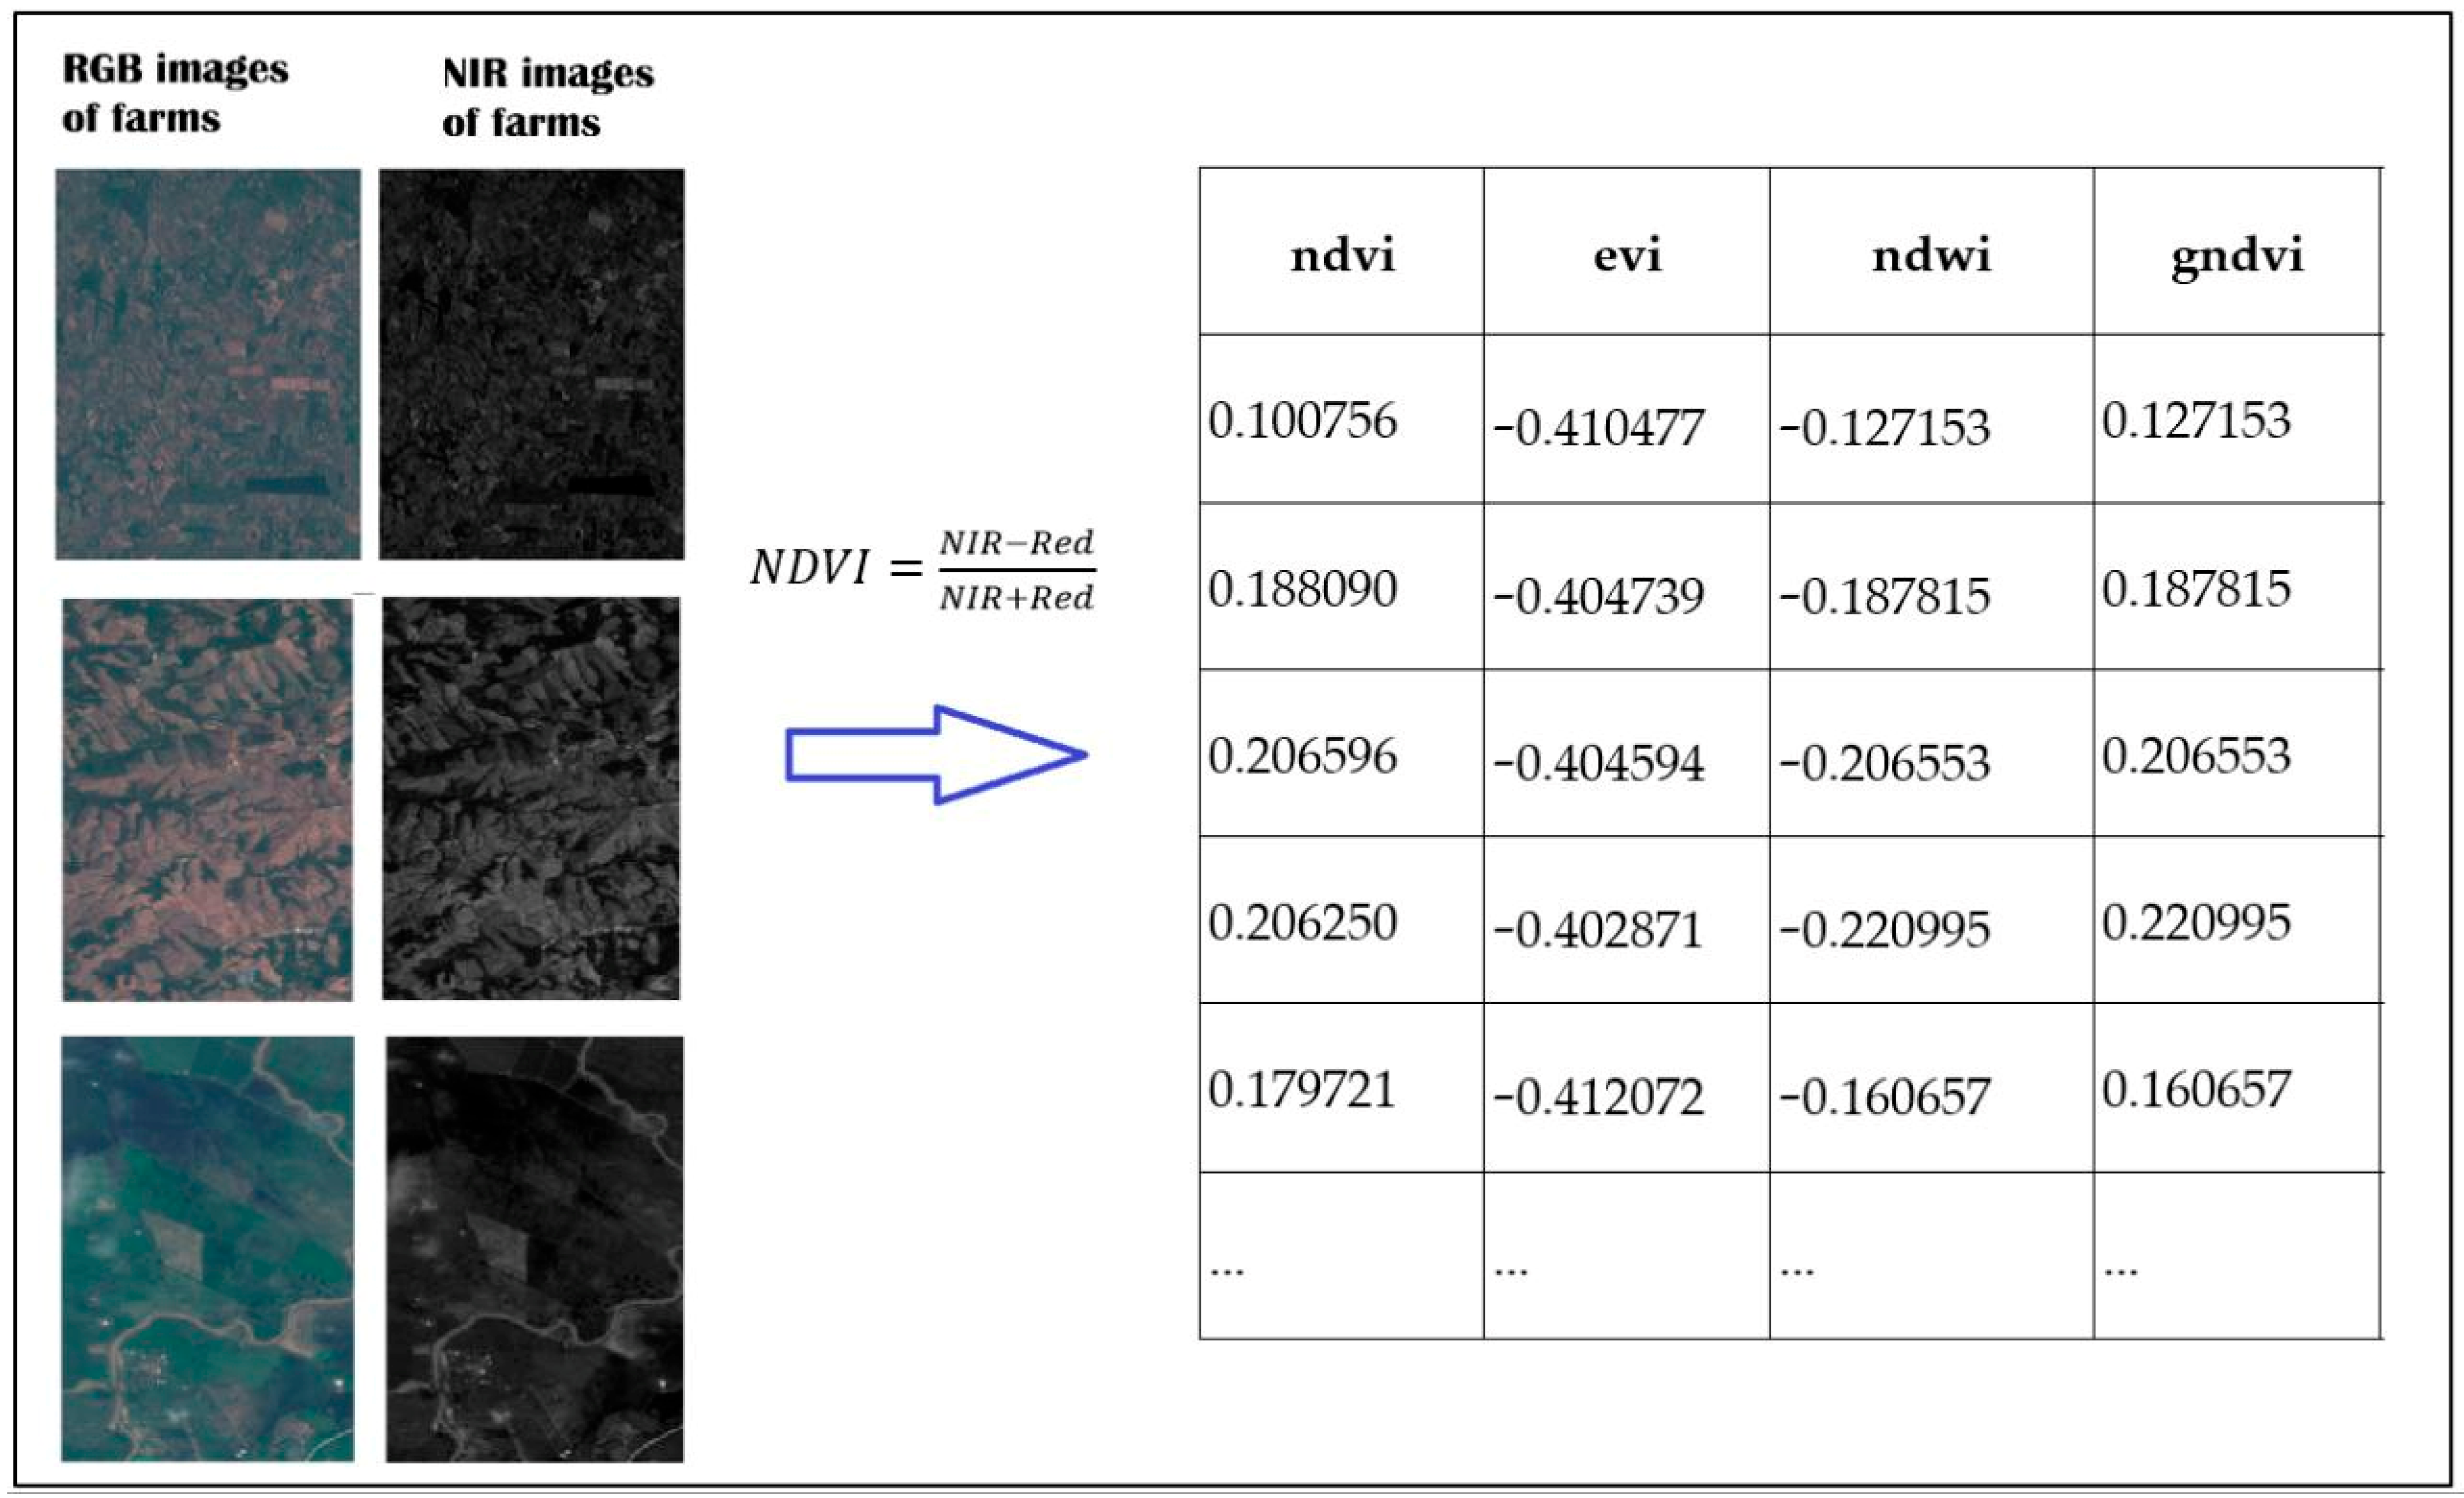
  • Vegetation indices (VIs): Remotely sensed indices of vegetation (e.g., NDVI and EVI) derived from multispectral satellite imagery during the growing season.
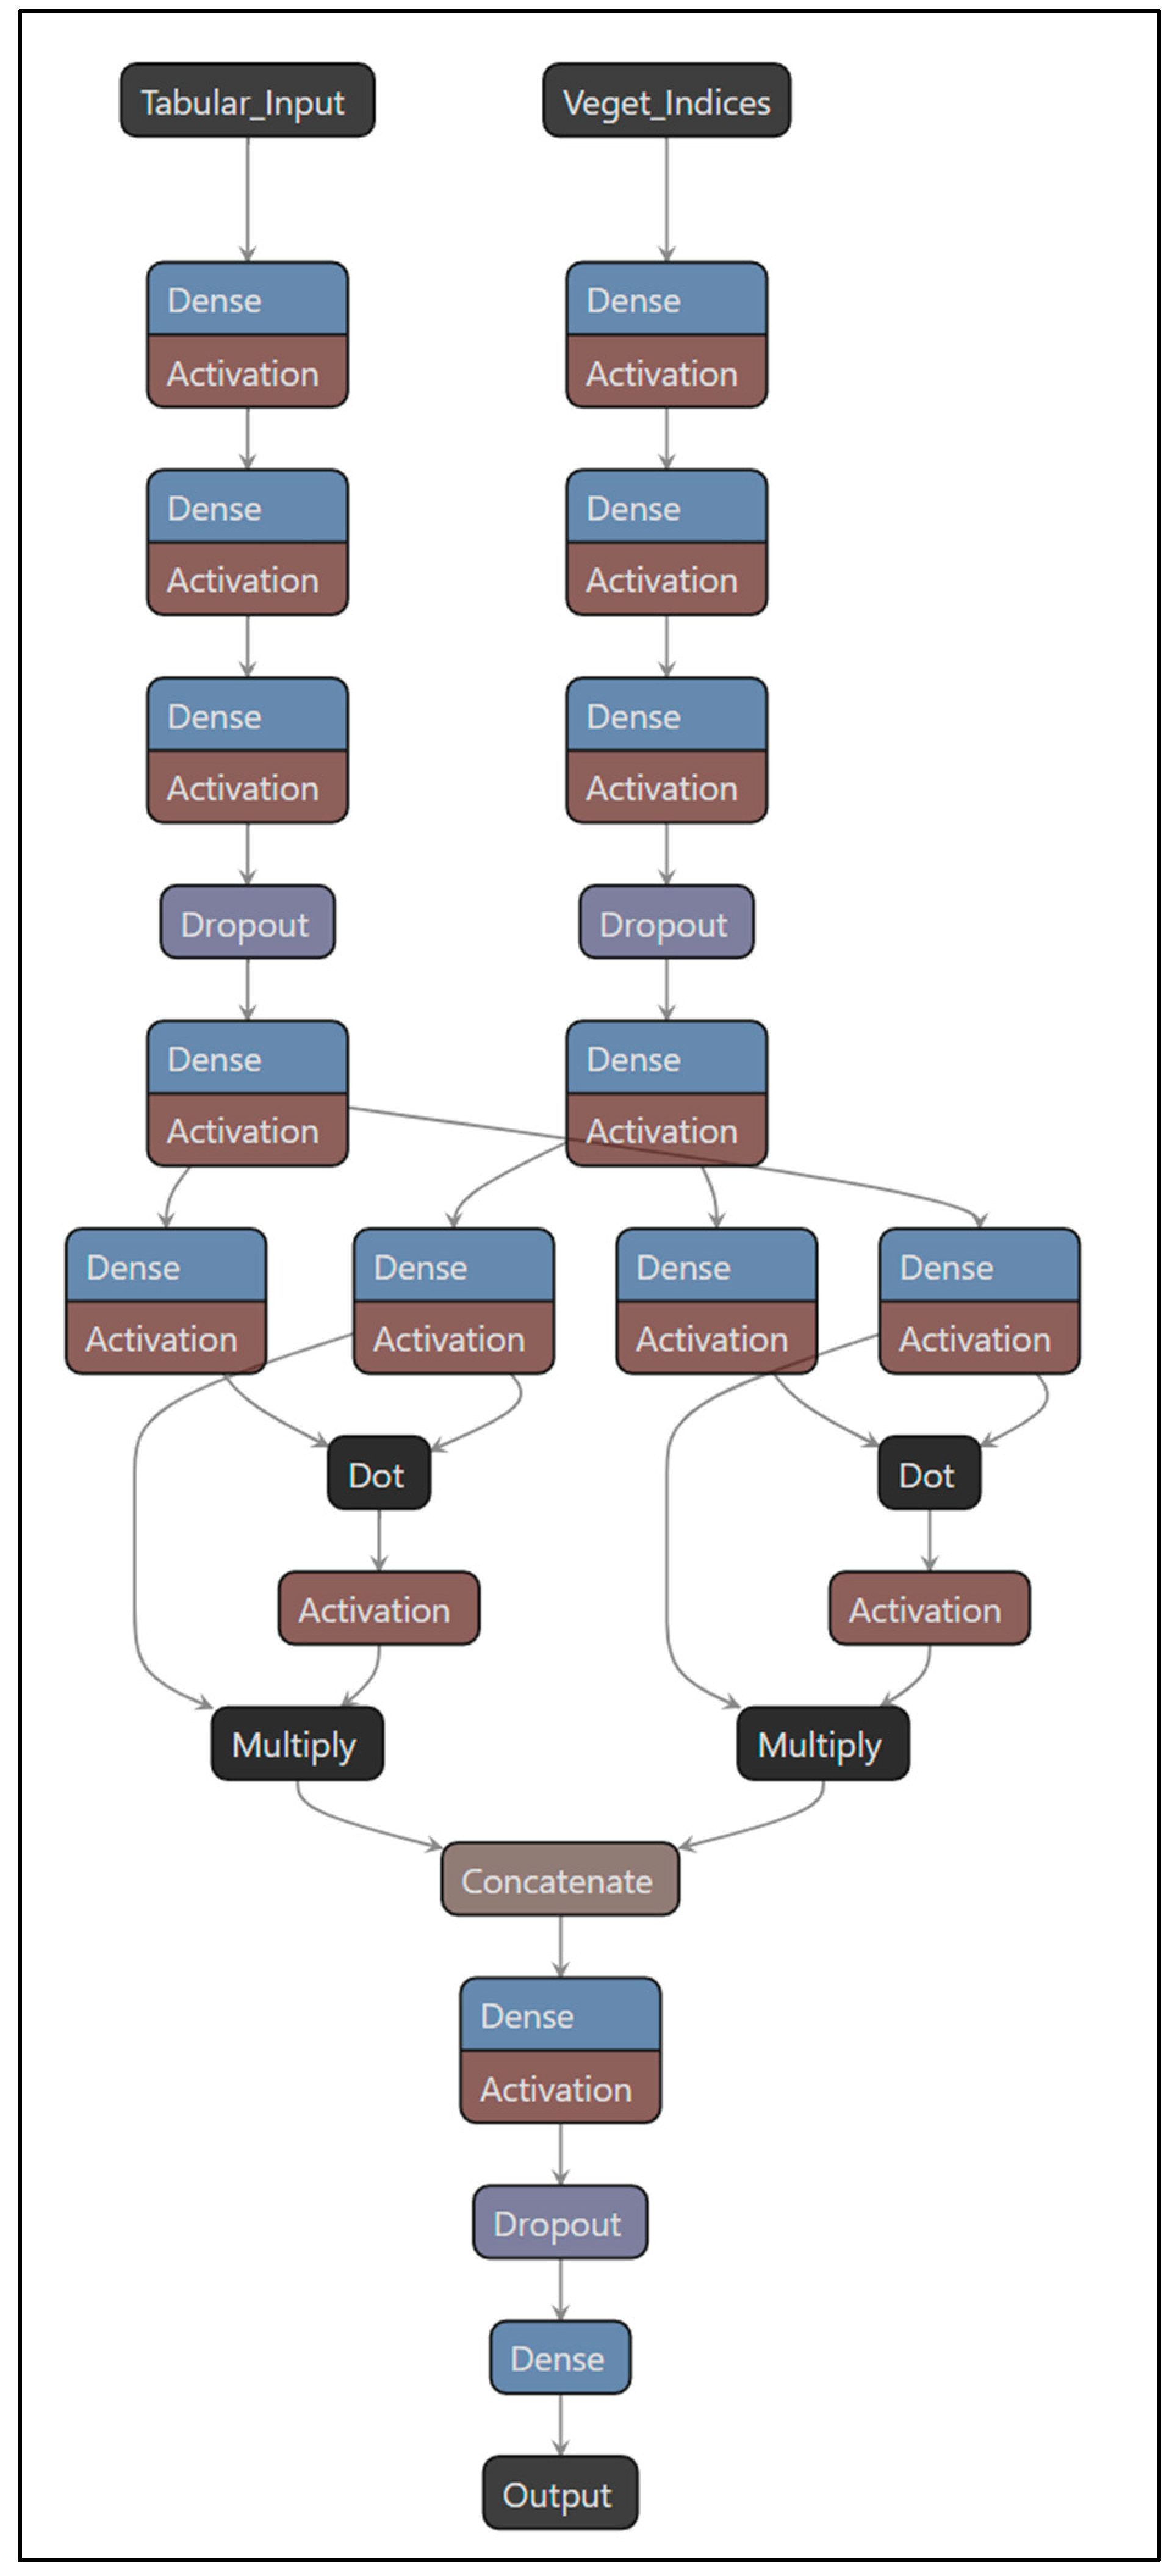
2.4.2. Architecture

The AgriTransformer consists of three main components:
(a)
Embedding layers
  • The tabular features are passed through a dense layer to obtain a fixed-dimensional embedding.
  • The vegetation indices were obtained in a pre-processing stage by the VI formulas described in Table 1.
These branches are processed separately at the first stages of the model.
(b)
Cross-modal co-attention
  • The embeddings from both modalities are input into a co-attention module, adapted from the concept of cross-attention in vision-language models.
  • The dot product calculates the similarities between the projections of each modality [31].
  • Normalization with the softmax function is used, and then the model applies weights with the multiplication operation. This multiplication operation is crucial to determine the relevance of one modality with respect to the other.
  • This mechanism allows the model to attend to relevant VI patterns conditioned on the tabular context, and vice versa.
  • It enables learning interactions such as “how irrigation affects the relationship between NDVI values and final yield.”
(c)
Fusion and prediction
  • The attended representations are concatenated and passed through a feed-forward network (FFN).
  • The model outputs a scalar value representing the predicted crop yield.
Figure 4 shows the AgriTransformer architecture, while Figure 5 shows the variants of the AgriTransformer model.
In Figure 5, the 3 variants of the AgriTransformer model are shown. The first implementation uses vegetation indices attention, in which the model calculates the attention of the tabular data over the vegetation indices data. In the second implementation, the model uses tabular data attention, which similarly obtains the attention of the vegetation indices data over tabular data. Finally, in the third implementation, the model uses co-attention, which combines both vegetation indices attention and tabular data attention.

2.4.3. Training Setup

The AgriTransformer model was trained and fine-tuned using the values shown in Table 5.
We used the Google Colaboratory platform with the Python programming language and the TensorFlow and Keras frameworks for the experiment part. Moreover, we utilized Google Earth Engine Python to obtain the multispectral satellite images of the farms.
In addition, to compare the performance of the AgriTransformer model, we employed both linear regression models and deep learning models. Table 6 shows the parameters of the AgriTransformer and other deep learning models.

2.4.4. Advantages

AgriTransformer enables cross-modal interaction by learning how features across different modalities influence one another, unlike models that process each modality separately. It also enhances interpretability, as attention mechanisms provide insight into which modality holds greater importance. Additionally, its modular design ensures transferability, allowing it to adapt across various crop types and geographical regions.

2.5. Evaluation Metrics of the Model

The AgriTransformer and the baseline models were evaluated on a real-world dataset comprising both tabular agro-environmental features and vegetation indices for crop fields in Telangana, India. We used two standard regression metrics to measure the performance of the estimation models:
  • Mean Squared Error (MSE): Penalizes larger errors.
    M S E = 1 n i = 0 n y i y ^ i 2
  • Coefficient of Determination (R2): Indicates the proportion of variance explained by the model.
    r 2 = 1 y i y ^ i 2 y i y ¯ 2 where : y ¯ = m e a n   o f   a c t u a l   v a l u e s
Each model was evaluated using 10-fold cross-validation to ensure generalizability. We report the mean and standard deviation of MSE and R2 across folds. Additionally, we conducted paired t-tests to assess the statistical significance of differences between AgriTransformer and the best-performing baseline.
In the next section, we present the results of our experiments, which were conducted to evaluate the performance of the AgriTransformer model.

3. Results

3.1. Quantitative Results

To evaluate the performance of the AgriTransformer model, we experimented and compared it with the linear regression baseline algorithm and deep learning models. The experiments with linear regression had three versions of the utilized data (tabular data + vegetation indices, tabular data only, and vegetation indices only), which helped compare the impact of a single modality of data against a multimodality of data. The two deep learning models, deep neural networks and convolutional neural networks, were evaluated using tabular and VI data. For its part, we evaluated the AgriTransformer model with three implementation variants that were described previously: co-attention (Tabular + VI), VI-attention (Tabular + VI), and Tabular-attention (Tabular + VI). Table 7 presents the results of the experimental stage.
The linear regression models exhibited limitations in predictive accuracy, particularly when using only vegetation indices (VI-only), having a high error of MSE = 31.516 and low explanatory power R2 = 0.007. In contrast, combining tabular data with vegetation indices (Tabular + VI) improved the accuracy, with MSE = 9.364 and R2 = 0.704, but it still had lower performance than more advanced models.
The application of deep learning led to a notable reduction in prediction error. The dense neural network achieved an MSE of 3.666 and an R2 of 0.884, indicating a significantly better fit. The 1D convolutional neural network also performed well, though with greater variability in error: MSE = 4.726 and R2 = 0.849.
The AgriTransformer model showed varying performance depending on the attention mechanism used. The Tabular-attention version maintained solid performance with MSE = 5.037 and R2 = 0.841. The VI-attention version performed poorly, with a negative R2 = −0.002, suggesting an inability to model the relationship between variables properly.
The co-attention version was the most effective, achieving the lowest error of MSE = 2.598 and the highest fit of R2 = 0.919, showing its superior ability to integrate and process information efficiently.
The results indicate that deep learning models, particularly the AgriTransformer with co-attention, significantly outperform traditional methods in terms of accuracy and model fit. Moreover, the integration of tabular data and vegetation indices enhances performance in advanced neural networks.
Furthermore, Figure 6 shows graphically the yield prediction of the AgriTransformer model when it is applied to the images of the dataset. It is important to highlight that these predictions are more confident than vegetation indices alone since the forecast is based on richer and diverse information.

3.2. Statistical Significance

To statistically validate the improvement provided by our AgriTransformer model (co-attention) over the best-performing model (dense neural networks), we performed paired hypothesis tests on the cross-validation results (k = 10), using both mean squared error (MSE) and coefficient of determination (R2) as performance metrics.
  • MSE (Mean Squared Error)
  • Paired t-test: p = 0.0023 < 0.01
  • Wilcoxon signed-rank test: p = 0.0059 < 0.01
  • R2 (Coefficient of Determination)
  • Paired t-test: p = 0.0032 < 0.01
  • Wilcoxon signed-rank test: p = 0.0032 < 0.01

3.3. Interpretation

Both the parametric and non-parametric tests indicate highly significant differences (p < 0.01) for both metrics. This confirms that the co-attention variant of the AgroTransformer model, which leverages attention mechanisms over tabular data and vegetation indices, significantly outperforms the other best-performing model with dense neural networks, both in prediction accuracy (lower MSE) and explanatory power (higher R2).

3.4. Data Interpretability

To understand the importance of each feature of the dataset on the prediction model, we implemented the SHAP (SHapley Additive exPlanations) method, which is based on game theory and helps explain the predictions of machine learning models. It assigns a fair contribution to each feature in a model’s prediction using Shapley values. Figure 7 shows the application of SHAP, and we can see the contribution of each feature (tabular features extend from 0 to 15, while VI features extend from 16 to 21). The image reveals that despite the variance of the features, both modalities add moderate to significant value to the prediction model.

3.5. Deployment Validation

The AgriTransformer model was evaluated with a different dataset, which was obtained by the ESPOL (Escuela Superior Politécnica del Litoral) University, located in Guayaquil, Ecuador. The experiments were conducted using 10-fold cross-validation to assess their robustness and generalization capability prior to deployment.
The average MSE across folds was low on average (0.0383), which indicates that the model’s prediction error is moderate. However, the R2 scores were negative across all folds, with an average of -0.5973, indicating that the model consistently underperformed compared to a baseline that simply predicts the mean target value.
Despite an acceptable average MSE, the consistently negative R2 can be explained by the fact that this validation dataset did not have all the fields in which the AgriTransformer was initially trained. Moreover, it is worth noting that the farming conditions were different. Further steps include collecting more diverse samples across seasons, regions, and crop types to capture variability better. It is also important to include relevant agronomic, environmental, or remote sensing features that may improve predictive capability.

4. Discussion

The results demonstrate that the AgriTransformer model significantly improves crop yield estimation by effectively integrating multimodal data sources and cross-modal attention. Compared to traditional linear regression and other deep learning models, AgriTransformer exhibits lower prediction errors and higher explanatory power.
One of the key insights from this study is the role of attention mechanisms in multimodal data fusion. The AgriTransformer variant with co-attention achieved the best performance, suggesting that combining tabular data and vegetation indices provides a more reliable foundation for yield estimation than using single-modal data.
The superior performance of AgriTransformer with co-attention further supports the hypothesis that meaningful interactions between tabular data and vegetation indices enhance predictive accuracy. By allowing features from different modalities to influence one another dynamically, the co-attention mechanism enabled a more comprehensive representation of agricultural conditions. This approach contrasts with traditional models that process each modality separately, often failing to capture complex dependencies between environmental factors and crop health.
Moreover, our model demonstrated superior performance compared to previous approaches, including the work of [5], who utilized satellite imagery to predict crop production and achieved an R2 value of 0.615. In contrast, AgriTransformer, particularly the variant with co-attention, achieved an R2 of 0.919, representing a substantial improvement in predictive accuracy. This difference highlights the advantages of integrating multimodal data sources rather than relying solely on satellite imagery.
The limitations of this paper include that the variability in MSE and R2 across different AgriTransformer variants suggests that attention mechanisms require careful tuning to optimize the performance of the model. Additionally, while AgriTransformer has proved strong generalization power across different crop types and geographical regions, it is necessary to do further validation on larger datasets to confirm its scalability. Future research should explore adaptive attention strategies that dynamically adjust the weighting of different modalities based on environmental conditions and specific characteristics of the crops.

5. Conclusions

In this work, we presented the AgriTransformer model, a novel deep learning architecture for crop yield estimation that utilizes cross-modal attention to integrate tabular agro-environmental features with vegetation indices from satellite multispectral images. Our approach is motivated by the observation that yield is governed by complex, nonlinear interactions between environmental conditions, management practices, and plant physiological responses, patterns that are difficult to model using unimodal approaches.
The ability of AgriTransformer to capture cross-modal interactions allows for a more comprehensive representation of agricultural conditions, improving generalization across different crop types and geographical regions. The modular design of the model ensures adaptability, making it a scalable solution for precision agriculture applications. Furthermore, the results emphasize the effectiveness of attention mechanisms in prioritizing relevant features, demonstrating that transformer-based architectures can outperform conventional machine learning approaches in agricultural modeling.
Overall, AgriTransformer offers a promising foundation for data-driven agricultural decision-making and contributes to a broader effort to develop robust, explainable, and generalizable AI models for sustainable food production.

Author Contributions

Conceptualization, L.J.G. and M.R.; Formal analysis, L.J.G., M.F.C. and M.S.V.-L.; Investigation, L.J.G., M.R. and M.F.C.; Methodology, S.J. and M.R.; Supervision, M.R., M.F.C. and M.S.V.-L.; Writing—original draft, L.J.G.; Writing—review editing, L.J.G., M.S.V.-L. and S.J. All authors have read and agreed to the published version of the manuscript.

Funding

The author(s) declare that no financial support was received for the research and/or publication of this article.

Institutional Review Board Statement

Not applicable.

Informed Consent Statement

Not applicable.

Data Availability Statement

The data presented in this study are available at https://github.com/lrobertojacomeg/multimodal (accessed on 6 June 2025).

Conflicts of Interest

The authors declare no conflicts of interest.

References

  1. Ahn, D.; Kim, S.; Hong, H.; Ko, B. Star-transformer: A spatio-temporal cross attention transformer for human action recognition. In Proceedings of the IEEE/CVF Winter Conference on Applications of Computer Vision 2023, Waikoloa, HI, USA, 2–7 January 2023; pp. 3330–3339. [Google Scholar]
  2. Ajith, S.; Vijayakumar, S.; Elakkiya, N. Yield prediction, pest and disease diagnosis, soil fertility mapping, precision irrigation scheduling, and food quality assessment using machine learning and deep learning algorithms. Discov. Food 2025, 5, 63. [Google Scholar]
  3. Hobbs, P. Conservation agriculture: What is it and why is it important for future sustainable food production? J. Agric. Sci. 2007, 145, 127. [Google Scholar] [CrossRef]
  4. Marshall, M.; Belgiu, M.; Boschetti, M.; Pepe, M.; Stein, A.; Nelson, A. Field-level crop yield estimation with PRISMA and Sentinel-2. ISPRS J. Photogramm. Remote Sens. 2022, 187, 191–210. [Google Scholar] [CrossRef]
  5. Roznik, M.; Boyd, M.; Porth, L. Improving crop yield estimation by applying higher resolution satellite NDVI imagery and high-resolution cropland masks. Remote Sens. Appl. Soc. Environ. 2022, 25, 100693. [Google Scholar] [CrossRef]
  6. Nikhil, U.; Pandiyan, A.; Raja, S.; Stamenkovic, Z. Machine learning-based crop yield prediction in south india: Performance analysis of various models. Computers 2024, 13, 137. [Google Scholar] [CrossRef]
  7. Niu, Z.; Zhong, G.; Yu, H. A review on the attention mechanism of deep learning. Neurocomputing 2021, 452, 48–62. [Google Scholar] [CrossRef]
  8. Oikonomidis, A.; Catal, C.; Kassahun, A. Deep learning for crop yield prediction: A systematic literature review. N. Z. J. Crop Hortic. Sci. 2023, 51, 1–26. [Google Scholar] [CrossRef]
  9. Mingyong, L.; Yewen, L.; Mingyuan, G.; Longfei, M. CLIP-based fusion-modal reconstructing hashing for large-scale unsupervised cross-modal retrieval. Int. J. Multimed. Inf. Retr. 2023, 12, 2. [Google Scholar] [CrossRef]
  10. Bhattacharyya, B.; Biswas, R.; Sujatha, K.; Chiphang, D. Linear regression model to study the effects of weather variables on crop yield in Manipur state. Int. J. Agric. Stat. Sci. 2021, 17, 317–320. [Google Scholar]
  11. Dhillon, M.; Dahms, T.; Kuebert-Flock, C.; Rummler, T.; Arnault, J.; Steffan-Dewenter, I.; Ullmann, T. Integrating random forest and crop modeling improves the crop yield prediction of winter wheat and oil seed rape. Front. Remote Sens. 2023, 3, 1010978. [Google Scholar] [CrossRef]
  12. Kok, Z.; Shariff, A.; Alfatni, M.; Khairunniza-Bejo, S. Support vector machine in precision agriculture: A review. Comput. Electron. Agric. 2021, 191, 106546. [Google Scholar] [CrossRef]
  13. Mahesh, P.; Soundrapandiyan, R. Yield prediction for crops by gradient-based algorithms. PLoS ONE 2024, 19, e0291928. [Google Scholar] [CrossRef] [PubMed]
  14. Anderson, K. Detecting Environmental Stress in Agriculture Using Satellite Imagery and Spectral Indices. Ph.D. Thesis, Obafemi Awolowo University, Ile-Ife, Nigeria, 2024. [Google Scholar]
  15. Peng, M.; Liu, Y.; Khan, A.; Ahmed, B.; Sarker, S.; Ghadi, Y.; Ali, Y. Crop monitoring using remote sensing land use and land change data: Comparative analysis of deep learning methods using pre-trained CNN models. Big Data Res. 2024, 36, 100448. [Google Scholar] [CrossRef]
  16. Petit, O.; Thome, N.; Rambour, C.; Themyr, L.; Collins, T.; Soler, L. U-net transformer: Self and cross attention for medical image segmentation. In Machine Learning in Medical Imaging, Proceedings of the 12th International Workshop, MLMI 2021, Held in Conjunction with MICCAI 2021, Strasbourg, France, 27 September 2021, Proceedings 12; Springer International Publishing: Cham, Switzerland, 2021; pp. 267–276. [Google Scholar]
  17. Rahimi, E.; Jung, C. The efficiency of long short-term memory (LSTM) in phenology-based crop classification. Korean J. Remote Sens. 2024, 40, 57–69. [Google Scholar]
  18. Dieten, J. Attention Mechanisms in Natural Language Processing. Bachelor’s Thesis, University of Twente, Enschede, The Netherlands, 2024. [Google Scholar]
  19. Guo, M.; Xu, T.; Liu, J.; Liu, Z.; Jiang, P.; Mu, T.; Hu, S. Attention mechanisms in computer vision: A survey. Comput. Vis. Media 2022, 8, 331–368. [Google Scholar] [CrossRef]
  20. Lin, H.; Cheng, X.; Wu, X.; Shen, D. Cat: Cross attention in vision transformer. In Proceedings of the 2022 IEEE International Conference on Multimedia and Expo (ICME), Taipei, Taiwan, 18–22 July 2022; pp. 1–6. [Google Scholar]
  21. Rashid, M.; Bari, B.; Yusup, Y.; Kamaruddin, M.; Khan, N. A comprehensive review of crop yield prediction using machine learning approaches with special emphasis on palm oil yield prediction. IEEE Access 2021, 9, 63406–63439. [Google Scholar] [CrossRef]
  22. Kaggle. Telangana Crop Health Challenge. Kaggle. 2024. Available online: https://www.kaggle.com/datasets/adhittio/z-1-telangana-crop-health-challenge (accessed on 1 December 2024).
  23. Pettorelli, N.; Vik, J.; Mysterud, A.; Gaillard, J.; Tucker, C.; Stenseth, N. Using the satellite-derived NDVI to assess ecological responses to environmental change. Trends Ecol. Evol. 2005, 20, 503–510. [Google Scholar] [CrossRef]
  24. Gurung, R.; Breidt, F.; Dutin, A.; Ogle, S. Predicting Enhanced Vegetation Index (EVI) curves for ecosystem modeling applications. Remote Sens. Environ. 2009, 113, 2186–2193. [Google Scholar] [CrossRef]
  25. Ashok, A.; Rani, H.; Jayakumar, K. Monitoring of dynamic wetland changes using NDVI and NDWI based landsat imagery. Remote Sens. Appl. Soc. Environ. 2021, 23, 100547. [Google Scholar] [CrossRef]
  26. Basso, M.; Stocchero, D.; Ventura, R.; Vian, A.; Bredemeier, C.; Konzen, A.; Pignaton de Freitas, E. Proposal for an embedded system architecture using a GNDVI algorithm to support UAV-based agrochemical spraying. Sensors 2019, 19, 5397. [Google Scholar] [CrossRef]
  27. Chen, Z.; Liu, H.; Zhang, L.; Liao, X. Multi-dimensional attention with similarity constraint for weakly-supervised temporal action localization. IEEE Trans. Multimed. 2022, 25, 4349–4360. [Google Scholar] [CrossRef]
  28. Ren, H.; Zhou, G.; Zhang, F. Using negative soil adjustment factor in soil-adjusted vegetation index (SAVI) for aboveground living biomass estimation in arid grasslands. Remote Sens. Environ. 2018, 209, 439–445. [Google Scholar] [CrossRef]
  29. Novando, G.; Arif, D. Comparison of soil adjusted vegetation index (SAVI) and modified soil adjusted vegetation index (MSAVI) methods to view vegetation density in padang city using landsat 8 image. Int. Remote Sens. Appl. J. 2021, 2, 31–36. [Google Scholar] [CrossRef]
  30. Wen, Z.; Lin, W.; Wang, T.; Xu, G. Distract your attention: Multi-head cross attention network for facial expression recognition. Biomimetics 2023, 8, 199. [Google Scholar] [CrossRef]
  31. Soydaner, D. Attention mechanism in neural networks: Where it comes and where it goes. Neural Comput. Appl. 2022, 34, 13371–13385. [Google Scholar] [CrossRef]
Figure 1. General architecture of machine learning-based crop yield prediction [21]. Methodology used in the present project.
Electronics 14 02466 g001
Figure 2. (a) The Telangana state in India and (b) the districts of the Telangana state.
Electronics 14 02466 g002
Figure 3. Samples of satellite RGB and NIR images of farms.
Electronics 14 02466 g003
Figure 4. AgriTransformer model architecture.
Electronics 14 02466 g004
Figure 5. Variants of the AgriTransformer model. (a) Vegetation indices attention. (b) Tabular data attention. (c) Co-attention.
Electronics 14 02466 g005
Figure 6. Yield predictions of the AgriTransformer model.
Electronics 14 02466 g006
Figure 7. Importance of each feature in the predicting model using the SHAP method (Tabular features: 0–15, VI features: 16:21).
Electronics 14 02466 g007
Table 1. Field geometry description on the Telangana Crop Health Challenge dataset.
IndexGeometry
0POLYGON ((78.18143 17.97888, 78.18149 17.97899, 78.18175 17.97887, 78.18166 17.97873, 78.18143 17.97888))
1POLYGON ((78.17545 17.98107, 78.17578 17.98104, 78.17574 17.98086, 78.17545 17.98088, 78.17545 17.98107))
2POLYGON ((78.16914 17.97621, 78.1693 17.97619, 78.16928 17.97597, 78.16911 17.97597, 78.16914 17.97621))
3POLYGON ((78.16889 17.97461, 78.16916 17.97471, 78.16923 17.97456, 78.16895 17.97446, 78.16889 17.97461))
4POLYGON ((78.17264 17.96925, 78.17276 17.96926, 78.17276 17.96913, 78.17273 17.96905, 78.17264 17.96925))
8770POLYGON ((78.79225 19.7354, 78.79276 19.73531, 78.7927 19.73418, 78.79213 19.73423, 78.79225 19.7354))
8771POLYGON ((78.79762 19.75388, 78.79859 19.75375, 78.79853 19.75335, 78.79751 19.75337, 78.79762 19.75388))
8772POLYGON ((78.80798 19.75445, 78.80899 19.75448, 78.80895 19.75415, 78.80795 19.75412, 78.80798 19.75445))
8773POLYGON ((78.80939 19.75338, 78.81022 19.75344, 78.81018 19.75305, 78.80942 19.75302, 78.80939 19.75338))
8774POLYGON ((80.11489 17.37211, 80.11505 17.37208, 80.11508 17.37193, 80.11511 17.37158, 80.11489 17.37211))
Table 2. Description of vegetation indices that were used in the project.
Vegetation IndexUseFormula
NDVI (Normalized Difference Vegetation Index) It is used for assessing the health and density of vegetation [23] N D V I = N I R R e d N I R + R e d (2)
EVI
(Enhanced Vegetation Index)
It is used for adjusting the relation between vegetation and soil or when the NDVI index is not good [24] E V I = G N I R R e d N I R + C 1 R e d C 2 B l u e + L (3)
NDWI
(Normalized Difference Water Index)
It is used to monitor the amount of water on the surface or moisture on the ground [25] N D W I = G r e e n N I R G r e e n + N I R (4)
GNDVI
(Green Normalized Difference Vegetation Index)
It is used to assess the health of vegetation, especially when the NDVI index is not sensitive enough [10,26,27] G N D V I = N I R G r e e n N I R + G r e e n (5)
SAVI
(Soil Adjusted Vegetation Index)
It is used when the soil is visible in satellite images in order to reduce the effect of soil in areas with a low amount of vegetation [28] S A V I = N I R R e d ( 1 + L ) N I R + R e d + L (6)
MSAVI
(Modified Soil Vegetation Index)
It is used in areas with low vegetation amount and to obtain a more accurate assessment of the vegetation [29] M S A V I = 2 N I R + 1 ( 2 N I R + 1 ) 2 8 ( N I R R e d ) 2 (7)
Table 3. The farm management fields of the dataset.
CropStateDistrictSub-DistrictCropCoveredAreaCHeightIrriTypeIrriSourceIrriCountWaterCov
50561975411487
50561825810594
50561929110399
50561915210592
50561945510597
20011788103260
200118111002345
20011686620358
200118410102352
102516010001246
Table 4. Vegetation indices fields of the dataset and the ground truth (ExpYield).
ndvievindwigndvisavimsaviExpYield
0.100756−0.410477−0.1271530.1271530.1509380.18259017
0.188090−0.404739−0.1878150.1878150.2817820.31603515
0.206596−0.404594−0.2065530.2065530.3094910.34144420
0.206250−0.402871−0.2209950.2209950.3089170.34074816
0.179721−0.412072−0.1606570.1606570.2692420.30407220
−0.004249−0.417536−0.0146090.014609−0.006368−0.00852518
−0.006838−0.417692−0.0138660.013866−0.010247−0.01375511
0.059614−0.410222−0.0994420.0994420.0893170.11203214
−0.013908−0.417783−0.0053240.005324−0.020841−0.02815420
0.191313−0.402399−0.2056050.2056050.2866040.3203559
Table 5. Parameters of the AgriTransformer.
AspectValue
OptimizerAdam
Initial learning rate0.001
Search techniqueRandom search
Batch sizes tested32, 16, 12
Epoch numbers tested20, 50, 70
Dropout rate0.10, 0.20, 0.25
Hidden layers3, 4
Random seed configuration42
Dataset split ratio90% train, 10% test
Cross-validation10-fold cross-validation to ensure robustness
Table 6. Parameters of the AgriTransformer and other deep learning models.
Deep Learning ModelHidden LayersHidden NodesActivation FunctionLoss Function
Dense neural networks3128, 64, 32ReluMSE
Convolutional neural networks (1D)364, 128, 64, kernel_size = 3, pool_size = 2ReluMSE
AgriTransformer4 for each branch + 1 after fusion128, 64, 32, 16, 128ReluMSE
Table 7. Vegetation indices fields of the dataset and the ground truth (ExpYield).
ModelMSE (Media)MSE (Std)R2 (Media)R2 (Std)
Linear reg. (Tabular only)9.3990.4060.7030.024
Linear reg. (VI only)31.5162.0080.0070.009
Linear reg. (Tabular + VI)9.3640.4020.7040.024
Dense neural networks (Tabular + VI)3.6660.2190.8840.012
Convolutional neural networks (Tabular + VI)4.7261.2890.8490.054
AgriTransformer with Tabular-attention (Tabular + VI)5.0370.4810.8410.021
AgriTransformer with VI-attention (Tabular + VI)31.8321.833−0.0020.003
AgriTransformer with co-attention (Tabular + VI)2.5980.8160.9190.022
Disclaimer/Publisher’s Note: The statements, opinions and data contained in all publications are solely those of the individual author(s) and contributor(s) and not of MDPI and/or the editor(s). MDPI and/or the editor(s) disclaim responsibility for any injury to people or property resulting from any ideas, methods, instructions or products referred to in the content.

