Article

A Research Study on an Entropy-Weighted Multi-View Fusion Approach for Agricultural WSN Data Based on Fuzzy Clustering

1
School of Information Science and Engineering, Southeast University, Nanjing 211189, China
2
Purple Mountain Laboratories, Nanjing 211111, China
*
Author to whom correspondence should be addressed.
Electronics 2025, 14(12), 2424; https://doi.org/10.3390/electronics14122424
Submission received: 6 May 2025 / Revised: 5 June 2025 / Accepted: 9 June 2025 / Published: 13 June 2025

Abstract

This study proposes an entropy-weighted multi-view collaborative fusion algorithm to address key challenges in agricultural Wireless Sensor Network (WSN) monitoring systems, including high redundancy in multi-modal data, low energy efficiency, and poor cross-parameter adaptability of traditional fusion methods. A fuzzy clustering framework based on principal property selection is established to enable dynamic compression of multi-source heterogeneous data at cluster head nodes. The algorithm innovatively distinguishes between principal and secondary properties based on their contributions to clustering. Clustering is performed using principal properties, allowing data from nodes with similar values to be fused into unified categories, thereby enhancing the reliability of environmental information. Experimental results show that, compared to existing agricultural WSN data fusion algorithms, the proposed method reduces fusion error by an average of 5.6%, lowers the computational complexity of the original multi-view algorithm, and is more suitable for small-sized, low-capacity sensor nodes. Moreover, it has better adaptability to multiple agricultural parameters, reduces network energy consumption, and improves computational accuracy.

1. Introduction

Wireless Sensor Networks (WSNs) in farmland provide essential technical support for monitoring environmental conditions and soil moisture through multi-parameter sensing. Efficient and accurate data collection and processing remain key research priorities. However, agricultural WSN applications face several challenges [1]: First, wide-area monitoring leads to significant spatio-temporal data redundancy. A single sensor node is typically required to collect heterogeneous parameters such as air temperature, humidity, soil moisture, and light intensity. The direct transmission of raw data consumes high energy, which is unsustainable for resource-constrained nodes. Second, dynamic crop growth leads to wireless channel attenuation, increasing the risk of data packet loss. Third, although farmland environments change periodically, crop growth is relatively slow; thus, these changes occur slowly across crop growth cycles. Users are typically concerned with overall environmental trends rather than raw sensor data. Therefore, transmitting unprocessed data not only wastes node energy but also offers limited practical value. Moreover, factors such as crop planting density, plant height, and foliage density further increase the energy consumption of data transmission at sensor nodes. Thus, improving node energy efficiency in agricultural WSNs is theoretically and practically significant.
The emergence of cluster-based wireless sensor network (WSN) architectures has spurred extensive research in this domain [2,3,4]. Under this framework, performing data fusion at cluster head nodes proves crucial for enhancing network energy efficiency. The main existing methods include the following: Gao Hongju et al. [5] proposed a k-means-based algorithm for data fusion at the cluster head node, in which clustering is performed first, and the cluster mean is used as the fusion value. Bhasker et al. [6] proposed a clustering-based data aggregation method for WSNs in agricultural irrigation management, aiming to optimize the data aggregation process and reduce data transmission overhead. Kong et al. [7] proposed a spatial–temporal improved compressed sensing and reconstruction method to address high data loss rates. The analyzed reconstruction accuracy from single-parameter and multi-parameter perspectives. Sun et al. [8] proposed a block-sparse Bayesian learning (BSBL) algorithm that uses block properties and intrinsic structures to reconstruct sparse coefficients and recover original signals. Qurabat et al. [9] presented a data aggregation approach based on important extrema points extraction, which reduces transmission volume while preserving key data features. Alper et al. [10] developed a two-tier distributed fuzzy logic protocol that enhances data transmission and aggregation between sensor nodes through a hierarchical structure and fuzzy logic mechanisms. Sreedevi et al. [11] introduced a method that integrates energy-efficient clustering, mobile agents, and the PSOGA algorithm for data aggregation and Sink node location optimization, thereby improving overall WSN performance. Compression and reconstruction methods based on multi-parameter sensing and data-block-sparsity have become research hotspots.
However, traditional static-data-based compressed sensing methods cannot capture the dynamic nature of agricultural IoT data. Moreover, the high computational complexity of dynamic compressed sensing algorithms limits their applicability in resource-constrained agricultural WSNs. Gao Feng et al. [12] used an adaptive weighting method to achieve high-precision fusion estimates using sensor-collected data, under the assumption that observation errors follow zero-mean stationary noise. In fact, single-source data fusion is often ineffective for complex farmland environments. With the widespread deployment of the multi-sensor system, data from different sensors play a key role in analyzing crop spatial distribution and temporal dynamics. Thus, multi-source data fusion has become increasingly important in farmland monitoring, as it helps overcome the limitations of single-source data and classification methods.
In recent years, both domestic and international studies have explored agricultural environmental information extraction methods based on multi-source data fusion. Aditya et al. [13] proposed a feature selection and extraction strategy for agricultural applications by integrating an improved genetic algorithm with weighted principal component analysis. They collected and preprocessed multi-source data from agricultural WSNs, covering meteorological, soil, and crop growth data. The genetic algorithm was optimized through adaptive crossover and mutation operations, and feature weighting was applied according to importance to better retain crucial information. Torres et al. [14] introduced a multilevel data fusion method for IoT-based smart agriculture, aiming to enhance data accuracy and integrity by integrating information from multiple hierarchical sources. Sun et al. [15] developed a multi-sensor data fusion algorithm based on trust degree and an improved genetic algorithm, which evaluates the credibility of sensor data and utilizes the optimization capability of the algorithm to achieve effective multi-source data fusion. Yang et al. [16] presented a random forest model for corn yield prediction based on multi-source information fusion. This model incorporates data from various sources, such as drone images, satellite images, meteorological data, and soil data, to comprehensively capture the factors affecting corn yield. However, most existing studies remain focused on single-source data, with classification and fusion processes treated separately, which often limits their ability to accurately represent complex environmental information. Currently, no universal method exists for multi-source data fusion. Commonly used approaches include coefficient-based methods, parameter estimation techniques, Dempster–Shafer evidential reasoning, Kalman filtering, and rough set theory. Despite their differences, these methods share a common drawback: they do not consider different clustering characteristics of various attributes, often missing valuable classification opportunities. Table 1 illustrates the aforementioned methods along with their inherent limitations.
To address the aforementioned issues while incorporating the characteristic attributes of farmland environments, multi-view fuzzy clustering technology is introduced into the data fusion research of wireless sensor networks (WSNs) for agricultural applications. This approach performs clustering of multi-source heterogeneous data at cluster heads, followed by data fusion through intra-cluster averaging. This technology analyzes data samples constructed from multiple perspectives of the same object. It uses a collaborative and interactive processing model to search for similarities among different views, yielding a globally consistent classification result [17].
In agricultural WSNs, node deployment density varies by crop type. This inevitably creates localized pockets of excessive node density, where closely located nodes produce highly redundant data within the same duty cycle. The communication module is the primary energy consumer in a sensor node’s operational components. Directly transmitting large volumes of redundant data would substantially deplete network energy. By adopting data fusion techniques to eliminate redundancy, we can significantly reduce data transmission volume, thus prolonging the overall network lifetime. Different data fusion methods exhibit varying accuracy levels. Only by continuously improving fusion accuracy can we further reduce transmission energy consumption. To address the unique requirements of data fusion in agricultural scenarios, this paper presents a multi-view fuzzy clustering method tailored for agricultural clustered networks. The method groups data with similar parameters into the same category and takes the average of each attribute within a cluster as the final fusion value, thereby reducing data transmission and eliminating redundancy. To ensure both efficiency and accuracy, the algorithm first removes redundant attributes. It then assigns view weights by analyzing the similarity among multi-view parameters, highlighting the best clustering view while ensuring consistent sample partitioning across views. As a result, the fusion outcomes are more accurate, reasonable, and valuable for global decision-making compared to existing algorithms.
The key contributions of this study are as follows: (1) Proposing an entropy-weighted view collaboration mechanism to improve consistency in cross-parameter data fusion; (2) Developing an energy-aware mechanism to reduce algorithm complexity while maintaining low parameter estimation errors; (3) Reducing node energy consumption for transmitting effective data under power constraints, thereby extending the system’s lifespan and supporting long-term stable operation.

2. Introduction to the Entropy Weight-Collaborative Partition Multi-View Fuzzy Clustering Algorithm

The Entropy Weight-Collaborative Partition Multi-View Fuzzy Clustering Algorithm (EW-CoP-MVFCM) is built on the Fuzzy C-means (FCM) algorithm [18]. Unlike hard-clustering methods, such as k-means, fuzzy clustering offers greater flexibility by assigning each sample a membership degree to every cluster within the interval [0, 1], indicating the degree of association between samples and cluster centers. This allows for the effective clustering of datasets with overlapping classes. In recent years, multi-view clustering techniques, such as EM, Co-EM, and Co-FKM algorithms [19], have been developed. However, these methods suffer from two major limitations: (1) the learning rules between different views are simple and lack physical explanation, so the similarity between views is not fully explored; (2) they ignore the varying importance of different views, resulting in suboptimal clustering performance and limited adaptability.
Given the data sample X = { x 1 , , x N } R N × D , where N denotes the sample size and D the dimensionality. Let U = [ μ i j ] R C × N be the fuzzy partition matrix over sample X , C the desired number of clusters, and V = [ v i ] R C × D the cluster prototypes. The objective function of the EW-CoP-MVFCM algorithm is formulated as:
J U , V , W = k = 1 K w k i = 1 C j = 1 N μ i j , k m x j , k v i , k 2 + λ 1 Θ k + λ 2 k = 1 K w k ln w k s . t . μ i j , k 0 , 1 , i = 1 C μ i j , k = 1   and   k = 1 K w k = 1,1 j N , 1 k K
where v i = ( ν i 1 , , ν i k ) is the prototype of the i -th cluster, μ i j denotes the membership degree of the j -th sample to cluster i , m is the fuzzy weighting exponent, and X j represents the j -th data point.
The EW-CoP-MVFCM algorithm performs multi-view collaborative clustering based on the Havrda–Charvat entropy theory. It mainly uses multi-view space partitioning to identify inter-view similarities and achieve consistent final clustering across views [20,21]. In Equation (1), the multi-view collaborative clustering component based on the Havrda–Charvat entropy theory is defined as:
T 1 U , V , X = i = 1 C   j = 1 N   μ i j , k n x j , k v i , k 2 + λ 1 Θ k
Θ k = 1 η 1 1 2 1 m i = 1 C   j = 1 N   μ i j , k m 1 + η 1 1 2 1 m 1 K 1 k = 1 , K   i = 1 C   j = 1 N   μ i j , k m 1
The parameter η regulates cross-view membership partition consistency as a collaborative learning parameter.
It also uses adaptive view-weighted distance calculations based on maximum entropy theory to control the weight relationship of attributes during clustering. The optimal partitioning result is obtained according to the view weight matrix [22,23].
In Equation (1), the adaptive view-weighting component derived from maximum entropy theory is formulated as:
T 2 U , V , X , W = k = 1 K   w k T 1 U , V , X + k = 1 K   w k ln w k
Each time new data is received, the relationships among views are evaluated using the Havrda–Charvat entropy theory, and the weight of each view is calculated based on the maximum entropy theory. After iterative optimization, the best view partitioning result is obtained according to the learned weight matrix. By re-evaluating the importance of each view and discarding the previous notion of equal view contribution, this method more effectively achieves accurate multi-view classification.

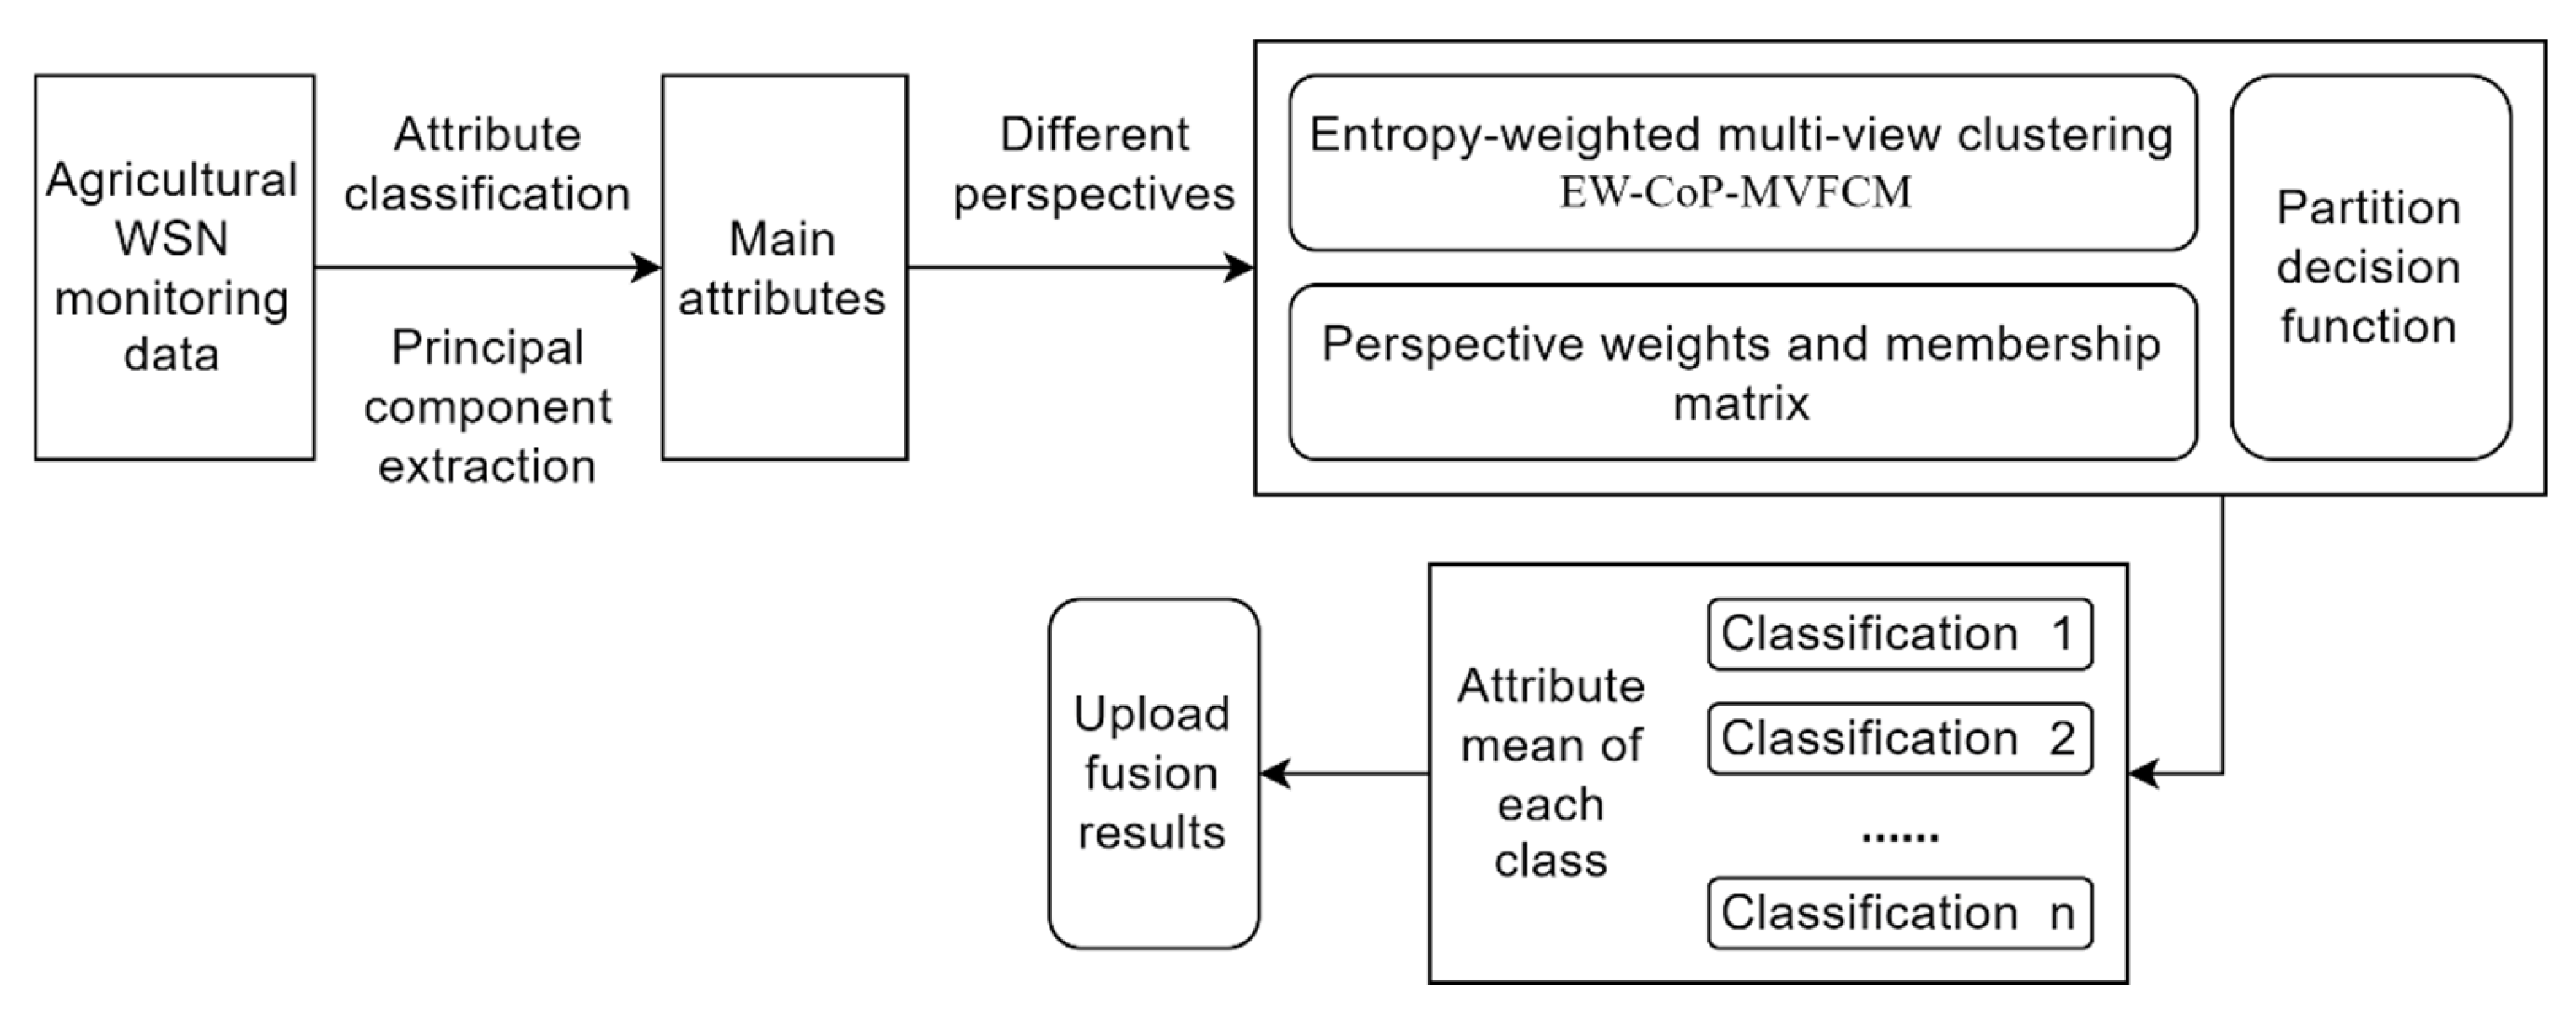
3. Multi-View Data Fusion Algorithm Based on Main Attributes

Agricultural wireless sensor networks generate large volumes of data with high redundancy and diverse parameters [24]. Although entropy-weighted multi-view clustering methods offer improved accuracy, they are computationally expensive and, therefore, unsuitable for WSNs with limited node capabilities. To address this limitation, this paper proposes a multi-view clustering data fusion based on the Main Attributes (MA-MVFCM-DF) algorithm.

3.1. Attribute Reduction

The MA-MVFCM-DF algorithm improves upon the EW-CoP-MVFCM algorithm by selecting attributes that contribute most to clustering, thereby reducing redundancy. It uses the main attributes based on their variance through the following steps:
(1)
Normalizes all attributes and calculates their variances;
(2)
Defines a variance threshold m0; attributes with variance above m0 are main attributes, others are secondary.

3.2. Parameters Setting

Given the data sample X , the objective function of conventional single-view FCM is formulated as:
J F C M U , V = i = 1 D j = 1 N μ i j m x j v i , μ i j 0 , 1 and   μ i j = 1
where N is the sample size, D the number of clusters, U the fuzzy partition matrix over the samples, V the cluster prototypes, μ i j the membership degree of the j -th sample to the i -th cluster, and m the fuzzy weighting exponent.
Given any fuzzy partition c generated by the algorithm, its partition entropy is defined as:
H m U , c = i = 1 D j = 1 N μ i j log α ( μ i j ) N
Here, α is a constant greater than 1, typically taken as α = 1.5. Minimized H m ( U , c ) indicates optimal partition quality.
The single-view data fusion method, FCM algorithm, suffers from limitations such as difficulty in determining fuzzy control parameters and low class discrimination near decision boundaries [25]. Additionally, the fuzziness degree and the number of clusters can significantly influence the clustering results. To address these issues, this study classifies attributes related to climate and soil moisture, removing secondary attributes during the clustering process. The processed MA-MVFCM-DF algorithm may use fewer than three attributes for clustering. The fuzzy weighting exponent strategy in the EW-CoP-MVFCM algorithm is defined as follows:
m = min ( N , D 1 ) min ( N , D 1 ) 2
The requirement must be met to avoid denominators of zero or negative values when D = 3 , which would cause the parameter-seeking formula to fail. The fuzzy weighting exponent controls the sharing between classes. A suitable m value is essential for the FCM algorithm [26,27]. However, this strategy does not fit the MA-MVFCM-DF algorithm, which uses main attributes for multi-view clustering. Theoretical and practical analyses show that as m increases, the objective function decreases, and larger m values suppress noise. So, higher m values are preferred. But m also affects the fuzziness of clustering results. Larger m values make results more fuzzy, so excessively large values of m are undesirable. Therefore, fuzzy decision-making theory is used to optimize the selection of the fuzzy weighting exponent m. Define the fuzzy objective G as the minimized objective function J ( U , v ) , and the fuzzy constraint C as the minimized fuzzy clustering partition entropy H ( U , c ) . This transforms the determination of the optimal fuzzy weighting exponent m into a constrained optimization problem. First, define the fuzzy membership function of the fuzzy goal G:
μ G m = exp α × J m U , v m a x m J m U , v
The fuzzy membership function of the fuzzy constraint C is defined as follows:
μ C m = 1 1 β × H m U , c m a x m H m U , c
Here, β is a constraint scaling factor that controls the constraint intensity, governing the responsiveness of membership functions to constraints, where β is a sufficiently large positive constant, typically taken as β = 10.
The optimal fuzzy weighting exponent is defined as follows:
m * = arg max min μ G m , μ C m

4. Implementation Steps

The algorithm flowchart is depicted in Figure 1. The algorithm steps are explained using five environmental attributes: air humidity, air temperature, daily precipitation, wind force, and solar radiation.
The algorithmic procedure is summarized as follows:
Step 1: Align each parameter value with its address to form n data pairs. Store these pairs in a struct array N o d e D a t a , where each struct variable includes the node address N o d e D a t a . a d d r e s s , air temperature N o d e D a t a . t e m p , precipitation N o d e D a t a . p r e c i , solar radiation N o d e D a t a . r a d i a t i o n , air humidity N o d e D a t a . h u m i d i t y , and wind force N o d e D a t a . w i n d .
Step 2: Calculate the main and secondary attributes for clustering, as described in Section 3. Assume the main attributes are node air temperature N o d e D a t a . t e m p , node daily precipitation N o d e D a t a . p r e c i , and node solar radiation N o d e D a t a . r a d i a t i o n .
Step 3: For the main attributes of the data, randomly generate a set of cluster centers v i , a normalized fuzzy membership matrix μ i j , and normalized view weights w k . Then, perform multi-view collaborative clustering based on the main attributes, combining the content from Section 3 and Section 2. To determine the initial number of clusters k, refer to the target range k n [13].
Step 4: Construct an optimized objective function and weight update procedure to obtain the final discretization. Use the average of each cluster’s attribute values and address as the fusion value.
Step 5: Upload all fusion values and their corresponding node addresses.
Specific Algorithm 1 Pseudocode:
Algorithm 1: Multi-View Collaborative Fusion Algorithm for Agricultural WSN Data Based on Main Attributes
Input: At the same time, a cluster head node receives sensor data from N nodes, including node address, air temperature, air humidity, precipitation, wind force, and solar radiation.
Output: Data fusion result.
    #Step 1: Data Registration
    data_structs = []
    FOR EACH data IN sensor_data_list:
      struct = {
        ‘address’: data.node_address,
        ‘‘temperature’: data.air_temp,
        ‘humidity’: data.air_humidity,
        ‘precipitation’: data.daily_precip,
        ‘wind’: data.wind_speed,
        ‘radiation’: data.solar_rad
      }
  data_structs.append(struct)

    # Step 2: Identify Main Attributes (Exemplar Values)
    primary_attrs = [‘temperature’, ‘precipitation’, ‘radiation’]
    secondary_attrs = [‘humidity’, ‘wind’]

    # Step 3: Multi-view Collaborative Clustering
    k = determine_optimal_clusters(data_structs, primary_attrs) # Determine the k-value with reference to the target range
    centers = init_random_centers(k, primary_attrs) # Random initialization of cluster prototypes
    membership_matrix = init_normalized_matrix(len(data_structs), k) # Normalization of the fuzzy membership matrix
    view_weights = init_normalized_weights(len(primary_attrs)) # Weight normalization across views

    # Iterative refinement
    DO:
      prev_centers = copy(centers)
      # Update cluster prototypes (Mathematical implementation details are provided in Section 2 and Section 3 of the paper)
      centers = update_cluster_centers(data_structs, membership_matrix, view_weights, primary_attrs)

      # update fuzzy membership matrix
      membership_matrix = update_membership_matrix(data_structs, centers, view_weights, primary_attrs)

      # update view weights
      view_weights = update_view_weights(data_structs, centers, membership_matrix, primary_attrs)
    WHILE convergence_check(centers, prev_centers) < THRESHOLD

    # Step 4: Generate Consensus Values
    cluster_results = assign_to_clusters(membership_matrix) # Assign data points to clusters via membership
    fused_data = []

    FOR EACH cluster IN cluster_results:
      fused_entry = {
        ‘addresses’: [struct[‘address’] FOR struct IN cluster.members],
        ‘fused_values’: {}
      }
      # Compute fused main attributes (intra-class mean)
      FOR attr IN primary_attrs + secondary_attrs:
        values = [struct[attr] FOR struct IN cluster.members]
        fused_entry[‘fused_values’][attr] = mean(values)

      fused_data.append(fused_entry)

    # Step 5: Output Fused Results
    RETURN fused_data

# Auxiliary function example
FUNCTION determine_optimal_clusters(data, attrs):
    # Determine optimal k within the reference range using the elbow method or the silhouette coefficient
    k_range = range(2, 10) # Target reference range
    best_k = elbow_method(data, attrs, k_range)
    RETURN best_k

FUNCTION update_view_weights(data, centers, membership, attrs):
    # Update view weights using Section 3 formulae
    weights = []
    total_weight = 0.0

    FOR attr_idx, attr IN enumerate(attrs):
      weight = calculate_view_weight(attr, data, centers, membership)
      weights.append(weight)
      total_weight = weight
      # Normalization procedure
    RETURN [w/total_weight FOR w IN weights]

5. Simulation Results and Analysis

Environmental data were collected from a field deployment, including air temperature, humidity, soil moisture, light intensity, wind force, and precipitation, using a network of sensors. Data were collected hourly over a 30-day period, and a complete dataset was constructed via interpolation. A WSN with 200 nodes was simulated to verify the fusion efficiency and accuracy of the multi-view fusion algorithm for agricultural WSN data. Within the dataset, air temperature, humidity, and precipitation were selected as main clustering attributes, while the remaining parameters were treated as secondary attributes. The main-attribute-based multi-view fusion algorithm (MA-MVFCM-DF) was compared against two baseline methods: the k-means-based fusion algorithm (KMEANS-DF) and the entropy-weighted multi-view collaborative partition fuzzy clustering algorithm (EW-CoP-MVFCM).

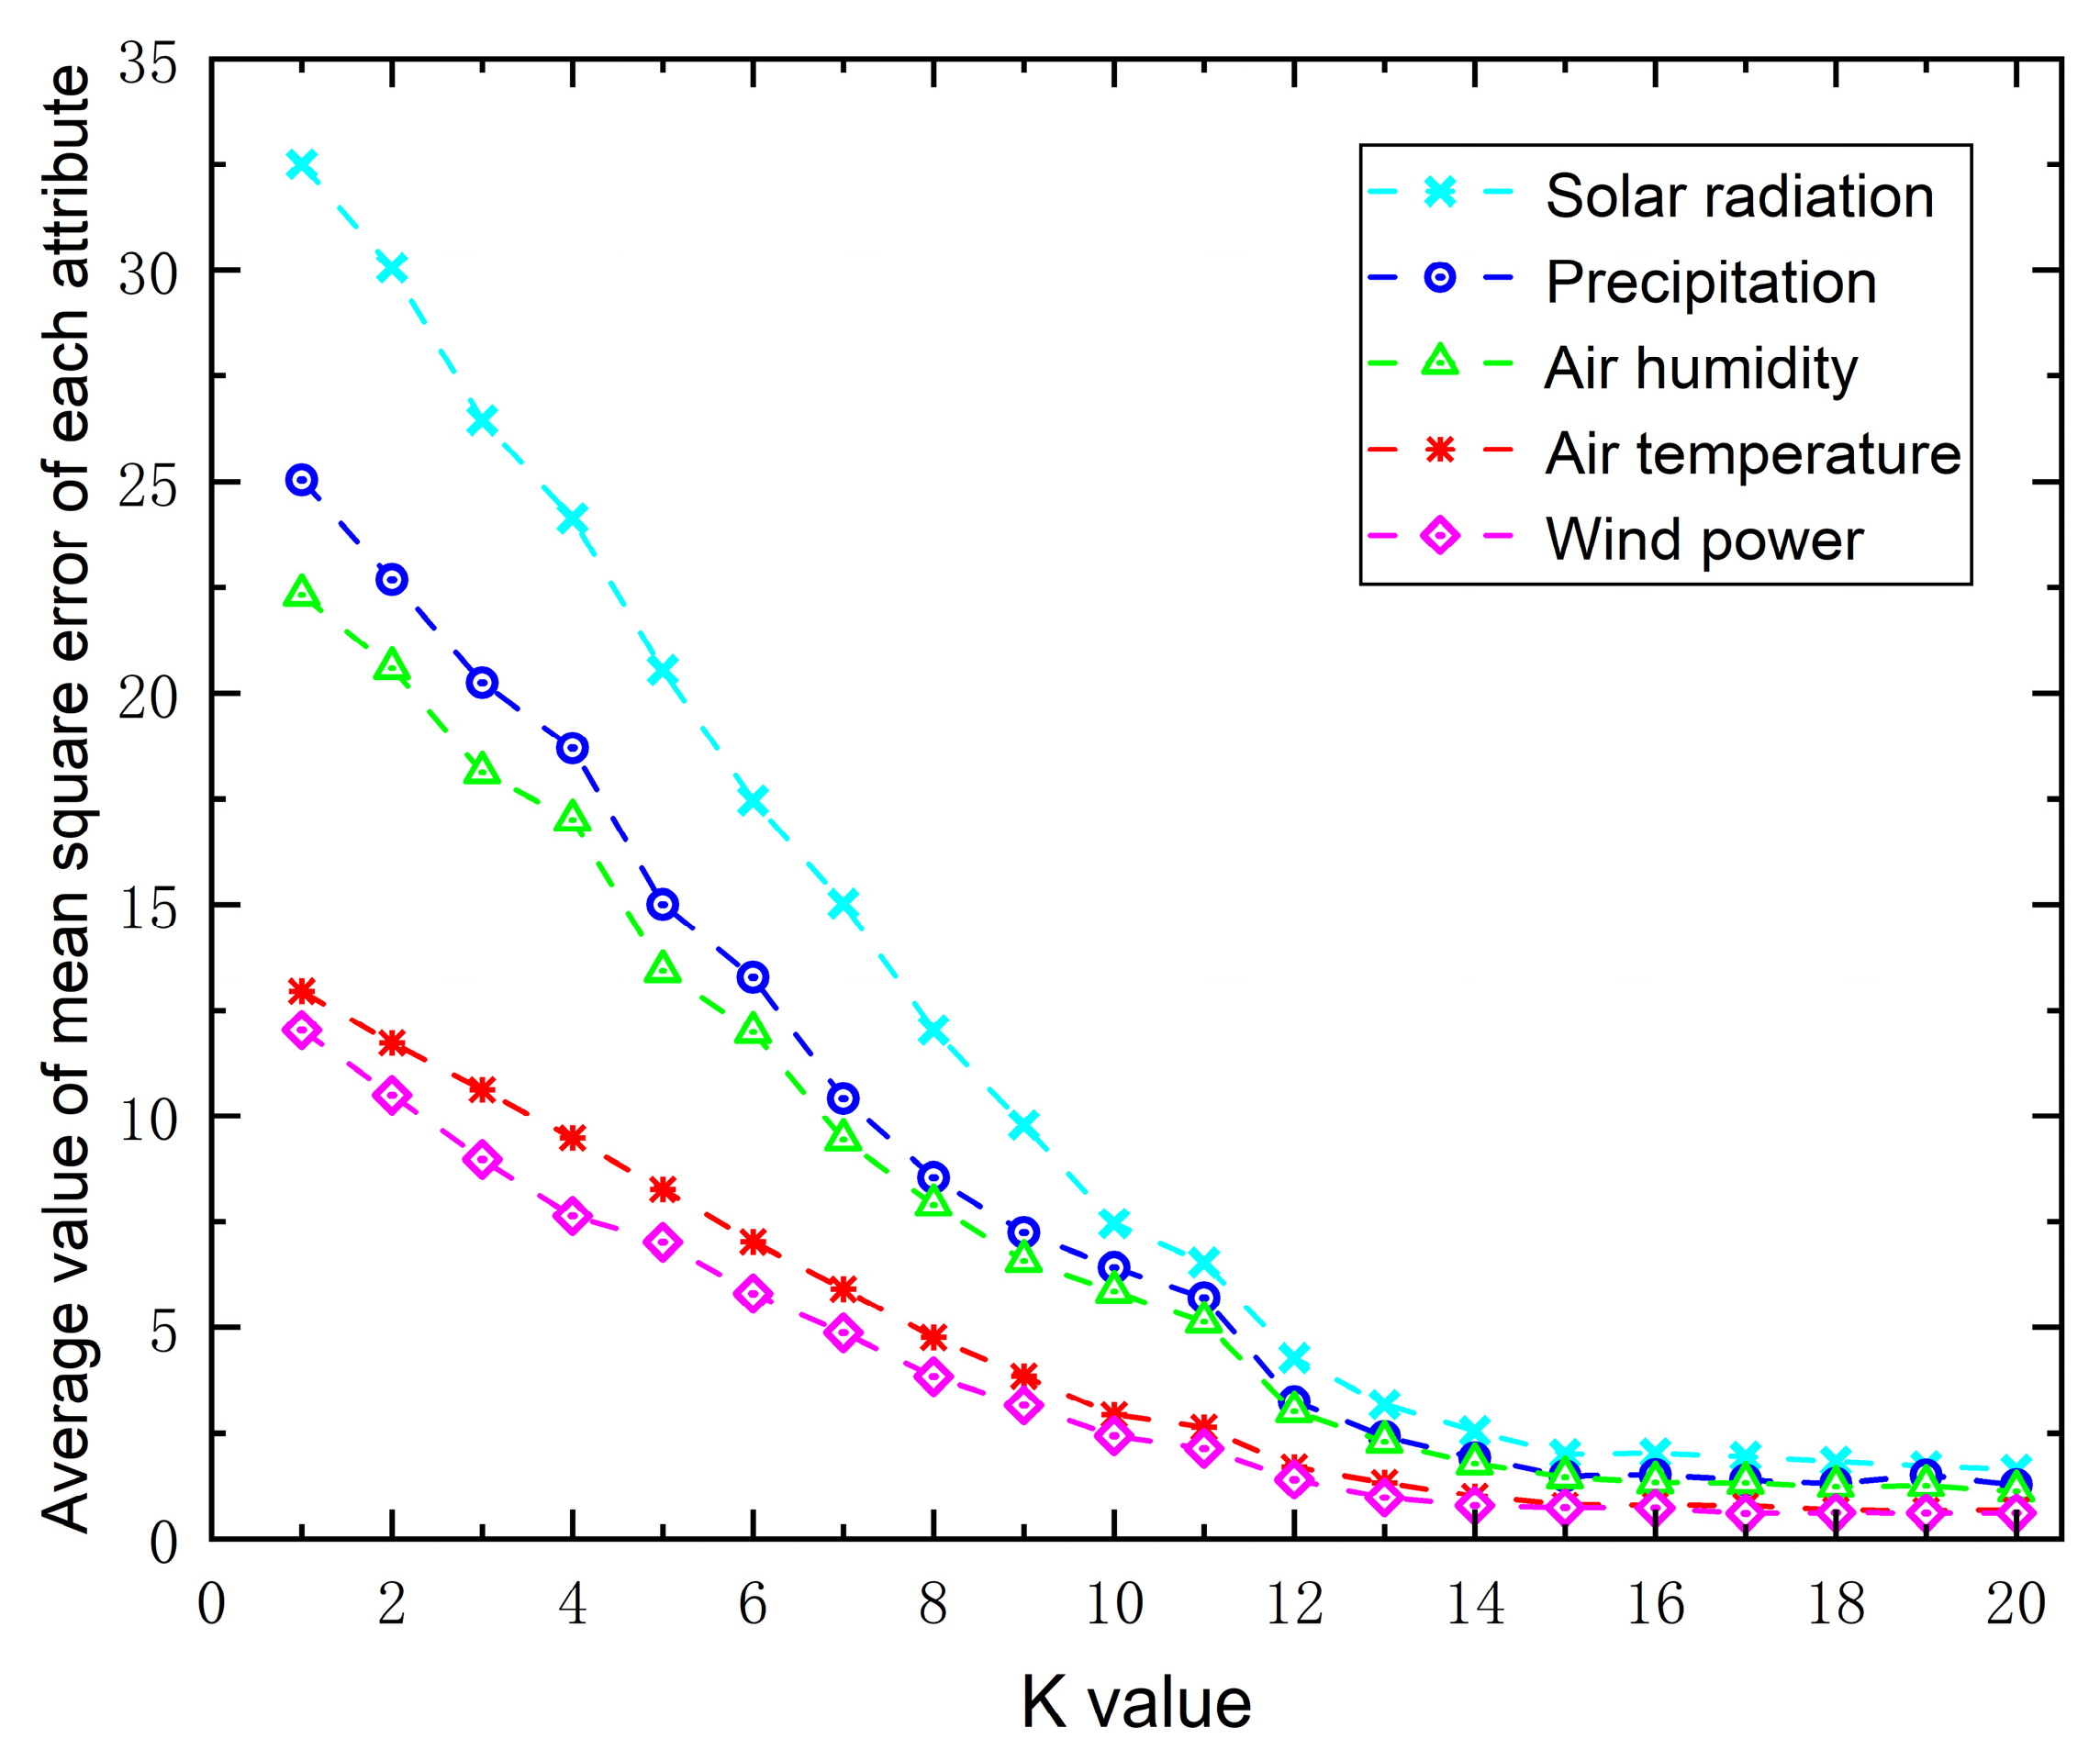
5.1. Analysis of Different Cluster Center Numbers

In this study, the MA-MVFCM-DF algorithm was used for data fusion experiments with the number of cluster center k set at 5, 10, and 15. To assess performance, the mean squared error (MSE) before and after fusion was calculated under each setting. The initial value of k was preset according to experimental needs, and the data compression rate was defined as the ratio of data volume after fusion to that before fusion. Since random initialization of the membership matrix could lead to random differences in clustering results, this study performed 20 independent repeated trials on a randomly selected dataset and used the average value for comparative analysis to eliminate the impact of random factors on the results. The experimental results are shown in the following figure:
As shown in Table 2, increasing the number of initial cluster centers leads to a high data transmission rate and greater network energy consumption. To reduce energy usage, both data redundancy and upload volume must be minimized. However, reducing the number of cluster centers increases fusion errors. For instance, in Figure 2a, when k = 5, the air temperature error in the fourth fusion reaches 2.4 °C, and in Figure 2c, the precipitation error in the fifth fusion reaches 23 mm, both considered large errors that can negatively affect monitoring accuracy. Figure 3 also shows that reducing the number of cluster centers increases fusion errors. From Figure 4 and Table 2, when k = 10, the data upload rate is 66.7% of that at k = 15, while the average MSE ratio is 2.16. When k = 5, the upload rate drops to 33.3%, whereas when k = 15, the maximum error ratio sharply decreases to 4.86. These results show that more cluster centers mean less error but more data and energy use. Thus, choosing the right number of cluster centers is key, as reducing data transmission always risks higher fusion errors.
The figure above shows the trend of the clustering metric—the normalized average MSE of attributes collected from 200 nodes, with k values ranging from 2 to 20. To facilitate observation, the MSE of each attribute is normalized to the range 0–35. The results clearly show that when k is less than 14, the MSE decreases rapidly as k increases. Thus, the optimal k value is 14. For k values below 14, increasing the data upload rate can effectively reduce the error, aligning with the value selection strategy discussed in Section 3.2.

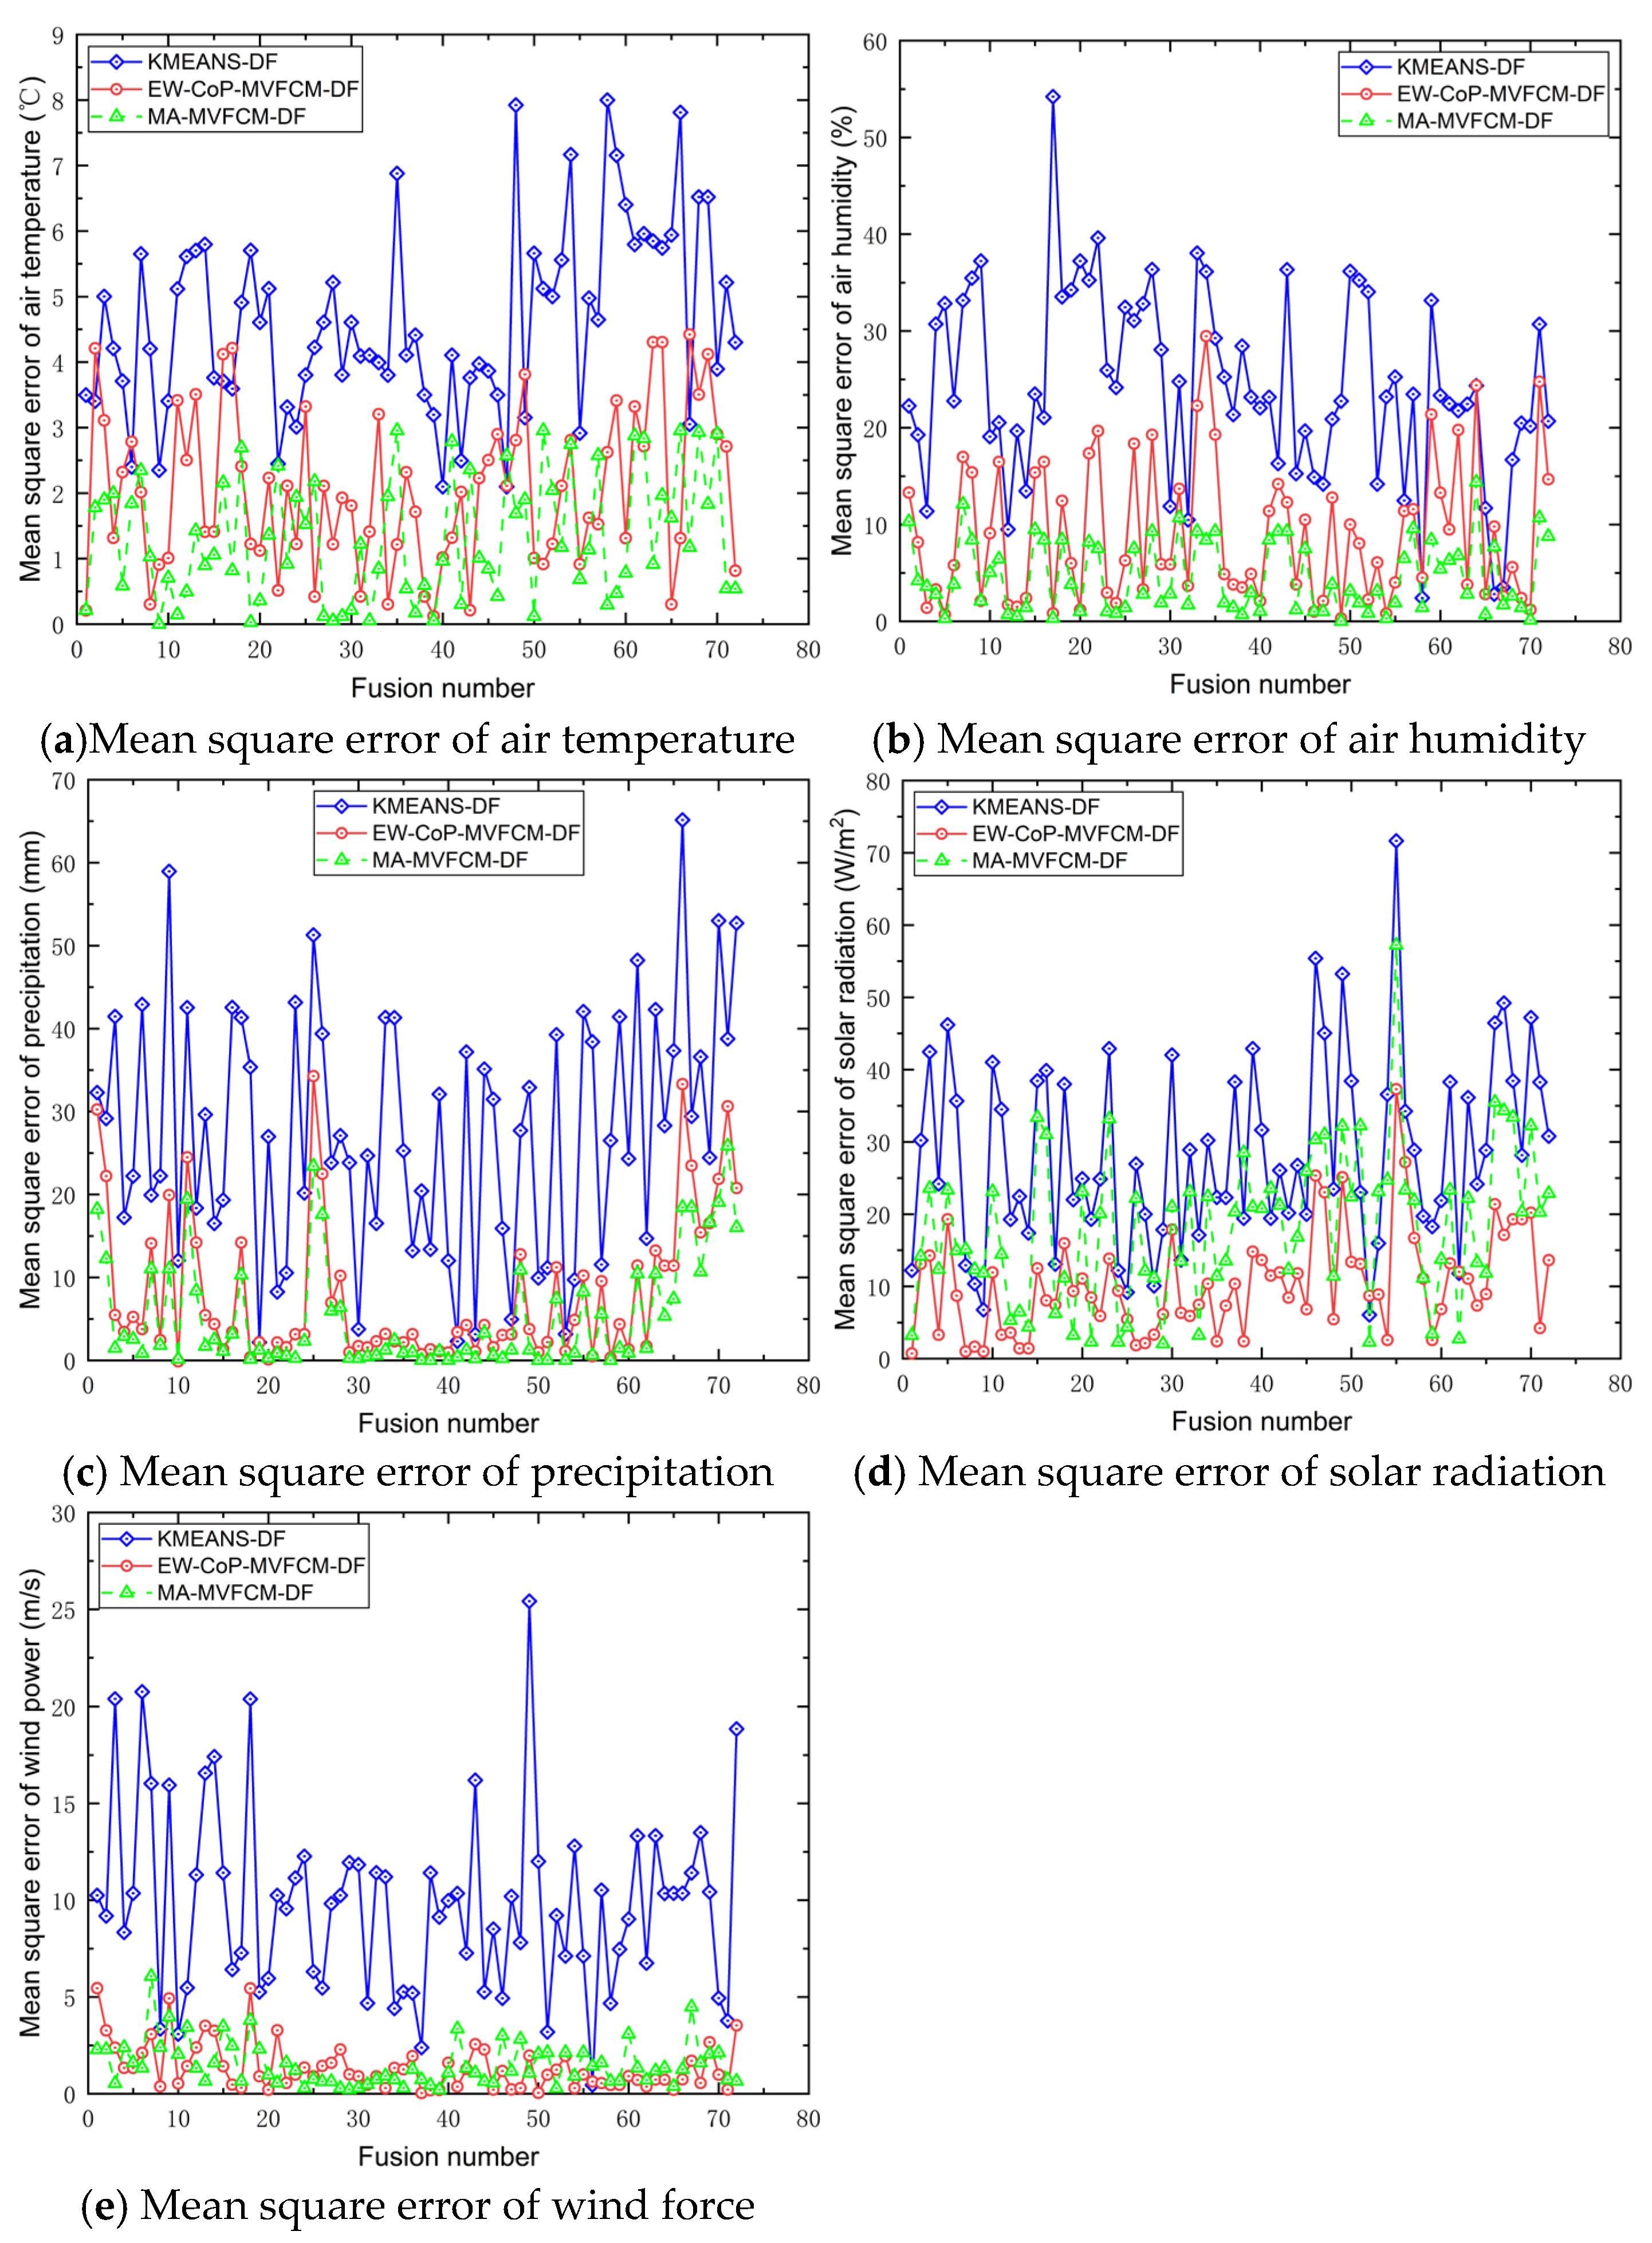
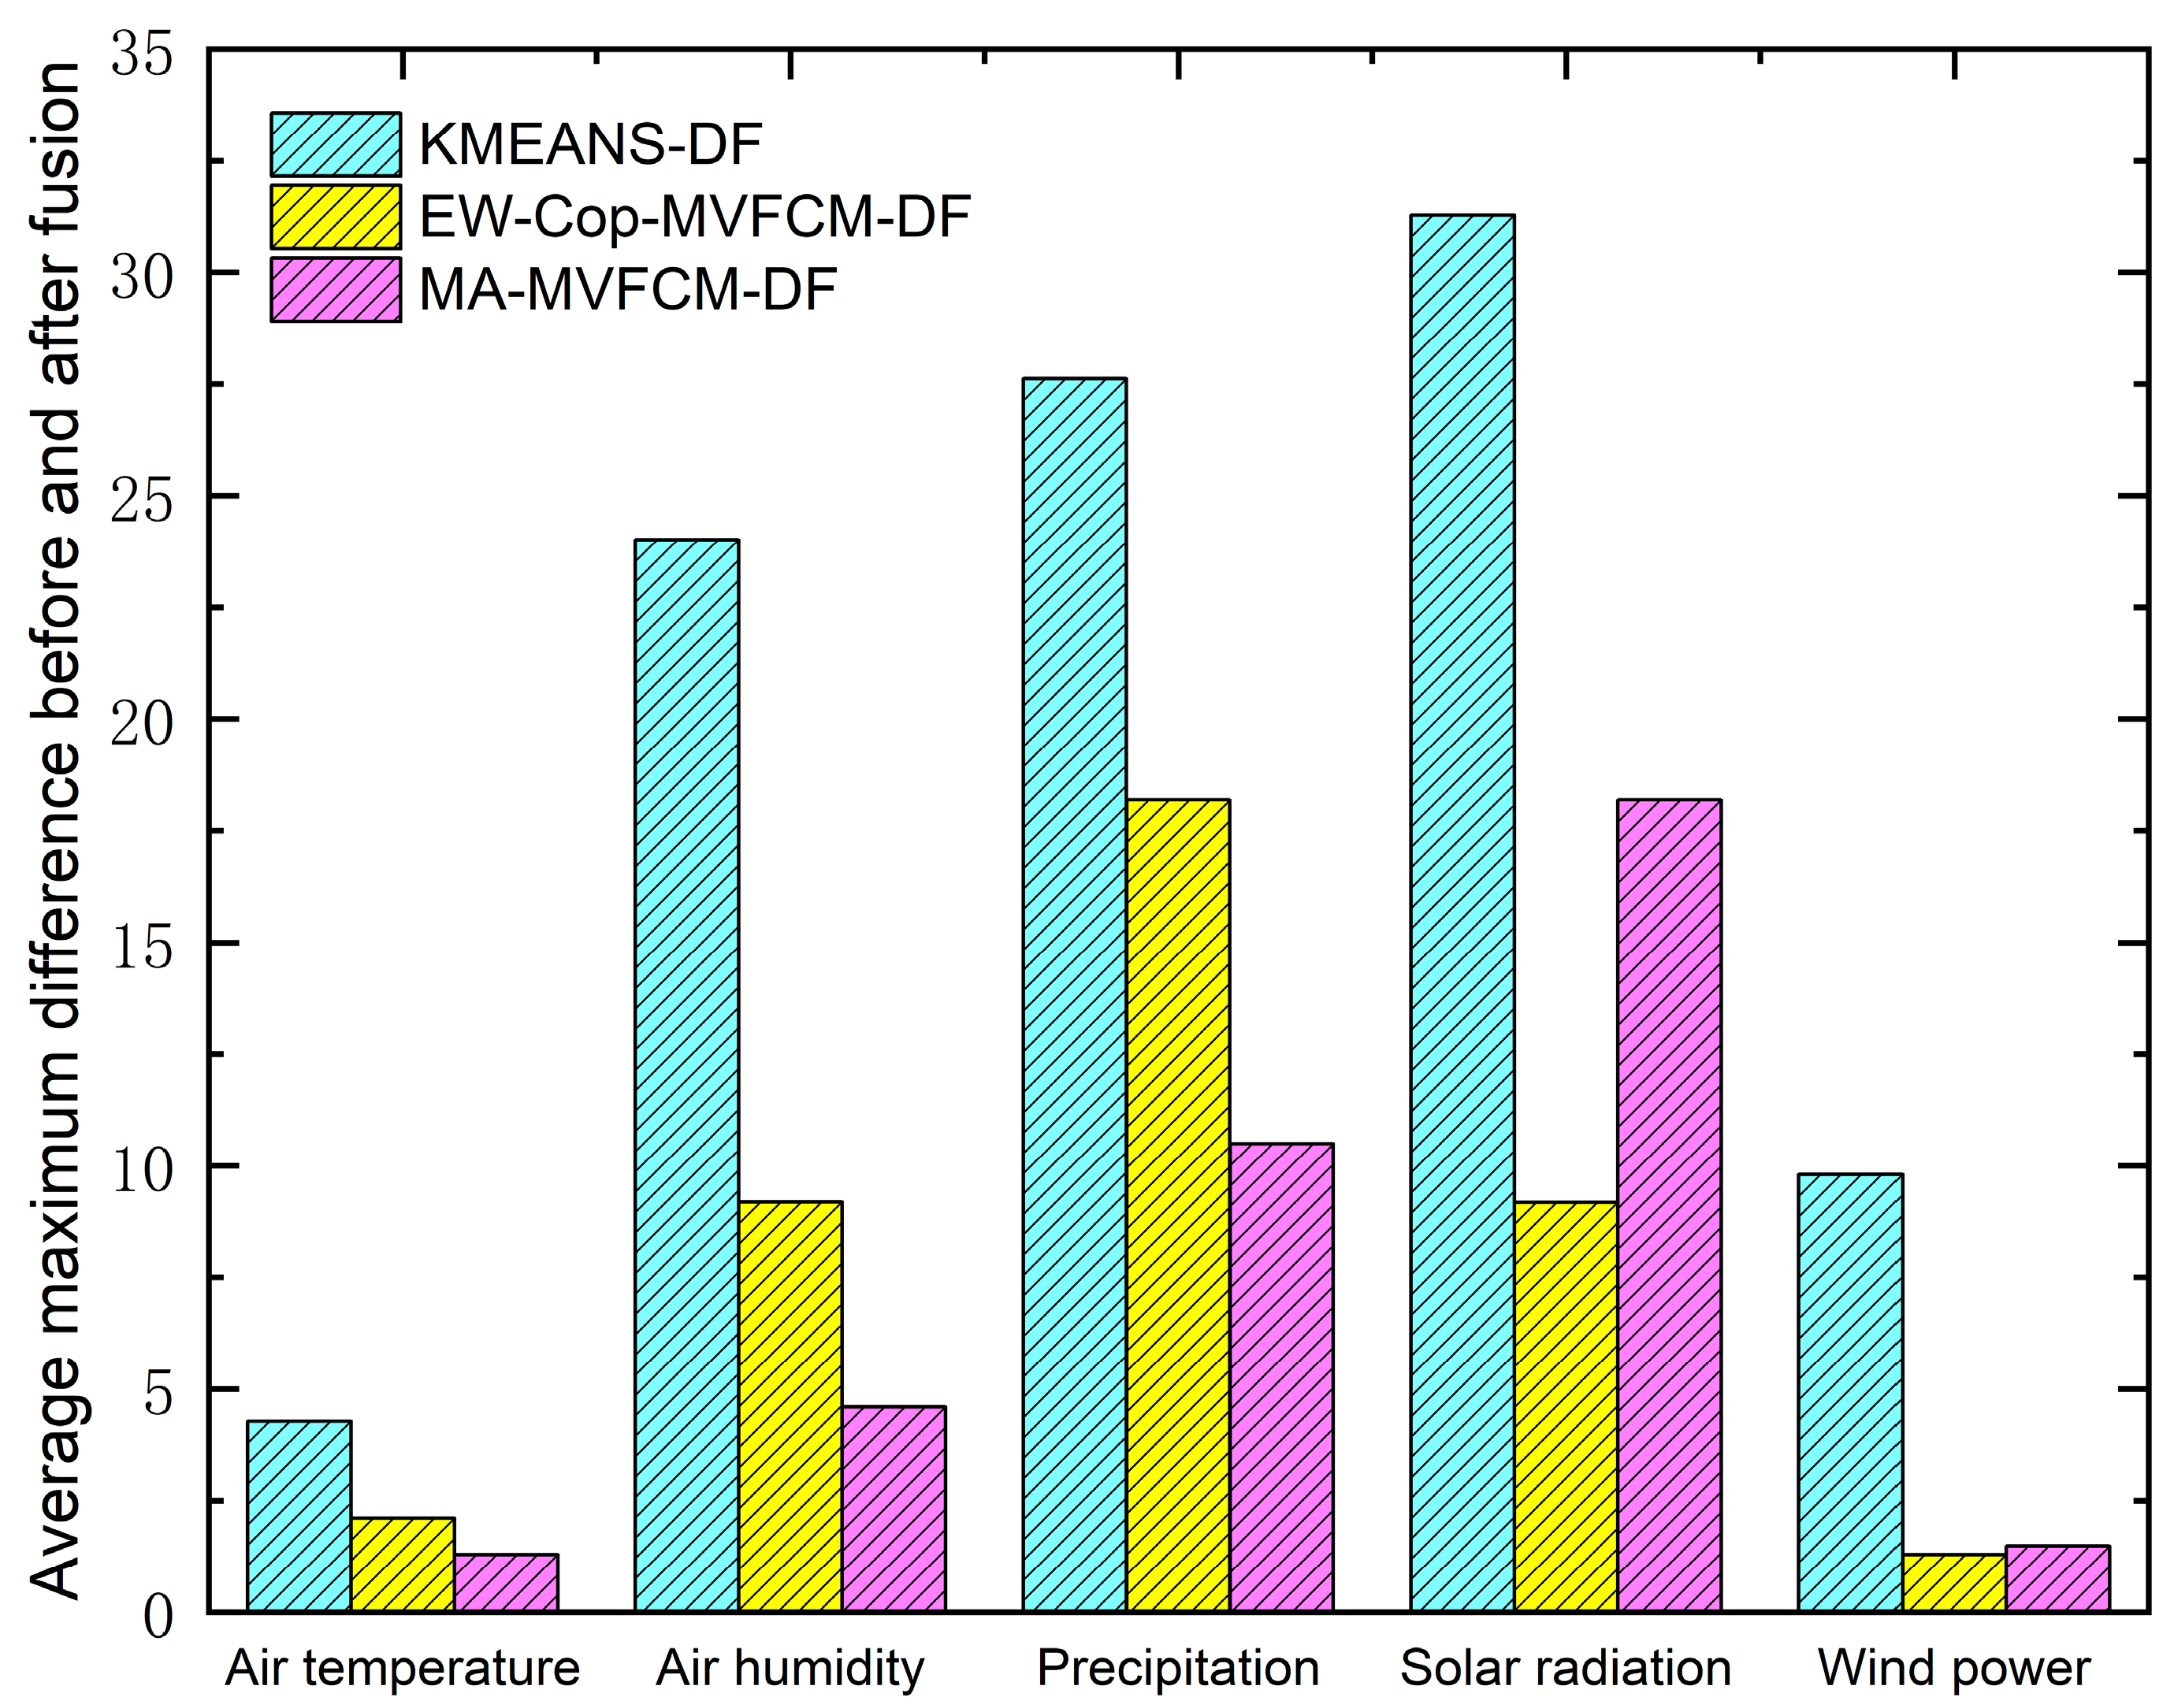
5.2. Data Fusion Accuracy

In the EW-CoP-MVFCM algorithm, each iteration involves calculating the distance between every data point and all cluster centers to obtain the final fuzzy spatial partitioning matrix U ~ . If the data dimension is m , the time complexity for calculating U ~ is O ( m ) , and the overall complexity for the entire dataset is O ( n m k ) , where n is the total number of data volumes and k is the number of cluster centers. In contrast, the complexity of the AC-MVFCM algorithm is O ( n m 0 k ) , with m 0 being the reduced attribute dimension, and clearly, o ( n m 0 k ) < o ( n m k ) . Although a reduction in algorithm complexity generally leads to an increase in error, three experimental setups were designed to evaluate the data fusion accuracy of MA-MVFCM-DF. In each setup, one set of data was randomly selected from 72 groups, and the data of 200 nodes within a cluster was used. Data fusion was performed on this data using KMEANS-DF, EW-CoP-MVFCM-DF, and MA-MVFCM-DF. The MSE before and after each fusion was calculated by comparing the fused values with the actual values, and the results are shown in the figure below:
Figure 4 shows the MSE of air humidity, air temperature, precipitation, solar radiation, and wind force before and after fusion. KMEANS-DF has higher fusion errors than MA-MVFCM-DF, while EW-Cop-MVFCM-DF and MA-MVFCM-DF have similar error levels. For main attributes like air temperature, humidity, and precipitation, MA-MVFCM-DF has lower errors than EW-Cop-MVFCM-DF. For secondary attributes, the wind force error of MA-MVFCM-DF is similar to EW-Cop-MVFCM-DF, but its solar radiation error is slightly higher. This result shows that MA-MVFCM-DF reduces errors by considering clustering weights between views, with a maximum error reduction of 16.1%. By removing attributes with low clustering contributions, the algorithm reduces computational complexity while maintaining fusion accuracy and even improves precision for some attributes.
Figure 5 shows the average MSE, indicating that the algorithm minimizes data upload and controls relative errors. Calculations show that MA-MVFCM-DF reduces errors by an average of 5.6% compared to KMEANS-DF and 1.6% compared to EW-Cop-MVFCM-DF.

6. Conclusions

This paper first analyzed the data fusion requirements in agricultural WSNs and evaluated the limitations of existing fusion methods. To address these issues, a main-attribute-based multi-view data fusion technique was proposed by integrating multi-view collaborative fusion strategies. This technique effectively reduces algorithm complexity while maintaining acceptable fusion accuracy, making it well-suited for deployment on agricultural WSN nodes. Simulation results demonstrated that the proposed method outperforms existing agricultural WSN data fusion algorithms in terms of fusion accuracy. Another key contribution of this work is the introduction of multi-view technology into agricultural WSNs, enabling classification and fusion based on the similarity of environmental parameters. The proposed algorithm is ideal for scenarios with many attribute factors and strict network lifetime requirements, such as unattended, long-term agricultural monitoring systems.
Multi-parameter data fusion methods have broad prospects in agricultural wireless sensor networks. However, research in this area is not yet mature. Future research directions include:
(1)
Determining main parameters: Considering the computational cost of WSNs and data characteristics, identifying key parameters based on the relationships among agricultural parameters is crucial and deserves further exploration.
(2)
Optimizing the objective function: When fusing multiple parameters, combining fuzzy or rough set theory to address uncertainties can enhance the efficiency of the fusion process.
(3)
Handling secondary attributes: Simply discarding secondary attributes is a crude approach. Future work can focus on optimizing clustering results using secondary attributes to achieve better data fusion outcomes.

Author Contributions

Conceptualization, X.W. and X.Y.; data curation, X.W.; formal analysis, X.W. and X.Y.; investigation, X.W.; methodology, X.W. and X.Y.; project administration, X.W. and X.Y.; resources, X.Y.; software, X.W.; supervision, X.Y.; validation, X.W.; visualization, X.W.; writing—original draft, X.W.; writing—review and editing, X.Y. All authors have read and agreed to the published version of the manuscript.

Funding

This research received no external funding.

Data Availability Statement

Data available on request due to restrictions.

Conflicts of Interest

The authors declare no conflicts of interest.

Abbreviations

The following abbreviations are used in this manuscript:
WSNWireless sensor network
BSBLBlock-sparse Bayesian learning
EW-CoP-MVFCMEntropy Weight-Collaborative Partition Multi-View Fuzzy Clustering Algorithm
FCMFuzzy C-means algorithm
MA-MVFCM-DFMain-attribute-based multi-view data fusion algorithm
KMEANS-DFK-means-based data fusion algorithm
MSEMean squared error

References

  1. Zhao, C.; Wu, H.; Zhu, L. A ZigBee-based energy saving routing algorithm for farmland wireless sensor networks. Chin. High Technol. Lett. 2013, 23, 368–373. [Google Scholar]
  2. Aldalahmeh, S.A.; Ciuonzo, D. Distributed detection fusion in clustered sensor networks over multiple access fading channels. IEEE Trans. Signal Inf. Process. Over Netw. 2022, 8, 317–329. [Google Scholar] [CrossRef]
  3. Tian, Q.; Edward, J.C. Optimal distributed detection in clustered wireless sensor networks. IEEE Trans. Signal Process. 2007, 55, 3892–3904. [Google Scholar] [CrossRef]
  4. Wu, L.; Sahu, N.; Xu, S.; Babu, P.; Ciuonzo, D. Optimization based sensor placement for multi-target localization with coupling sensor clusters. IEEE Trans. Signal Inf. Process. Over Netw. 2023, 9, 596–611. [Google Scholar] [CrossRef]
  5. Gao, H.; Liu, Y.; Chen, S. Fusion of WSN Cluster Head Data Based on Improved K-means Clustering Algorithm. Trans. Chin. Soc. Agric. Mach. 2015, s1, 162–167. [Google Scholar]
  6. Bhasker, B.; Murali, S. An Energy-Efficient Cluster-based data aggregation for agriculture irrigation management system using wireless sensor networks. Sustain. Energy Technol. Assess. 2024, 65, 103771. [Google Scholar] [CrossRef]
  7. Kong, L.; Xia, M.; Liu, X.Y.; Chen, G.; Gu, Y.; Wu, M.Y.; Liu, X. Data Loss and Reconstruction in Wireless Sensor Networks. IEEE Trans. Parallel Distrib. Syst. 2014, 25, 2818–2828. [Google Scholar] [CrossRef]
  8. Sun, J.; Yu, Y.; Wen, J. Compressed-Sensing Reconstruction Based on Block Sparse Bayesian Learning in Bearing-Condition Monitoring. Sensors 2017, 17, 1454. [Google Scholar] [CrossRef]
  9. Al-Qurabat, A.K.M.; Salman, H.; Finjan, A.A.R. Important extrema points extraction-based data aggregation approach for elongating the WSN lifetime. Int. J. Comput. Appl. Technol. 2022, 68, 357–368. [Google Scholar] [CrossRef]
  10. Alper, S.S.; Abdullah, A.; Adnan, Y. A Two-Tier Distributed Fuzzy Logic Based Protocol for Efficient Data Aggregation in Multi-Hop Wireless Sensor Networks. IEEE Trans. Fuzzy Syst. 2018, 26, 3615–3629. [Google Scholar] [CrossRef]
  11. Sreedevi, P.; Venkateswarlu, S. An Efficient Intra-Cluster Data Aggregation and finding the Best Sink location in WSN using EEC-MA-PSOGA approach. Int. J. Commun. Syst. 2022, 35, e5110. [Google Scholar] [CrossRef]
  12. Gao, F.; Yu, L.; Wang, Y.; Lu, S.; Zhang, W.A.; Yu, L. Development of host computer software for crop water status monitoring system based on wireless sensor networks. Chin. Soc. Agric. Eng. 2010, 26, 175–181. [Google Scholar]
  13. Shastry, K.A.; Sanjay, H.A. A modified genetic algorithm and weighted principal component analysis based feature selection and extraction strategy in agriculture. Knowl.-Based Syst. 2021, 232, 107460. [Google Scholar] [CrossRef]
  14. Torres, A.B.; da Rocha, A.R.; da Silva, T.L.C.; de Souza, J.N.; Gondim, R.S. Multilevel data fusion for the internet of things in smart agriculture. Comput. Electron. Agric. 2020, 171, 16. [Google Scholar] [CrossRef]
  15. Sun, G.; Zhang, Z.; Zheng, B.; Li, Y. Multi-Sensor Data Fusion Algorithm Based on Trust Degree and Improved Genetics. Sensors 2019, 19, 2139. [Google Scholar] [CrossRef]
  16. Yang, X.; Hua, Z.; Li, L.; Huo, X.; Zhao, Z. Multi-source information fusion-driven corn yield prediction using the Random Forest from the perspective of Agricultural and Forestry Economic Management. Sci. Rep. 2024, 14, 4052. [Google Scholar] [CrossRef]
  17. Jiang, Y.Z.; Deng, Z.-H.; Wang, J.; Qian, P.-J.; Wang, S.-T. Collzborative Partition Multi-View Fuzzy Clustering Algorithm using Entropy Weighting. J. Softw. 2014, 25, 2293–2311. [Google Scholar]
  18. Hu, J.; Pan, Y.; Li, T.; Yang, Y. TW-Co-MFC: Two-Level Weighted Collaborative Fuzzy Clustering Based on Maximum Entropy for Multi-View Data. Tsinghua Sci. Technol. 2021, 26, 185–198. [Google Scholar] [CrossRef]
  19. Cleuziou, G.; Exbrayat, M.; Martin, L.; Sublemontier, J.-H. CoFKM: A Centralized Method for Multiple-View Clustering. In Proceedings of the Ninth IEEE International Conference on Data Mining, Miami Beach, FL, USA, 6–9 December 2009. [Google Scholar] [CrossRef]
  20. Chao, G.; Sun, S.; Bi, J. A Survey on Multi-View Clustering. IEEE Trans. Artif. Intell. 2017, 2, 146–168. [Google Scholar] [CrossRef]
  21. Ruan, S. A Quantitative Comparison between Shannon and Tsallis–Havrda–Charvat Entropies Applied to Cancer Outcome Prediction. Entropy 2022, 24, 436. [Google Scholar] [CrossRef]
  22. Zhu, C.; Miao, D. Entropy-based multi-view matrix completion for clustering with side information. Pattern Anal. Appl. 2020, 23, 359–370. [Google Scholar] [CrossRef]
  23. Qian, P.; Zhou, J.; Jiang, Y.; Liang, F.; Zhao, K.; Wang, S. Multi-View Maximum Entropy Clustering by Jointly Leveraging Inter-View Collaborations and Intra-View-Weighted Attributes. IEEE Access 2018, 6, 28594–28610. [Google Scholar] [CrossRef] [PubMed]
  24. Kassim, M.R.M.; Harun, A.N. Applications of WSN in agricultural environment monitoring systems. In Proceedings of the International Conference on Information & Communication Technology Convergence, Jeju, Republic of Korea, 19–21 October 2016; pp. 344–349. [Google Scholar] [CrossRef]
  25. Ruipeng, T.; Jianbu, Y.; Jianrui, T.; Aridas, N.K.; Talip, M.S. Design of agricultural wireless sensor network node optimization method based on improved data fusion algorithm. PLoS ONE 2024, 19, e0308845. [Google Scholar] [CrossRef]
  26. Wang, L.; Fu, C.; Qi, J. The Multisensor Data Fusion Method Based on Improved Fuzzy Evidence Theory in the Coal Mine Environment. J. Sens. 2024, 2024, 5581891. [Google Scholar] [CrossRef]
  27. Khoiri, I.B.; Erfianto, B. The Application Of Multi-Sensor Data Fusion Method with Fuzzy Time Series Model to Improve Indoor Water Prediction Accuracy Quality. Build. Inform. Technol. Sci. (BITS) 2023, 4, 1805–1814. [Google Scholar] [CrossRef]
Figure 1. Flowchart of the Multi-View Fusion Algorithm for Agricultural WSN Data Based on Main Attributes.
Electronics 14 02424 g001
Figure 2. Comparison of results under different cluster center numbers k.
Electronics 14 02424 g002
Figure 3. Average MSE for different k values.
Electronics 14 02424 g003
Figure 4. Mean squared error of attributes.
Electronics 14 02424 g004
Figure 5. Average mean squared error before and after data fusion.
Electronics 14 02424 g005
Table 1. Limitations of Prevalent Data Fusion Algorithms.
Single-view data fusion methodsBased on k-meansDisadvantage:
The output lacks reliability and comprehensiveness
Based on block-sparse Bayesian learning
Based on important extrema points extraction
Based on the distributed fuzzy logic protocol
Multi-view data fusion methodsBased on the improved genetic algorithmDisadvantage:
fail to consider different clustering characteristics of various attributes
Based on the multilevel data fusion method
Based on the trust degree
Based on the random forest model
Table 2. The relationship between the initial number of cluster centers and data compression rate.
The initial number of cluster centersk = 5k = 10k = 15
Data compression rate4.24%8.47%12.7%
Disclaimer/Publisher’s Note: The statements, opinions and data contained in all publications are solely those of the individual author(s) and contributor(s) and not of MDPI and/or the editor(s). MDPI and/or the editor(s) disclaim responsibility for any injury to people or property resulting from any ideas, methods, instructions or products referred to in the content.

