Next Article in Journal
Direct Interface Circuits for Resistive, Capacitive, and Inductive Sensors: A Review
Previous Article in Journal
Co-Design of Single-Layer RCS-Reducing Surface and Antenna Array Based on AMC Technique
 
 
Due to scheduled maintenance work on our database systems, there may be short service disruptions on this website between 10:00 and 11:00 CEST on June 14th.
Article

Design of a Land Area Measuring Instrument Based on an STM32 and a BeiDou Positioning Chip

1
Changwang School of Honors, Nanjing University of Information Science and Technology, Nanjing 210000, China
2
School of Electronics and Information Engineering, Nanjing University of Information Science and Technology, Nanjing 210000, China
3
School of Integrated Circuits, Nanjing University of Information Science and Technology, Nanjing 210000, China
*
Author to whom correspondence should be addressed.
Electronics 2025, 14(12), 2394; https://doi.org/10.3390/electronics14122394
Submission received: 5 May 2025 / Revised: 30 May 2025 / Accepted: 6 June 2025 / Published: 11 June 2025

Abstract

:
This paper presents a land area measuring instrument based on an STM32 microcontroller (STMicroelectronics, Paris, France) and a BeiDou positioning chip (Zhongke Microelectronics, Hangzhou, China). The system employs BeiDou navigation as the core positioning, leveraging its unique three-track satellite cooperative networking and BDSBAS satellite-based enhancement technology as the physical layer guarantee mechanism to maintain high-precision positioning in the weak signal area of the Asia–Pacific region. At the same time, this design integrates the FreeRTOS real-time operating system to implement a dynamic memory management strategy. By adopting the linear incremental memory allocation mechanism coupled with the emergency Kalman prediction algorithm, the software layer establishes a memory buffering and fault-tolerant processing framework. Test results demonstrate a relative error below 1% in open terrains, while errors remain below 2.72% under weak signal conditions and in complex terrain environments.

1. Introduction

Geographic information system (GIS) technology has demonstrated unprecedented potential for enhancing geographic resource management efficiency and optimizing land resource allocation [1,2,3]. In land resource management and cartography, area measurement serves as a critical parameter that profoundly influences regional planning, resource allocation, and utilization efficiency. Consequently, developing novel area measurement technologies is essential for addressing land management challenges, advancing precision agriculture, and driving innovation in modern surveying and mapping. Traditional area measurement methods—predominantly reliant on manual techniques and conventional instruments—exhibit inefficiency and significant errors, failing to meet modern agriculture’s precision management requirements. While satellite navigation-based area measurement instruments (e.g., GPS) have proliferated in recent years [4,5], these systems remain limited in their dynamic environment adaptability, complex-terrain processing, and resource utilization efficiency. Under weak signal conditions, issues such as insufficient satellite distribution density and pronounced multipath effects further degrade measurement accuracy.
To address these limitations, researchers globally have pursued continuous methodological refinements for complex scenarios and accuracy enhancement. In 2017, Chen et al. utilized S720 handheld GIS equipment to validate forestland measurement data, achieving a 4.55% accuracy through region-specific sampling point optimization; however, their static memory allocation strategy proved environmentally constrained [6]. By 2019, Yang et al. developed a land area measurement instrument using the S1216F8 module and μC/OS-II system, incorporating a narrow-band bandpass filter to eliminate power–frequency interference and active potential shielding to mitigate weak signal leakage. While attaining 1.42% accuracy in open-field tests, persistent signal reception challenges under weak signal conditions remained unresolved [7]. In 2020, Wang et al. proposed a dual-polarized antenna GPS signal reception algorithm that improved urban canyon positioning accuracy by 43.07% through multipath/non-line-of-sight (MP/NLOS) signal suppression, though area measurement applications were unexplored [8]. Concurrently, Mohaddeseh et al. combined Type II fuzzy sets with wavelet transforms to boost GPS signal reception accuracy by 28.6% in high-noise environments, albeit with embedded deployment limitations due to algorithmic complexity [9]. Collectively, these efforts prioritized hardware enhancements or signal-processing innovations to address weak signal constraints. Following the 2020 operationalization of the BeiDou-3 satellite constellation, research on BeiDou measurement accuracy has intensified, with growing applications in area measurement. For instance, Zhang et al. (2022) integrated the MC120M BeiDou module with Delaunay triangulation, achieving a 0.7% average error in multi-terrain farmland validation [10]. Xiao et al. (2025) further resolved forest canopy signal occlusion via a BeiDou/inertial navigation integrated system, attaining a 3% positioning accuracy in coniferous, broad-leaved, and mixed forests [11].
In this context, this design employs BeiDou navigation as its core positioning technology. The BeiDou system provides a physical layer solution for the weak signal environment through its unique technical architecture: its inclined geosynchronous orbit (IGSO) satellite forms high elevation coverage in the Asia–Pacific region, increasing the minimum number of visible satellites to eight [12]. Its unique BDSBAS satellite-based augmentation service broadcasts differential correction parameters through GEO satellites, and the horizontal and vertical positioning accuracy is about 0.15 and 0.2 m [
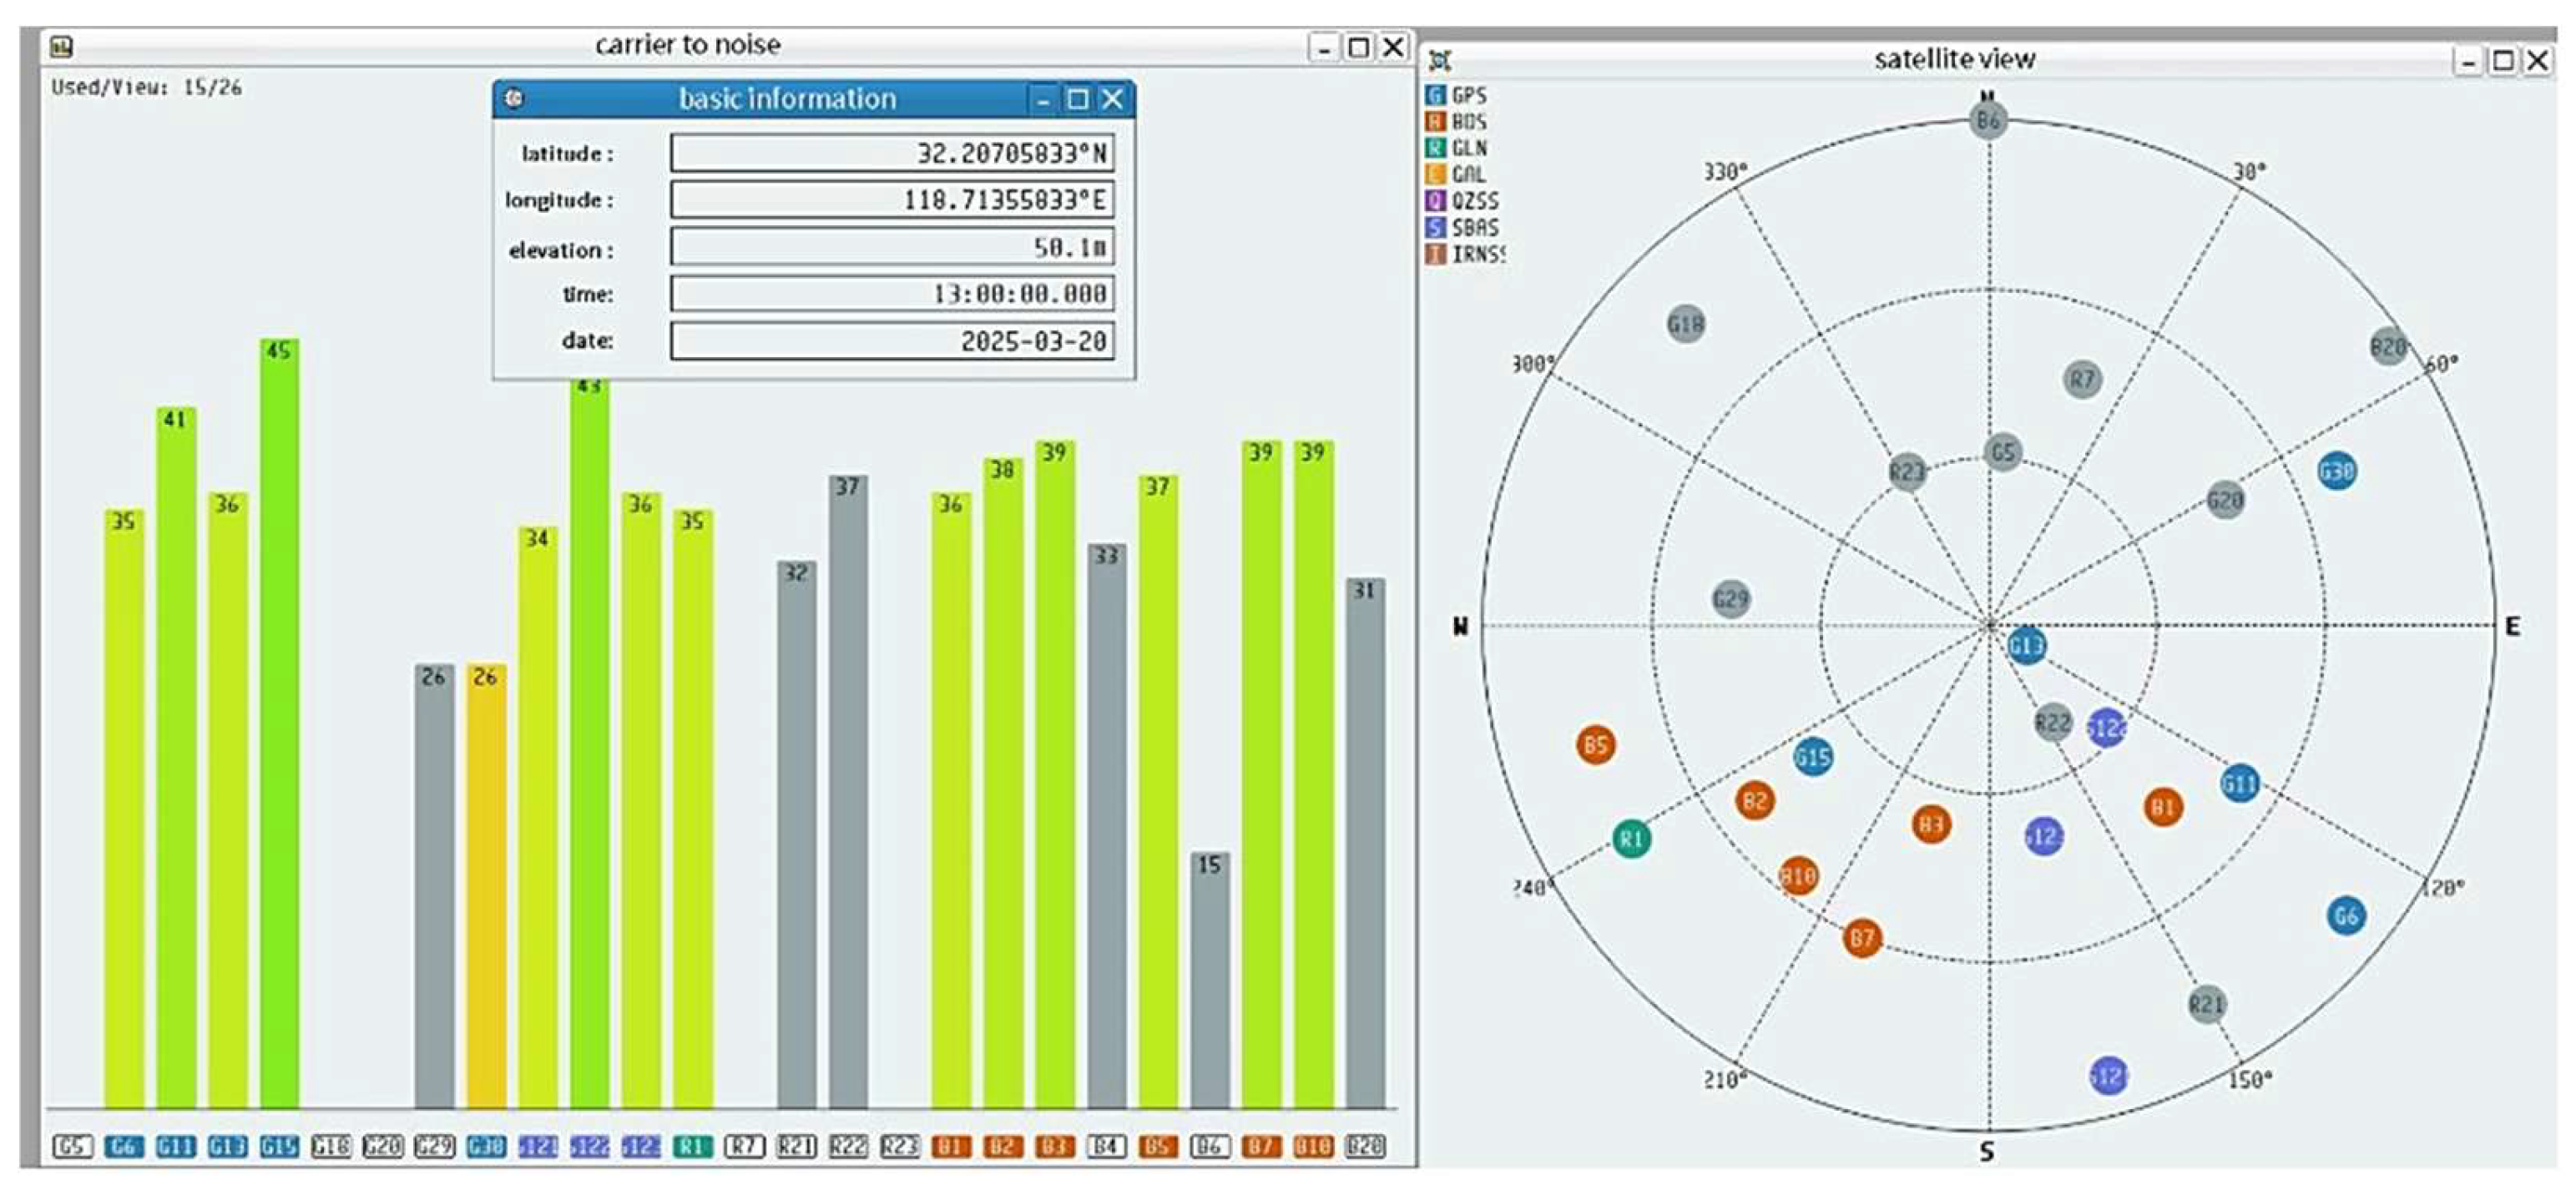
13]. A 72-h GNSS Toolkit 3 (Zhongke Microelectronics, Hangzhou, China) evaluation of satellite reception in Figure 1 revealed stable visibility of 5–12 BeiDou satellites in Nanjing (vs. 4–11 for GPS), with most sustaining >25° elevation angles. Comparable carrier-to-noise ratios (C/N0) of GPSs confirm BeiDou’s positioning robustness in Asia–Pacific regions, establishing a physical-layer foundation for complex-terrain performance.
Nevertheless, hardware-layer anti-interference capabilities necessitate complementary software-layer optimization. Although measurement accuracy continues to improve, most area measurement instruments employ static memory pre-allocation—a strategy ill-suited to dynamic sampling point variability, risking memory waste or stack overflow [
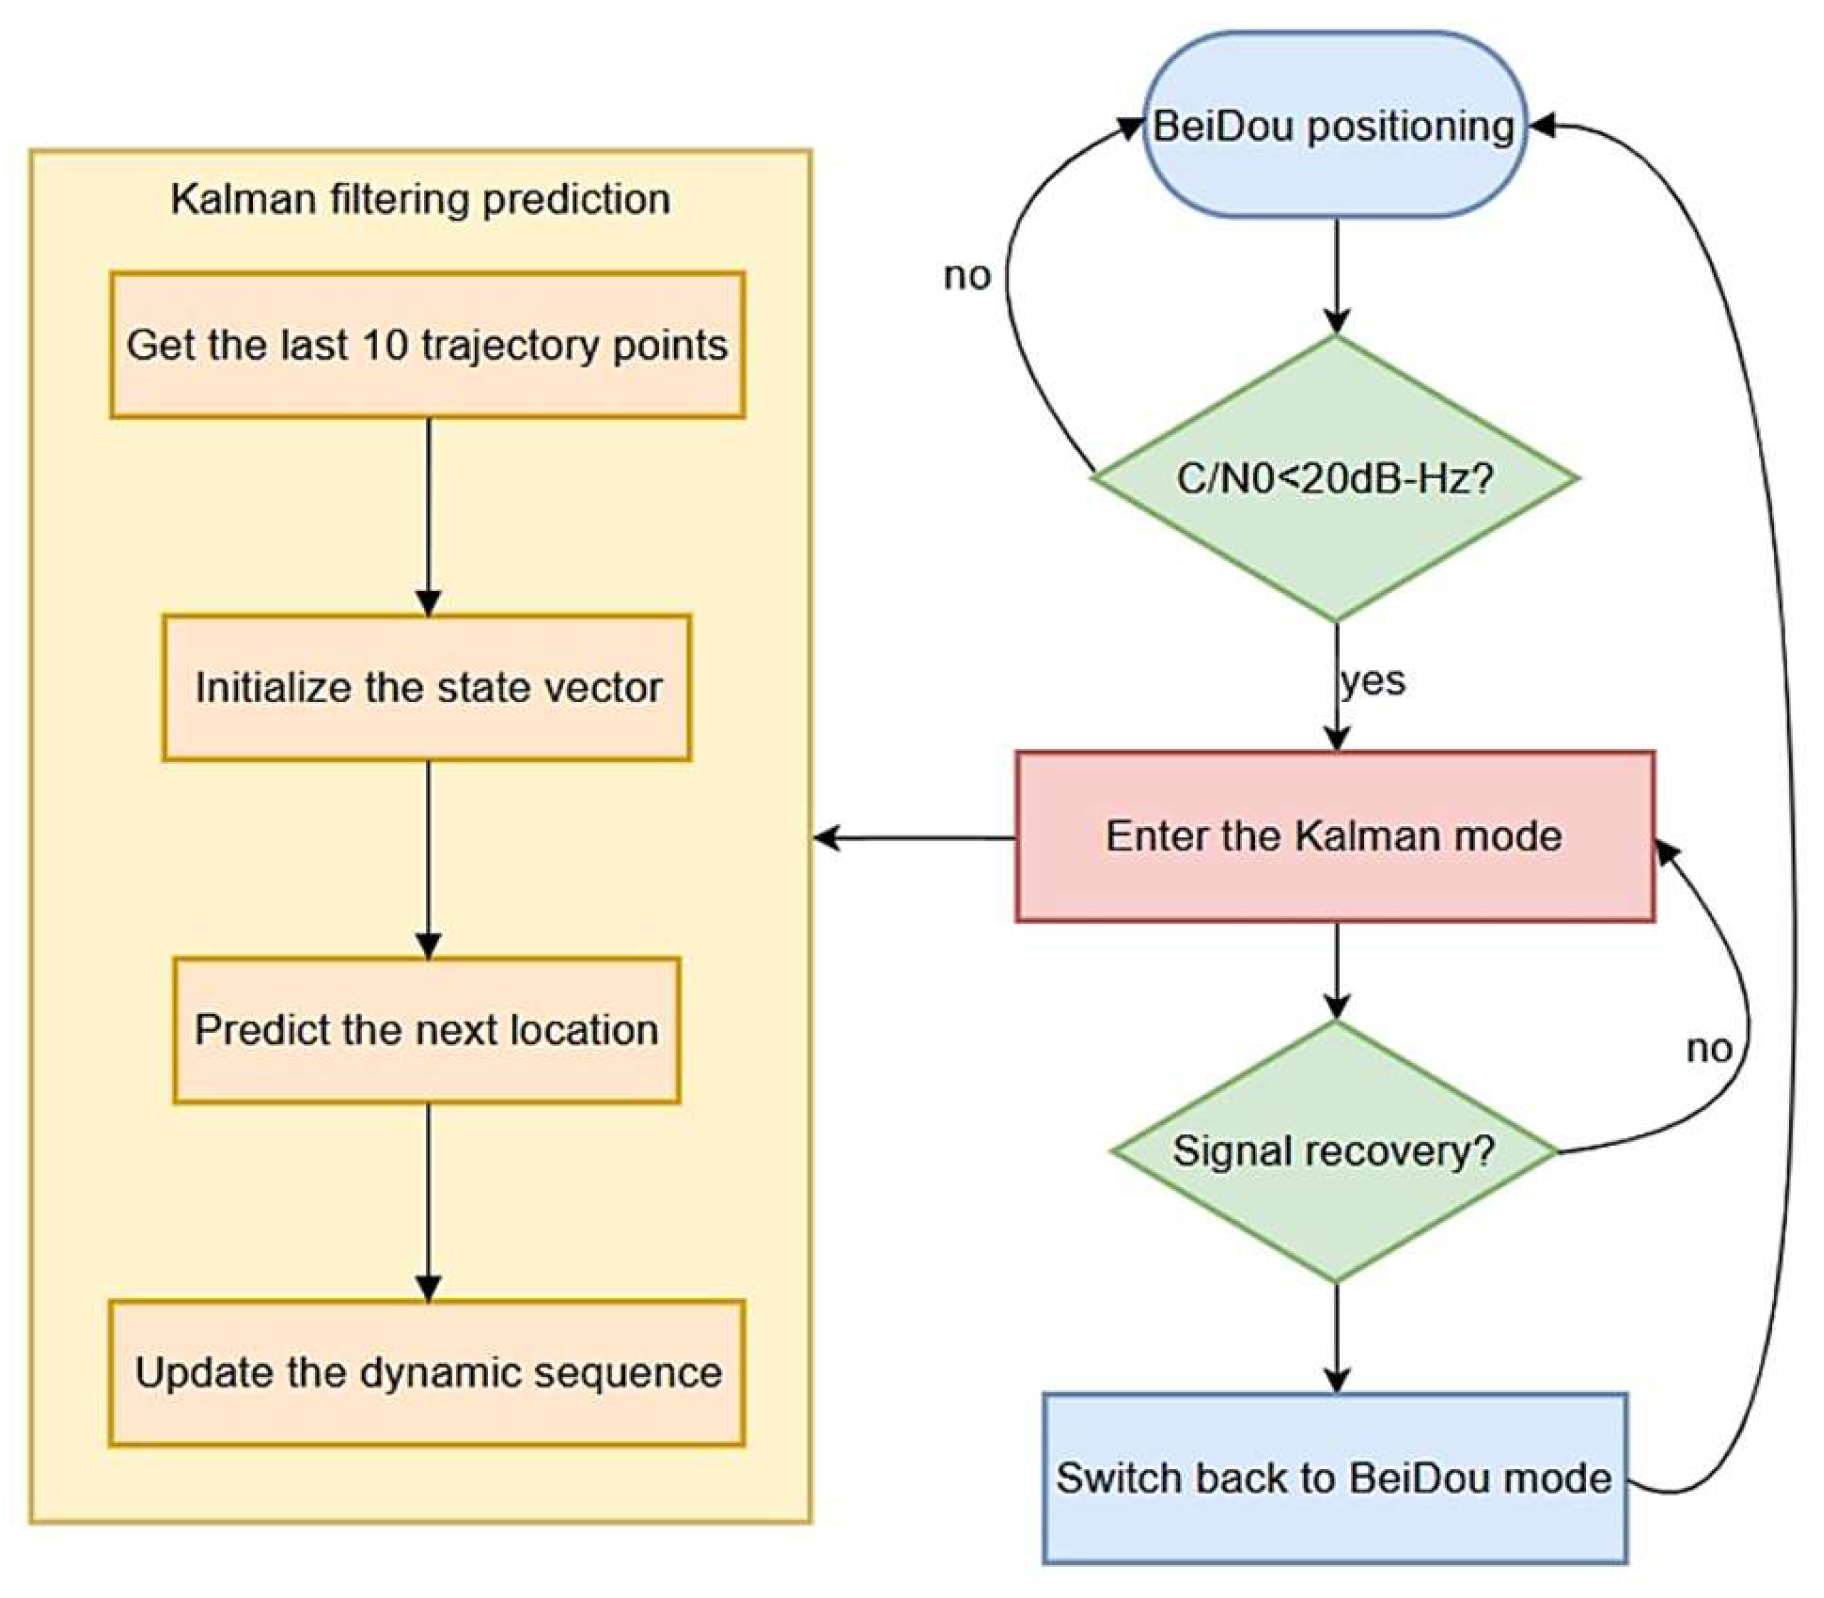
14]. In weak signal environments with intermittent connectivity, this approach may also cause sampling queue fragmentation. This study innovatively integrates dynamic memory management with BeiDou positioning: a FreeRTOS-based linear incremental allocation strategy enabled on-demand resource distribution while preventing memory fragmentation. During signal interruptions, Kalman prediction automatically filled data gaps, establishing a dual “hardware anti-interference + software fault-tolerance” safeguard. Table 1 benchmarks this system against existing solutions.
In summary, to address demands for high precision, portability, and stability in area measurement, this paper presents an instrument integrating a domestic BeiDou positioning chip and an STM32 microcontroller (STMicroelectronics, Paris, France). The system leverages BeiDou positioning, FreeRTOS real-time operation, and dynamic memory management to significantly enhance flexibility and resource efficiency. Through precise data processing and adaptive resource strategies, it maintains high reliability even in unstable signal environments, overcoming traditional GPS limitations in signal-degraded areas. Users obtain rapid area measurements by traversing target perimeters with the handheld device, offering technical support for land resource planning, agricultural management, and surveying applications.

2. Principle of Operation

2.1. Distance Measurement Principle

The spherical triangle circle formula is a commonly used distance calculation method [15]. As shown in Figure 2, N is the north pole of the earth, P and Q are two points on the earth, whose latitudes are l a t 1 and l a t 2 , respectively, and the longitudes are l o n 1 and l o n 2 ; α 1 and α 2 are spherical angles (where the latitude and longitude are, respectively, radian), and the distance between PQ points is D. Using the spherical triangle formula
cos l a t 2 cos α 2 = sin l a t 1 sin D cos l a t 1 cos α 1 cos D
It can be solved that the spherical distance between PQ points is
D = R arccos sin l a t 1 sin l a t 2 + cos l a t 1 cos l a t 2 cos l o n 1 l o n 2
where R is the radius of the earth, in meters.

2.2. Area Measurement Principle

2.2.1. Theoretical Basis of Green’s Formula

Green’s formula provides a feasible way to calculate the area of the plane region of the known boundary curve equation [16,17,18]. Let D be a closed domain on the xy plane, whose boundary consists of smooth closed curves. If the sum of functions P x , y and Q x , y has a continuous first order partial derivative on D, then
L P x , y d x + Q x , y d y = D Q x P y d x d y
When a specific function combination P x , y = 1 2 y , Q x , y = 1 2 x is selected, the right-hand integrand is simplified as
Q x P y = 1 2 + 1 2 = 1
At this time, Green’s formula is transformed into an area integral
S = 1 2 L x d y y d x

2.2.2. Discretization and Polygon Approximation

Suppose that the boundary curve recorded by the instrument is surrounded by a closed region D, and the plane coordinates of each point in the region D are obtained as shown in Figure 3.
At the same time, P i P i + 1 is expressed as a parameter equation
P i P i + 1 = x = x i + t Δ x i y = y i + t Δ y i 0 t 1
where Δ x = x i + 1 x i , Δ y = y i + 1 y i . Substituting the parameter equation of each line segment into the line integral formula, the piecewise integral result is obtained as
P i P i + 1 x d y y d x = 0 1 x i + t Δ x i Δ y i y i + t Δ y i Δ x i d t = x i y i + 1 x i + 1 y i

2.2.3. Polygon Area Synthesis

The area calculation formula is obtained by summing up the results of all side integrals as
S = 1 2 Σ n i = 1 x i y i + 1 x i + 1 y i
The user steps the point sampling through the handheld measuring instrument, and the satellite positioning module can collect the latitude and longitude coordinates of each point in the target area. Therefore, the area of any irregular area can be calculated based on Green’s formula.

3. Hardware System Design

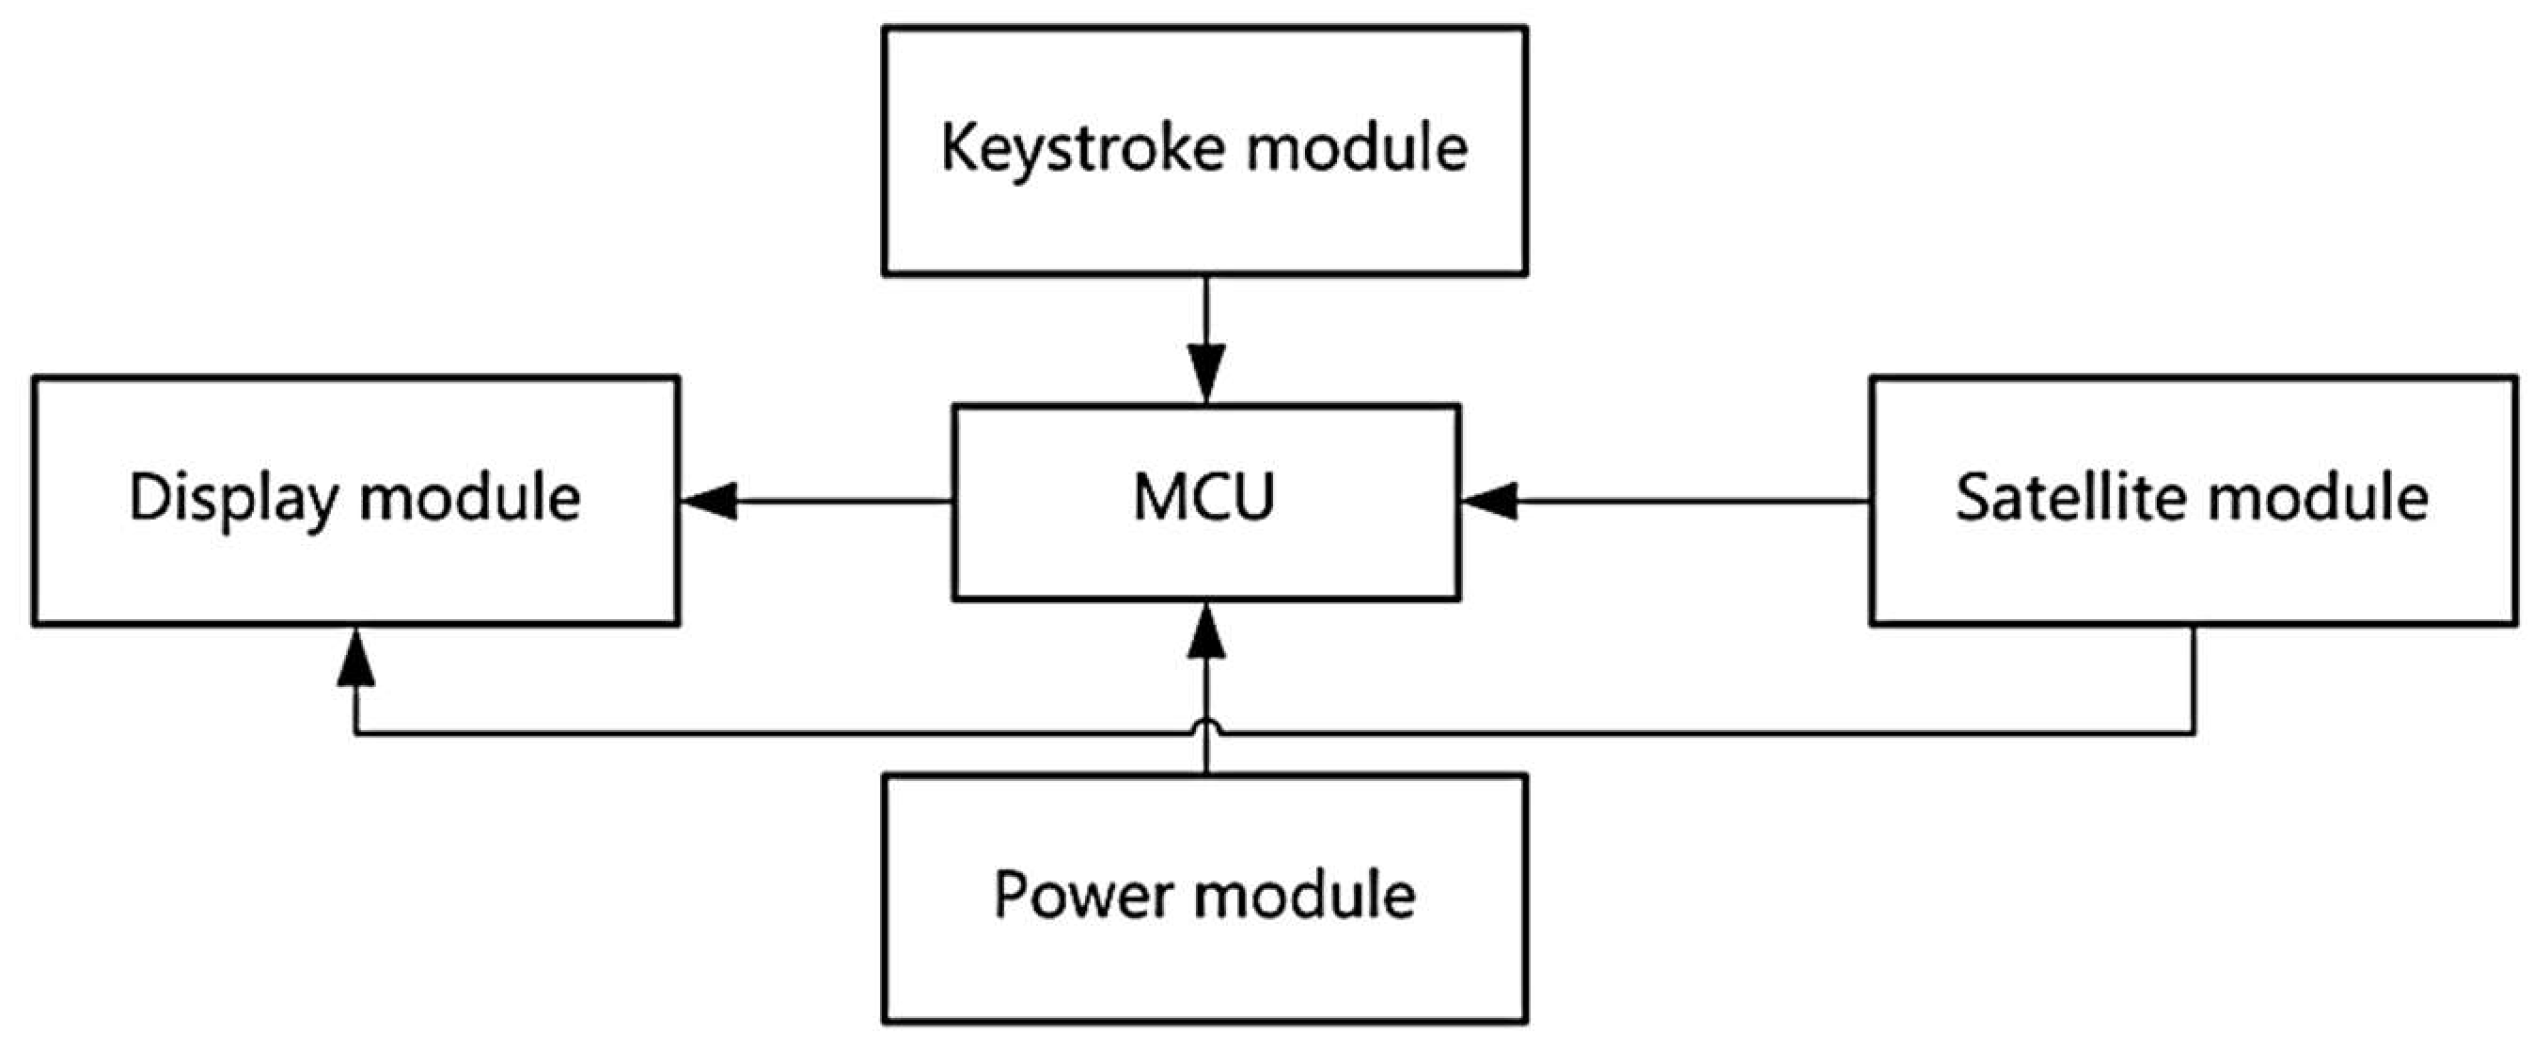
The system architecture comprises five integrated modules: microcontroller, power management, satellite navigation, OLED display, and key interface in Figure 4.
The microcontroller (MCU) selects STM32 F103, which is a 32-bit MCU based on the ARM Cortex-M3 core (ARM, Cambridge, UK). It has high working frequency, rich memory, multiple peripheral interfaces and low power consumption characteristics.
The power supply system uses a DC 5 V power supply, and the voltage is stably converted to 3.3 V through the Texas Instruments TPS76133 chip (TI, Dallas, TX, America) to meet the working requirements of each module. The filter capacitor is added to the conversion circuit to ensure the stability of the power supply, reduce interference, and improve the reliability of the system [19].
The core of the BDS satellite module is an ATGM332D chip (Zhongke Microelectronics, Hangzhou, China), which adopts a 40 nm RF-SoC process, and the cold start sensitivity is −148 dBm (2.3 dB higher than u-blox M8N). It has a unique BDSBAS satellite-based enhancement function through the GEO satellite broadcast differential correction number so that the single point positioning accuracy is from 3 m to 1.5 m. The built-in multipath suppression module of the chip adopts narrow correlator technology, which can reduce multipath error by more than 60% [20]. The chip supports both active and passive antenna modules. This design uses an active SMA interface antenna; it is compared with the general u-blox NEO-M8N (GPS module) on the market. The comparison results are shown in Table 2.
The liquid crystal display module adopts the 2.42-inch OLED liquid crystal display screen of Zhongjingyuan Electronics (Zhengzhou, China), which has the characteristics of high contrast, wide viewing angle and fast response. It can clearly display the measurement data, trajectory and other information, which is convenient for users to view in real time.
The key module is powered by +5 V DC, and the key processing thread reads each GPIO pin value circularly to realize the user‘s control of each functional thread, such as starting the measurement and ending the measurement. The operation is simple and the user experience is improved.
The overall hardware design is compact and the function is comprehensive, which provides a solid foundation for the accurate measurement and stable operation of the area measuring instrument. 
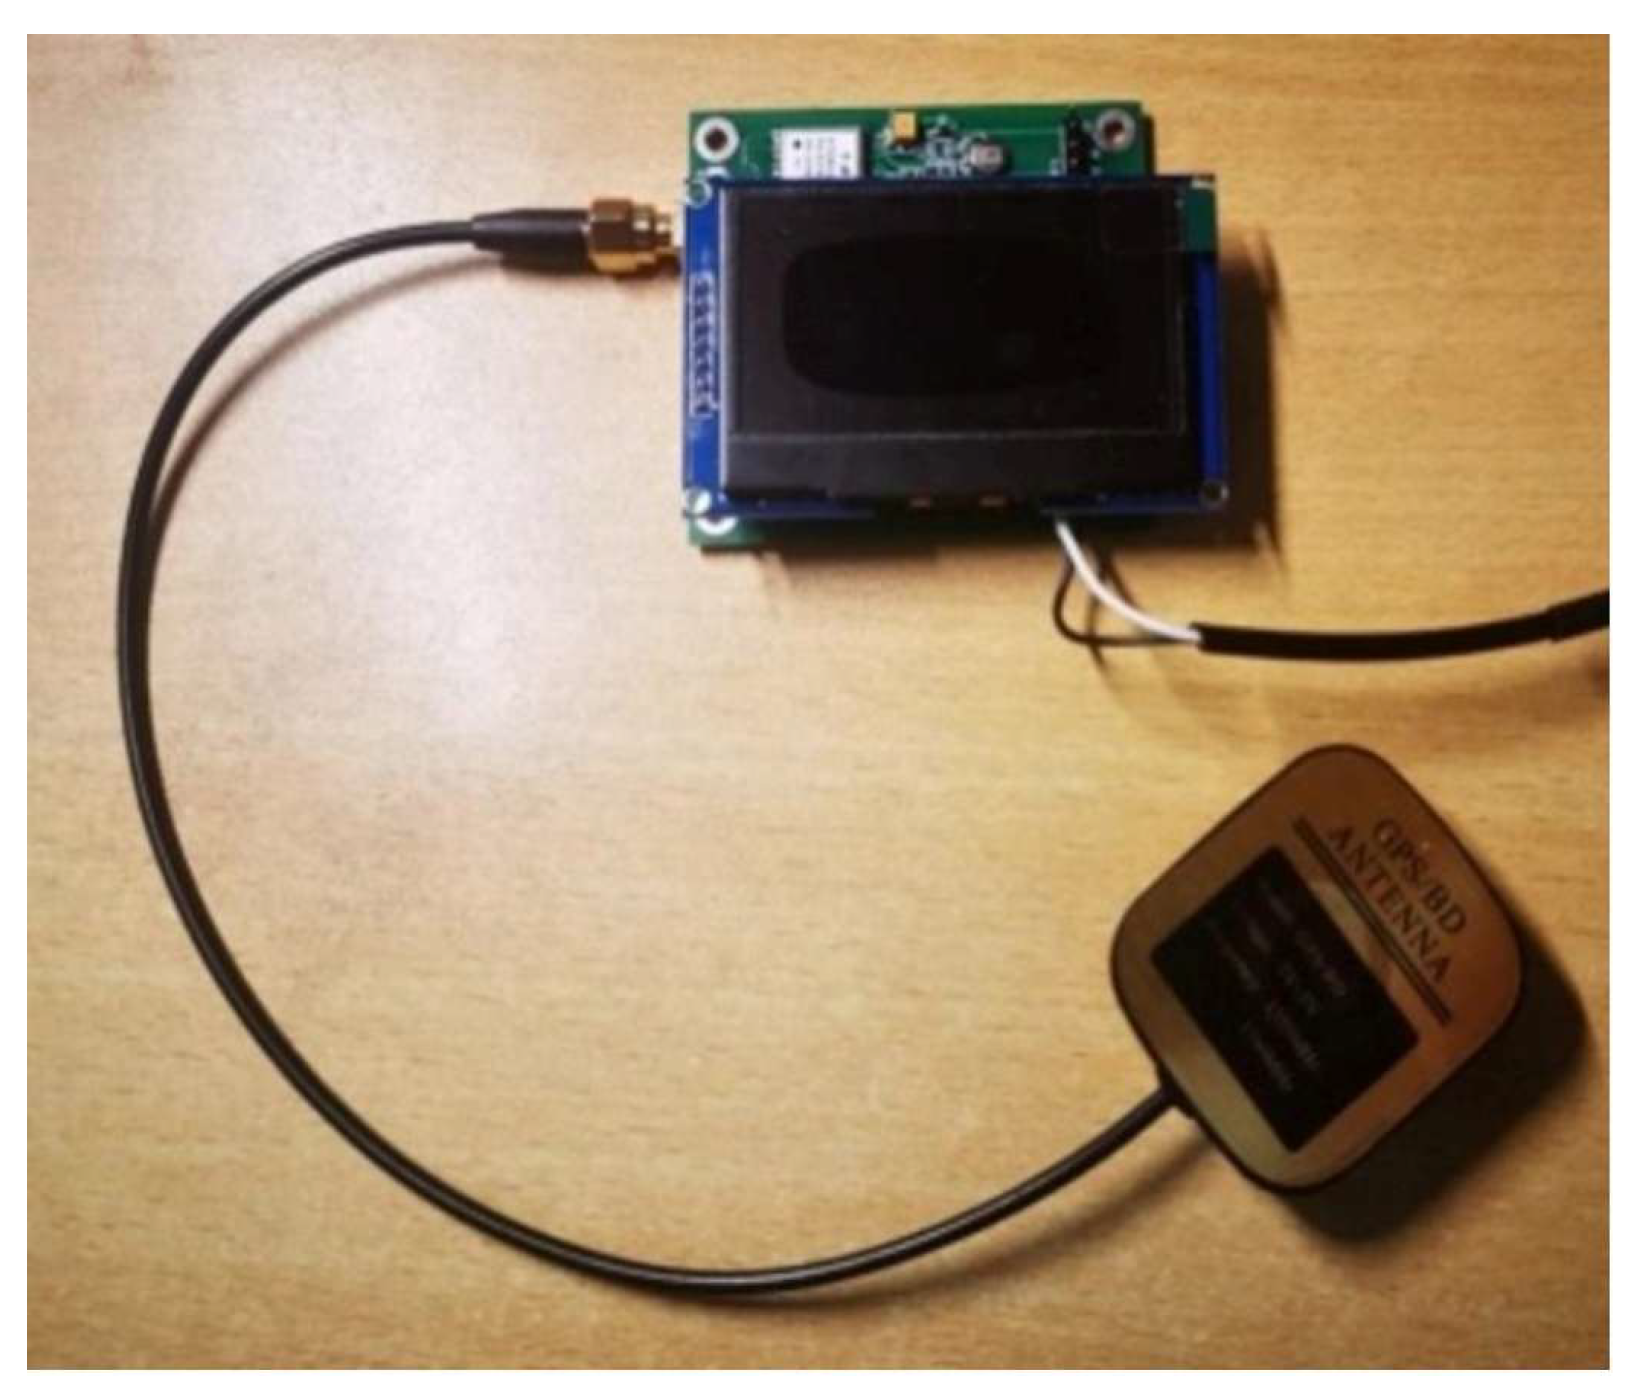
Figure 5 is the hardware photo of the area measuring instrument.

4. Embedded Programming

4.1. FreeRTOS Memory Management Strategy Optimization

Given the specialized functionality of this design—with infrequent task thread creation/deletion and constrained microcontroller memory—the system implements FreeRTOS’s heap_1 allocation scheme [21,22,23,24]. Compared to commercial measurement instruments, the heap_1 strategy demonstrates superior operational efficiency on the resource-limited STM32F103 microcontroller (STMicroelectronics, Paris, France): the absence of dynamic memory release prevents fragmentation risks while ensuring long-term stability [25]. Performance metrics confirm that allocation operations (requiring only pointer arithmetic and critical section protection) average < 2 μs. Residual memory is monitored in real time via xPortGetFreeHeapSize(). Experimental results indicate ≤ 82% memory utilization under a full load, with reserved capacity accommodating extreme scenarios while balancing real-time performance and memory efficiency.

4.2. System-Level Integration of Dynamic Memory Management

Conventional approaches store collected data using static memory allocation. However, unpredictable land area dimensions and geometries preclude prior knowledge of required sampling points. Excessive pre-allocation wastes storage resources and constrains auxiliary functions, whereas insufficient allocation risks memory overflow and system failure. Dynamic memory management thus enhances flexibility and stability [26,27], aligning resource utilization with operational demands.

4.2.1. Linked List Structure Memory Model

This design employs a linked-list data structure to manage sampled geospatial points. A Node structure in Table 3 stores latitude/longitude coordinates and a pointer to the subsequent node, forming a singly linked list. Upon acquiring new coordinates, memory is dynamically allocated to instantiate this structure.
The structure forms a one-way linked list. When the new coordinate data is collected, the corresponding memory space is dynamically allocated and the data is stored in the form of the structure.

4.2.2. Dynamic Memory Management Related Code

This section describes the dynamic memory allocation strategy for storing real-time GPS trajectory data. The pseudo-code Algorithm 1 below initializes a linked list, allocates memory for new nodes upon data arrival, and handles allocation failures:
Algorithm 1: Dynamic memory management part of the pseudo code
Input: GPS data stream
Output: Trajectory linked list
1: Initialize empty linked list
2: while system running do
3:  if new GPS data available then
4:    allocate new_node ← malloc(Node)
5:    if allocation successful then
6:      store coordinates in new_node
7:      insert new_node into linked list
8:    else
9:      trigger memory warning
10:    end if
11:  end if
12:  wait for next sampling interval
13: end while

4.3. Robustness Enhancement of Kalman Prediction

4.3.1. Kalman Filtering Prediction

The Kalman filter is an algorithm for optimal prediction of dynamic systems through recursive state estimation. Its core idea is based on the “prediction–correction” cycle. In satellite positioning, the algorithm suppresses random noise and improves positioning accuracy by fusing the dynamic characteristics of historical trajectories with current observations. In this design, the Kalman filter is innovatively extended from the traditional real-time positioning optimization to the trajectory prediction after signal loss. The state equation is:
X k = F k 1 X k 1 + ω k 1 Z k = H X k + υ k
  • X k is a state vector including longitude, latitude, meridional velocity, and zonal velocity.
  • F is the state transition matrix:
    F = 1 0 Δ t 0 0 1 0 Δ t 0 0 1 0 0 0 0 1
  • ω k is the process noise, which conforms to the normal distribution (0, Q), and the process noise co-square is Q = diag 0.2 2 , 0.2 2 , 0.1 2 , 0.1 2 .
  • Z k is the observation value (satellite positioning coordinate), and v k is the observation noise.

4.3.2. Emergency Mechanism Design

When the device detects that the C/N0 in the chip output NMEA-0183 protocol is less than 20 and exceeds three seconds, the emergency mechanism is triggered, and the system automatically switches to the Kalman filter prediction mode. The flow chart of this process is shown in Figure 6.

4.3.3. Kalman Prediction Related Code

This section details the Kalman filter implementation for position prediction during GPS signal loss. When signal interruption occurs, the system uses the average velocity from recent position points to estimate subsequent coordinates. The prediction process is formalized in Algorithm 2 below.
Algorithm 2: Kalman Prediction Pseudocodes
Input:
   RecentPoints  // Last 10 position points
   SignalLost   // True when signal lost
Output:
   PredictedPos  // Predicted coordinates
1: Initialize state X with [lon, lat, v_lon, v_lat]
2: while SignalLost do
3:   v_avg ← average_velocity(RecentPoints)
4:   X ← predict_next_position(X, v_avg)  // State prediction
5:
6:   new_node ← allocate_memory()
7:   new_node.position ← [X [0], X [1]]
8:   add_to_trajectory(new_node)
9:
10:   wait(1000ms)  // 1s prediction cycle
11: end while

4.4. The Design of the Program Function

Based on FreeRTOS, functional requirements are partitioned into discrete threads: data processing, display rendering, ADC acquisition, and keystroke monitoring. Following microcontroller initialization, these threads execute concurrently. Figure 7 illustrates their collaboration, with dashed lines denoting control flow and solid lines representing data flow.

4.4.1. Serial Interrupt Program

Serial communication employs an interrupt-driven scheme to ensure real-time responsiveness while minimizing CPU utilization. The interrupt handler parses the $GNRMC frame from the BeiDou module’s NMEA-0183 protocol output, extracting UTC time, positioning status, latitude/longitude coordinates, ground speed, azimuth, date, magnetic declination, and checksum values. Valid frames trigger notification to the data processing thread for spatiotemporal coordinate extraction [28,29,30].

4.4.2. Data Processing Thread

According to the above mathematical principle of length and area measurement, the corresponding data processing thread was designed. After receiving, the serial interrupt program captures the valid information frame. Then the data processing thread detects the validity of the information frame and extracts the spatiotemporal information from the information frame, and then stores the coordinate information. At the same time, the sampled information is packaged and sent to the OLED screen display thread for user monitoring. The sampling flow chart in the data processing thread is shown in Figure 8.
Considering the drift of data information and preventing the device from oversampling, the distance between the collected position coordinates and the previous position coordinates is calculated by using the large circle distance formula during each storage, and detecting whether the distance is greater than a certain threshold. If it is greater than the threshold, it is stored.
In order for the user to end the sampling, they must press the corresponding button. At this time, the thread will process, calculate the area, and draw the user’s stepping point trajectory according to the collected data.

4.4.3. Keystroke Threads

In the key thread, the key is polled every 30 ms, and the processed results are packaged and sent to the corresponding thread to change the running state of the corresponding thread and realize the user’s control of the device.

4.4.4. ADC Read Thread

In order to read the power information of the power supply battery and ensure the normal operation of the system, the built-in analog-to-digital converter (ADC) of STM32 is used to convert the analog power signal into a digital signal. The ADC thread polls the ADC and packages the results to the OLED screen (ZhongJinYuan, Zhengzhou, China) thread for display.

4.4.5. OLED Screen Display Thread

When the display thread receives the data packets of the data processing thread and the ADC thread, it is displayed on the OLED screen after processing. Once it receives the data packet from the key thread, the display interface is switched.

5. Measurement and Analysis

5.1. Statistical Analysis Method

According to the accuracy evaluation standard, this experiment uses five independent measurements to evaluate the repeatability of the system. The calculation formulas for the standard deviation (σ) and coefficient of variation (CV) are as follows:
σ = 1 n 1 Σ n i = 1 x i μ 2
C V = σ μ 100 %
In the formula: x i is a single measurement value, μ is the sample mean value, n = 5. The Shapiro–Wilk test is used to verify the normality of the data. According to the critical value table of the Shapiro–Wilk test (sample size n = 5, significance level α = 0.05), when the statistic W > 0.76, the assumption that the data obeys the normal distribution is accepted. The calculation formula of the W statistic is as follows [31]:
W = Σ n i = 1 a i x i 2 Σ n i = 1 x i x ¯ 2
In the formula: a i is a constant coefficient, x i is the order statistic, and x ¯ is the sample mean.

5.2. Function and Precision Test

According to the real-time kinematic (RTK) technical specifications of the global navigation satellite system, the test environment is divided into two categories according to signal strength and terrain complexity: Class A (open flat area, satellite visibility > 80%) and Class B (urban canyon/dense forest area, satellite visibility < 50%). In order to comprehensively evaluate the environmental adaptability of the measurement system, three typical test scenarios were selected in this study: a standard football field (fully open environment), a campus dormitory (semi-closed environment), and a high-rise building intensive area with a weak signal. The test period covers different meteorological conditions, such as sunny, cloudy, and rainy, and repeated measurements are carried out at a fixed time of day to eliminate the daily periodic effect of ionospheric delay.

5.2.1. Football Field Test

A standard football field (with an actual area of 7140 m2) was selected as the reference test area. The area has no shelter and the elevation angle of the horizon is less than 10°, which ensures the complete reception of the satellite signal.
Table 4’s data show that the relative error of each measurement is controlled within 0.67%, which verifies the basic performance of the system in an ideal environment. Figure 9 and Figure 10 show the actual stepping point trajectory and the equipment drawing trajectory, respectively.

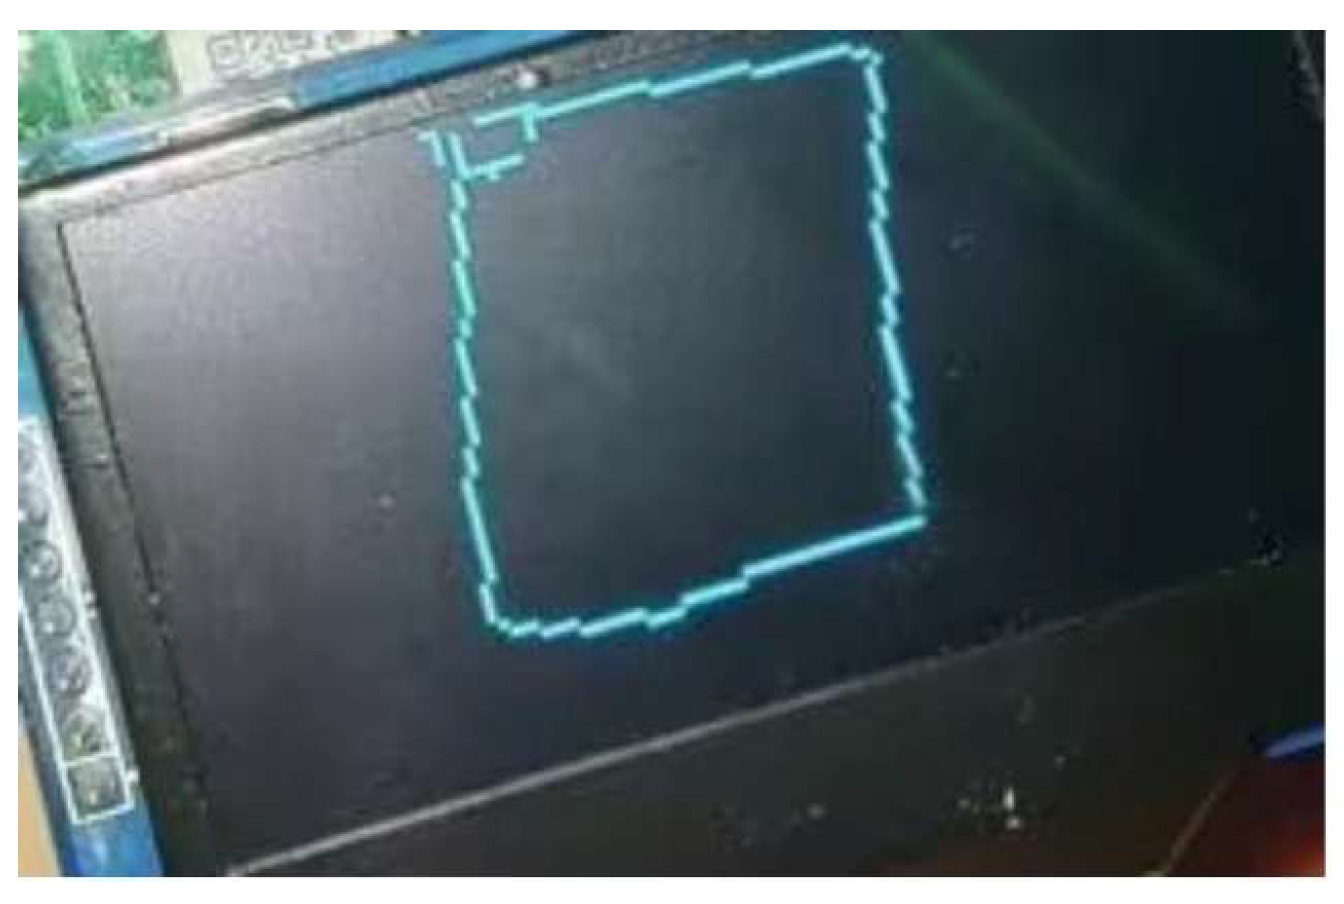
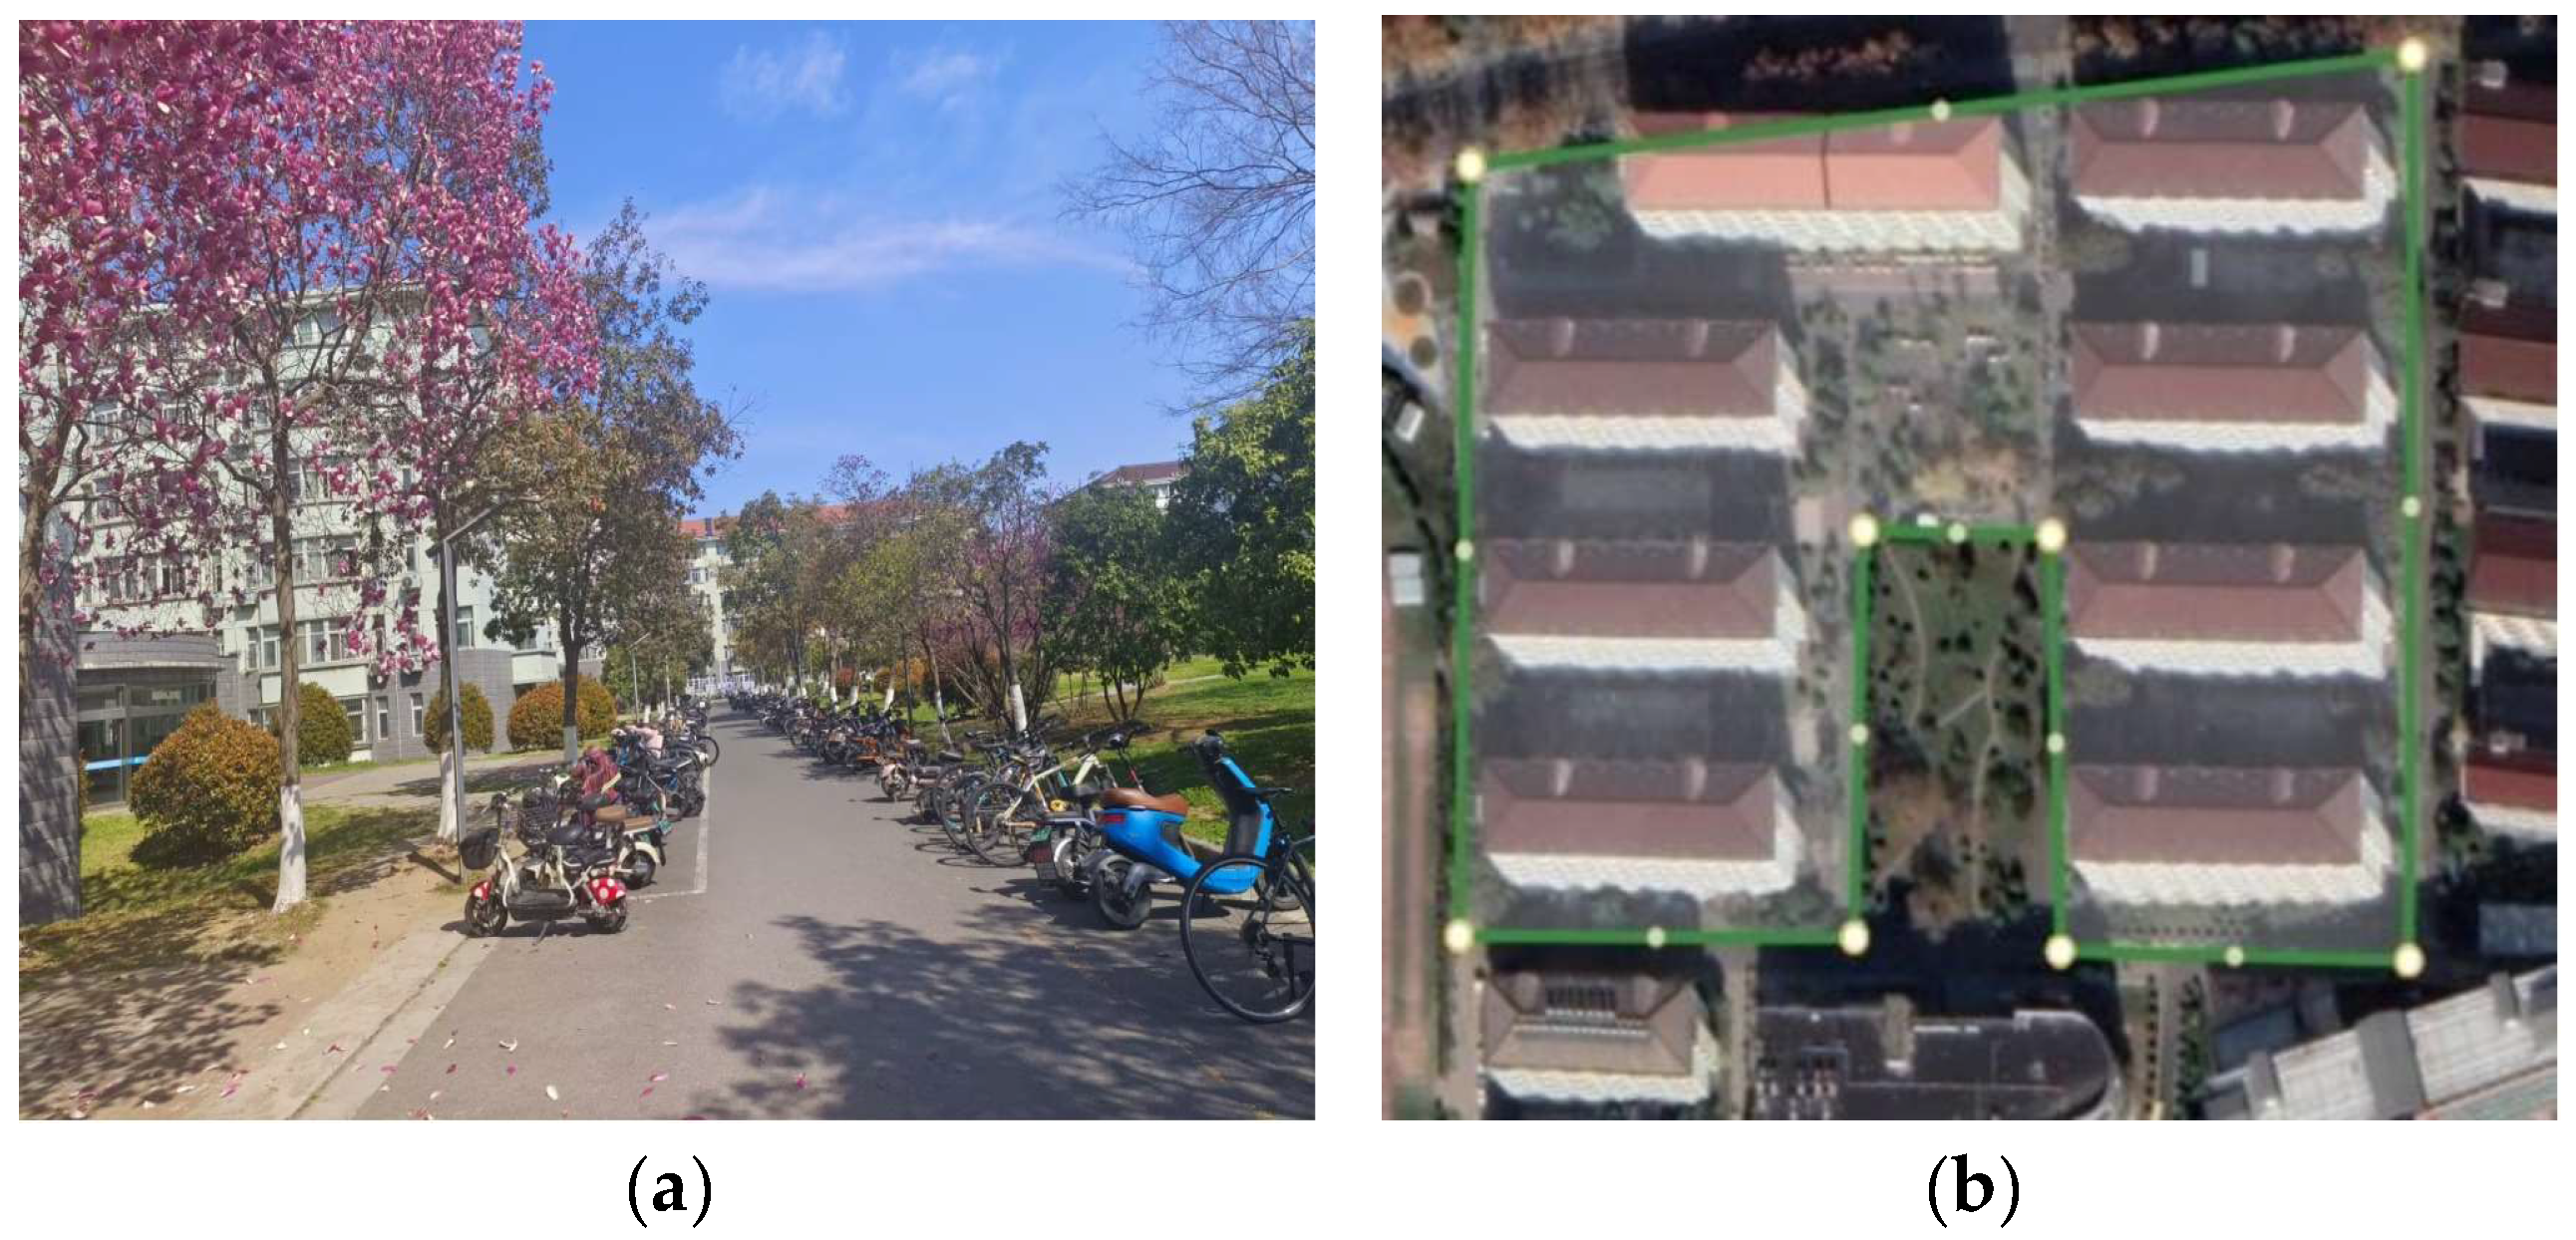
5.2.2. Dormitory Building Area

The second stage test was carried out in the campus dormitory building group area (actual area: 28,490 m2). The average building height in this area is 24 m, and there are many building corners. In terms of signal, due to shelters, such as buildings and trees, around the dormitory building, the satellite signal would be disturbed during the propagation process, resulting in signal attenuation and multipath effects, resulting in low and unstable signal strength received by the receiver.
The test results are shown in Table 5, and the actual trajectory and test trajectory are shown in Figure 11 and Figure 12, respectively.

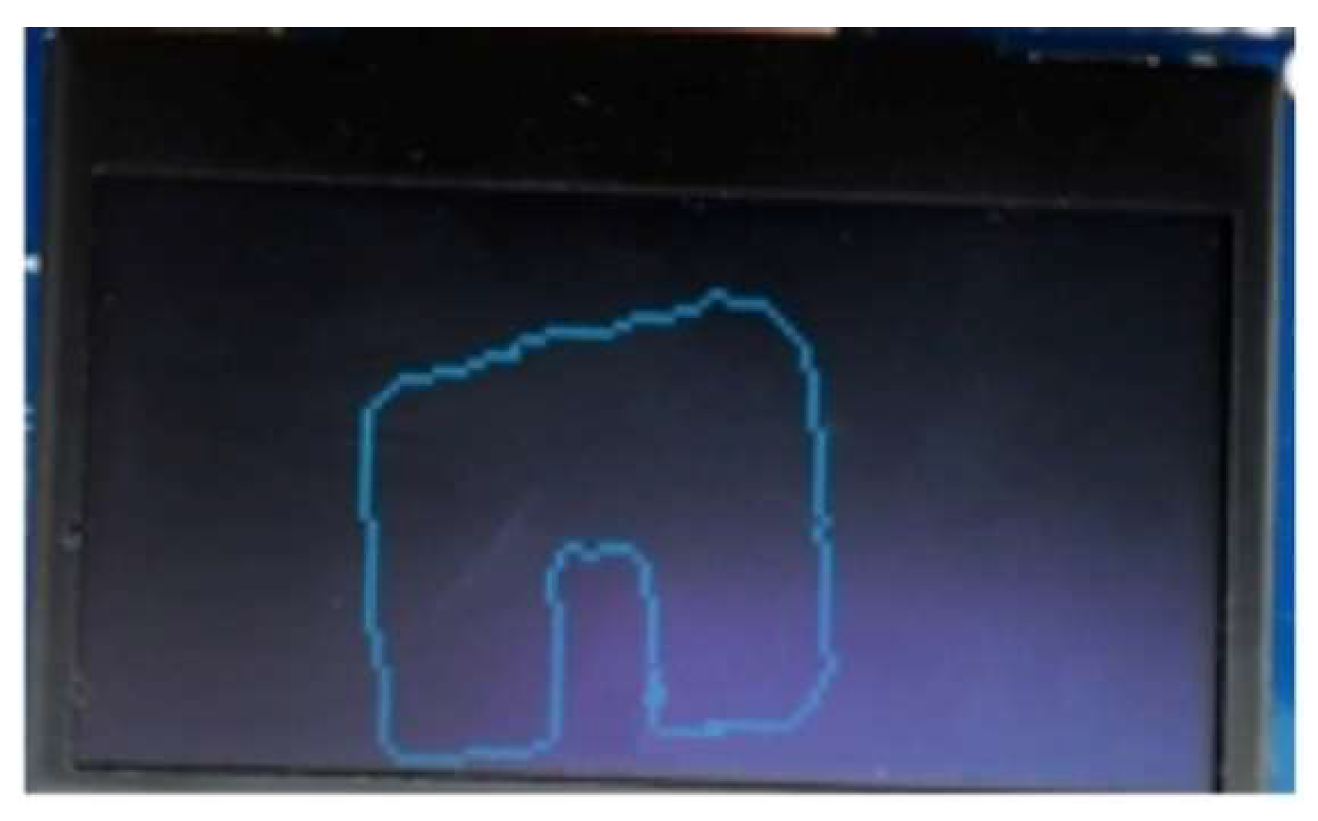
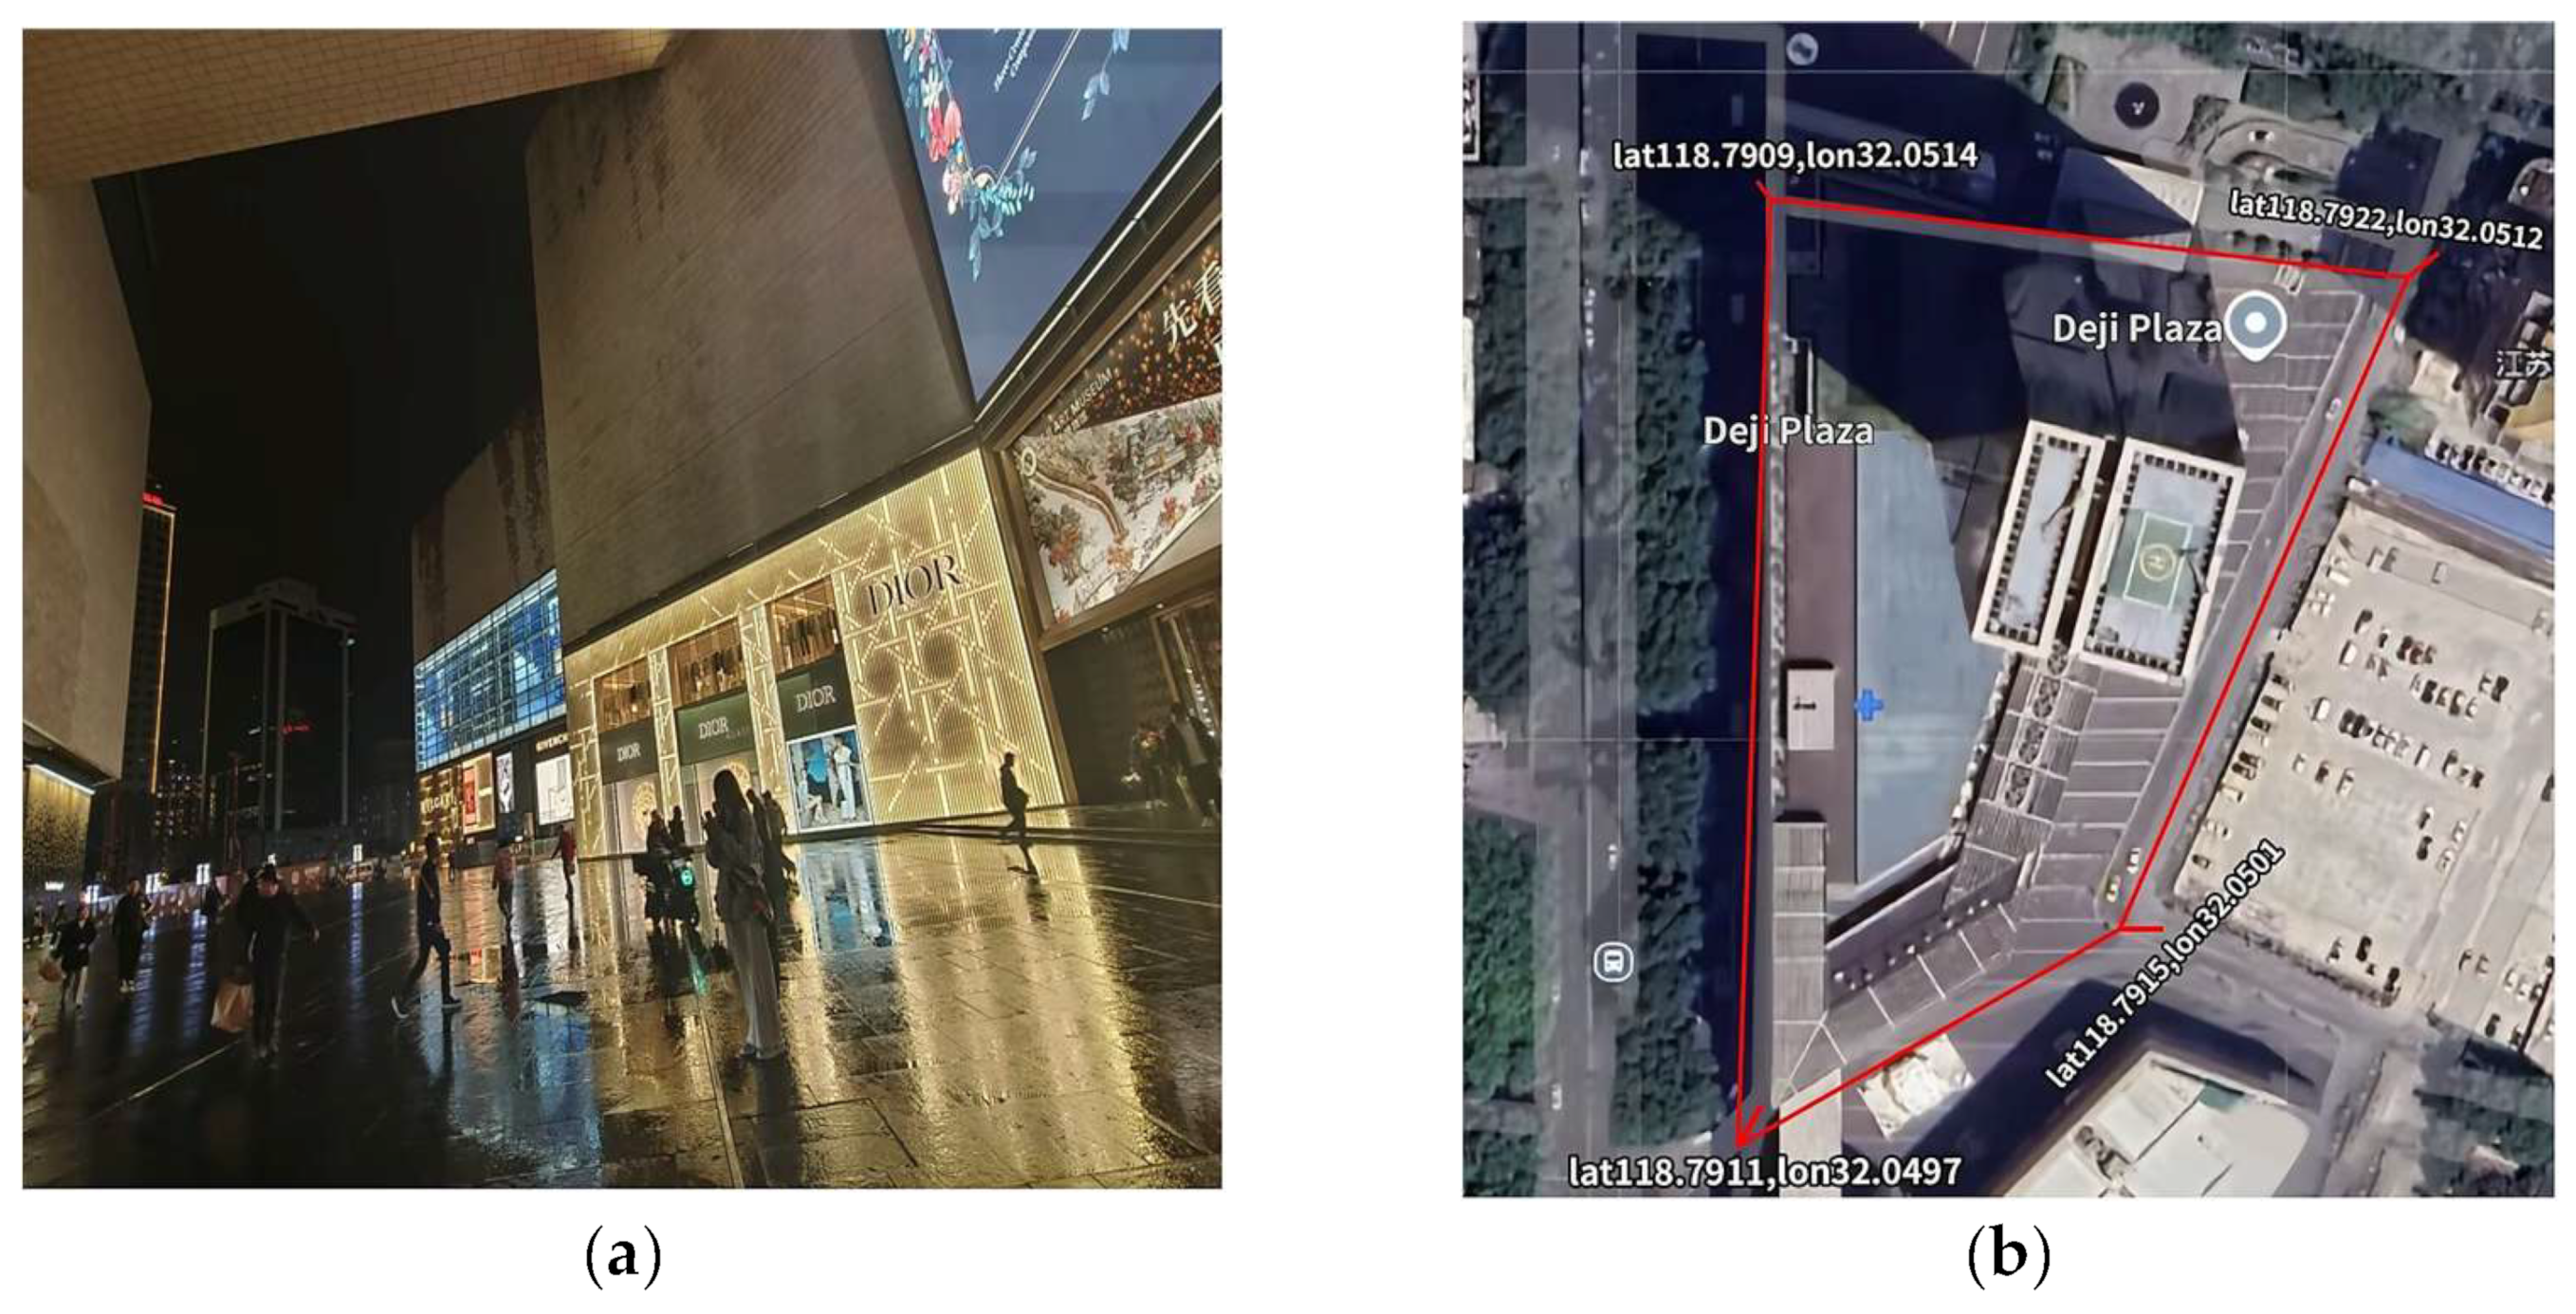
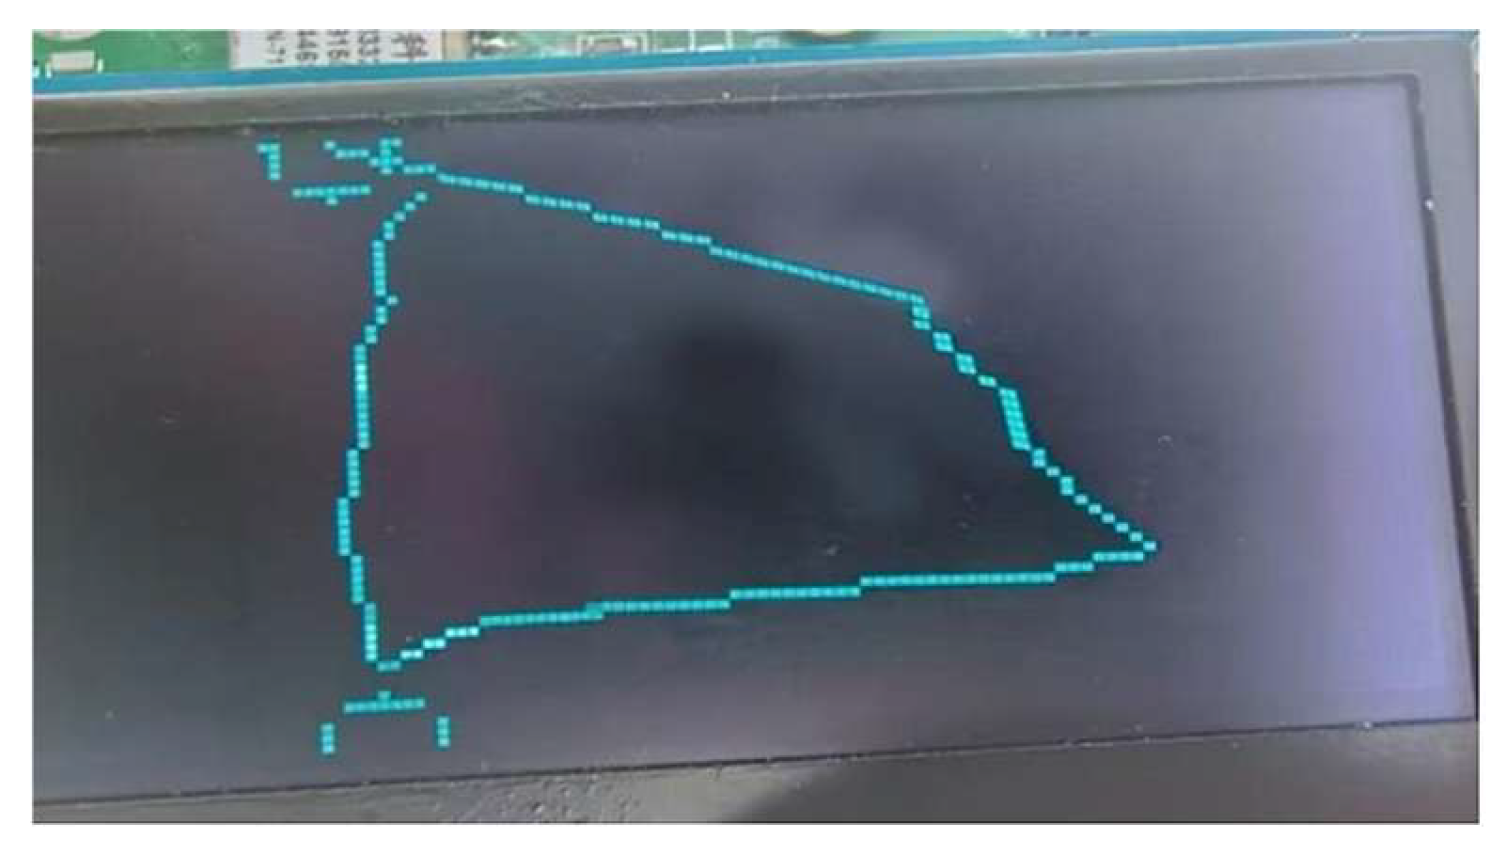
5.2.3. Downtown Area

Finally, we selected Deji Square in Xinjiekou, the busiest area in Nanjing, as a typical downtown test area in Figure 13. The underground part of the square is connected to the subway station, the traffic is dense, and the electromagnetic interference is strong. The area is characterized by dense high-rise buildings, with an average building height of more than 200 m and a minimum building spacing of less than 15 m, forming a complex urban canyon environment. During the test, the number of visible BeiDou satellites was reduced to 5–8 (the GPS was 4–6 in the same period), the average carrier-to-noise ratio was 6.2 dB-Hz lower than that in the open area, and the multipath effect was significantly enhanced. The area data of five repeated measurements are shown in Table 6. The comparison between the actual trajectory and the test trajectory is shown in Figure 14. The maximum relative error of 2.72% verifies the reliability of the equipment in this signal attenuation environment.

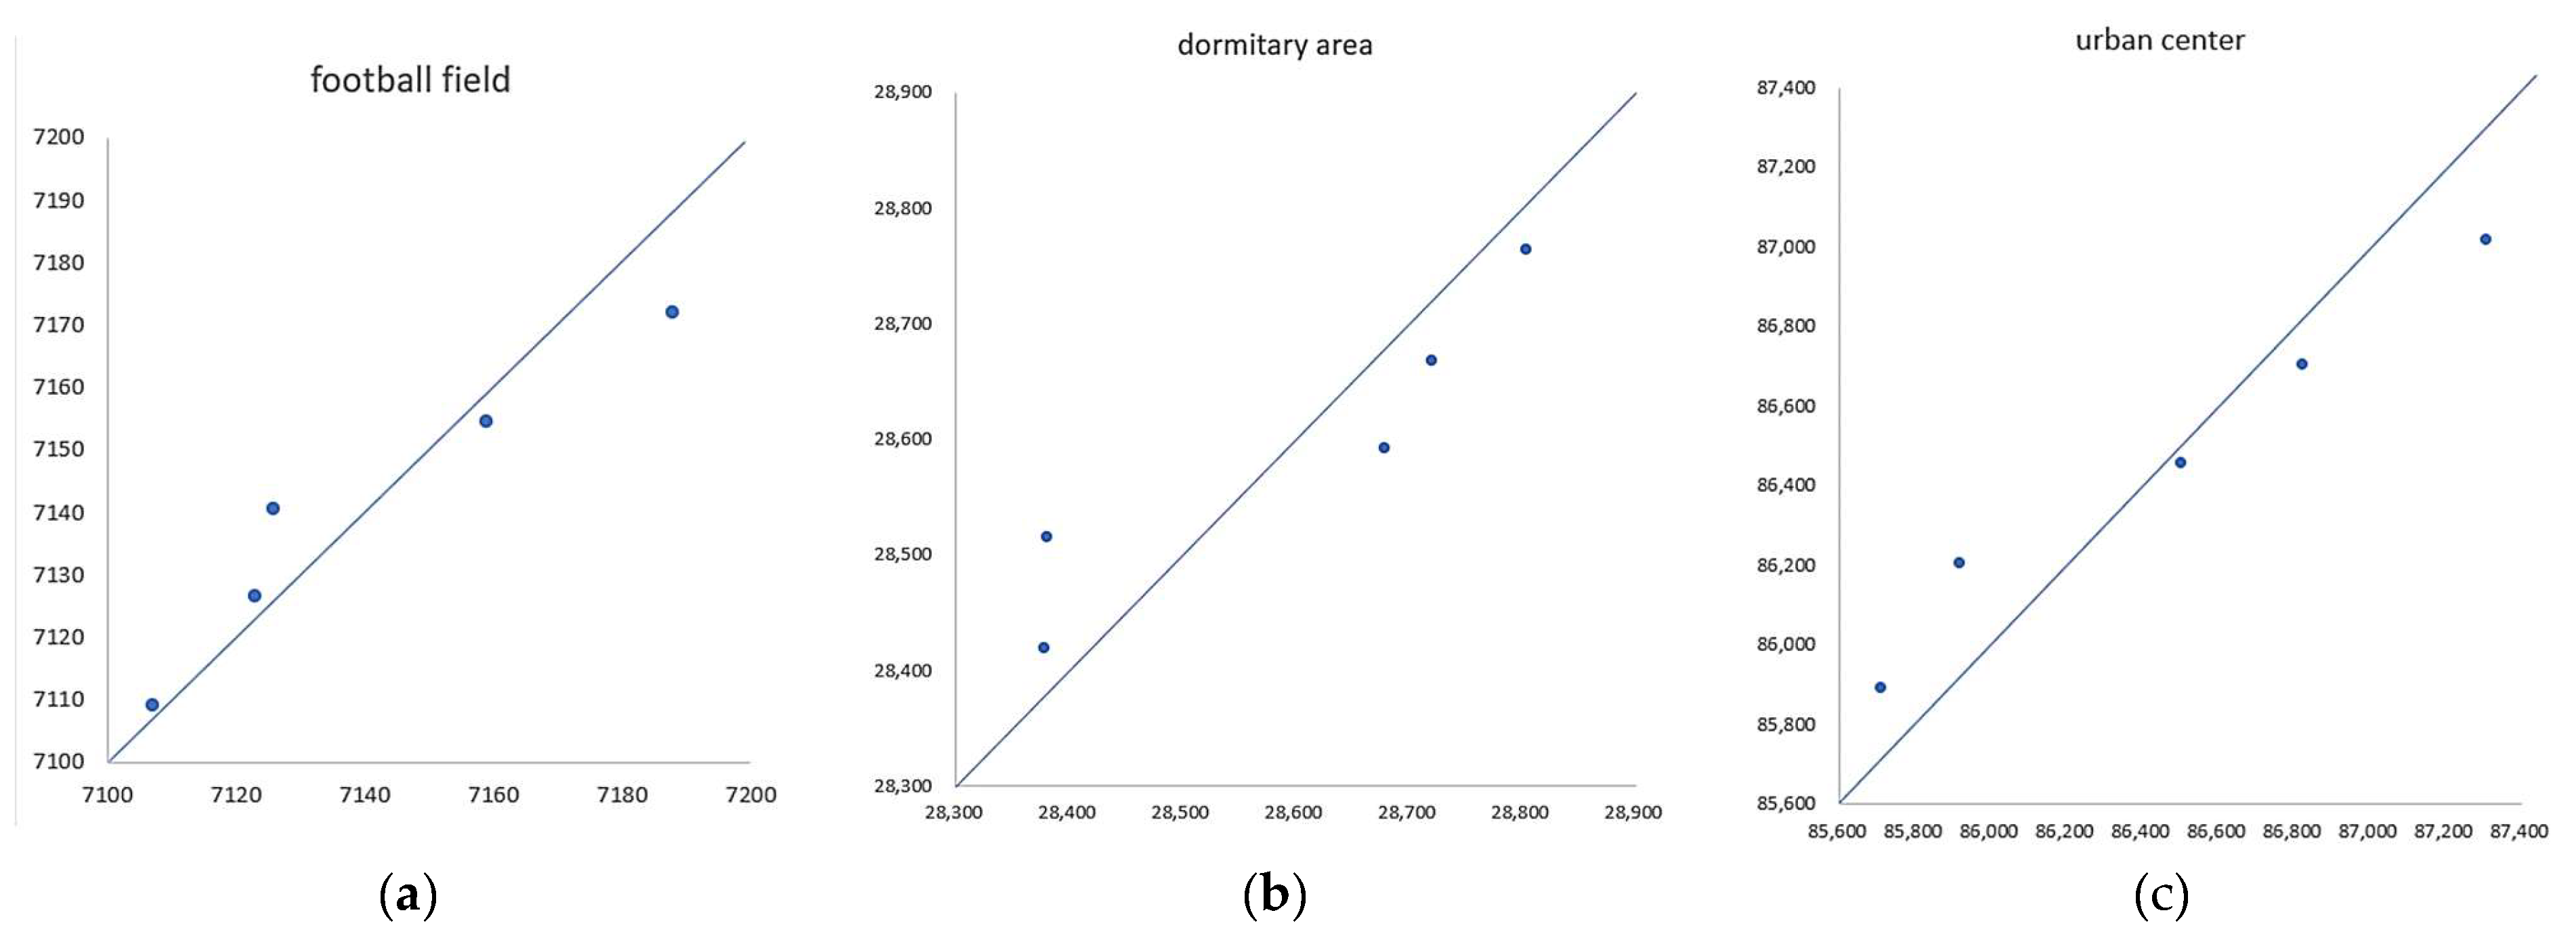
5.3. Measurement Repeatability Analysis

In order to quantify the measurement repeatability, five independent samplings were performed on each scene. The calculated standard deviations σ are 28.9 m2 (football field), 156.7 m2 (dormitory area), and 547.8 m2 (downtown area), respectively, and the corresponding coefficient of variation CV = 0.40 ~ 0.64%, which is lower than the industry standard limit. The Q-Q plot of the three types of areas is shown in Figure 15. Comparing the quantile of the measured value with the theoretical normal distribution, it can be seen that the scatter points are basically distributed along the y = x line. The Shapiro–Wilk normality test shows that a test statistic of W = 0.92–0.97 (critical value W _ critical = 0.762, n = 5, α = 0.05), a significance level of p > 0.1, and assumes that the measured data obeys the normal distribution.

5.4. Signal Interruption Comparison Experiment

In order to verify the reliability of the “dynamic memory + Kalman filter” scheme in the signal interruption scenario, a comparative experiment was carried out in the Deji Square area (actual area: 85,000 m2). In the experiment, two additional control groups were set up to calculate and compare their area errors, and the number of memory allocation failures was counted through the FreeRTOS memory management hook function. The memory overflow rate is the number of allocation failures divided by the total number of allocations.
  • Control group 1: GPS + fixed memory: u-blox NEO-M8N module, memory pre-allocated 100 nodes
  • Control group 2: BeiDou + fixed memory: use ATGM332D chip (Zhongke Microelectronics, Hangzhou, China) but disable dynamic memory management, memory pre-allocated 100 nodes
  • This design: dynamic memory + Kalman filter mechanism
During the experiment, the antenna is occluded for ten seconds (analog signal interruption) after three minutes of measurement, and the measurement is repeated five times. The test results are shown in Table 7.
Results analysis:
  • The advantages of a physical layer: The error of the BeiDou group is 12.9% lower than that of the GPS group, which verifies the reliability of the BeiDou satellite in a weak signal environment.
  • Software-layer enhancement: The dynamic memory scheme further compresses the error by 45.7%. There is no trajectory fracture in the experimental group, while the fixed memory group has an average data loss of 1.4 due to queue overflow caused by satellite positioning errors or signal interruption recovery.

5.5. Energy Consumption Assessment

In order to test the energy consumption of this design, we selected the GPS positioning module u-blox NEO-6M (u-blox, Thalwil, Switzerland) commonly used in the market to conduct power consumption comparison experiments with this design. The test platform selected was the laboratory digital–analog hybrid test platform ST3020, and it performed an FVMI analysis on standby mode (only maintaining the RTOS idling) and continuous positioning mode (1 Hz positioning + screen brightness), respectively. The power supply voltage was 3.3 V ± 1%, and the ambient temperature was 20 °C. The test results are shown in Table 8.

5.6. Error Analysis

The above test results show that the designed area measuring instrument can achieve ideal measurement accuracy, but there are still small errors. The causes of area measurement error are mainly divided into hardware error and software error. The hardware errors of satellite and receiver are mainly related to the signal frequency, signal modulation mode, satellite, and receiver types. The type and positioning method of the receiver have a significant impact on the estimation of the region. For example, in the measurement area, the accuracy of differential GPS measurements is higher than that of autonomous positioning systems [32]. The positioning error of satellite navigation is mainly divided into satellite errors, propagation errors, and receiving errors, which are generated by different hardware modules during propagation, measurement or reception [33,34]. Software errors mainly come from the discretization of the area by the numerical method, which leads to a reduction in accuracy. For this kind of error, the accuracy error caused by noise interference and the multipath effect of the satellite signal can be reduced by replacing the satellite receiving module with higher accuracy or improving the filtering algorithm [35].
In summary, through hardware upgrades and algorithm optimization, as well as the unique advantages of the BeiDou system, we can further reduce the error range and improve the overall measurement accuracy and reliability of the area measuring instrument.

6. Conclusions

This paper designed and implemented an area measuring instrument based on an STM32 microcontroller and a high-precision BeiDou positioning chip, which solves the accuracy problem of traditional area measuring tools in weak signal environment.
In terms of hardware, we introduced a high-performance BeiDou positioning chip, which still has a high accuracy and stability of measurement in complex environments. In the software design, we used a FreeRTOS real-time operating system to achieve efficient scheduling and management of tasks, and ensure the real-time and response speed of the system. In addition, the application of dynamic memory management technology overcomes the limitations of traditional static memory allocation and improves the flexibility and resource utilization of the system.
The experimental results show that the average relative error of the measuring instrument in open terrain is 0.37%, and the maximum relative error in complex environments, such as urban canyons, is 2.72%, which is lower than the 5% threshold specified in the global navigation satellite system (GNSS) receiver calibration specification. Compared with traditional GPS equipment, it still maintains high precision and high stability under weak signal conditions, showing better environmental adaptability. In summary, the area measuring instrument designed in this paper has achieved results in terms of technological innovation and experimental verification, and provides for land and resource planning, agricultural management, and surveying and mapping exploration.

Author Contributions

X.W.: conceptualization, methodology, software, investigation, formal analysis, writing—original draft; B.N.: validation, supervision, writing—review and editing; G.H.: conceptualization, resources, supervision, writing—review and editing. All authors have read and agreed to the published version of the manuscript.

Funding

This research received no external funding.

Data Availability Statement

Data are available upon request from the authors.

Conflicts of Interest

The authors declare no conflicts of interest.

References

  1. Zhong, Z.T.; Zhang, H.H.; Liu, G.; Luo, W.L. Research on model system of monitoring-evaluation-warning for implementation supervision of territory spatial planning. J. Nat. Resour. 2022, 37, 2946–2960. [Google Scholar] [CrossRef]
  2. Parra, L. Remote sensing and GIS in environmental monitoring. Appl. Sci. 2022, 12, 8045. [Google Scholar] [CrossRef]
  3. Xu, L. Optimization of forest land protection and planning management system based on GIS technology. Mod. Agric. Sci. Technol. 2025, 8, 166–169. [Google Scholar]
  4. Xu, H.; Zhang, C. Development and applications of GIS-based spatial analysis in environmental geochemistry in the big data era. Environ. Geochem. Health 2023, 45, 1079–1090. [Google Scholar] [CrossRef]
  5. Shirui, H. Discussion on the calibration method of three-dimensional area measuring instrument. Ind. Metrol. 2024, 34, 45–47. [Google Scholar]
  6. Chen, C.; Li, J.; Chen, T.; Zang, J.; Qian, J. Research on the effectiveness of GPS data acquisition points in area measurement. Sci. Technol. Innov. 2017, 20, 24–26. [Google Scholar]
  7. Yang, F.; Wei, Z. Design of land area measuring instrument based on GPS satellite positioning. Autom. Instrum. 2019, 34, 50–52+69. [Google Scholar] [CrossRef]
  8. Wang, G.; Sun, R.; Cheng, Q. Positioning method based on GPS dual-polarized antenna in urban canyon. J. Navig. Position. 2020, 8, 13–19. [Google Scholar] [CrossRef]
  9. Mohaddeseh, S.; Reza, M.M.; Narjes, R. Acquisition of weak GPS signals using wavelet-based de-noising methods. Surv. Rev. 2020, 52, 497–513. [Google Scholar]
  10. Zhang, L.; Li, M.; Yao, L.; Xie, J.; Xiao, X.; Huang, J.; Huang, J.; Li, X.; Fang, K. Design of farmland area measuring instrument based on BeiDou Satellite Navigation System. INMATEH-Agric. Eng. 2022, 68, 99–109. [Google Scholar]
  11. Juan, X.; Nan, W.; Qing, L. Research on precise positioning and data acquisition technology of forest resources based on Beidou. Rural. Sci. Exp. 2025, 6, 150–152. [Google Scholar] [CrossRef]
  12. Chen, X.; He, D.; Pei, L. BDS B1I multipath channel statistical model comparison between static and dynamic scenarios in dense urban canyon environment. Satell. Navig. 2020, 1, 26. [Google Scholar] [CrossRef]
  13. Yang, Y.; Ding, Q.; Gao, W.; Li, J.; Xu, Y.; Sun, B. Principle and performance of BDSBAS and PPP-B2b of BDS-3. Satell. Navig. 2022, 3, 5. [Google Scholar] [CrossRef]
  14. Vaithianathan, M. Memory Hierarchy Optimization Strategies for HighPerformance Computing Architectures. Int. J. Emerg. Trends Comput. Sci. Inf. Technol. 2025, 1, 24–35. [Google Scholar]
  15. Zhang, H.; Zhang, H.; Yu, Z. Derivation of Spherical Triangle Formula Using Quaternion Algorithm. J. Geod. Geodyn. 2020, 40, 608–611. [Google Scholar]
  16. Liu, Y.M.; Wang, G.H.; Guan, Y.; Zhang, J.Z.; Shi, Z.P.; Dong, L. Formal verification of Green’s theorem and its applications. Comput. Eng. Sci. 2023, 45, 1178–1187. [Google Scholar]
  17. Li, J. A Proof of Green Formula by Infinitesimal Method. Stud. Coll. Math. 2024, 27, 4–7+10. [Google Scholar]
  18. Zhang, W.; Li, S.; Ma, L. Research on measurement technology of grafted seedlings based on machine vision seedling selection detection system. J. Agric. Mech. Res. 2024, 46, 148–152. [Google Scholar] [CrossRef]
  19. Zhou, C.; Gao, H.; Duan, Y. Design of DC Voltage Detection Device Based on STM32. Appl. IC 2024, 41, 36–37. [Google Scholar]
  20. Wang, Y.; Chen, N. An experimental circuit design for object positioning detection. Electron. Technol. Softw. Eng. 2022, 124–127. [Google Scholar] [CrossRef]
  21. Ramegowda, D.; Lin, M. Energy efficient mixed task handling on real-time embedded systems using FreeRTOS. J. Syst. Archit. 2022, 131, 102708. [Google Scholar] [CrossRef]
  22. Zhou, L.; Li, Q.; Tu, W.; Wang, C. A heterogeneous streaming vehicle data access model for diverse IoT sensor monitoring network management. IEEE Internet Things J. 2024, 11, 26929–26943. [Google Scholar] [CrossRef]
  23. Zhou, L.; Li, Q.; Tu, W.; Wang, C. A heterogeneous key performance indicator metadata model for air quality monitoring in sustainable cities. Environ. Model. Softw. 2021, 136, 104955. [Google Scholar] [CrossRef]
  24. Yang, C.F.; Shinjo, Y. Compounded real-time operating systems for rich real-time applications. IEEE Access 2025, 13, 26079–26104. [Google Scholar] [CrossRef]
  25. Guan, Y.; Lv, J. Design of ESP8266-based universal IoT remote control. In Proceeding of the Fourth International Conference on Advanced Manufacturing Technology and Electronic Information (AMTEI 2024), Chongqing, China, 20 January 2025; pp. 146–151. [Google Scholar]
  26. Xiao, L.; Liu, K. Research on a Dynamic Memory Management Mechanism of Micro Embedded System. Softw. Eng. 2016, 19, 59–60. [Google Scholar]
  27. Zhao, C.; Wang, X. Research on embedded software memory management method. Sci. Innov. 2024, 16, 129–131. [Google Scholar]
  28. Zhang, J.; Luo, X.; Fu, X.; Wang, X.; Guo, C.; Bai, Y. Experimental study on the influence of satellite spoofing on power timing synchronization. Int. J. Netw. Secur. 2020, 22, 954–960. [Google Scholar]
  29. Zhou, L.; Zeng, S. Location Information Acquisition and Analysis System of Blind Guide Based on NMEA-0183 Protocol. Ind. Control. Comput. 2021, 34, 41–42+55. [Google Scholar]
  30. Venugopalan, S.; Kuluru, C.; Ravi, S.; Guguloth, A.K.N. GNSS based tracking system with environmental safety. AIP Conf. Proc. 2025, 3237, 060008. [Google Scholar]
  31. Cao, T.; Li, Z.; Guo, Y. Teaching research on W-M-W test statistics in nonparametric statistics. Res. High. Math. 2023, 26, 99–101+110. [Google Scholar]
  32. Bakuła, M.; Uradziński, M.; Krasuski, K. Performance of DGPS smartphone positioning with the Use of P (L1) vs. P (L5) pseudorange measurements. Remote Sens. 2022, 14, 929. [Google Scholar] [CrossRef]
  33. Zhang, X.; Jiao, P.; Yan, J. A positioning error and time delay correction method for satellite signal simulator. Comput. Simul. 2024, 41, 67–72. [Google Scholar]
  34. Lu, W.; Qiu, Y.; Yang, L. Error calibration of geostationary orbit satellite ranging system and its orbit determination influence analysis. Chin. J. Sci. Instrum. 2022, 43, 73–83. [Google Scholar] [CrossRef]
  35. Zhong, S.; Peng, B.; He, J.; Feng, Z.; Li, M.; Wang, G. Kalman filtering based on dynamic perception of measurement noise. Mech. Syst. Signal Process. 2024, 213, 111343. [Google Scholar] [CrossRef]
Figure 1. Satellite reception test results (left: C/N0; right: visible satellites; red: BeiDou; blue: GPS; green: GLONASS).
Electronics 14 02394 g001
Figure 2. A schematic diagram of the earth’s sphere.
Electronics 14 02394 g002
Figure 3. Record point and area diagram. The dotted line represents the omitted sampling points.
Electronics 14 02394 g003
Figure 4. System hardware composition module. Arrows indicate primary signal/power flow: The Keystroke Module (user input) and Satellite Module (raw data) feed into the MCU, while the Power Module supplies it. The MCU (processed results) and Satellite Module (direct real-time data) output to the Display Module for visualization.
Electronics 14 02394 g004
Figure 5. Hardware physical image.
Electronics 14 02394 g005
Figure 6. Kalman prediction flow chart. Blue represents normal GNSS positioning flow; Orange indicates Kalman prediction mode; Green dashed lines denote decision nodes; Red highlights mode switching critical points.
Electronics 14 02394 g006
Figure 7. Collaboration diagram between threads.
Electronics 14 02394 g007
Figure 8. Data processing thread sampling process.
Electronics 14 02394 g008
Figure 9. The actual treading track in the football field area. (a) Actual field scene (cloudy); (b) Schematic satellite view of the football field. Yellow line indicates the walking path during sampling.
Electronics 14 02394 g009
Figure 10. Football field area test trajectory.
Electronics 14 02394 g010
Figure 11. The actual stepping point trajectory around the dormitory building. (a) Actual field scene (sunny); (b) Schematic satellite view of the dormitary building area. Green line in-dicates the walking path during sampling.
Electronics 14 02394 g011
Figure 12. Dormitory building area test trajectory.
Electronics 14 02394 g012
Figure 13. The actual tread track in Deji Square. (a) Actual field scene (light rain); (b) Schematic satellite view of the urban center. Red line in-dicates the walking path during sampling.
Electronics 14 02394 g013
Figure 14. Deji Square area test trajectory.
Electronics 14 02394 g014
Figure 15. Q-Q plots drawn for three types of areas. (a) Football field (open area), (b) Dormitory zone (semi-urban), (c) Urban center (dense environment). Diagonal reference lines indicate expected normal distribution; closer point alignment implies better normality.
Electronics 14 02394 g015
Table 1. Comparative analysis of area measurement technologies.
Research TeamHardware SchemeSoftware SchemeMeasurement AreaMeasurement AccuracySignal Adaptability
Chen et al. (2017) [6]S720 handheld GISfixed memory + data point screeningwoodland4.55%moderate occlusion
Zhang et al. (2022) [10]MC120M BeiDou modulestatic memory + triangulation algorithmfarmland0.7%open area
Xiao et al. (2025) [11]Arm processor + dual-frequency BeiDou chipstatic memory + BeiDou/inertial navigation integrated positioning systemwoodland3%moderate occlusion
This designATGM332 D BeiDou chipFreeRTOS dynamic memory + Kalman predictionmulti-terrain0.37% (open)
2.72% (weak)
open/semi-closed/urban canyon
Table 2. Module performance comparison table.
ParameterATGM332D (BeiDou)u-blox NEO-M8N (GPS)Improvement
Cold start sensitivity−148 dBm−146 dBm+2 dB
Multipath rejection ratio62%45%+17%
Satellite-based enhanced channelBDSBASSBASunique GEO correction
Table 3. Node structure members.
MemberDescription
longituderecord longitude
latituderecord latitude
nextpointer to the next Node structure
Table 4. Football field area test results.
DateWeather ConditionMeasuring Area (m2)Actual Area (m2)Relative Error (%)
13 MarchCloudy712371400.23
15 MarchLight rain71880.67
17 MarchSunny71260.19
19 MarchCloudy71070.46
21 MarchSunny71590.26
Table 5. Dormitory building surrounding area test results.
DateWeather ConditionMeasuring Area (m2)Actual Area (m2)Relative Error (%)
13 MarchCloudy28,37828,4900.39
15 MarchLight rain28,8031.09
17 MarchSunny28,3810.38
19 MarchCloudy28,7200.81
21 MarchSunny28,6780.66
Table 6. Deji Square area test results.
DateWeather ConditionMeasuring Area (m2)Actual Area (m2)Relative Error (%)
13 MarchCloudy85,71485,0000.84
15 MarchLight rain87,3092.72
17 MarchSunny85,9181.08
19 MarchCloudy86,8232.14
21 MarchSunny86,5041.77
Table 7. Analog signal interrupt test results.
CategoryAverage Error (%)Maximum Error (%)Number of Trajectory BreaksMemory Overflow Rate (%)
GPS + fixed block memory3.626.711.88.4
BeiDou + fixedblock memory3.155.891.47.6
This design1.712.7200
Table 8. Power consumption comparison table.
Operating ModeThis Design Current (Ma)GPS Module (Ma)Energy Saving Ratio (%)
Standby8.212.534.4
Continuous positioning689226.1
Disclaimer/Publisher’s Note: The statements, opinions and data contained in all publications are solely those of the individual author(s) and contributor(s) and not of MDPI and/or the editor(s). MDPI and/or the editor(s) disclaim responsibility for any injury to people or property resulting from any ideas, methods, instructions or products referred to in the content.

