1. Introduction
Suspended solids (SS) is a term referring to fine particulate matter that primarily exists in rivers, lakes, and oceans in the form of aggregates or complexes and typically consists of silt and organic materials with dimensions ranging from micrometers to nanometers. With increasing human activity and industrial development, water bodies are increasingly frequently disturbed, leading to changes in the concentrations of suspended solids. Variations in the concentrations of suspended solids of different particle sizes can cause adverse physical and chemical changes in water bodies [
1]. Monitoring the concentrations and particle sizes of suspended solids is of great significance for improving polluted marine and lake areas and predicting and preventing conditions of poor water quality.
Traditional methods for measuring the concentration of suspended solids include gravimetric sampling [
2], optical turbidity measurement [
3,
4,
5], remote sensing measurement [
6,
7,
8], and acoustic measurement. Acoustic measurement is non-intrusive, covers a large measurement range, is not affected by biological contamination, and is not limited by water transparency, allowing for dynamic and continuous data acquisition.
In the 1950s, the use of acoustic waves was first proposed as a method for detecting suspended sediments [
9]. Acoustic-scattering systems and devices for obtaining information on suspended sediments have evolved since the discovery that passing through water bodies with different levels of suspended sediment leads to differences in echo signals and now rely upon the correlation between acoustic backscatter and the concentration of suspended sediment. Currently, the most commonly used acoustic device for detecting suspended sediment in water bodies is the Acoustic Doppler Current Profiler (ADCP) [
10,
11,
12]. During the study of single-frequency measurement of suspended sediment concentrations, it was found that attenuation of the acoustic scattering signal is affected not only by suspended sediment concentration, but also by particle size [
13,
14]. Measuring suspended sediment concentrations at multiple frequencies can reduce errors. Hay et al. [
15,
16] demonstrated that using acoustic backscatter at three frequencies can simultaneously yield estimates of the average concentration and the size of suspended sand particles. Research on Multifrequency Backscatter and Attenuation Models, along with work on experimental setups based on these models aimed at the inversion of the concentration and particle size of suspended matter in water, have become a prominent research focus [
17,
18]. Nevertheless, existing multifrequency backscatter and attenuation models developed through scholarly research remain insufficient to precisely characterize the properties of suspended particles in complex environments. Data-driven neural network methods [
19], with their robust capacity for model fitting, exhibit substantial potential to address these limitations and advance the field.
Convolutional neural networks (CNNs) are adept at capturing local features in input data, while recurrent neural networks (RNNs) can capture sequential information and long-term dependencies in the input data. Combining the two can result in the integration of local and global information, enhancing the model’s understanding of the data. The CNN-BGRU model [
20] can better handle input information at different scales, improving the model’s capacity to represent input data features. The dilated convolution in the Temporal Convolutional Network (TCN) [
21] structure can capture both local and global information features in the input data, and residual connections provide the potential for building deeper networks. While distinct neural network architectures excel in specialized task domains, practical applications are more commonly characterized by multi-task integration, necessitating architectures capable of handling concurrent learning objectives. In reference [
22], Caruana and Rich first proposed the hard parameter-sharing architecture for multi-task learning neural networks, demonstrating that multi-task learning in backpropagation neural networks could uncover task correlations even without explicit supervisory signals. In this hard parameter-sharing framework, models for different tasks share a common feature extractor while employing task-specific encoders and output layers to generate results tailored to individual tasks. In contrast to hard parameter-sharing architectures, the Multi-Gate Mixture-of-Experts (MMoE) framework proposed by J Ma et al. [
23] represents a soft parameter-sharing architecture that explicitly accounts for hierarchical dependencies among tasks. Within this architecture, the output of a task is synthesized from multiple expert networks, whose contributions are dynamically weighted by gating signals generated through a dedicated gating neural network. While hard parameter-sharing architectures [
24,
25,
26] and Mixture-of-Experts (MoE) soft parameter-sharing architectures [
27,
28,
29] have been extensively studied and applied in image processing and natural language processing, this study pioneers the use of multi-task learning to simultaneously address tasks related to the inversion of both suspended-matter concentration and particle size.
High-frequency acoustics alone has limitations in accurately detecting the concentration of suspended solids and particle size due to the complex relationship between acoustic signals and particle properties. Without neural networks, the inversion of concentration and particle size relies on empirical models, which lack adaptability to varying environmental conditions. Neural networks, with their powerful pattern recognition and non-linear mapping capabilities, can effectively address these limitations. They can learn complex mappings between multi-frequency acoustic signals and particle properties, enhancing detection accuracy and robustness.
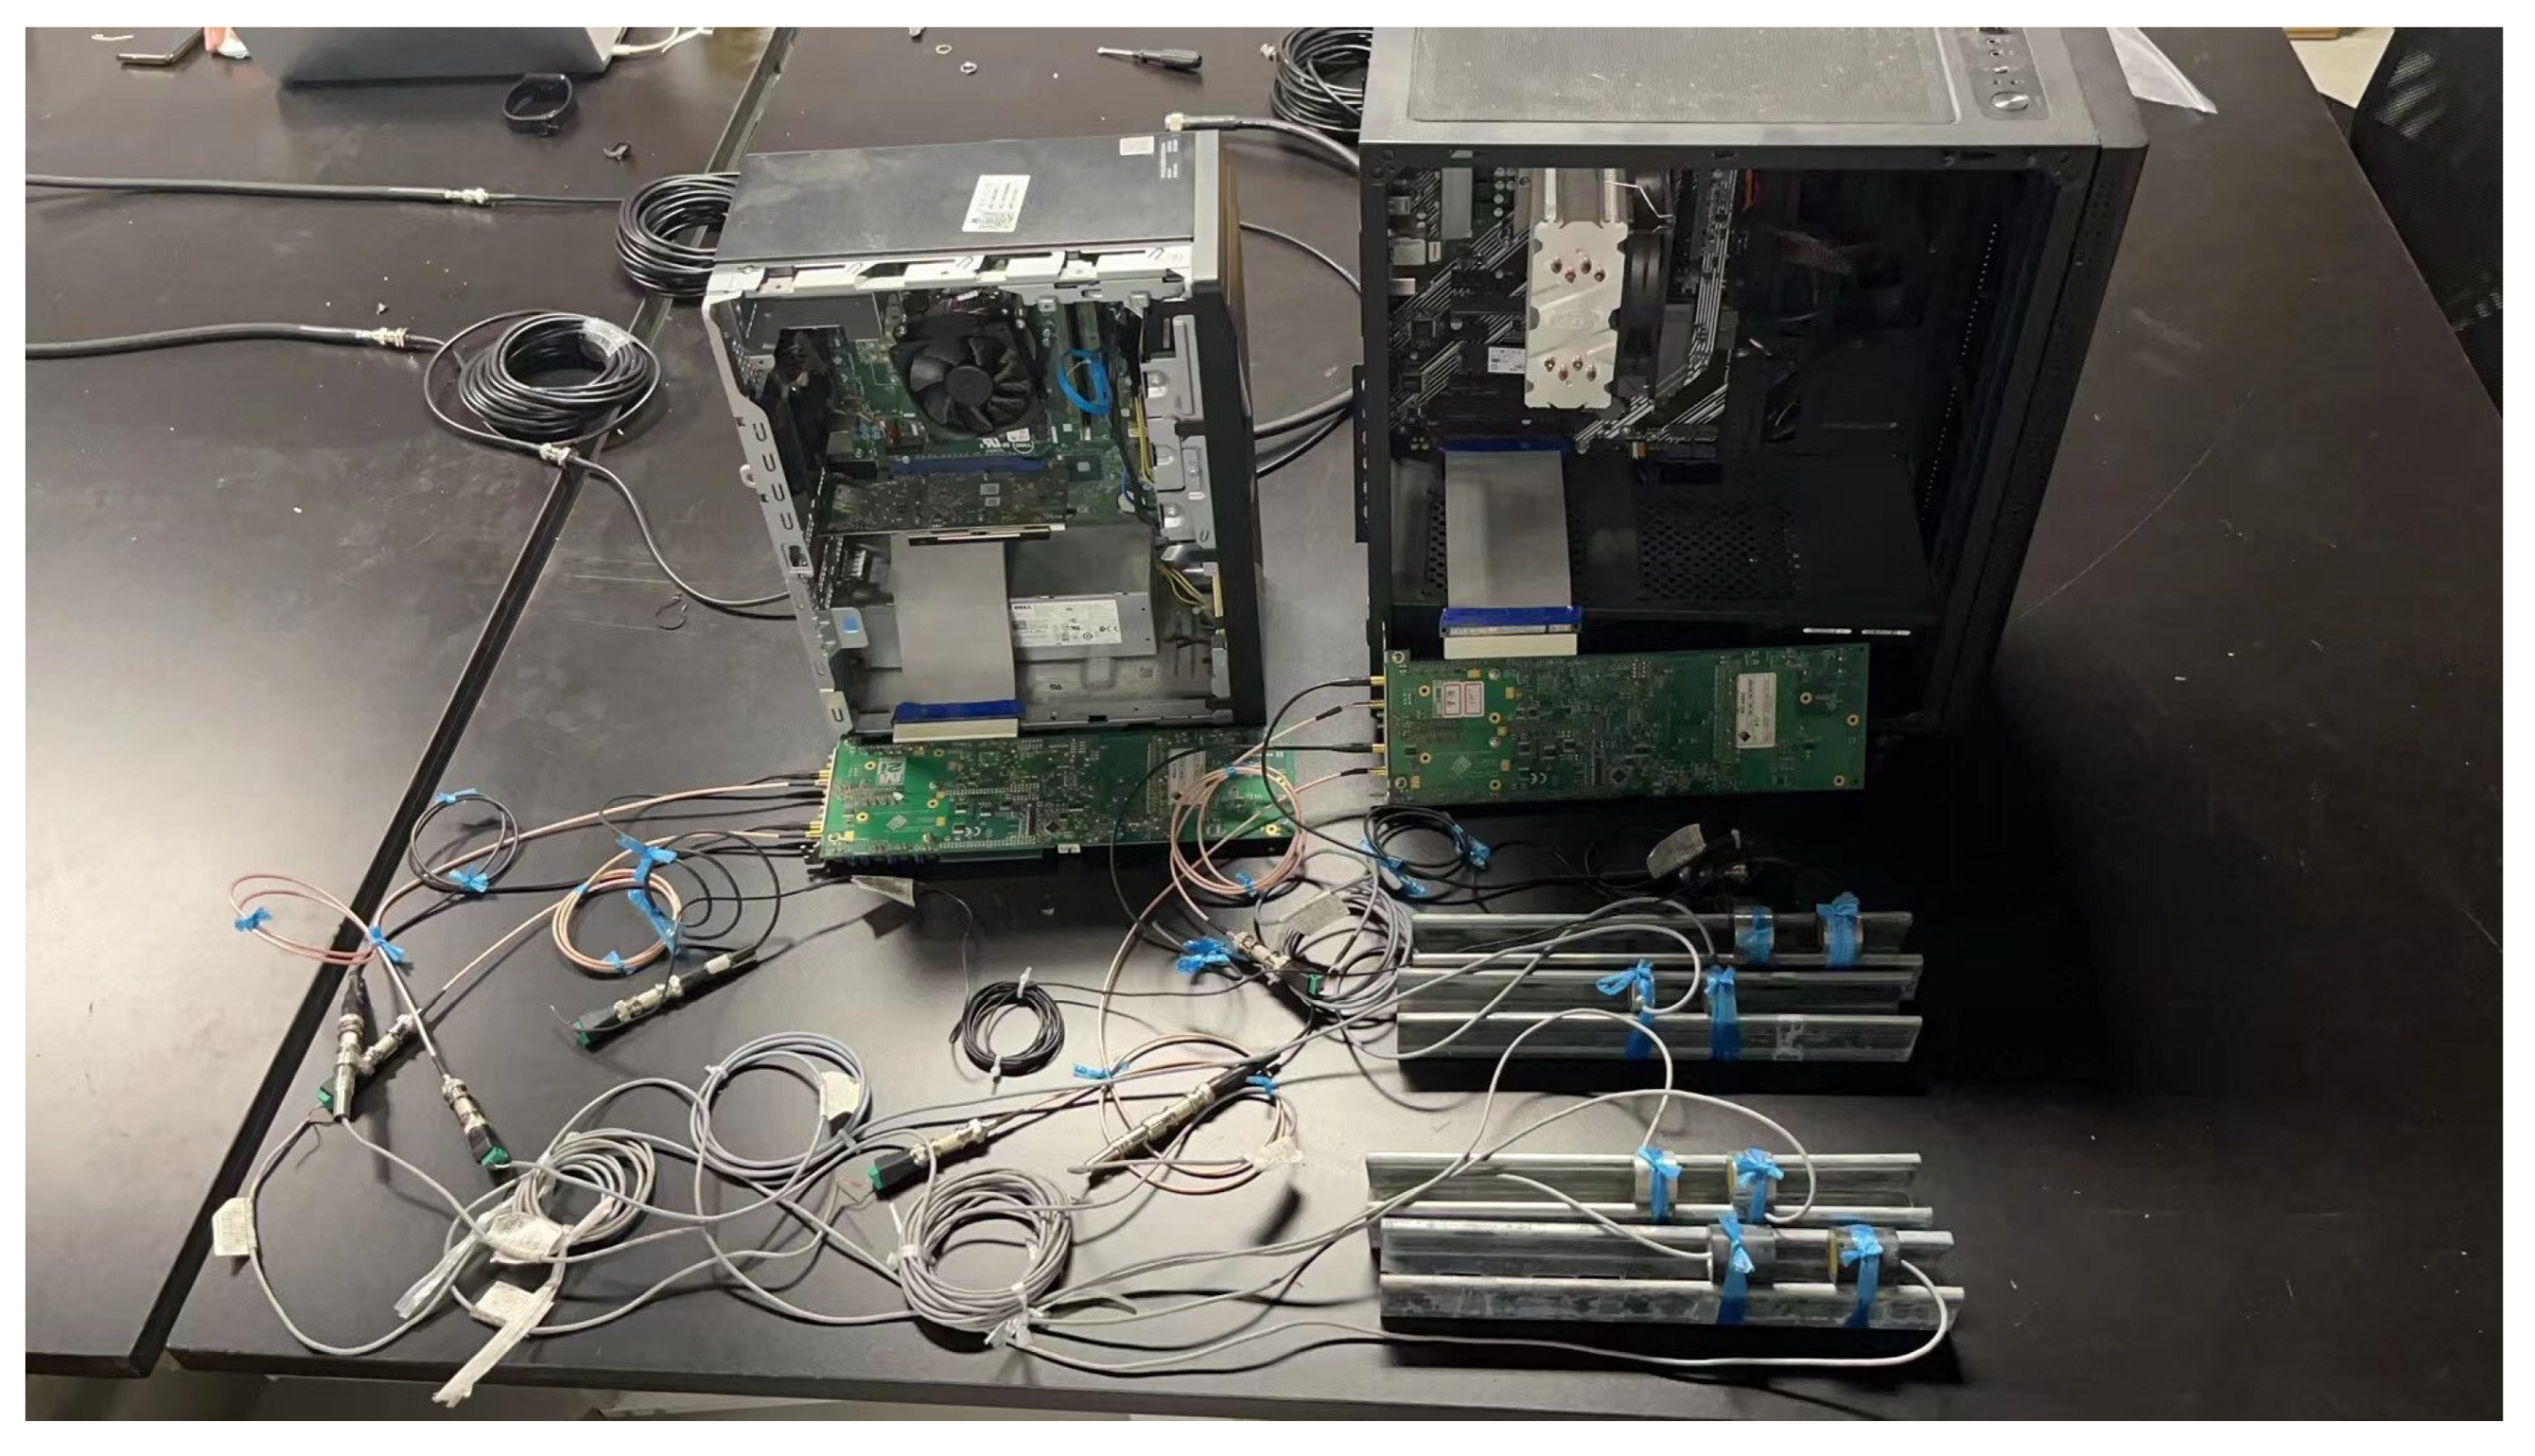
In this study, we actively sent acoustic signals through a water body containing suspended solids and used neural network-based methods to quickly obtain the concentration and particle size of the suspended solids from the received acoustic signals. The main contributions of this study are as follows:
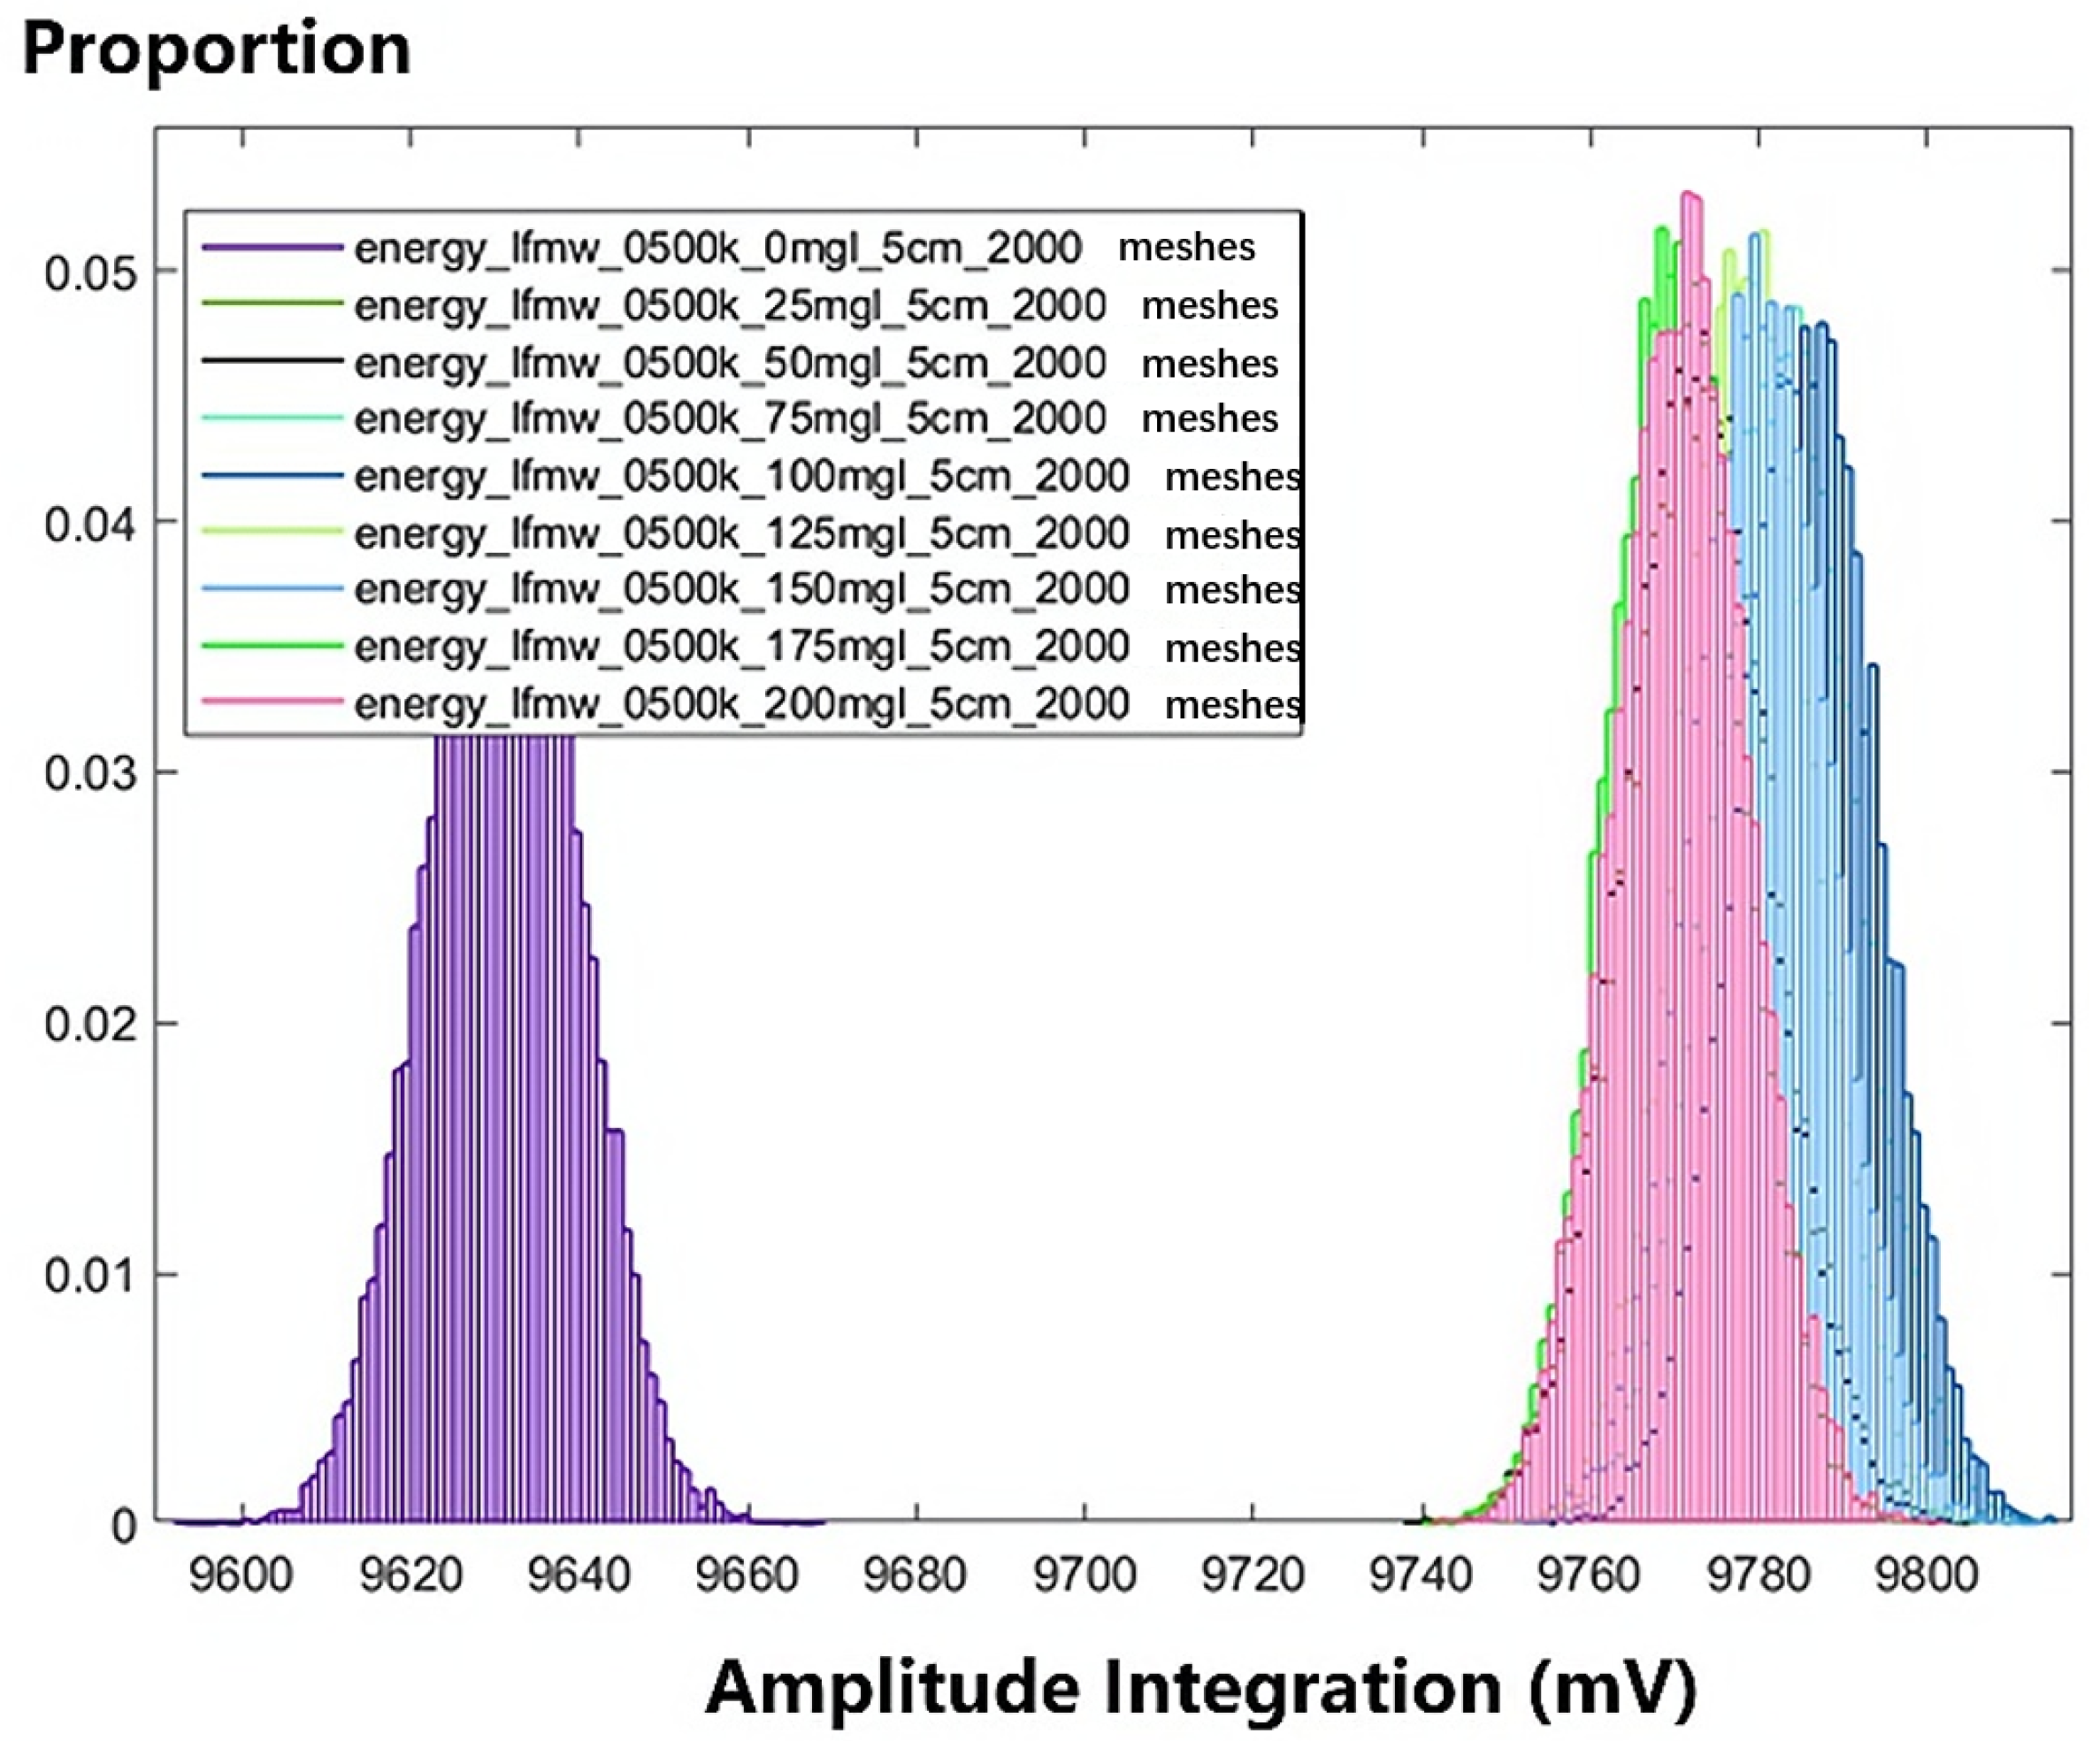
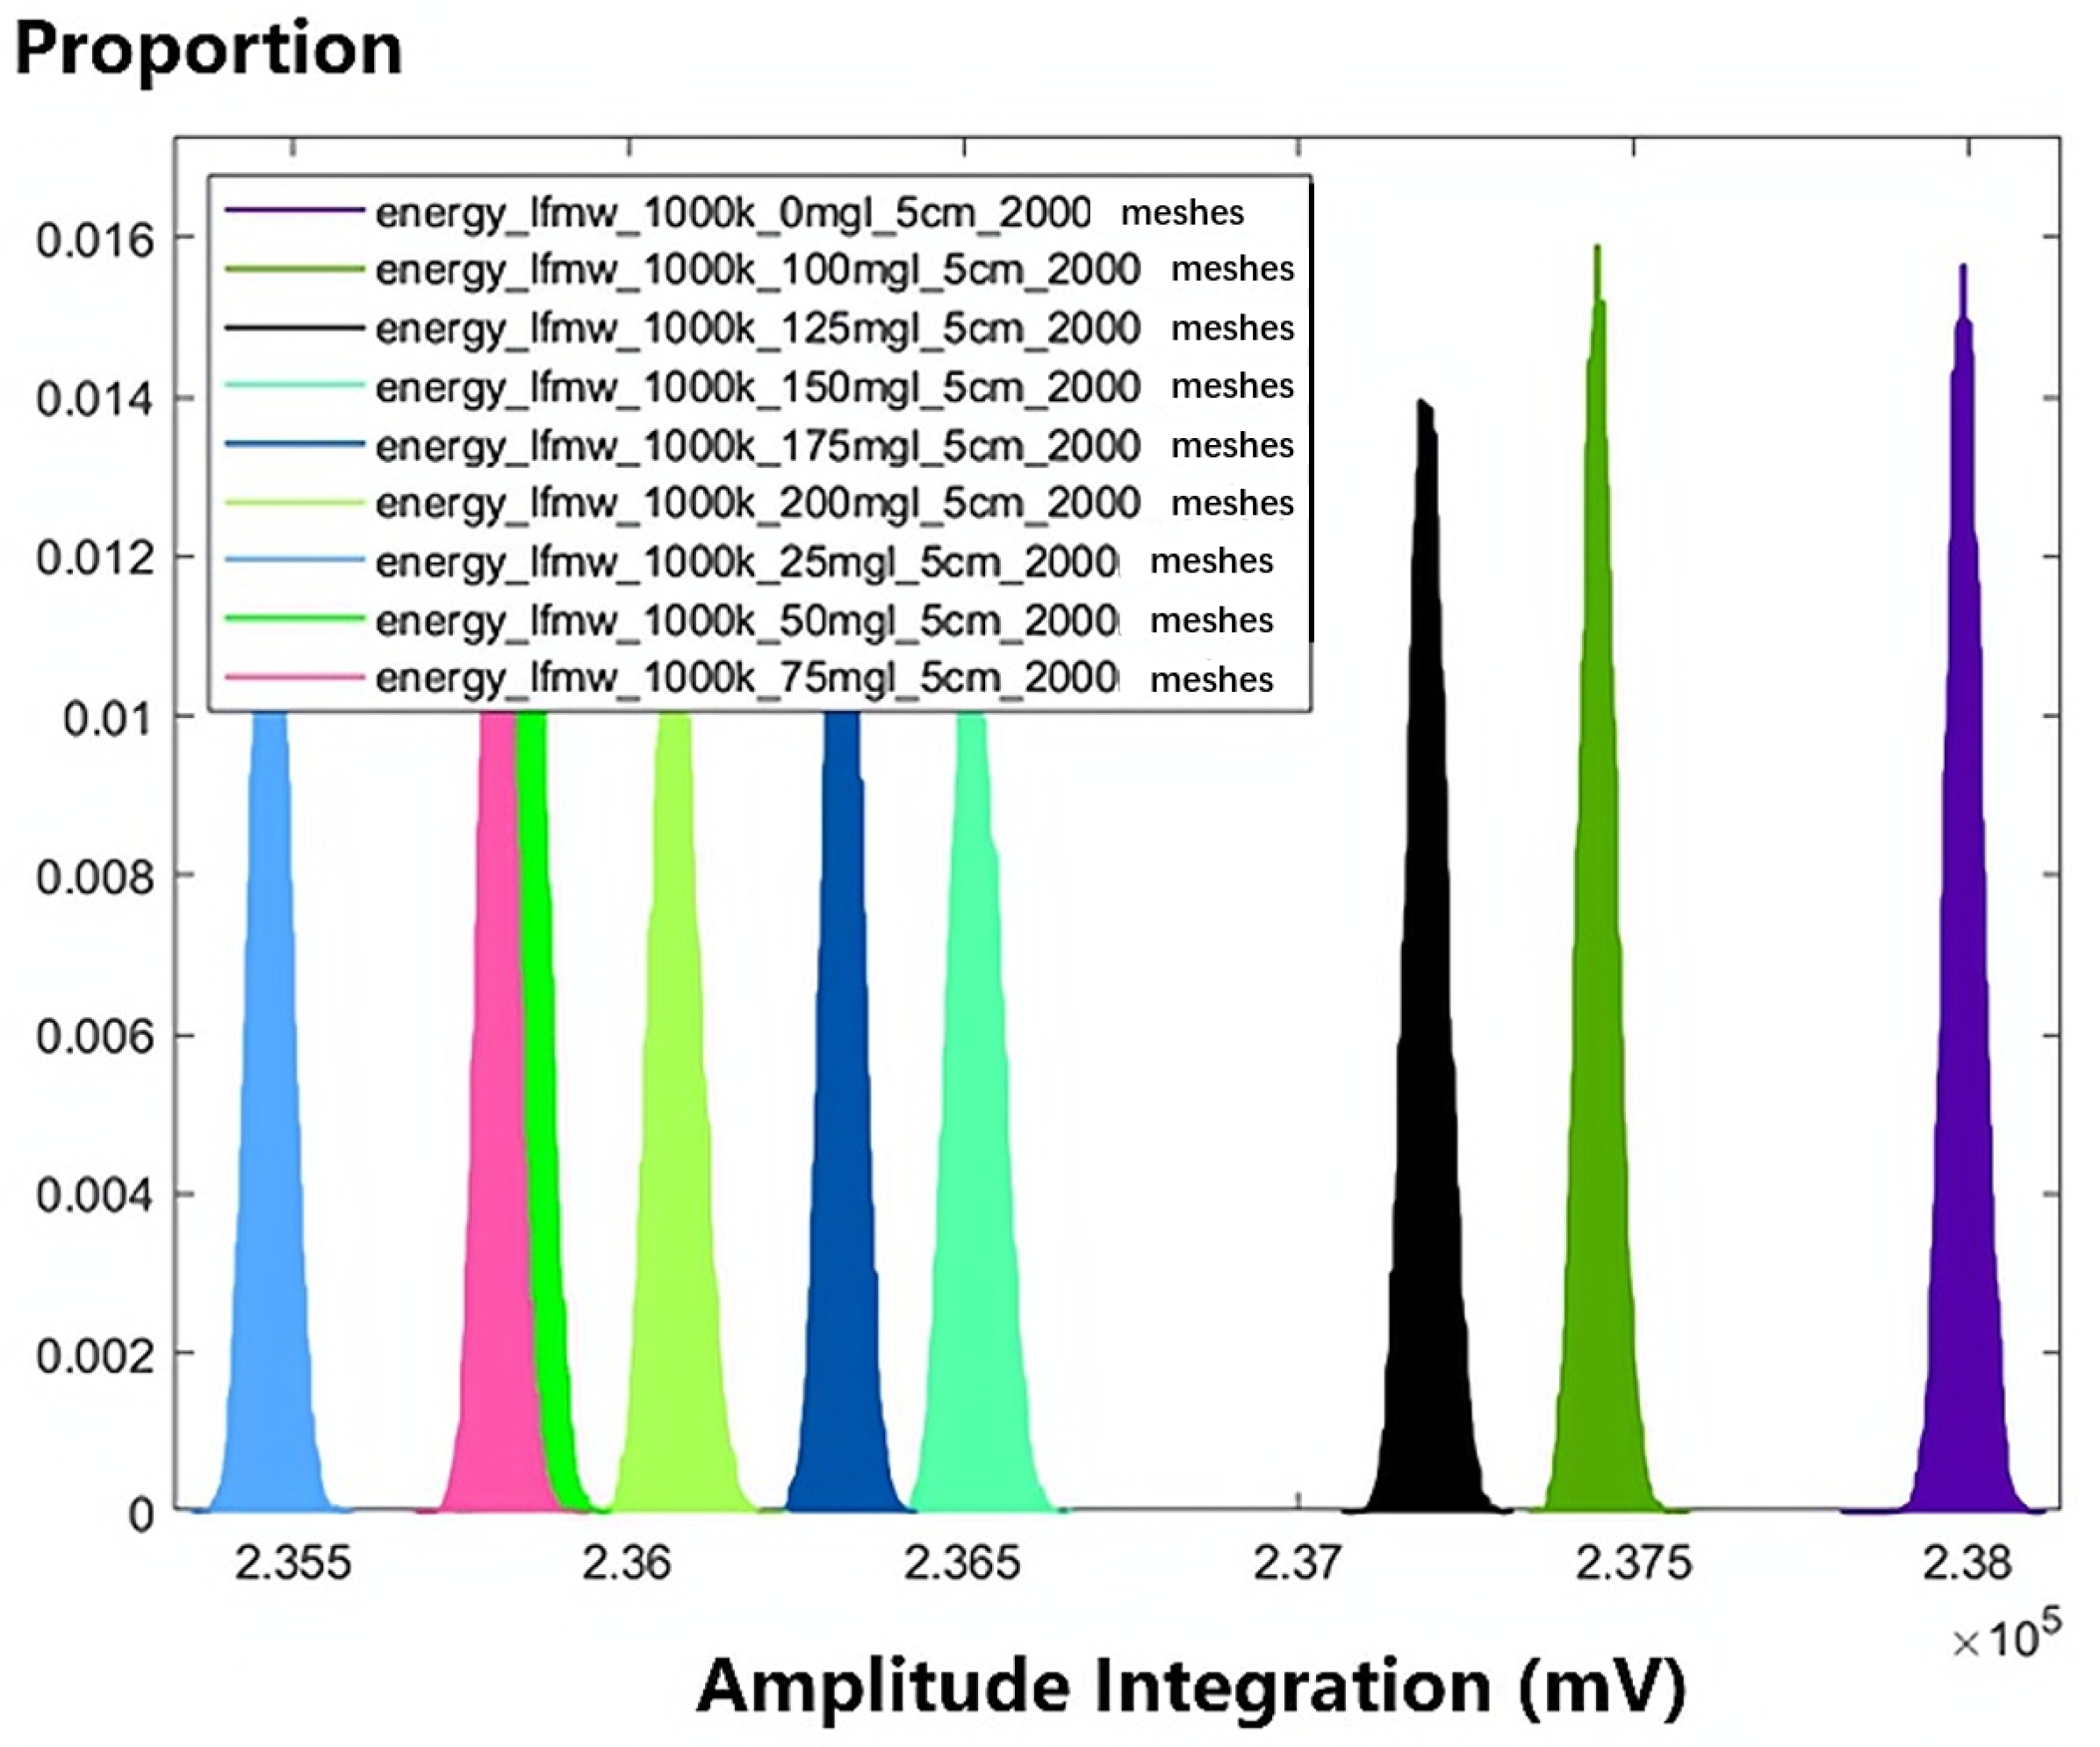
We constructed multiple datasets using received signals after propagation through different aqueous environments, covering various frequencies, concentrations, and particle sizes.
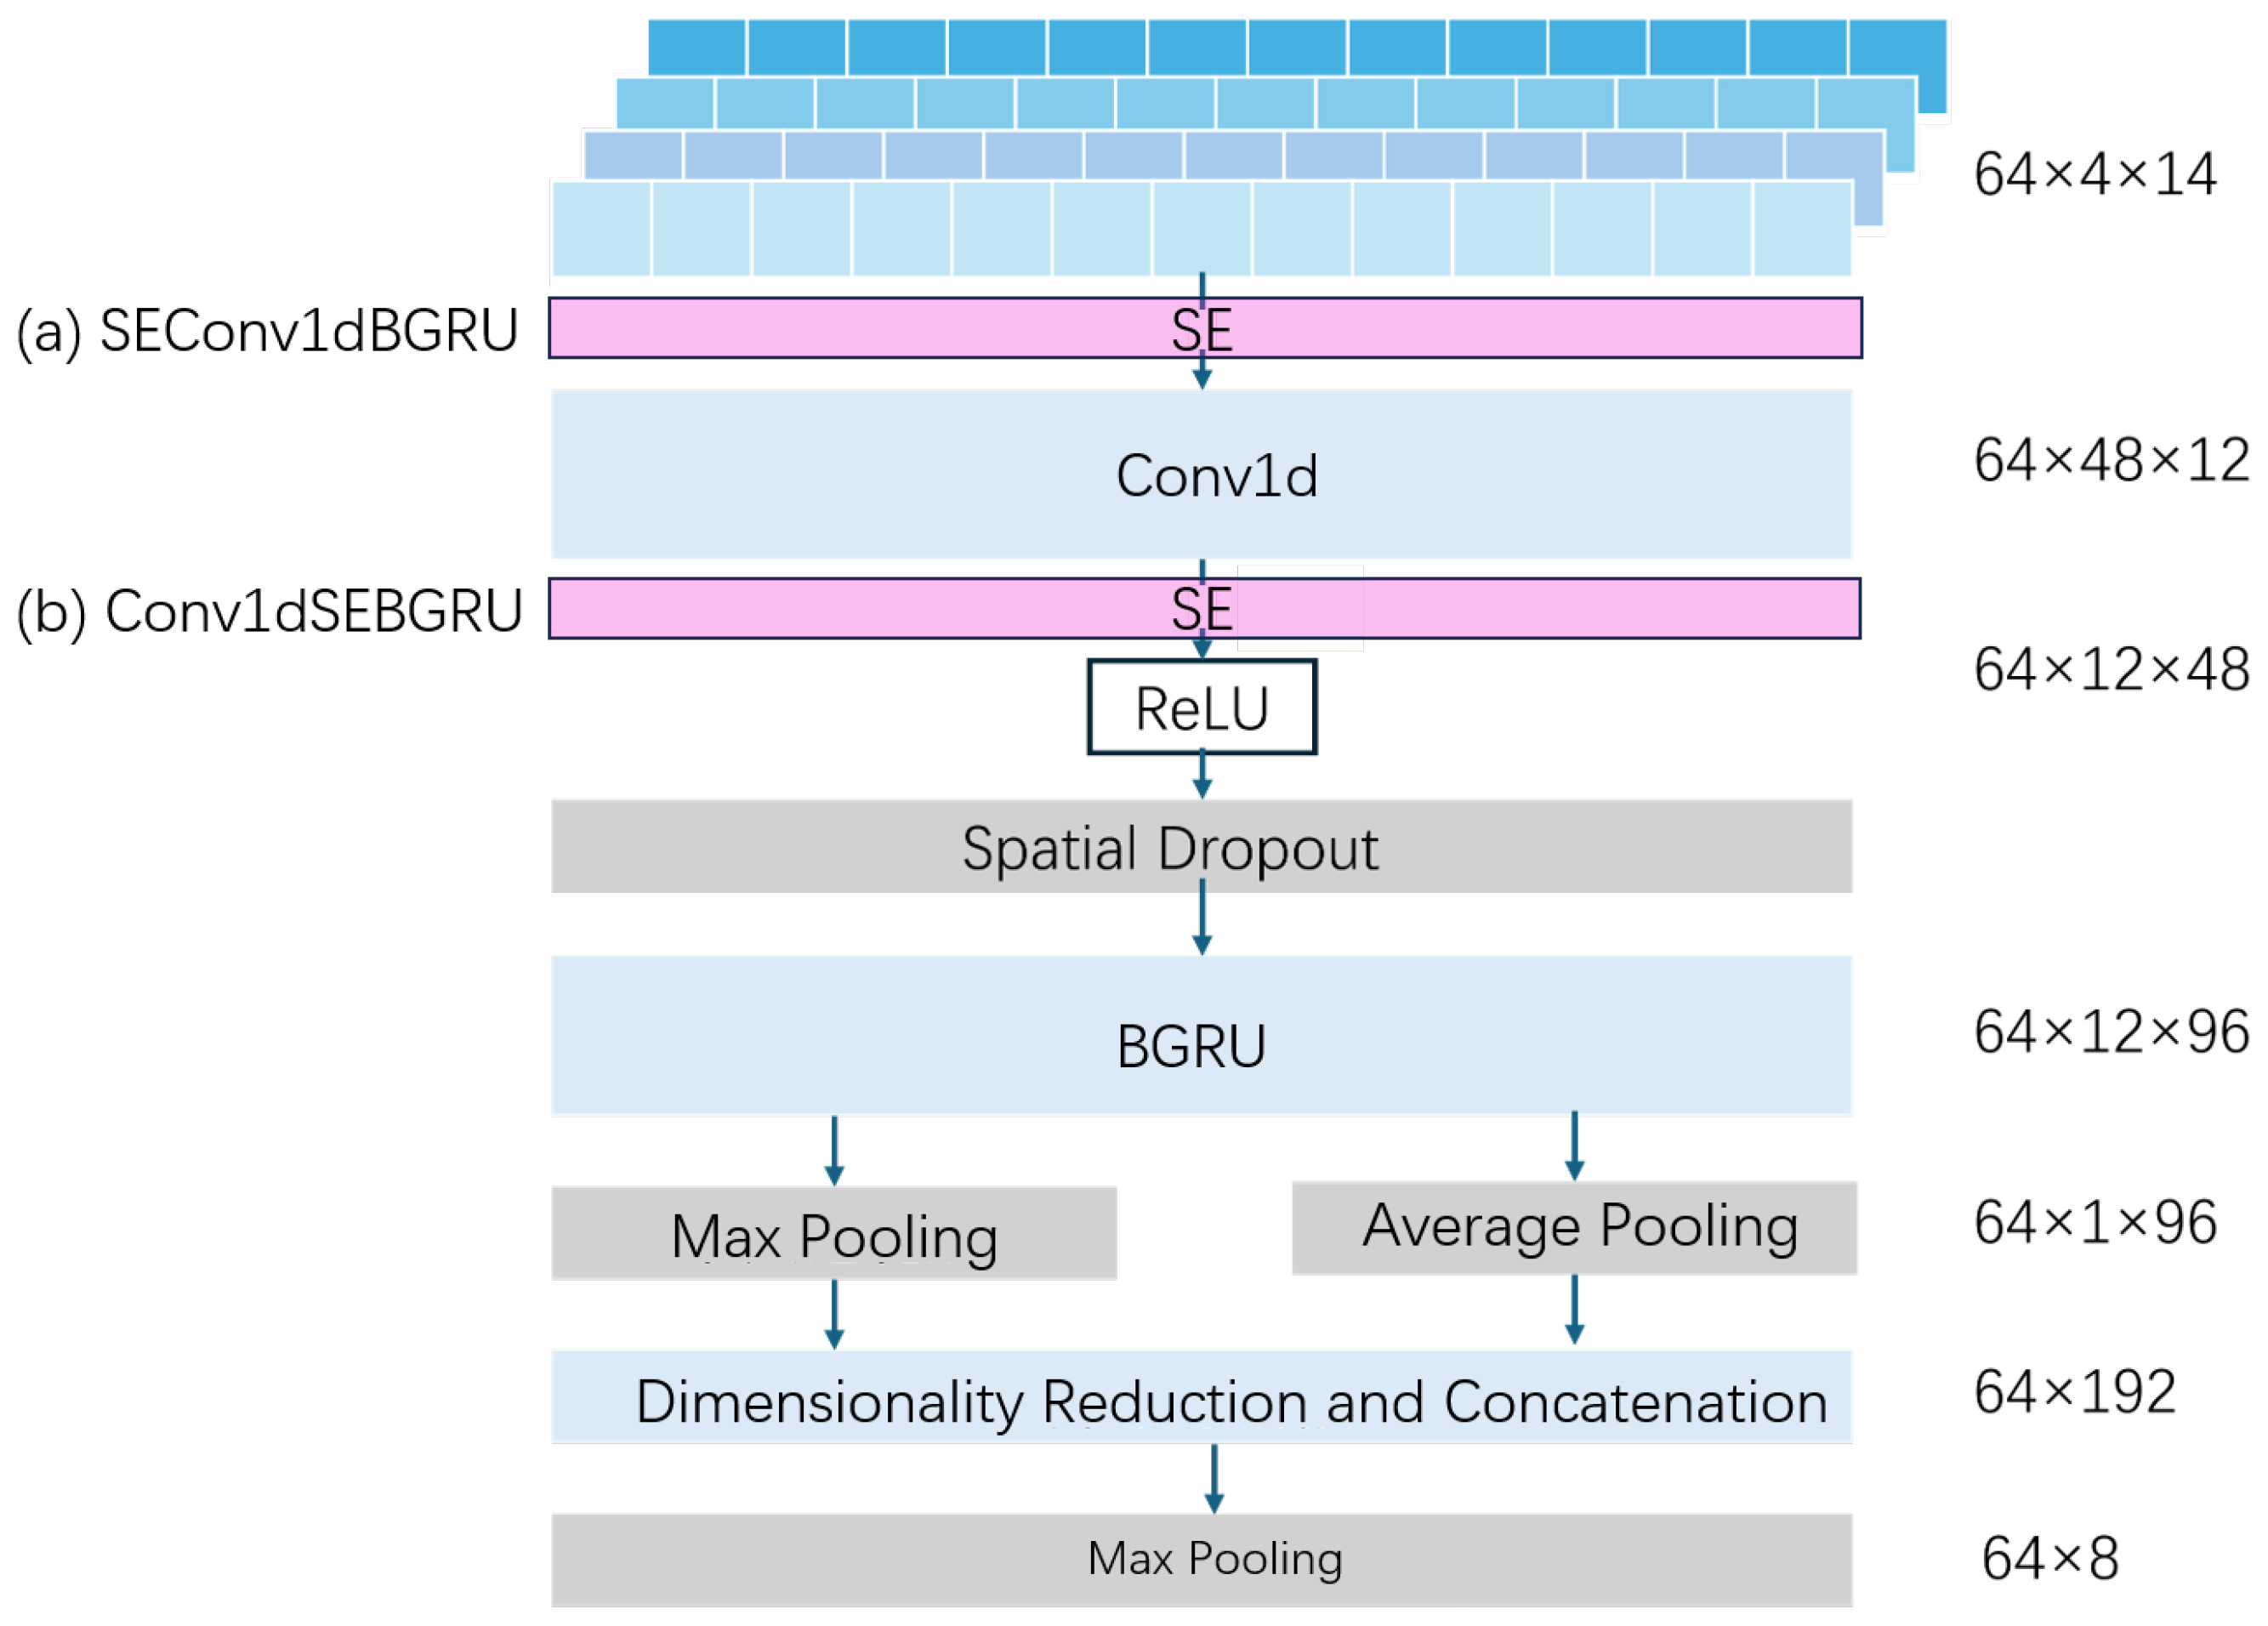
We proposed two neural network architectures (Conv1dBGRU and TCN) enhanced with channel attention mechanisms for the detection of the concentration and particle size of suspended solids.
We developed multi-task learning neural networks using hard and soft parameter-sharing methods to simultaneously complete tasks focused on the detection of concentration and particle size.
We demonstrated that high-frequency signals with rich spectra have high potential for detecting information on suspended solids in complex aqueous environments.
5. Discussion
Previous studies have shown that multi-frequency acoustic signals can improve the accuracy of methods used to detect suspended sediment (e.g., [
17,
18]). Our results align with these findings and further demonstrate the effectiveness of combining multi-frequency signals with neural networks. Ref. [
19] highlighted the potential of machine learning methods for processing acoustic signals; our study extends that work by incorporating channel attention mechanisms and multi-task learning. For the current classification tasks, other machine learning methods (e.g., Bayesian, decision tree, and SVM classifiers) can also deliver results. However, their algorithmic complexity caps their performance. In complex water environments with suspended particulate matter, these methods cannot ensure detection accuracy. Deep neural networks with the globally dependent-capturing Transformer architecture have greater reasoning capacity. Still, they require massive datasets and immense computational resources for training and inference [
32,
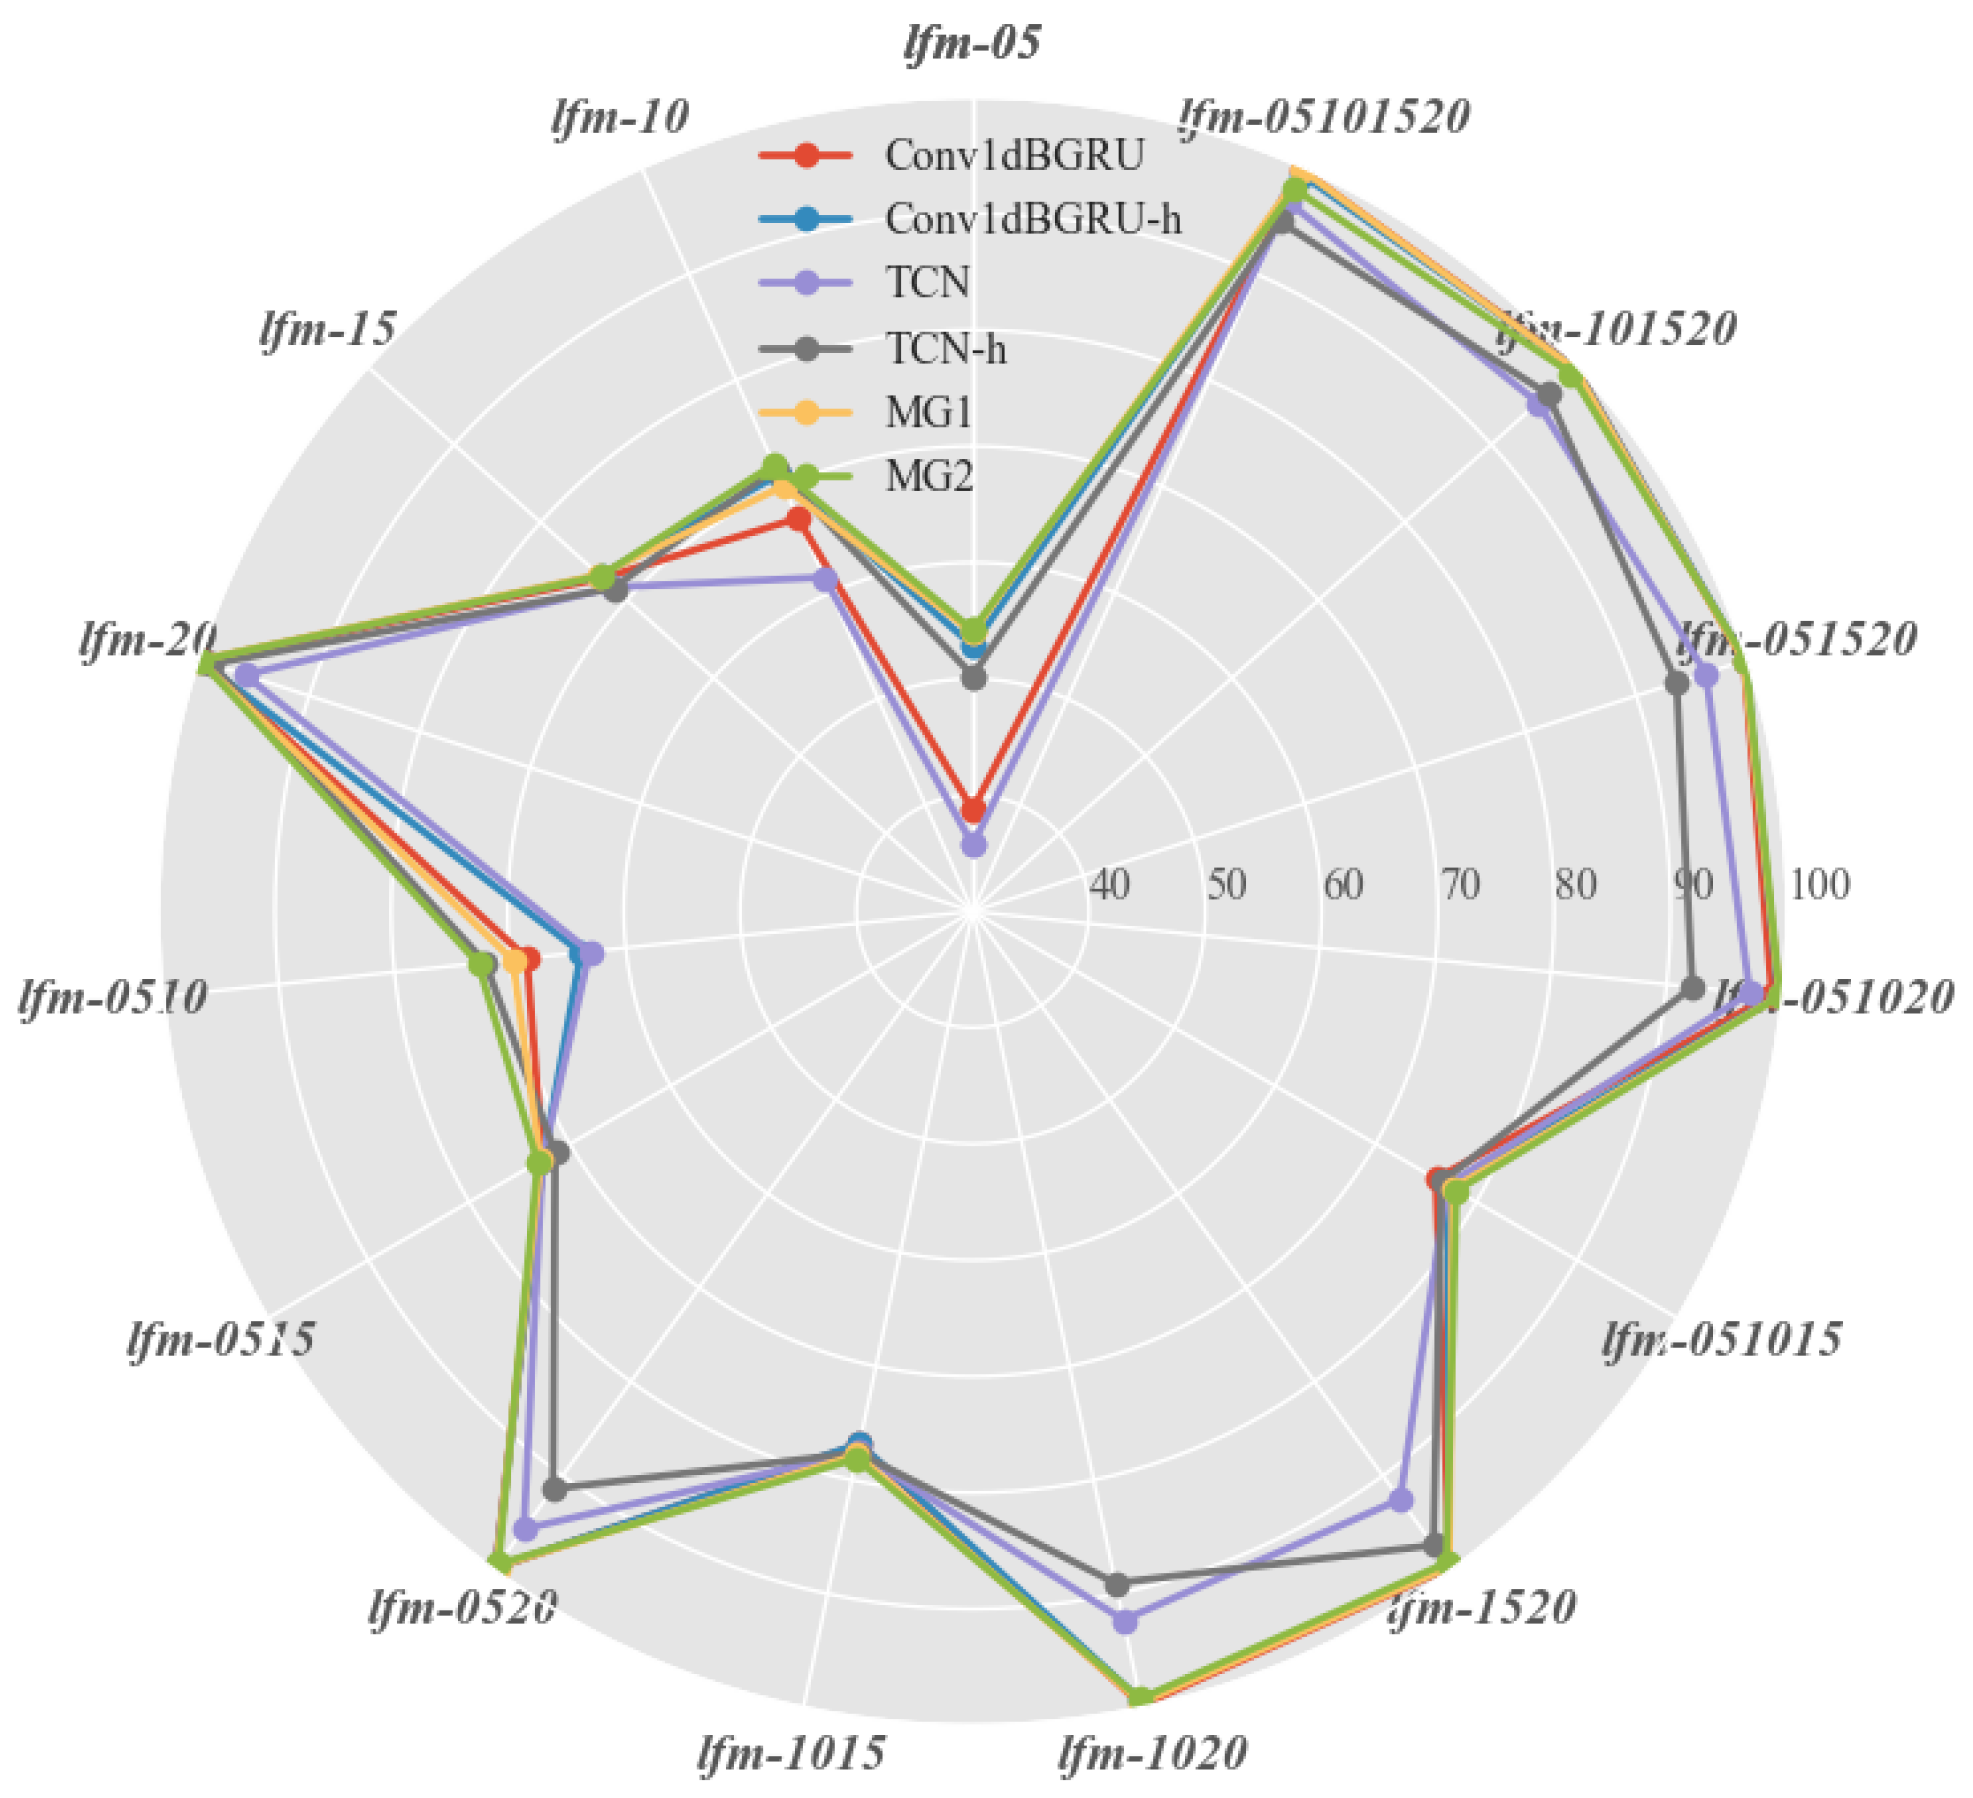
33]. Given that neural networks must run on edge devices in practical applications, we focus our research on CNN and RNN-family neural networks. Compared to traditional methods, this study has made significant progress in the processing of multi-frequency acoustic signals and the construction of neural network models. We constructed multiple datasets using received signals after the propagation of various spectral types of detection signals through different aquatic environments. Through analysis of the performance of neural networks on different datasets, we found that spectrum-rich high-frequency signals have high potential for detecting information on suspended matter in complex aquatic environments. The comparison between Conv1dBGRU and TCN revealed that Conv1dBGRU outperforms TCN when the detection signal has fewer frequency components. However, when the detection signal contained sufficient frequency components, the performance difference between Conv1dBGRU and TCN diminished, and TCN could match Conv1dBGRU’s performance following the introduction of the SE structure. The SE structure enhanced both basic networks, but its impact was more pronounced when the network was processing single-frequency data. This is because the network can autonomously learn the feature differences of different frequency bands when multi-frequency data are input, reducing the necessity for explicit attention mechanisms. Conv1dBGRU demonstrated a stronger ability to learn these feature differences, resulting in a less significant improvement from the SE structure compared to TCN. Regarding multi-task learning, both the Conv1dBGRU and the TCN hard parameter-sharing networks effectively completed concentration classification tasks while maintaining high accuracy in particle-size classification. Although their accuracy in concentration classification was slightly lower than that obtained with independent concentration-classification tasks, the soft parameter-sharing networks MG1 and MG2 maintained the independence of the two tasks and leveraged their correlation to further enhance the accuracy of concentration classification. We believe that analysis of the performance of single-task learning and multi-task learning revealed a certain correlation between the suspended-matter and particle-size detection tasks. Only by considering the impact of both suspended-matter concentration and particle size on acoustic signals can more accurate results be obtained. Our research covers a variety of detection signals, various neural network models, and the task relevance of concentration detection and particle-size detection, filling a gap in this research field.
Despite the achievements of this study, there are also some limitations. First, in the particle-size-classification task, when the detection signal had more than two frequency components, multiple neural networks were able to achieve excellent classification accuracy on the corresponding datasets, making it difficult to distinguish among the different models in terms of their performance. The reason is that the material we used to prepare the solution included only three types of kaolin with significantly different particle sizes. Second, neural networks of the same structure showed a slight advantage in performance on multi-band datasets compared to datasets with high-frequency detection signals, which was due to the relative simplicity of the classification tasks given here. In addition, this study only configured an aquatic environment containing suspended matter of one concentration and particle size, and the ability of the model to perform in complex aquatic environments still needs further verification.
In response to the above limitations, we have identified future research directions: (1) upgrading simple classification tasks to numerical regression tasks; (2) conducting experiments in more diverse aquatic environments to verify the model’s generalization ability; (3) exploring more advanced neural network architectures to improve the model’s adaptability in complex environments.


