Article

Design, Fabrication, and Electromagnetic Characterization of a Feed Horn of the Linear-Polarized Multi-Beam Cryogenic S-Band Receiver for the Sardinia Radio Telescope

by
Tonino Pisanu
1,
Paolo Maxia
1,
Alessandro Navarrini
2,
Giuseppe Valente
3,*,
Renzo Nesti
4,
Luca Schirru
1,
Pasqualino Marongiu
1,
Pierluigi Ortu
1,
Adelaide Ladu
1,
Francesco Gaudiomonte
1,
Silvio Pilia
1,
Roberto Caocci
1,
Paola Di Ninni
4,
Luca Cresci
4 and
Aldo Sonnini
4
1
INAF—OAC, National Institute for Astrophysics—Astronomical Observatory of Cagliari, Via della Scienza 5, 09040 Selargius, Italy
2
NRAO—National Radio Astronomy Observatory, Charlottesville, VA 22903-2475, USA
3
ASI—Italian Space Agency, Via del Politecnico snc, 00133 Rome, Italy
4
INAF—National Institute for Astrophysics Astronomical Observatory of Arcetri, Largo Enrico Fermi 5, 50125 Florence, Italy
*
Author to whom correspondence should be addressed.
Electronics 2025, 14(11), 2301; https://doi.org/10.3390/electronics14112301
Submission received: 4 April 2025 / Revised: 19 May 2025 / Accepted: 30 May 2025 / Published: 5 June 2025
(This article belongs to the Special Issue Microwave Devices: Analysis, Design, and Application)

Abstract

:
The S-band (i.e., 2–4 GHz) is essential in multiple fields of radio astronomy, ranging from pulsar and solar studies to investigations of the early universe. The Italian 64 m fully steerable Sardinia Radio Telescope (SRT) is a system designed to operate in a wide frequency band ranging from 300 MHz to 116 GHz. Recently, the Astronomical Observatory of Cagliari (OAC) has been developing a new cryogenic seven-beam S-band radio receiver. This paper describes the design, fabrication and electromagnetic characterization of the feed horn for this new receiver. It has been designed to observe the sky in the 3–4.5 GHz frequency range and it will be composed of seven feed horns arranged in a regular hexagonal layout with a central element. The feed horns are optimized for placement in the primary focus and consequently illuminate the 64 m primary mirror of the SRT. The electromagnetic characterization of the single feed horn is crucial to verify the receiver’s performance; for this reason, a single feed horn has been manufactured to compare the measured reflection coefficient and the radiated far-field diagram with the results of the electromagnetic simulations, performed using the CST® Suite Studio 2024 and Ansys HFSS® Electromagnetics Suite 2021 R1 (To make the S-parameters and the radiation diagram measurement procedure feasible, the single feed horn has been connected to two adapters: a circular-to-rectangular waveguide adapter and a coax-to-rectangular waveguide adapter. The results of the measurements performed in the anechoic chamber are in very good agreement with the simulated results. Additionally, the feed horn phase center position is evaluated, merging the measurements and simulations results for an optimal installation on the primary focus of the SRT.

1. Introduction

Radio astronomy is a branch of astronomy that studies celestial objects by detecting and analyzing the radio waves they emit, using radio telescopes to capture signals from space at wavelengths ranging from millimeters to meters [1,2]. The portion of the frequency band between 2 GHz and 4 GHz is known as the S-band [3].
The S-band plays a crucial role in various areas of radio astronomy, from studying pulsars and the Sun to exploring the early universe. In fact, at S-band frequencies, the dispersion effects caused by the interstellar medium are reduced, allowing for clearer detection of pulsar signals [4,5]. The Sun emits radio waves across a broad spectrum, including the S-band. Monitoring solar emissions in this band helps in understanding solar flares and other solar activities [6,7]. In addition, the S-band overlaps with frequencies used to survey polarized radio emissions over the sky [8].
However, the increasing use of this frequency range for communication poses challenges that the astronomical community must overcome to maintain the quality of observations. For this reason, periodic radio frequency interference (RFI) measurement campaigns are necessary to always have an updated map of the RFI scenario [9,10,11]. The risk of RFI makes it essential to develop effective mitigation strategies to preserve the integrity of astronomical data [12,13,14,15,16].
Across the globe, several radio telescopes are equipped with S-band receivers. For instance, until its collapse in 2020, the Arecibo Observatory was one of the most powerful radio telescopes in the world, with an S-band receiver that played a crucial role in planetary radar observations, pulsar studies, and the search for extraterrestrial intelligence (SETI) [17,18]. The Green Bank Telescope (GBT) in West Virginia, with its 100 m dish, is one of the most versatile telescopes worldwide [19,20]. Its ultra-wideband receiver (UWBR) operates in the frequency range between 700 and 4200 MHz and is essential for detecting low-frequency pulsar emissions, fast radio bursts, magnetars, and other fast radio transients useful for astro-chemistry and observations of radio recombination lines [21]. The Parkes Telescope in Australia, part of the Australia Telescope National Facility (ATNF), is renowned for its contributions to space exploration and pulsar research [22]. With its 64 m dish and an ultra-wide-bandwidth, low-frequency (UWL) receiver system, it can provide continuous frequency coverage from 704 to 4032 MHz [23]. The 100 m Effelsberg radio telescope [24] is equipped with a 9 cm primary focus receiver operating in the frequency range between 2.86 and 3.6 GHz [25].
Regarding the Italian scenario, the SRT represents an instrument that can receive a wide range of radio frequencies, from 300 MHz to 116 GHz [26]. It is a fully steerable, 64 m diameter radio telescope developed by the Italian National Institute for Astrophysics (INAF) and managed by the Astronomical Observatory of Cagliari (OAC) [27]. The telescope is located 35 km North of Cagliari (Sardinia, Italy) at an altitude of around 600 m above sea level. Thanks to its versatility, the SRT has enabled and contributed to numerous significant astronomical studies at different frequencies (with its radio receivers at P, L, C, and K frequency bands), including the observation of filaments in galaxy clusters, investigations of supernova remnants, pulsar observations, VLBI network, studies on the physics of the Sun, and applications in space weather research [28,29,30,31,32,33,34]. Additionally, the SRT was utilized in space situational awareness activities as a receiver of a bi-static radar, aimed at space debris detection and tracking [35]. Furthermore, thanks to the Italian Space Agency (ASI) [36], since 2017, the SRT has been providing tracking and communication services for deep space, near-Earth, and lunar missions under the name Sardinia Deep Space Antenna (SDSA). This is made possible by its X-band mono-feed cryogenic receiver, which operates in the 8.4–8.5 GHz band [37].
Although the SRT was designed to operate also in the S-band, it is currently not equipped with a radio receiver that functions at these frequencies, preventing scientific research at 2–4 GHz in the applications previously discussed. In recent years, the OAC has been developing a new cryogenic S-band multi-feed receiver, linear polarized (i.e., horizontal and vertical polarizations), to be installed at the SRT’s primary focus, with the progress of this work detailed in the references [38,39]. In this paper, the design, fabrication, and electromagnetic characterization of a single feed horn, for the single radiating component, of this new multi-beam receiver, is presented. In particular, Section 2 provides a detailed description of the SRT’s optical and technical characteristics, along with an overview of the receiver’s installation position, which is also described in general terms. Section 3 presents the mechanical and electromagnetic design of the single feed horn of the new multi-beam receiver. Section 4 analyzes the results of the complete electromagnetic characterization of the feed, focusing on the measurement of the reflection coefficient and the radiation pattern and the comparison with the results of the electromagnetic simulations. Finally, Section 5 reports the conclusions and outlines future work.

2. General Description of the Sardinia Radio Telescope and Its New Under-Development S-Band Cryogenic Receiver

2.1. Technical Features of the Sardinia Radio Telescope

The optical design of the SRT (see Figure 1) follows a quasi-Gregorian configuration, with a 64 m diameter primary mirror (M1) and 7.9 m diameter secondary reflector (M2) [40,41]. The shapes of both mirrors are designed to minimize spillover and standing waves. In addition to the two focal positions corresponding to the primary and secondary mirrors (F1 and F2, respectively), two additional focal positions are actually available in the beam waveguide room (BWG), where three other mirrors (M3, M4, and M5) are installed (foci named F3 and F4, respectively). The operational frequencies of the SRT related to these four focal positions and the corresponding focal length-to-diameter ratio f/D [42] are listed in Table 1. Based on these technical specifications, the optimal position for installing the new S-band receiver is at the primary focus of the telescope.
One of the main features of the SRT that makes it one of the most advanced telescopes at both the European and global levels is its active surface system [43]. To maximize the antenna’s efficiency by compensating for the gravitational deformations, the 64 m dish is composed of 1008 aluminum panels supported by 1116 electromechanical actuators controlled by a computer. The active surface also allows the reconfiguration of the shaped surface of the quasi-Gregorian optics configuration to a pure parabolic one when prime focus receivers are operational. At the same time, the sub-reflector M2 is mounted in a six actuators linear structure that can move it in all directions with 5 degrees of freedom.
The radio telescope has been designed to be equipped with up to twenty receivers simultaneously. Historically, until 2022, the radio telescope was equipped with a K-Band (18–26.5 GHz) 7-beam receiver [44], a C-Band (5.7–7.7 GHz) [45] single beam receiver and a dual frequency L-P Band (305–410 MHz and 1.3–1.8 GHz) [46]. Recently, thanks to a National Operational Program (PON) of the Italian Ministry of University and Research, four new high-frequency receivers have been added and are still in the commissioning phase before being made available to the scientific community for observational projects [47]—in particular, two multi-beam cryogenic receivers, one working in the W-band (70–116 GHz) and the other one in the Q-band (33–50 GHz) [48,49], a bolometric W-band camera operating in the 78–103 GHz frequency band composed of an array of 408 detectors (pixels) [50], and a simultaneous microwave Triple-Band receiving system capable of operating at the same time in the K, Q, and W bands (i.e., 18–26 GHz, 35–50 GHz, and 80–116 GHz) [51]. As part of the works of the PON project, a new mono-beam receiver that operates in the lower C-Band (4.2–5.6 GHz) has been also integrated [52].
From mid-2025, the ASI will upgrade the antenna for space applications with Next Generation Europe funding from the National Recovery and Resilience Plan (NRRP), as an asset of the Earth-Moon-Mars (EMM) project, and with internal resources earmarked for the development of the ground segment [37].

2.2. The New Under-Development Cryogenic S-Band Receiver for the Sardinia Radio Telescope

As mentioned above, the new cryogenic S-band receiver (with a frequency band of 3–4.5 GHz) is under development by the OAC’s technicians and technologists and will be installed at the primary focus of the SRT, where a mechanical beam called the primary focus positioner (PFP) is present (see Figure 1). The PFP allows the receivers to be housed and positioned in a resting state when the telescope is observing with the Gregorian focus F2 receivers. In the case of a receiver in this focal position, the feed horn should illuminate the 64 m primary mirror M1 at an aperture of approximately 148 deg with a designed edge taper of approximately −15 dB, as has been verified during the design and use of the other receivers installed at the primary focus [53]. Consequently, the design of the receiver feed must comply with this specification to ensure optimal coupling with the optical design of the SRT.
The latest version, updated to the current state, of the detailed schematic of one of the seven identical channels of the S-band receiver, including all microwave components of its signal acquisition chain, is shown in Figure 2.
It can be observed that the receiving chain consists of five main blocks, which are briefly described below:
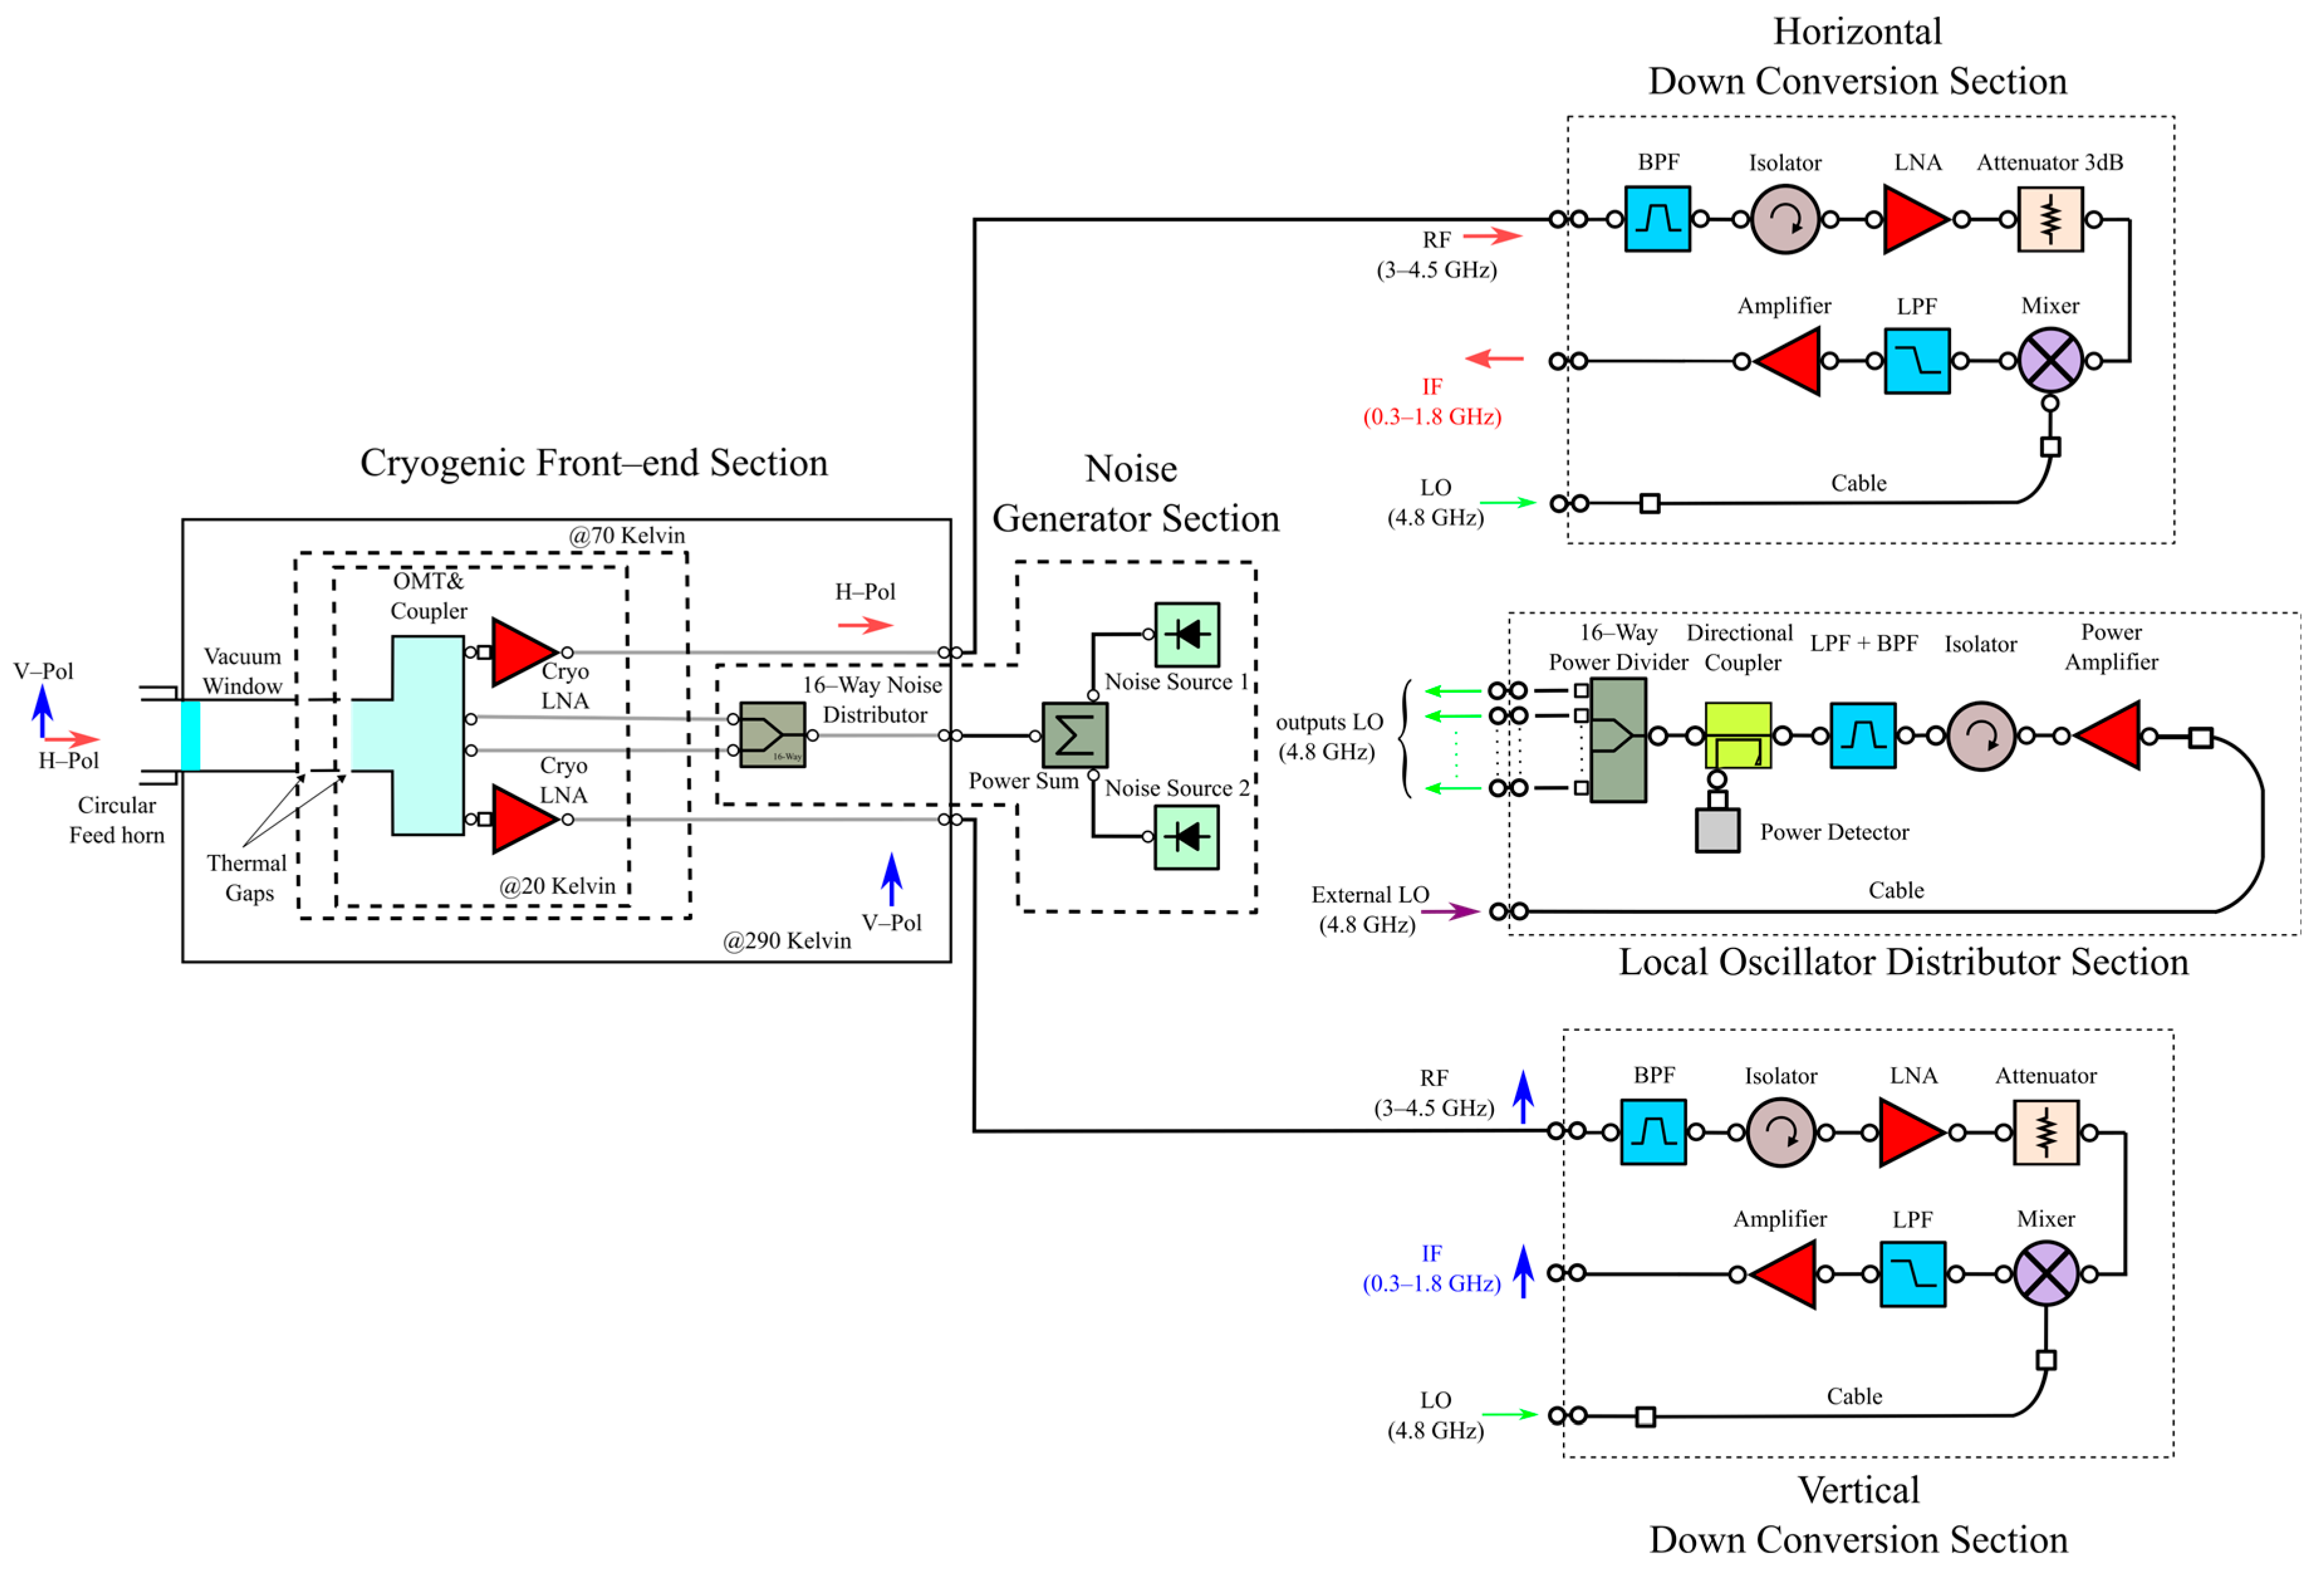
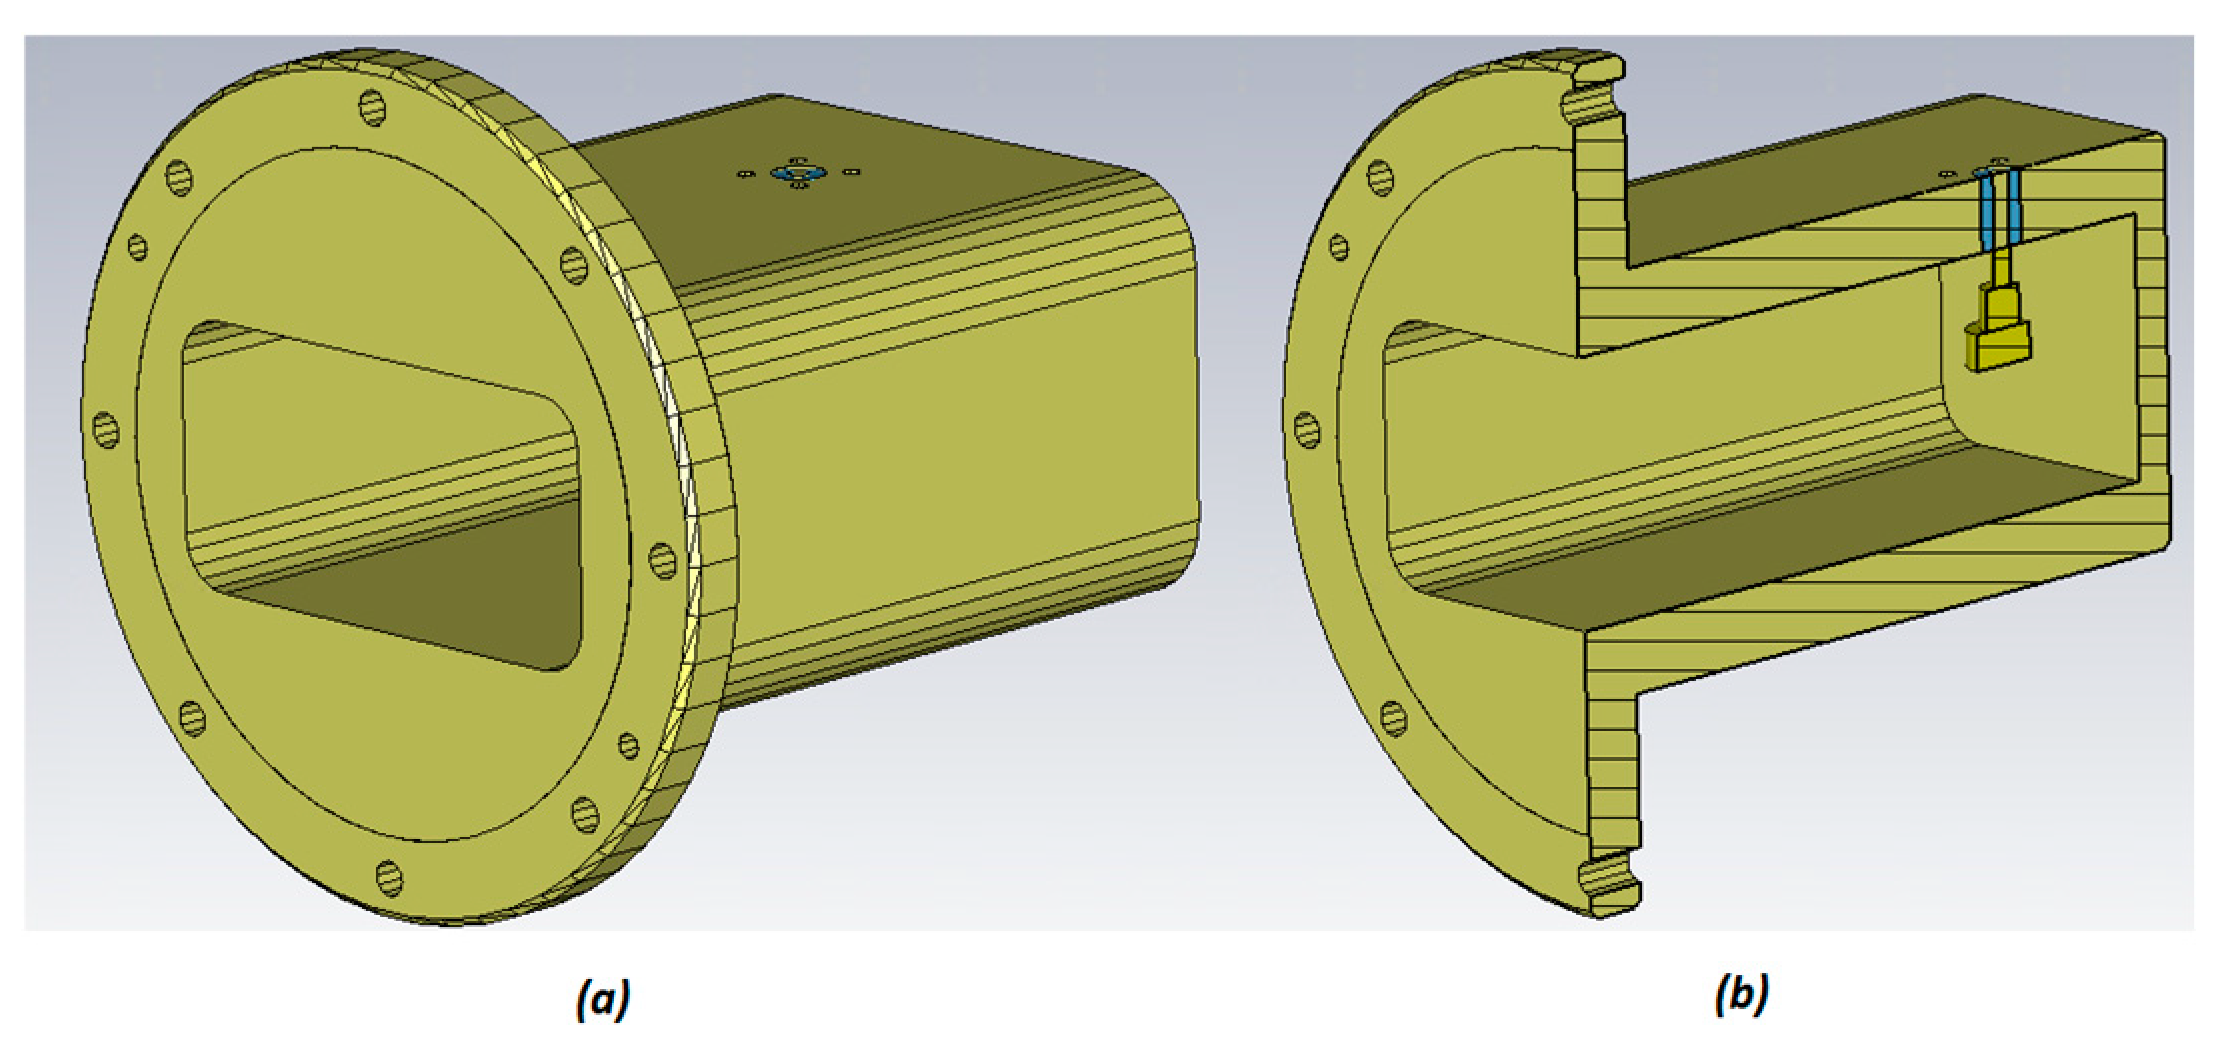
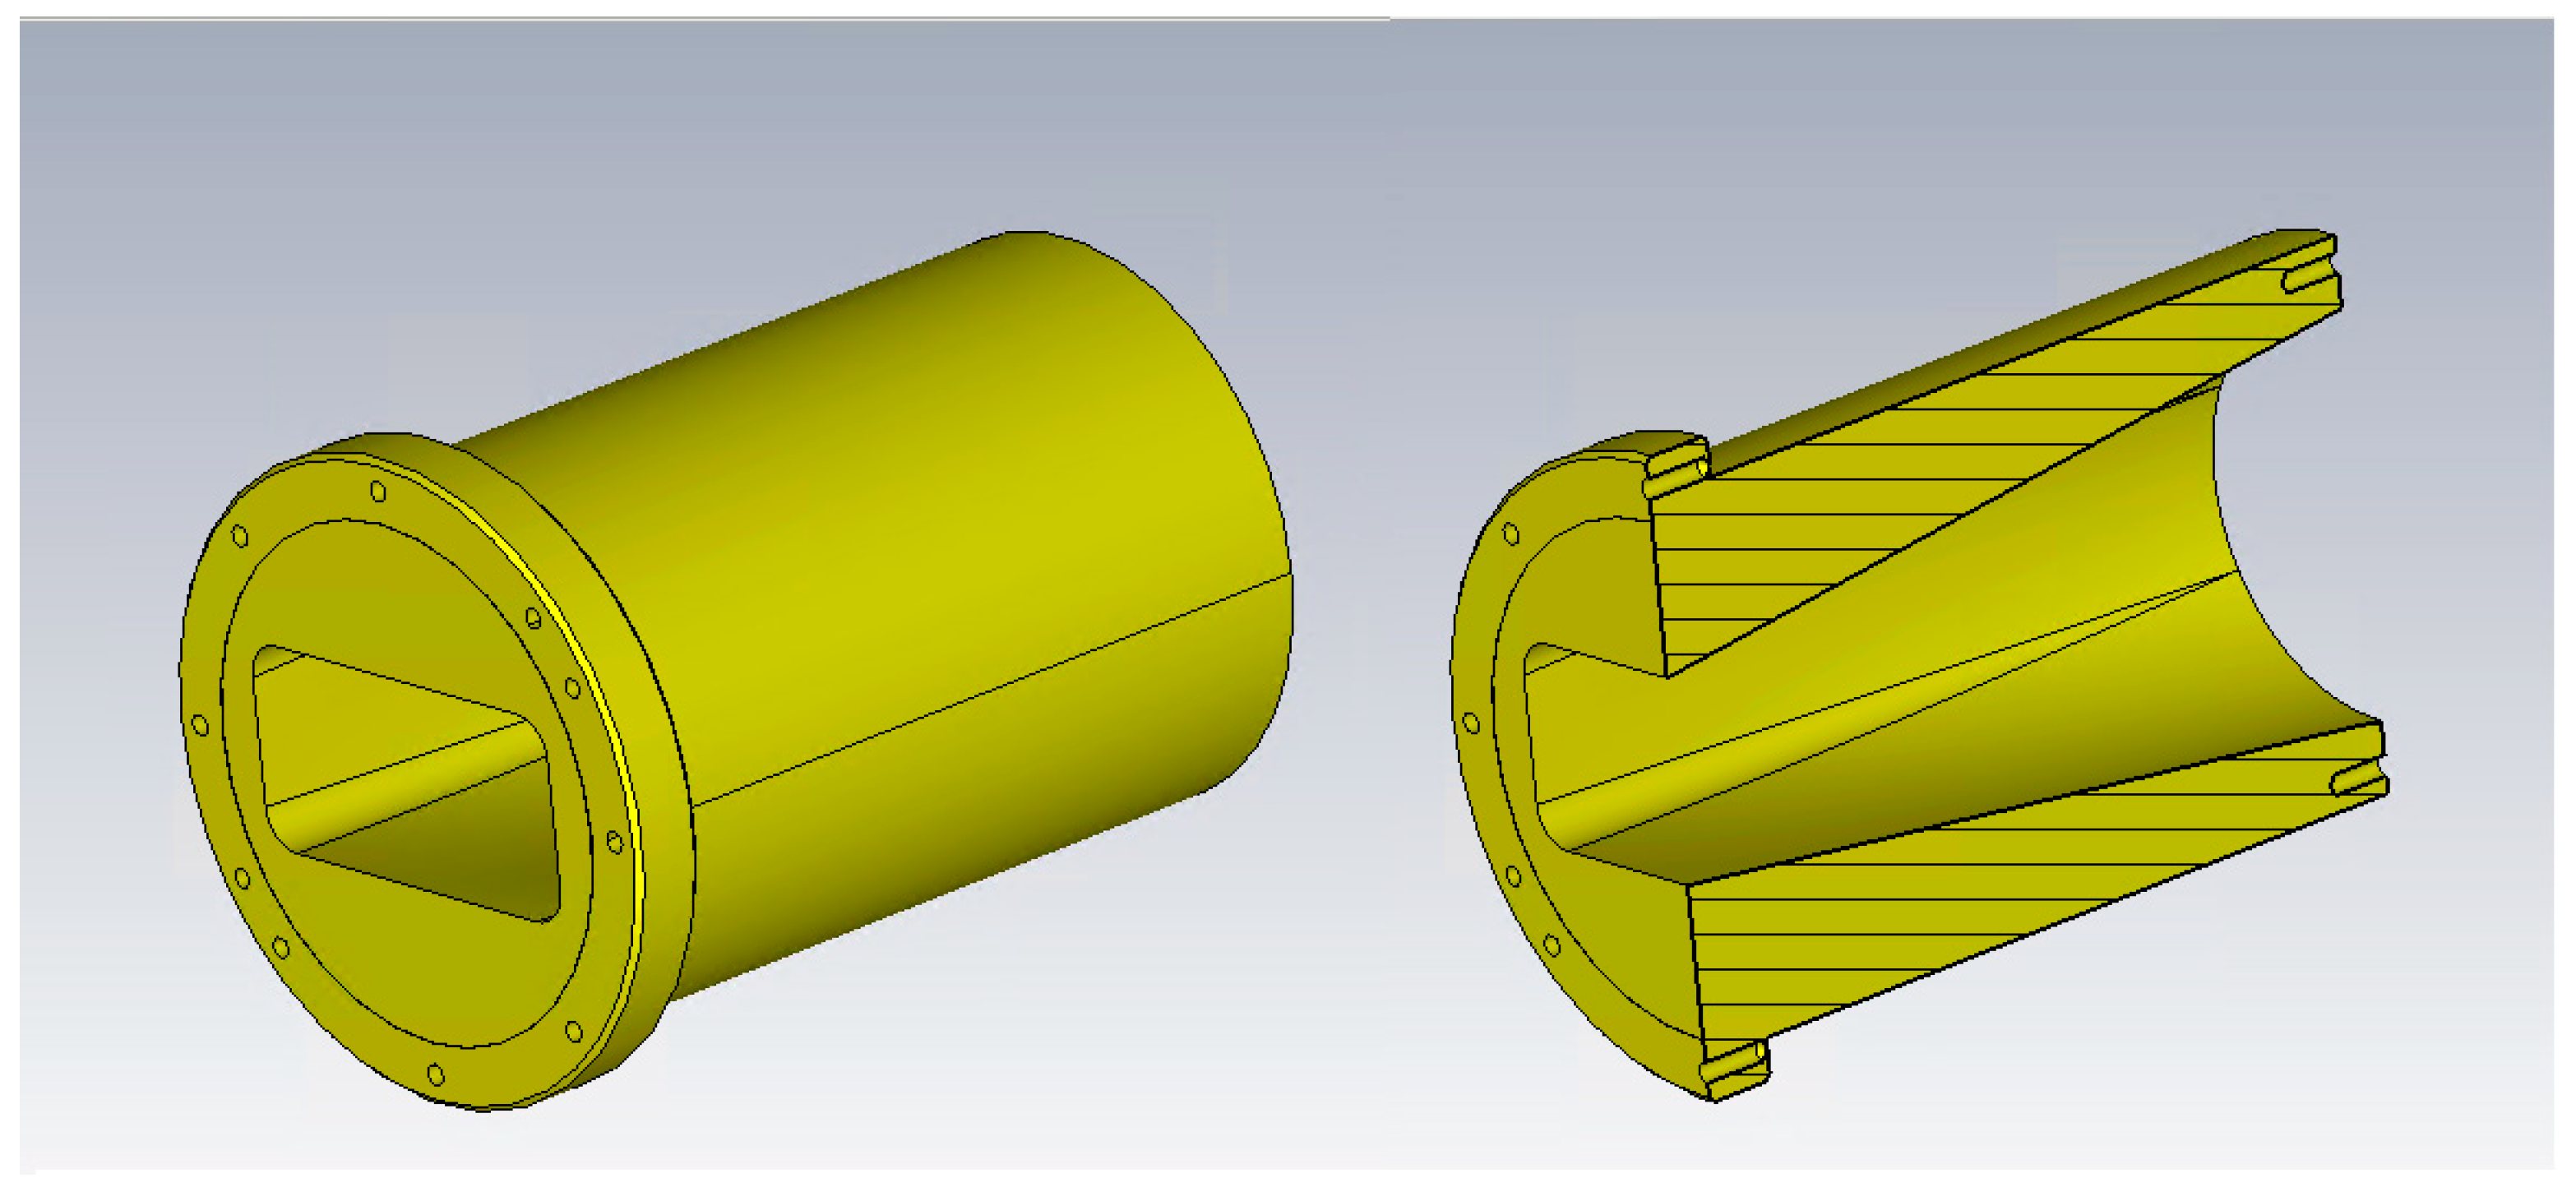
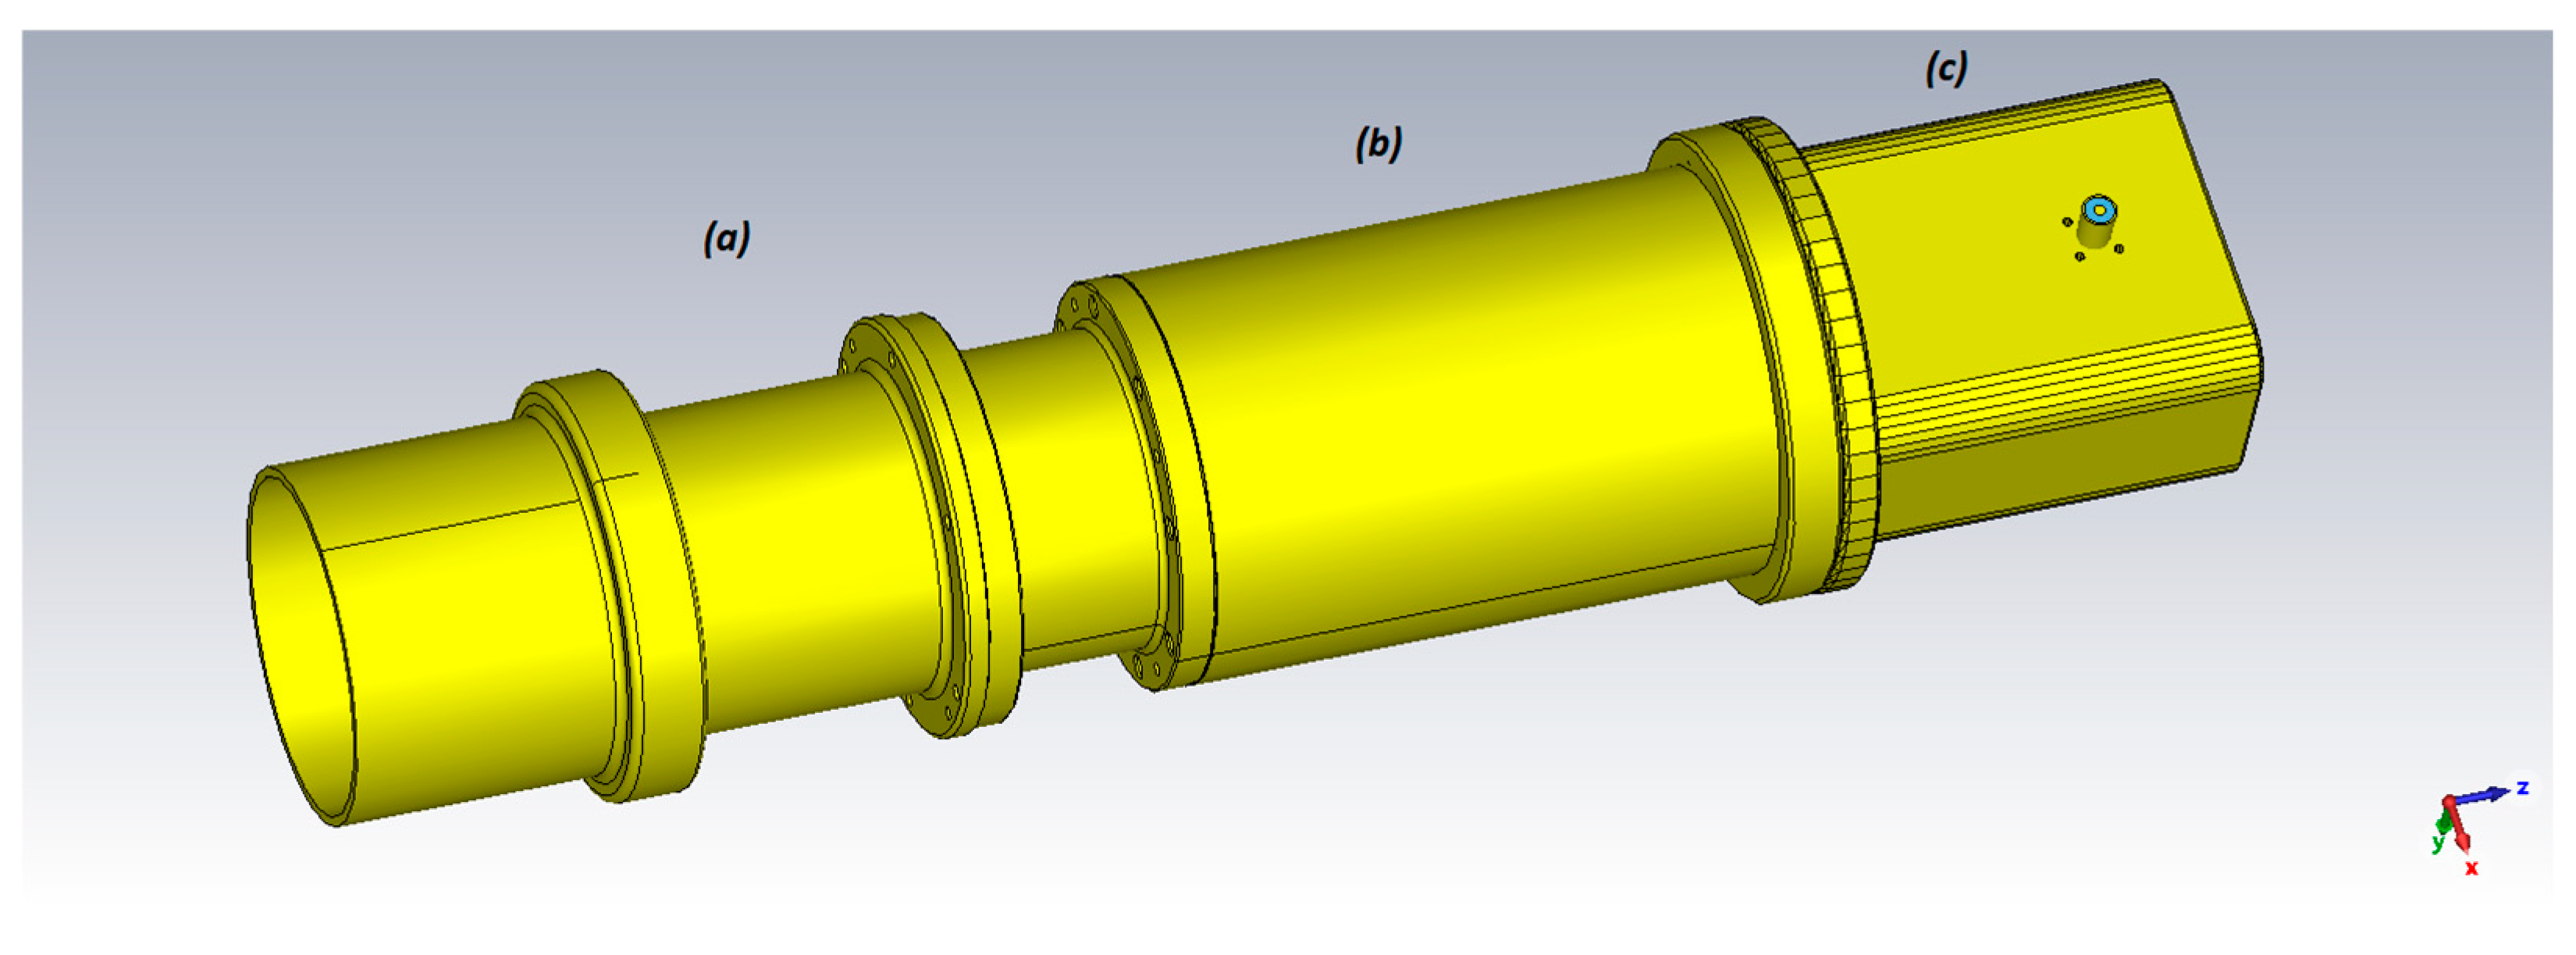
  • Circular feed horn: The circular feed horn is the most common system in the SRT receivers and ensures efficient performance [54,55]. The description of the feed is the subject of this paper, and its design, fabrication, and electromagnetic characterization will be discussed in the following sections.
  • Cryogenic front-end section: This block is fundamental for modern radio astronomical receivers because it contributes to improving the sensitivity of the system [56,57]. The cryogenic system allows cooling of a part of the receiver, called the Dewar or cryostat, thanks to a vacuum system and a cryo-cooler [58,59]. Into the Dewar, the cryogenic low-noise amplifiers (LNAs) and the ortho-mode transducer (OMT), which is useful for separating two orthogonally polarized microwave signal paths (i.e., horizontal and vertical channels), are installed. In particular, the LNA model used is the TSI2010 from TTI [60], which has a noise temperature of approximately 5 K (at the physical temperature of about 20 K) and a gain of about 27 dB within the band of interest (3–4.5 GHz) [59]. Such a low-noise temperature of the cryogenic LNA is essential to establish a robust system, with an overall receiver temperature estimated at around 11 K, as reported in [59].
  • Down conversion section (for each horizontal and vertical polarization channel): This is used to shift the radio frequency band of 3–4.5 GHz to a frequency window of 0.3–1.8 GHz, which falls within the baseband of the SRT (i.e., 0.1–2.1 GHz). The down conversion chain consists of a band-pass filter (3–4.5 GHz), an isolator, an LNA (model AFS4020006000910P4-R by Miteq [61]), an attenuator (of approximately 3 dB), a mixer (model TBR0058LA1R by Miteq [61]), a low-pass filter with a cut-off frequency of 2.1 GHz, and an additional amplification stage (model ZFL-2500VHB+ by MiniCircuit [62]). The down conversion section has a medium gain of approximately 53 dB, as reported in [59]. Further components detail and the down conversion chain characterization (i.e., gain conversion and spurious measurements) are reported in [59].
  • Local oscillator distribution section: This is composed of a 16-way power divider that permits the split of the local oscillator (LO) to all S-band receiver channels [59]. The instrument used as an LO is the model SMB100A by Rohde and Schwarz [63].
  • Noise generator section: This is used for the receiver calibration for all channels of the receiver, thanks to the injection of a noise source.
    Further details about the state of the S-band receiver design, including the S-band RFI scenario around the SRT, are reported in [38,39,59].

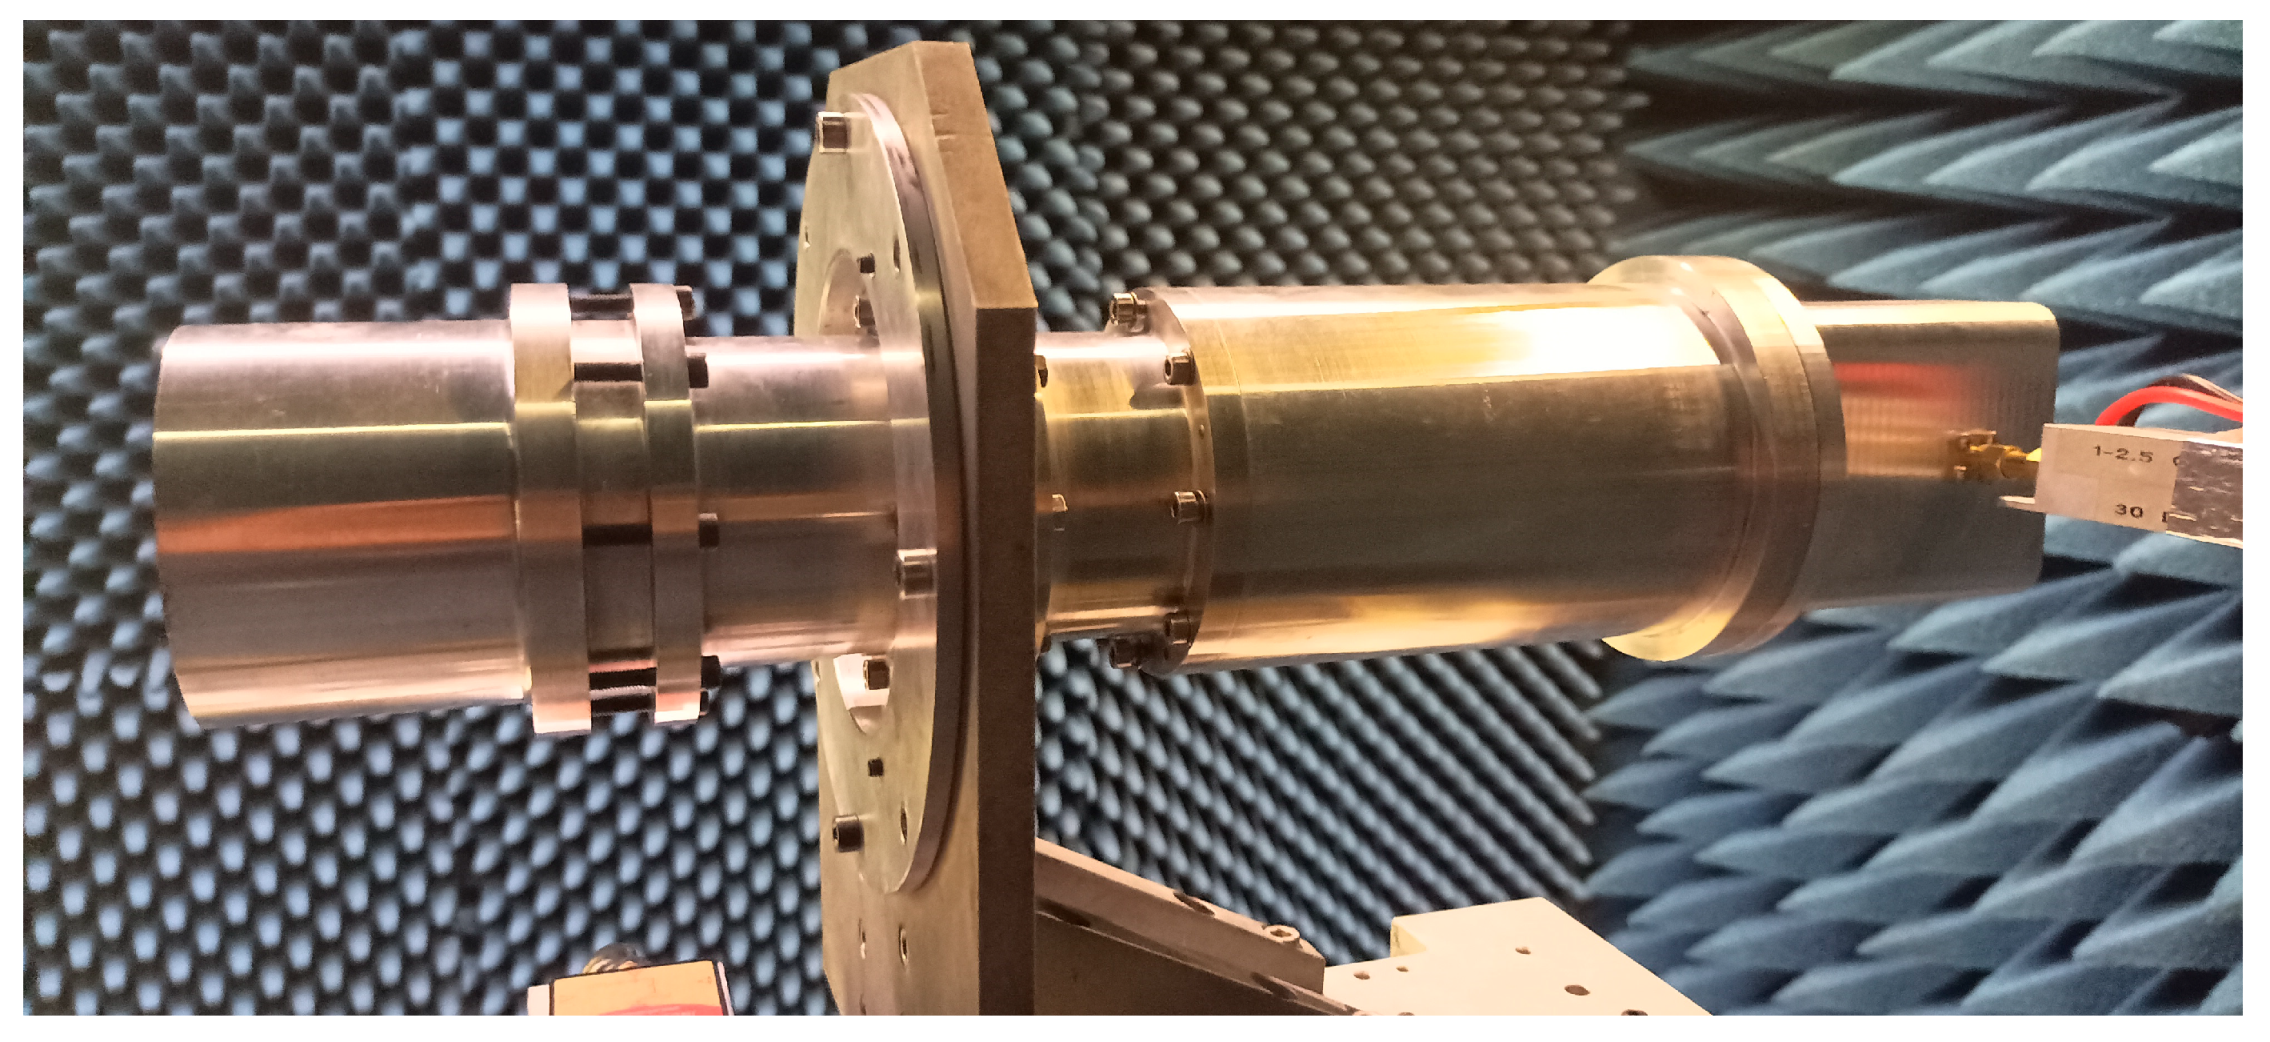
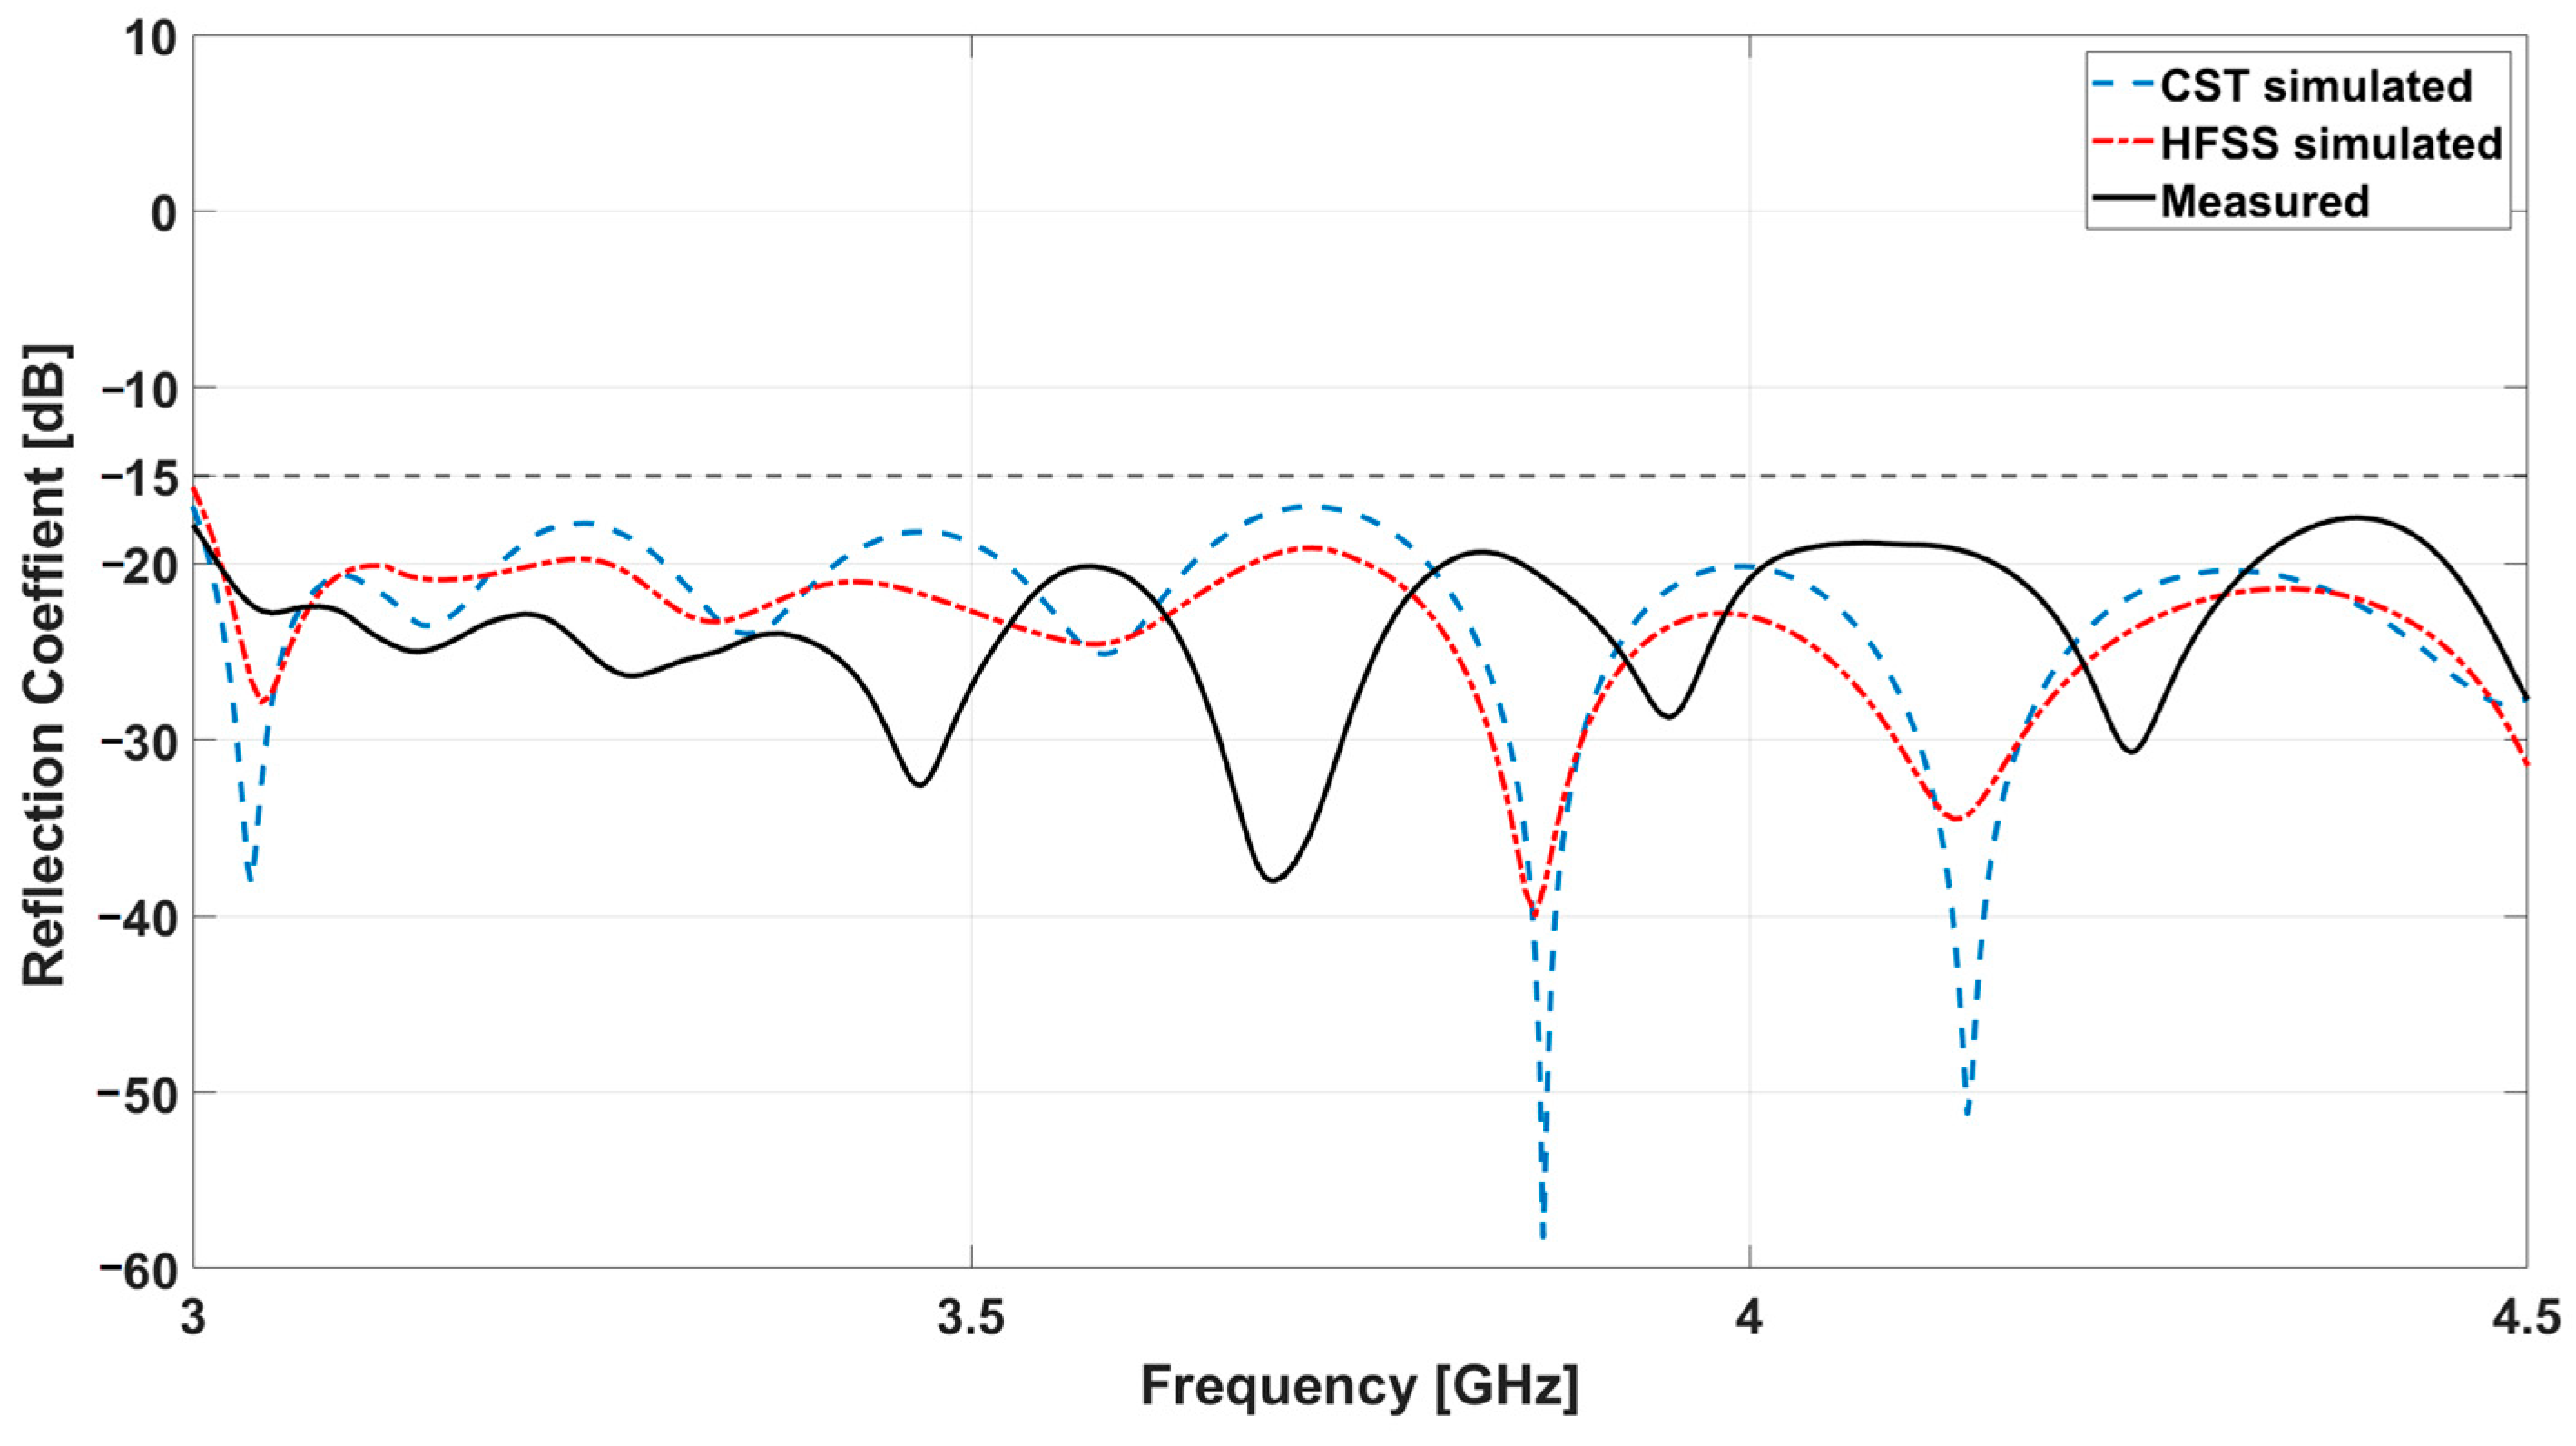
3. Design and Fabrication of the Prototype of Circular Feed Horn for the S-Band Receiver

As shown in Figure 3, the S-band feed horns are arranged in a regular hexagonal layout, with a central one optimized to be placed in the primary focus (F1 focal position) of the SRT.
The center-to-center spacing between feed horns is 91 mm resulting in a very compact array with a 1.1 wavelength λc at the central frequency of the receiver band (i.e., 3.75 GHz) and less than 1 wavelength λc at the lowest frequency [39].
During the development of the receiver, several solutions were adopted which are briefly summarized as follows: In a first configuration of the receiver, the feed horns were positioned inside the cryostat, and the vacuum window comprises a Styrodur® mechanical support [64] and a 125 µm Kapton® vacuum barrier [65], with a diameter of 474 mm (see Figure 4a). Unfortunately, this solution was discarded due to structural issues that emerged during vacuum leak tests on the Dewar. Specifically, the large diameter made the vacuum window unsuitable for withstanding external pressures greater than 1760 kg.
To overcome the problem, the Dewar was redesigned relocating the feed horns outside the cryogenic section, shown in Figure 4b. With the new design of the Dewar, each of the seven feed horns now incorporates a “small” vacuum window with a diameter matching the feed horn cross-section. This window, used to support a 125 µm thin Kapton® film [65], is secured by bonding the Styrodur® material [64] directly to the aluminum feed horn wall. This modification offers two advantages: improved pressure-withstanding capability and enhanced illumination of the primary reflector M1, which should require an aperture of approximately 148 deg with a designed edge taper of approximately −15 dB.
The smaller window size allows each window to withstand a reduced pressure of approximately 32 kg, significantly overcoming the limitations encountered with the initial larger window design. The initial design (see Figure 4a) exhibited beam truncation issues due to interference caused by the proximity of the large vacuum window edges to the feed horn walls [38]. By relocating the feed horns and using smaller windows, this revised configuration eliminates these interference effects and ensures optimal illumination of the primary reflector.
The focal plane of the multi-feed receiver is composed of seven radiating feed horns consisting of two separate parts, accurately designed and simulated using electromagnetic simulators CST® Suite Studio 2024 and Ansys HFSS® Electromagnetics Suite 2021 R1 [66,67].
The initial part of the feed horn is a homogeneous circular waveguide of 64 mm in diameter and 100.5 mm in length. To achieve a reduction in side lobes and an improvement of both, illumination uniformity of the primary reflector and low cross-polarization levels, as suggested by a state-of-the-art analysis [54,55], a second part was added to the truncated waveguide. This new part is a cylindrical choke added externally to the open end of the truncated waveguides as shown in the cross-section view of Figure 5, with an internal diameter of 72 mm and a length of 73 mm. The choke dimensions were carefully designed to minimize cross-polarization levels [54]. This consideration plays a crucial role in optimizing the receiver’s performance by ensuring that most of the radiated energy is concentrated in the desired polarization state, thereby reducing unwanted signal components that could degrade system performance.
To characterize the single feed horn it is not necessary to use the entire passive feed system, but the “test chain” can be limited to a quarter-wavelength section in the circular waveguide and two custom-designed adapters: a circular-to-rectangular waveguide and a rectangular waveguide-to-coaxial cable. Both components were designed using commercially available software package CST® Suite Studio 2024 and Ansys HFSS® Electromagnetics Suite 2021 R1 [66,67].
The waveguide-to-coaxial cable adapter consists of a 90 mm long rectangular waveguide with a section of 64 × 32 mm. These specific dimensions are chosen to optimize the performances with the desired operating frequency range (3.0–4.5 GHz) of the receiver. To connect the waveguide to a coaxial cable, a commercial SMA coaxial connector [68] with a designed probe is used. This connector provides a seamless interface between the waveguide and the coaxial cable, allowing an efficient signal transfer. A metallic probe 13.85 mm long is positioned to convert the guided TE10 mode into a TEM mode. The distance between the probe and the back-short of the waveguide is important for achieving the desired characteristics and impedance matching: in this case this distance is equal to 13.85 mm. In Figure 6, a 3D image with the cross-section of the described adapter is shown. The configuration of the probe, consisting of three concentric cylinders with increasing diameters, allows the operation of the transition over a wide frequency range as depicted in the graph of the simulated reflection coefficient at the coaxial input shown in Figure 7.
The second waveguide adapter (from circular to rectangular) is made up of a “cylinder” having a length of 135 mm (Figure 8), with a smooth variable internal section designed to accommodate the specific shape and size of the feed horn, allowing for a secure and efficient connection. Once the feed horn is properly inserted, it is aligned with the waveguide adapter, ensuring a smooth transition from the feed horn (having circular section) to the waveguide-to-coaxial cable adapter (having rectangular waveguide input at one side). To optimize matching, a quarter-wavelength section of circular waveguide is introduced between the feed horn and the adapter.
In Figure 9 and Figure 10, the simulated reflection coefficient at the two ports of the adapter are illustrated.
The 3D model of the complete single feed horn measurement chain configuration with all the devices connected is depicted in Figure 11, while in Figure 12 the manufactured prototypes are shown in the anechoic chamber test setup.

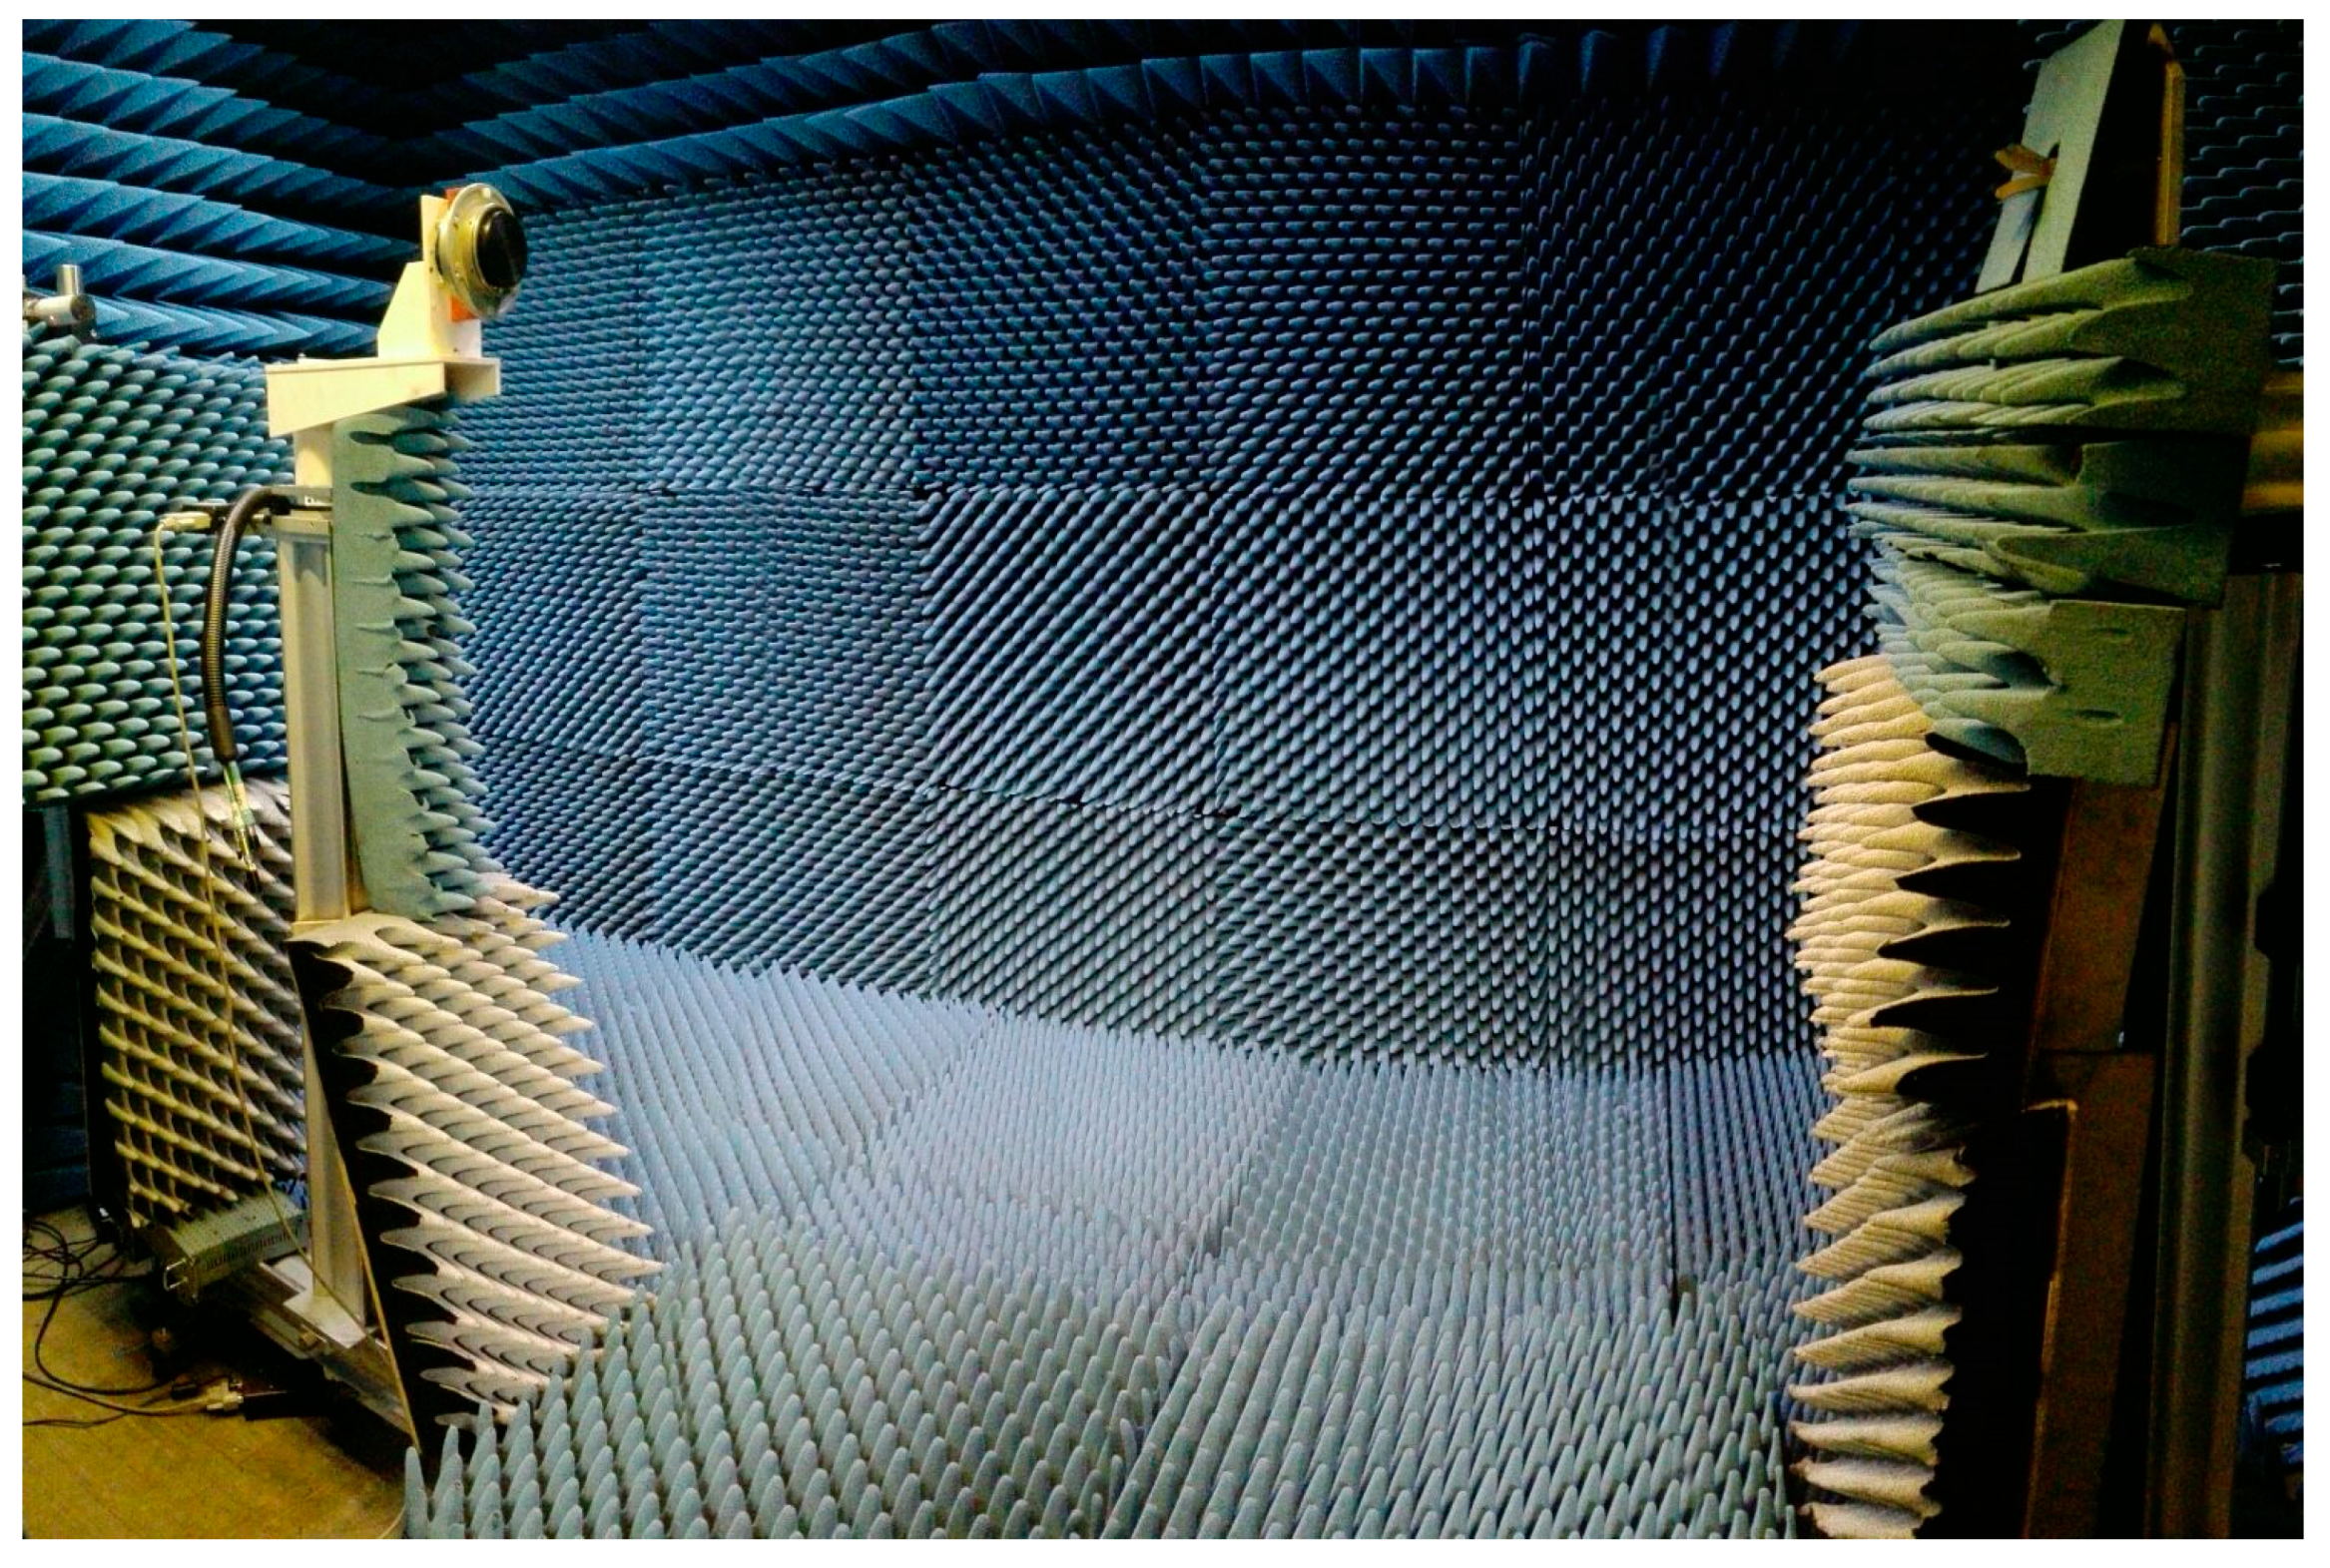
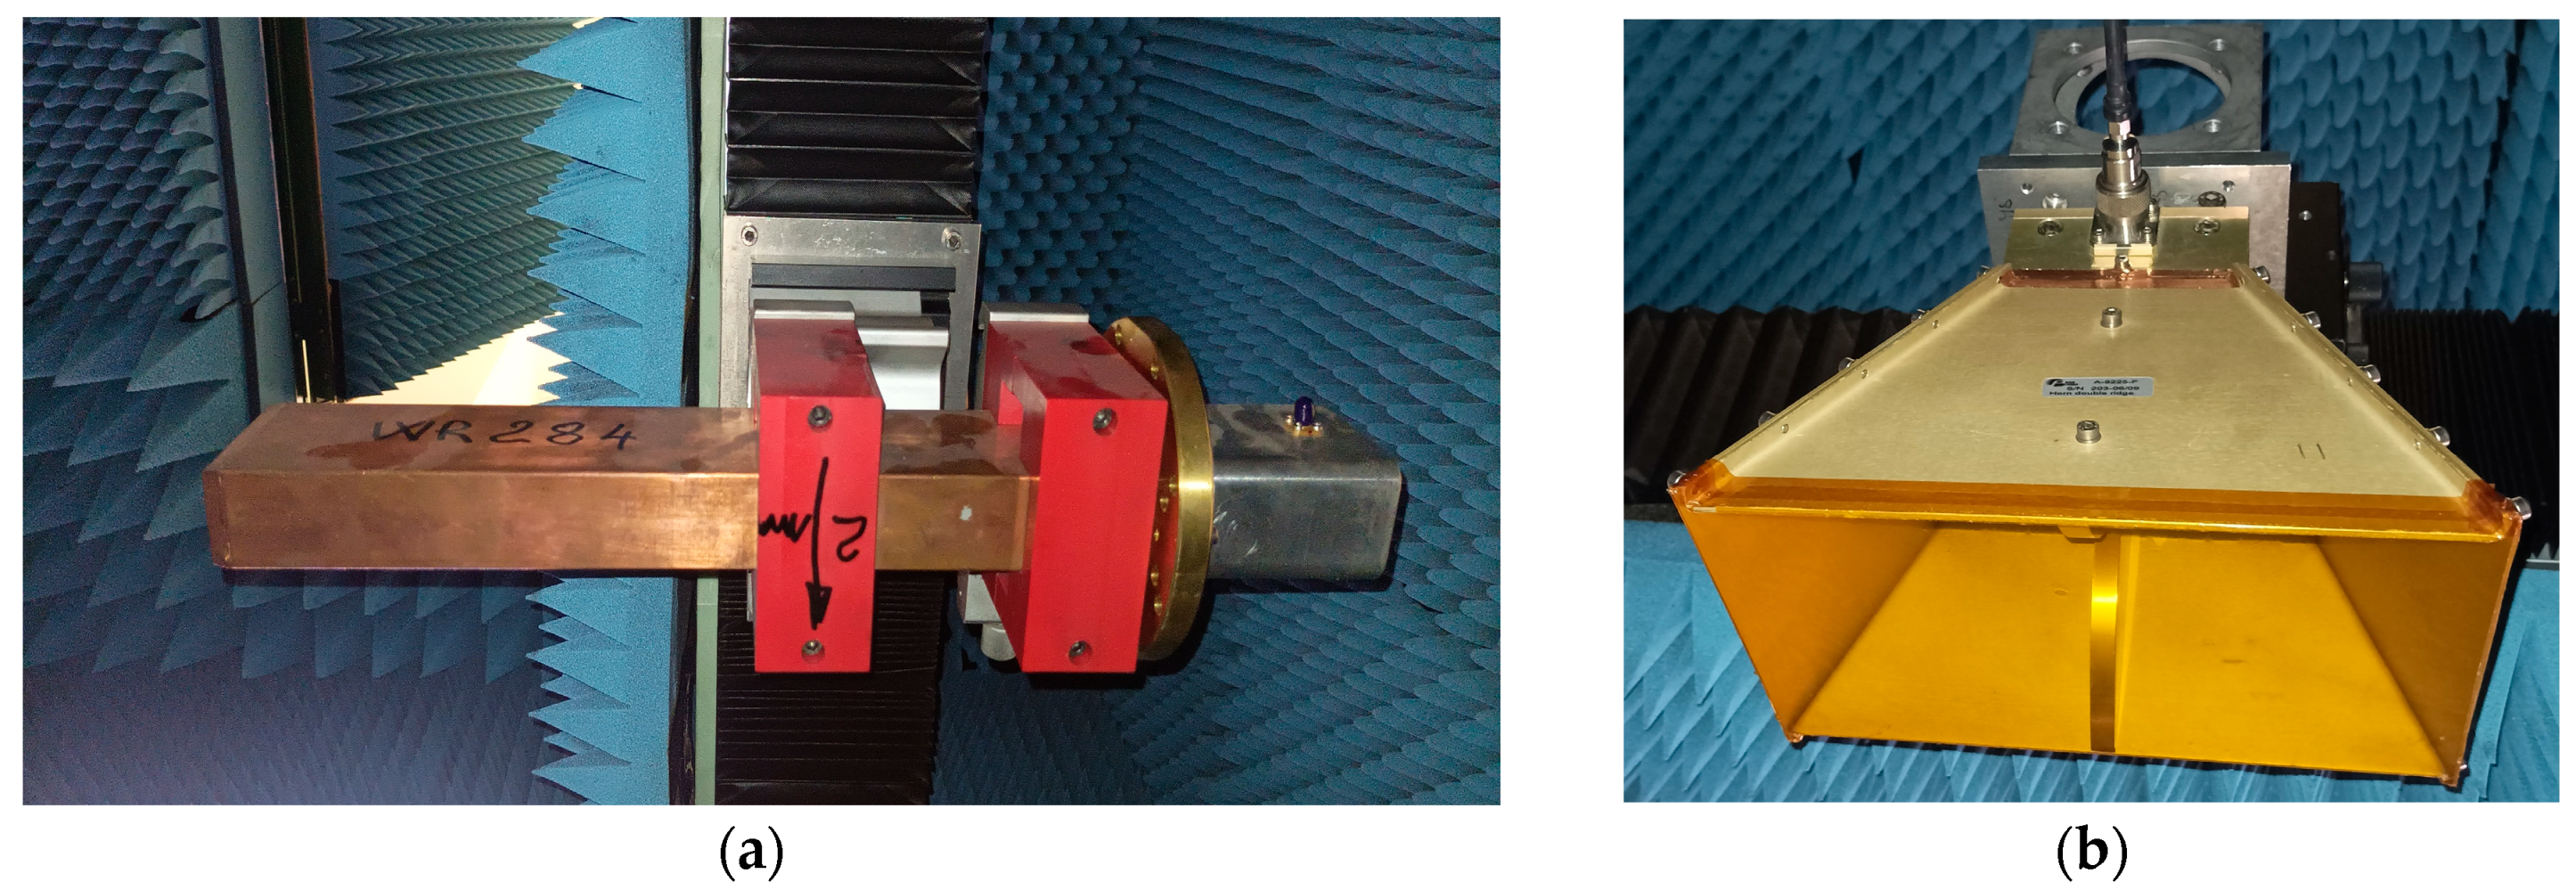
4. Electromagnetic Characterization of the S-Band Feed Horn: Radiation Pattern Measurements in Anechoic Chamber

The S-band single feed horn front end has been characterized in the anechoic chamber at the INAF Arcetri Astrophysical Observatory (OAA-INAF) [69]. The chamber (see Figure 13) has a dimension of 2.5 × 3.5 × 2.4 m (width × length × height) and allows to perform near- and far-field measurements of devices not excessively bulky compared to the size of the chamber itself.
In our case, the electromagnetic characterization of the single feed horn is crucial to verify the receiver’s performance: for this reason, near-field and far-field measurements were conducted. The measurement setup for near-field and far-field are depicted in Figure 14 and consist of the Device Under Test (DUT), shown in Figure 12, a WR284 open-ended waveguide probe for the near-field (Figure 15a) having a section of 72 × 34 mm, and a double-ridge wideband horn with 12.5 dBi of gain in the 3–4.5 GHz range (Figure 15b) for the far-field. A vector analyzer Anritsu VNA 37277C was used for the measurements [70]. In the far-field setup, an amplifier between the VNA output and the DUT input was used to increase the dynamic range of about 10 dB: this helps to overcome losses in the measurements setup and ensures improved accuracy at angles far from on-axis, where the signal level of the field measurement is lower.

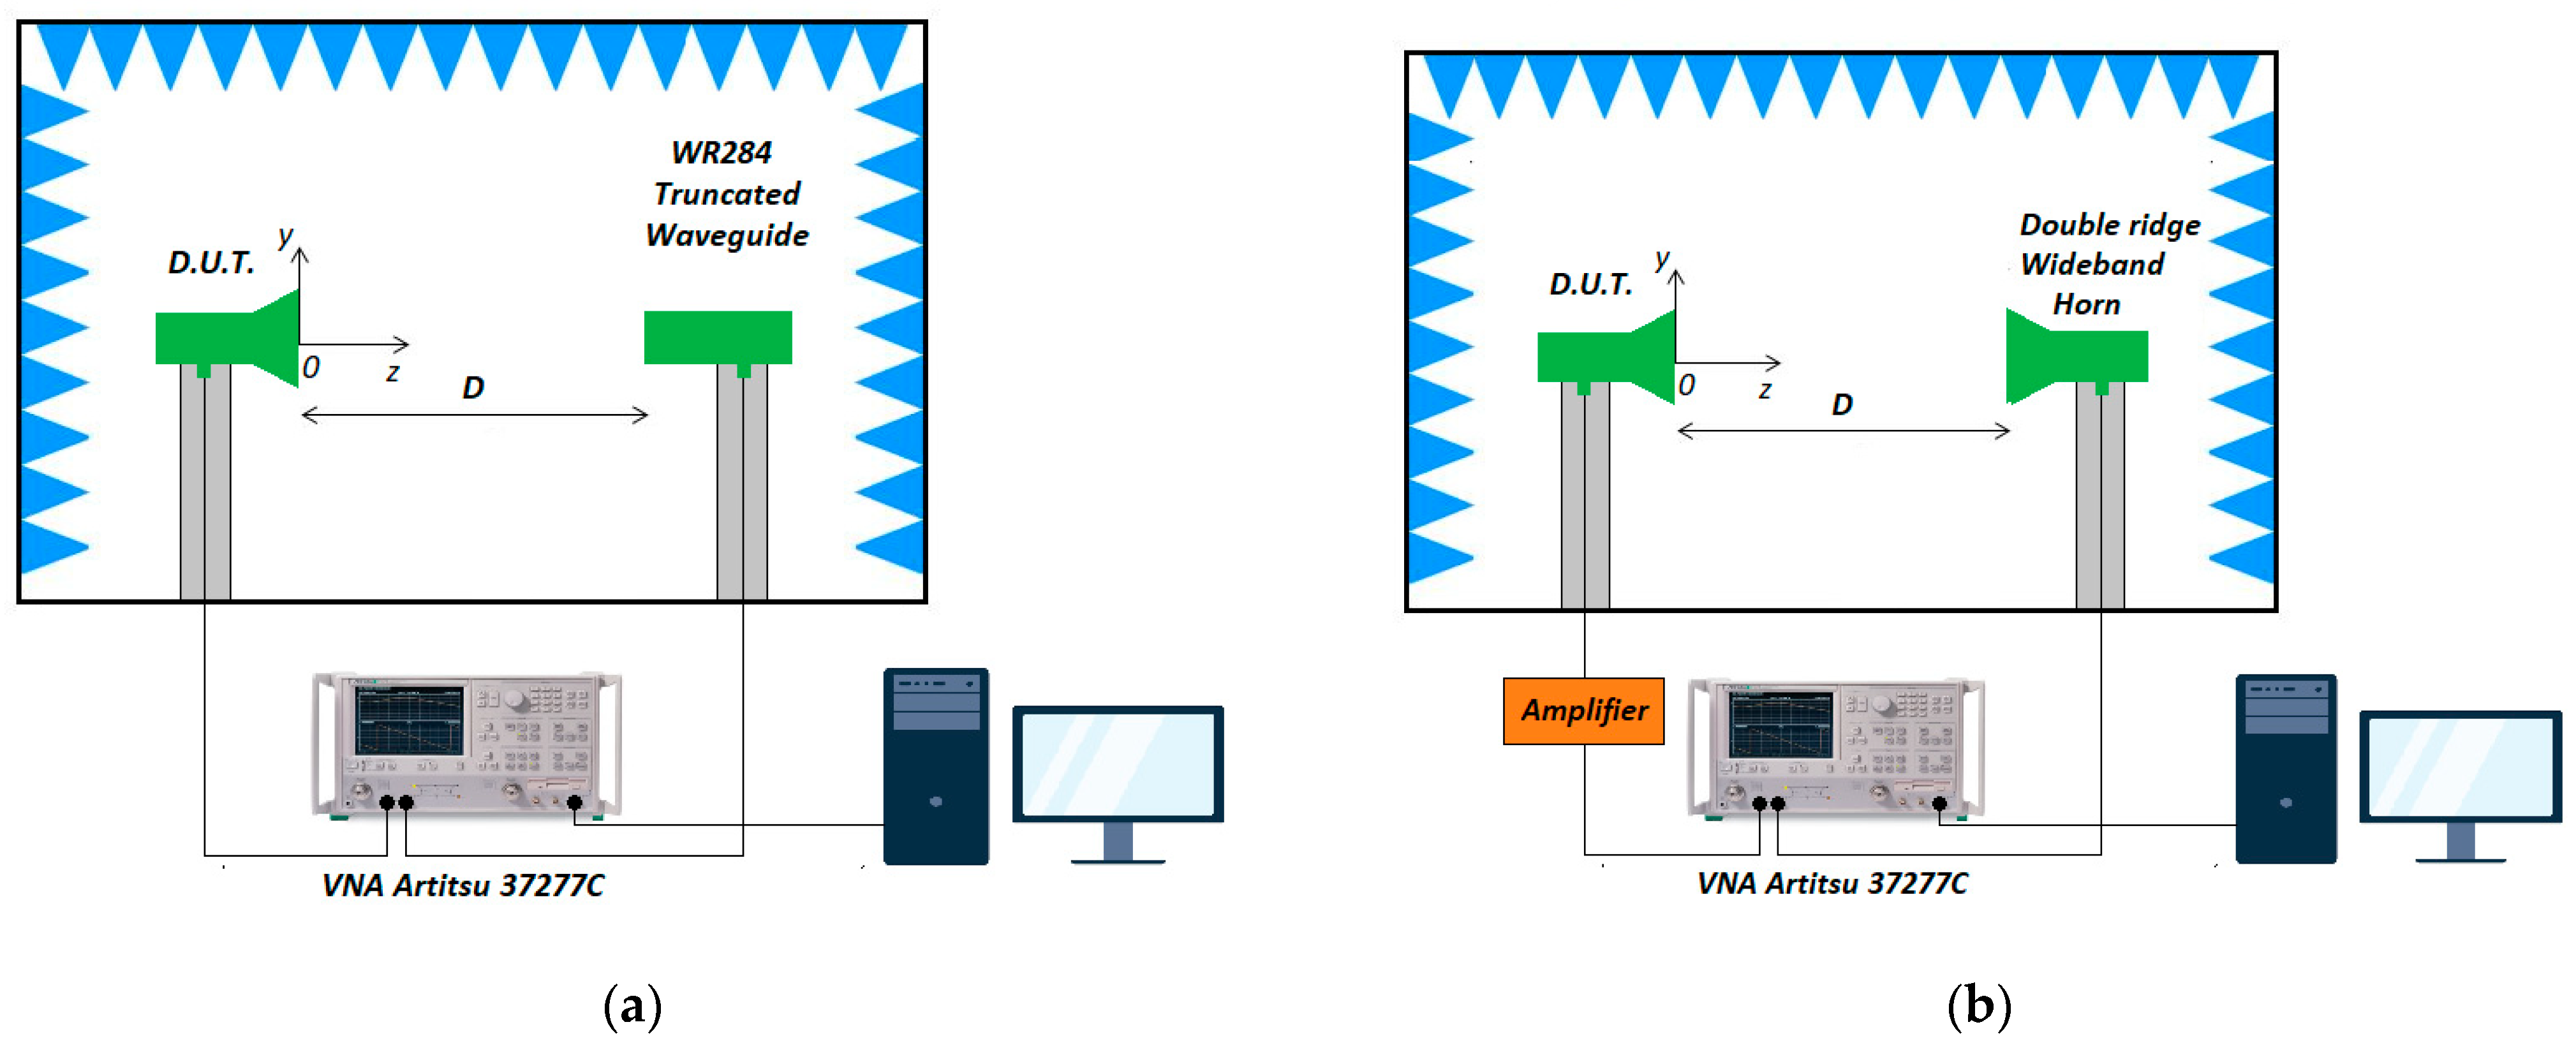
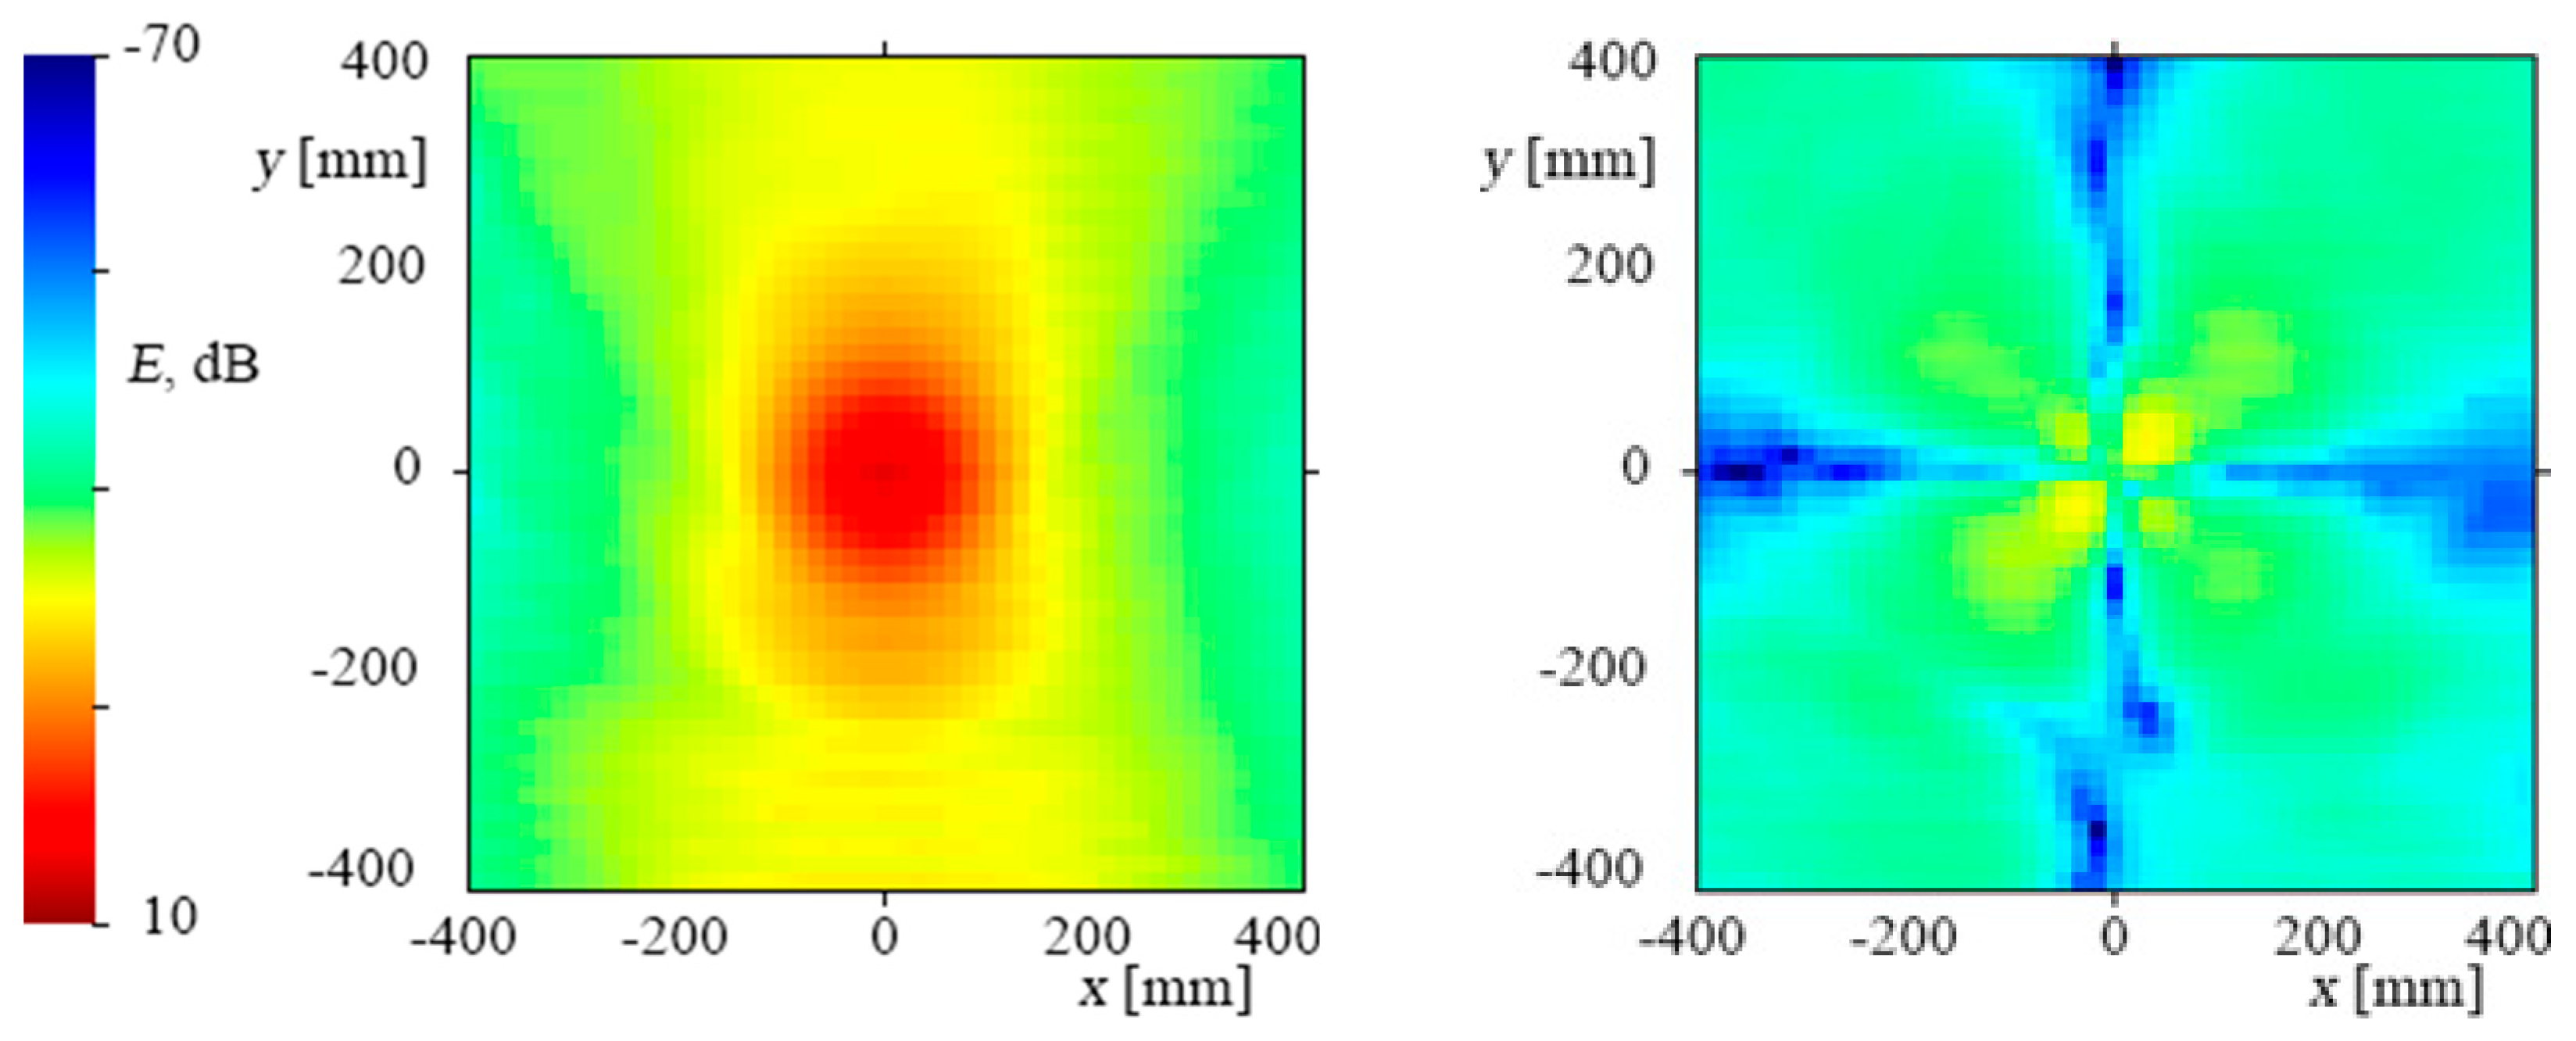
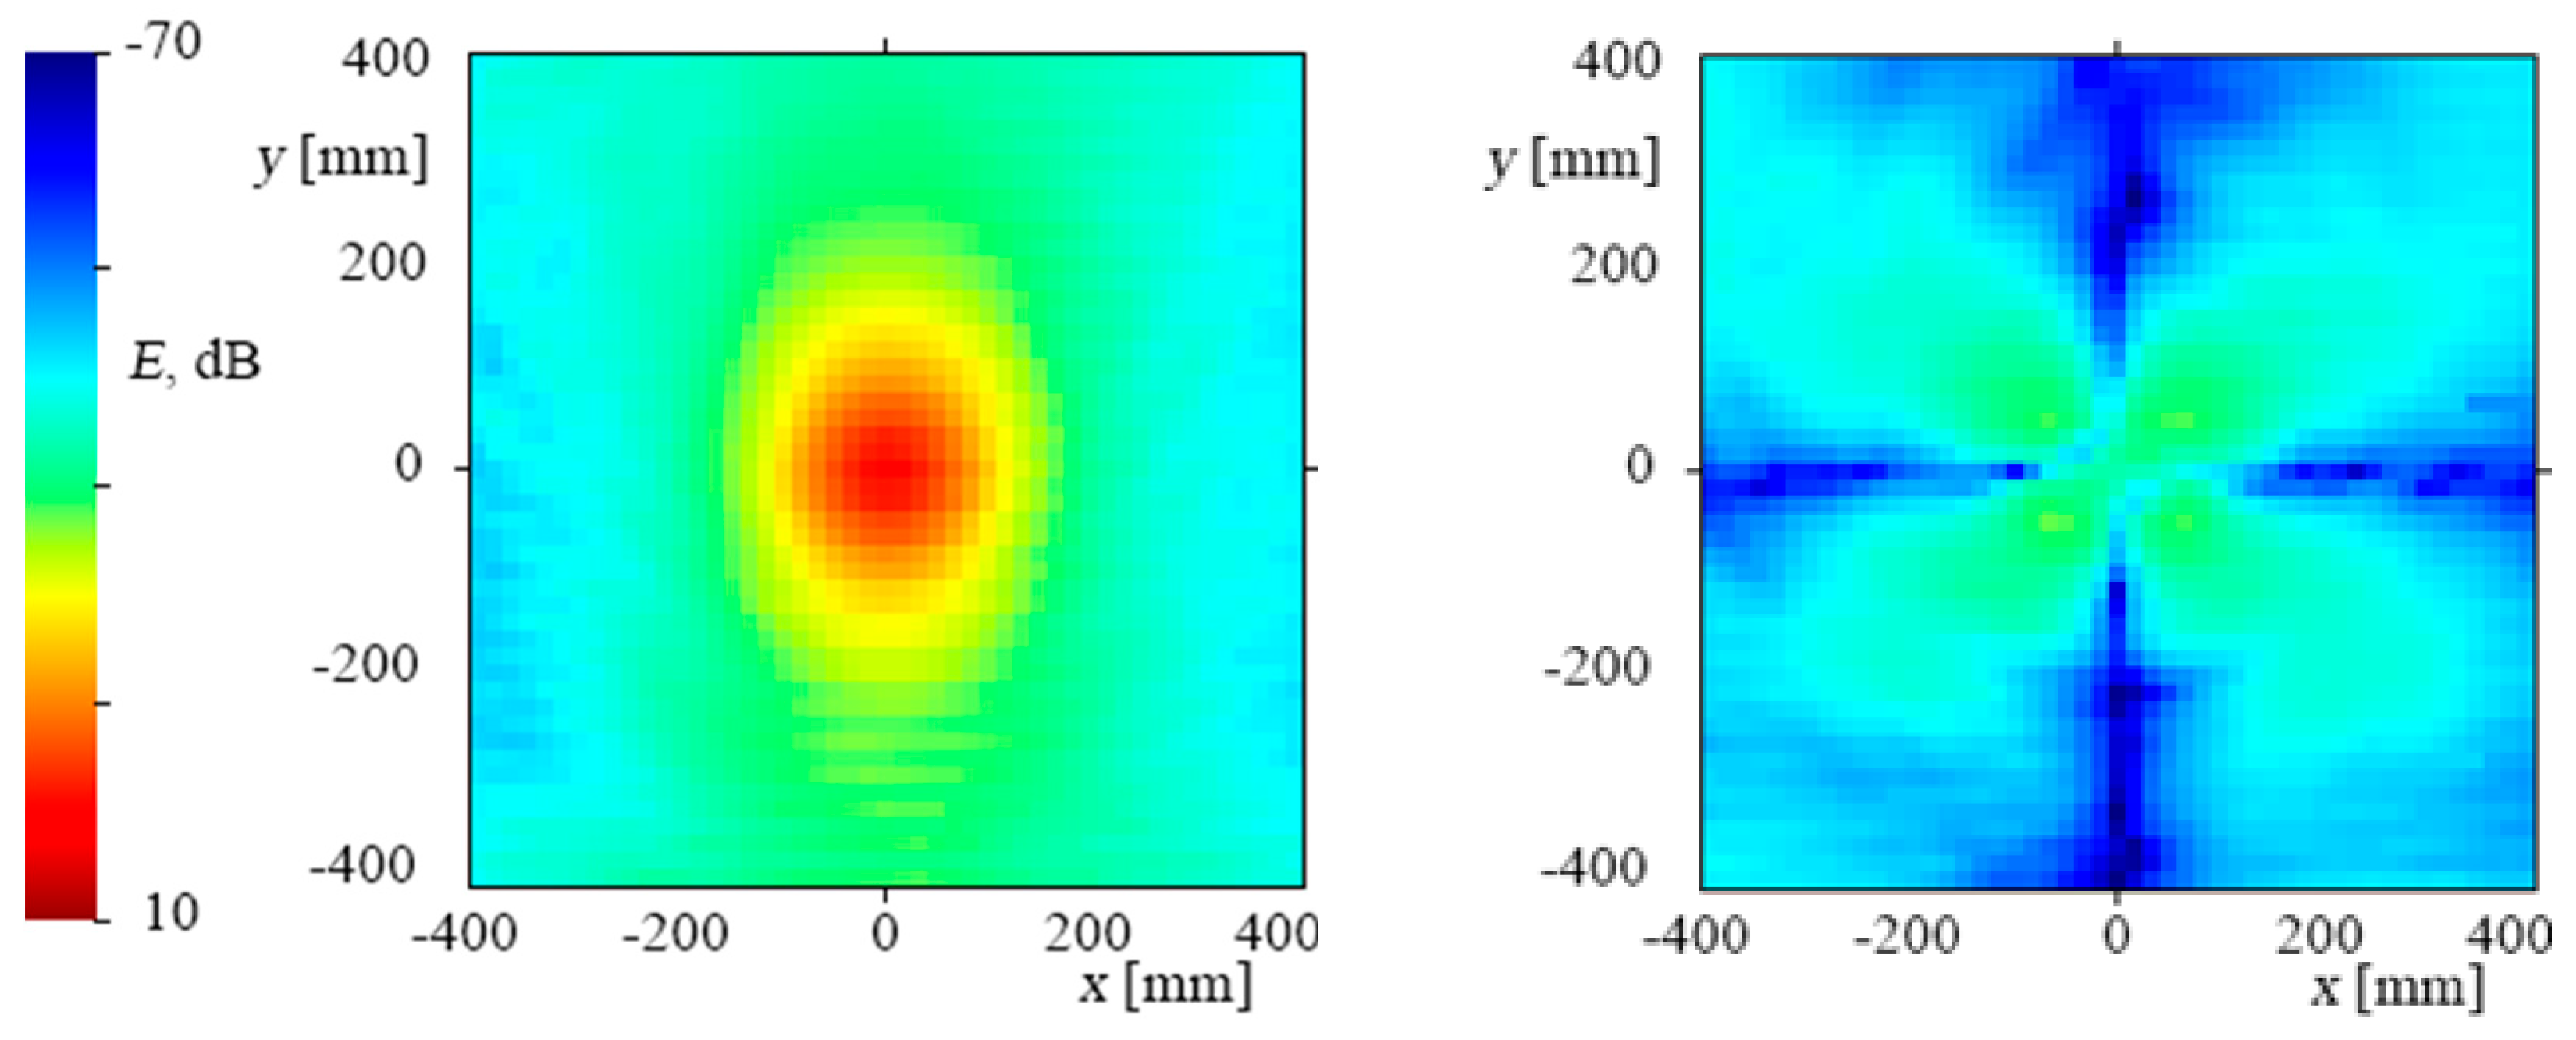
4.1. Near-Field Measurements

The origin of the Cartesian reference system used in the measurement campaign has been placed at the center of the radiating aperture (as shown in the Figure 14), with the z-axis pointing outward from the feed horn: the detection of near-field has been performed at increasing distances D (80, 125, 145, and 200 mm) along the z-axis, all distances falling within the near-field region since the DUT Fraunhofer distance is [71]:
D f = 2 d 2 λ 346.38   m m
In this case, d is the diameter of the aperture of the single cylindric feedhorn (76 mm) and λ is the minimum wavelength (6.67 cm) of the operative bandwidth. The probe scans a square area of side 816 mm in the xy plane and near-field measurements are taken on a regular grid of 49 equidistant points. Two planar scans at two different mutual orientations between the probe and the feed horn around the z-axis (0° and 90°) allow to measure both the co-polar and cross-polar components of the near-field; the measurements were performed at three different frequency points (3, 3.75, and 4.5 GHz). Measurements at different distances between the probe and the feed horn were in very good agreement allowing to cross-check the absence of undesired multipath spurious effects in the measurement at all distances. The co-polar and cross-polar field maps taken at a distance, D = 80 mm, are shown in Figure 16, Figure 17 and Figure 18.
In all these cases of near-field measurements, the coupling between the probe and the feed horn originated fairly accurate near-field maps but inaccurate far-field maps unless using probe deconvolution. In our case, it was also possible to do far-field direct measurements for far-field characterization, as shown above.
Jointly with the near-field measurements, the reflection coefficient of the S-Band modified front-end was also evaluated, as shown in Figure 19 comparing simulated and experimental data. The input matching is very satisfactory, being better than −15 dB in the overall operating bandwidth: the slight mismatch between simulated and measured data is due to the manufacture procedure of the coaxial-to-waveguide adapter.

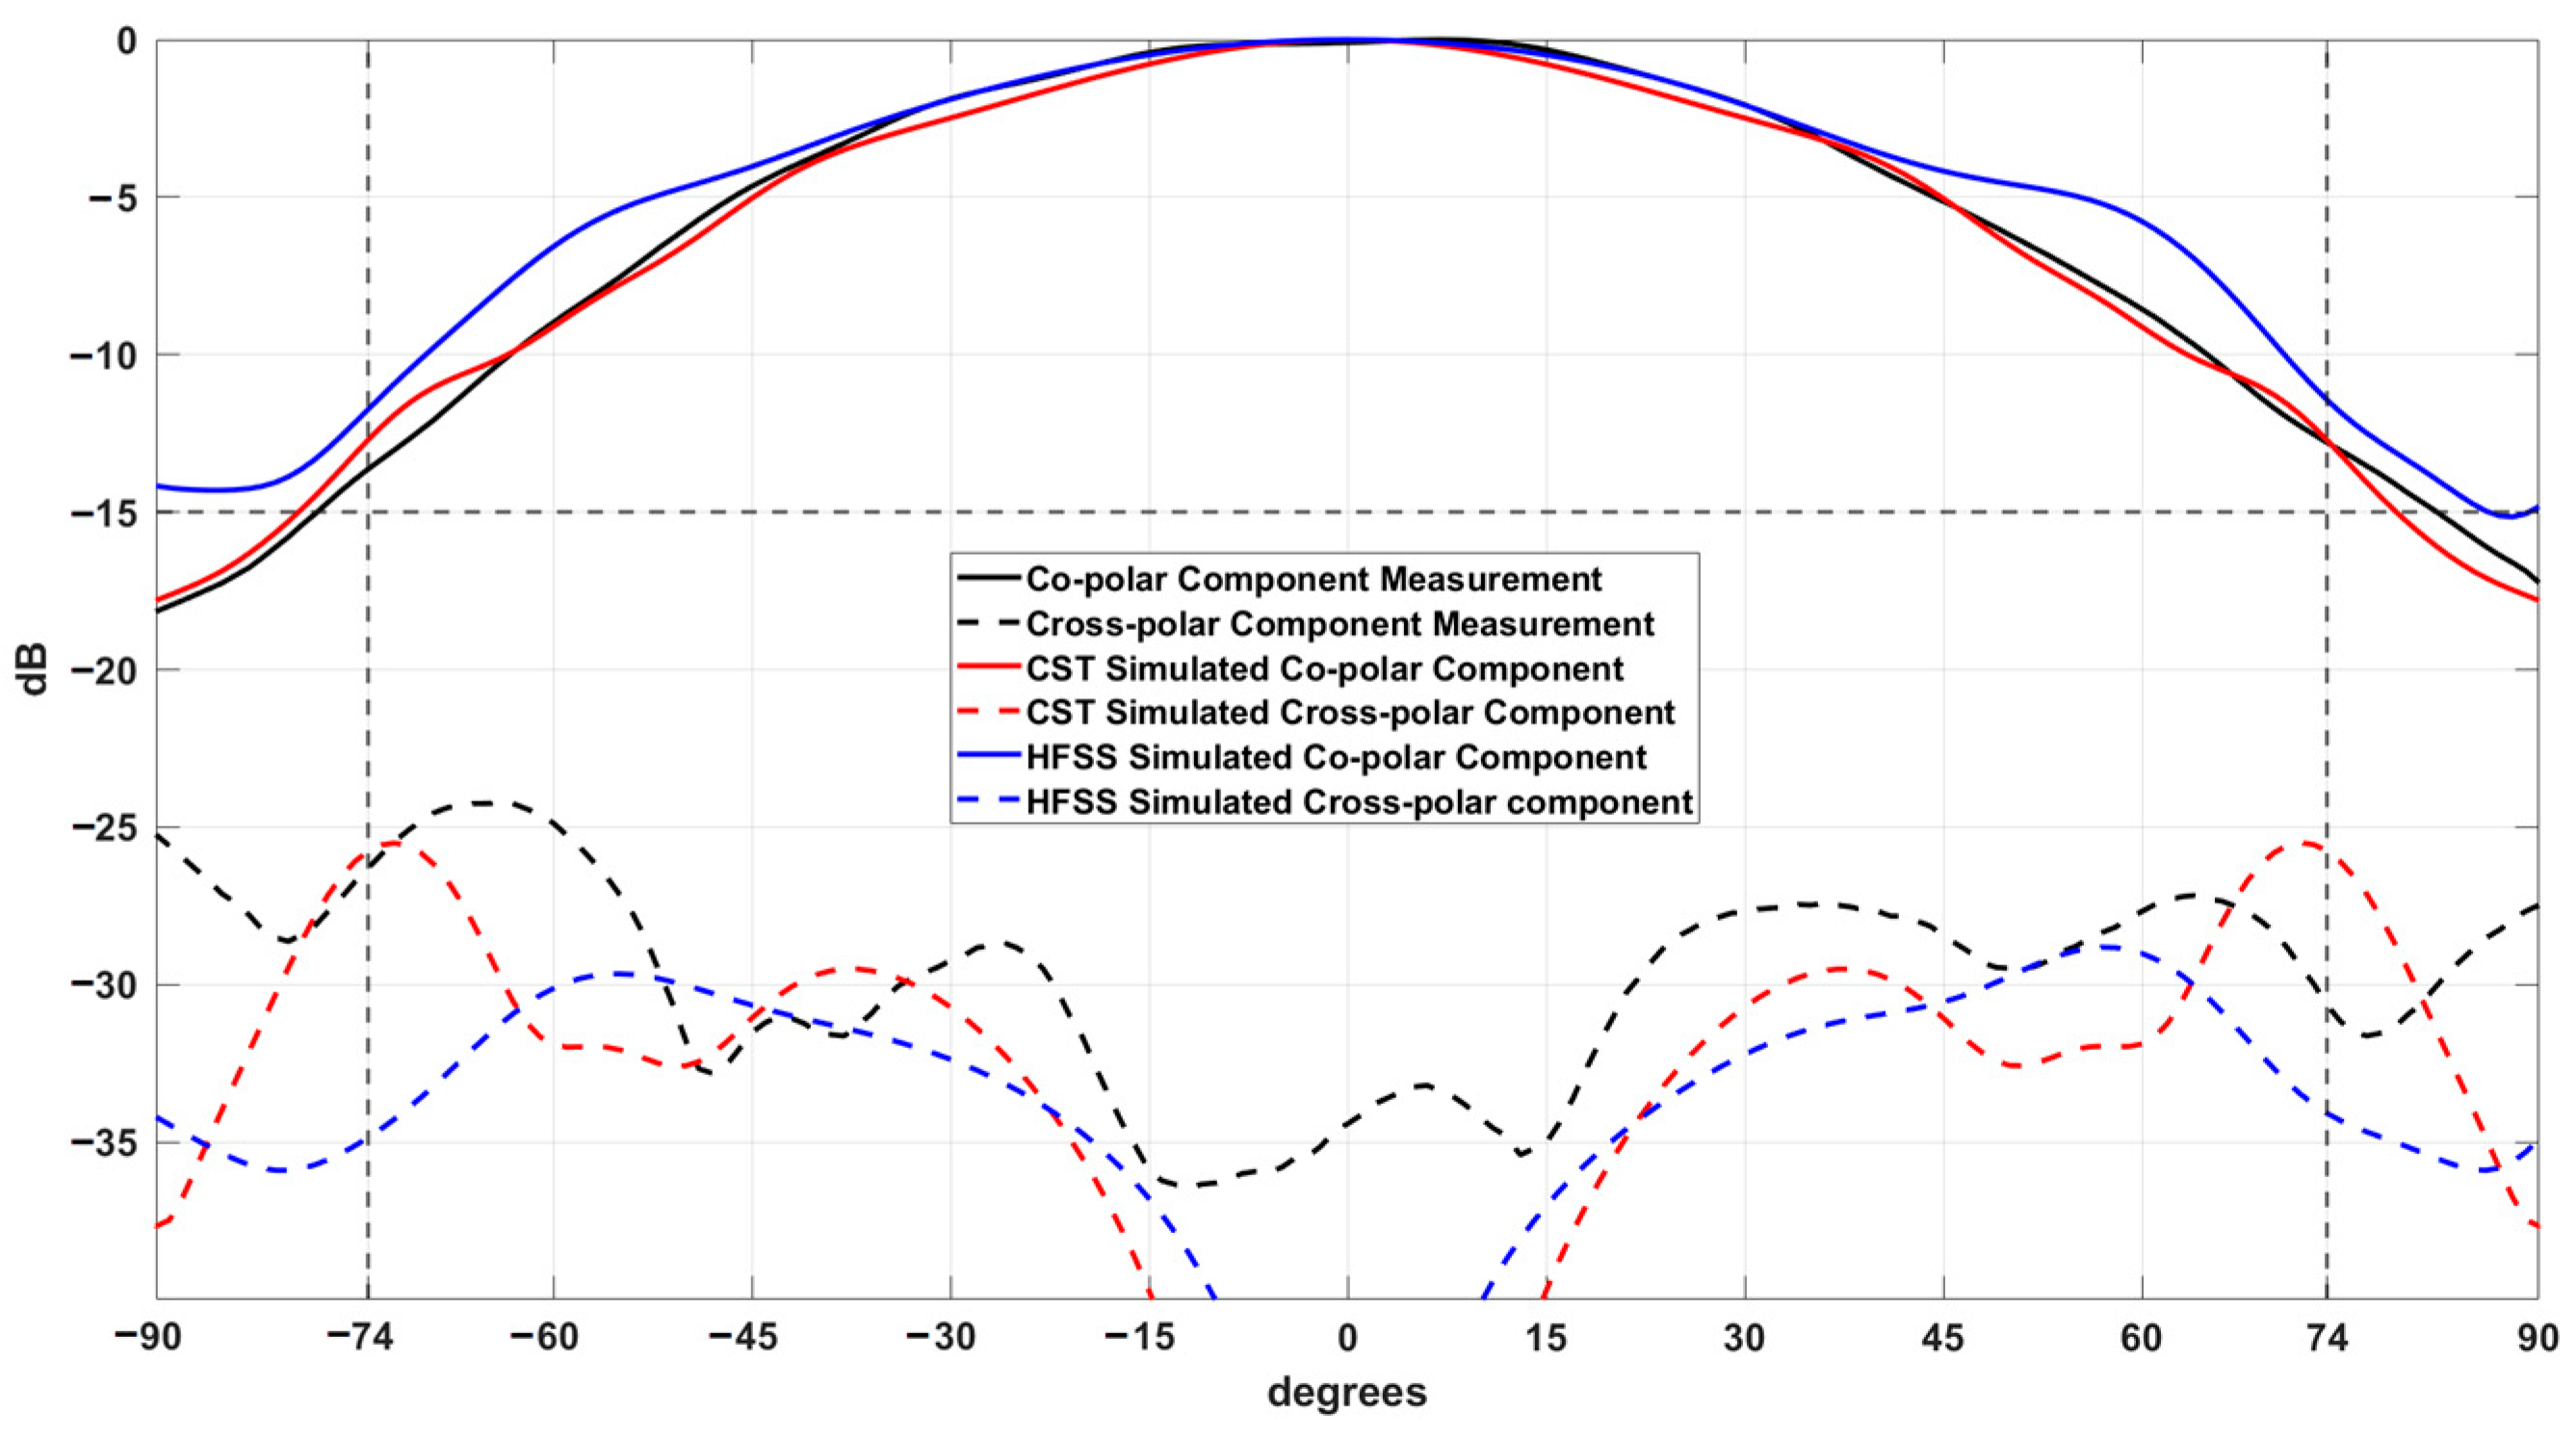
4.2. Far-Field Measurements

To obtain an accurate far-field characterization of the S-Band feed horn, a direct far-field measurement is more convenient in this case with respect to near- to far-field transformation. A double-ridge wideband horn (Figure 15b) which offers a directivity of about 12–13 dB in the bandwidth has been used as a transmitter.
As performed for near-field measurements, the scans of radiated far-field are evaluated at the same three frequency points (3, 3.75, and 4.5 GHz) while the distance, D, between the DUT and the transmitter was 900 mm. In this case, the DUT and the transmitter are mutually oriented to directly measure the field over the E-plane, the H-plane, and the 45-plane cuts ranging from −90 deg to 90 deg with sample points taken every 1 deg of rotation: co-polar and cross-polar field scans are this way obtained, the cross-polar field scan is obtained on the 45 deg plane with DUT and transmitter cross-coupled in polarization, that is, rotated 90 deg off with respect to each other around the z-axis.
The results obtained are compared with the simulated radiated fields in Figure 20, Figure 21 and Figure 22.
The measured far-field co-polar patterns are in very good agreement with the Ansys HFSS and CST Studio Suite simulated results; there are slight differences between the measured and simulated data in the cross-polar component not affecting the characteristics of the feed horn, both highlighting cross-polar levels of order of −25 dB.

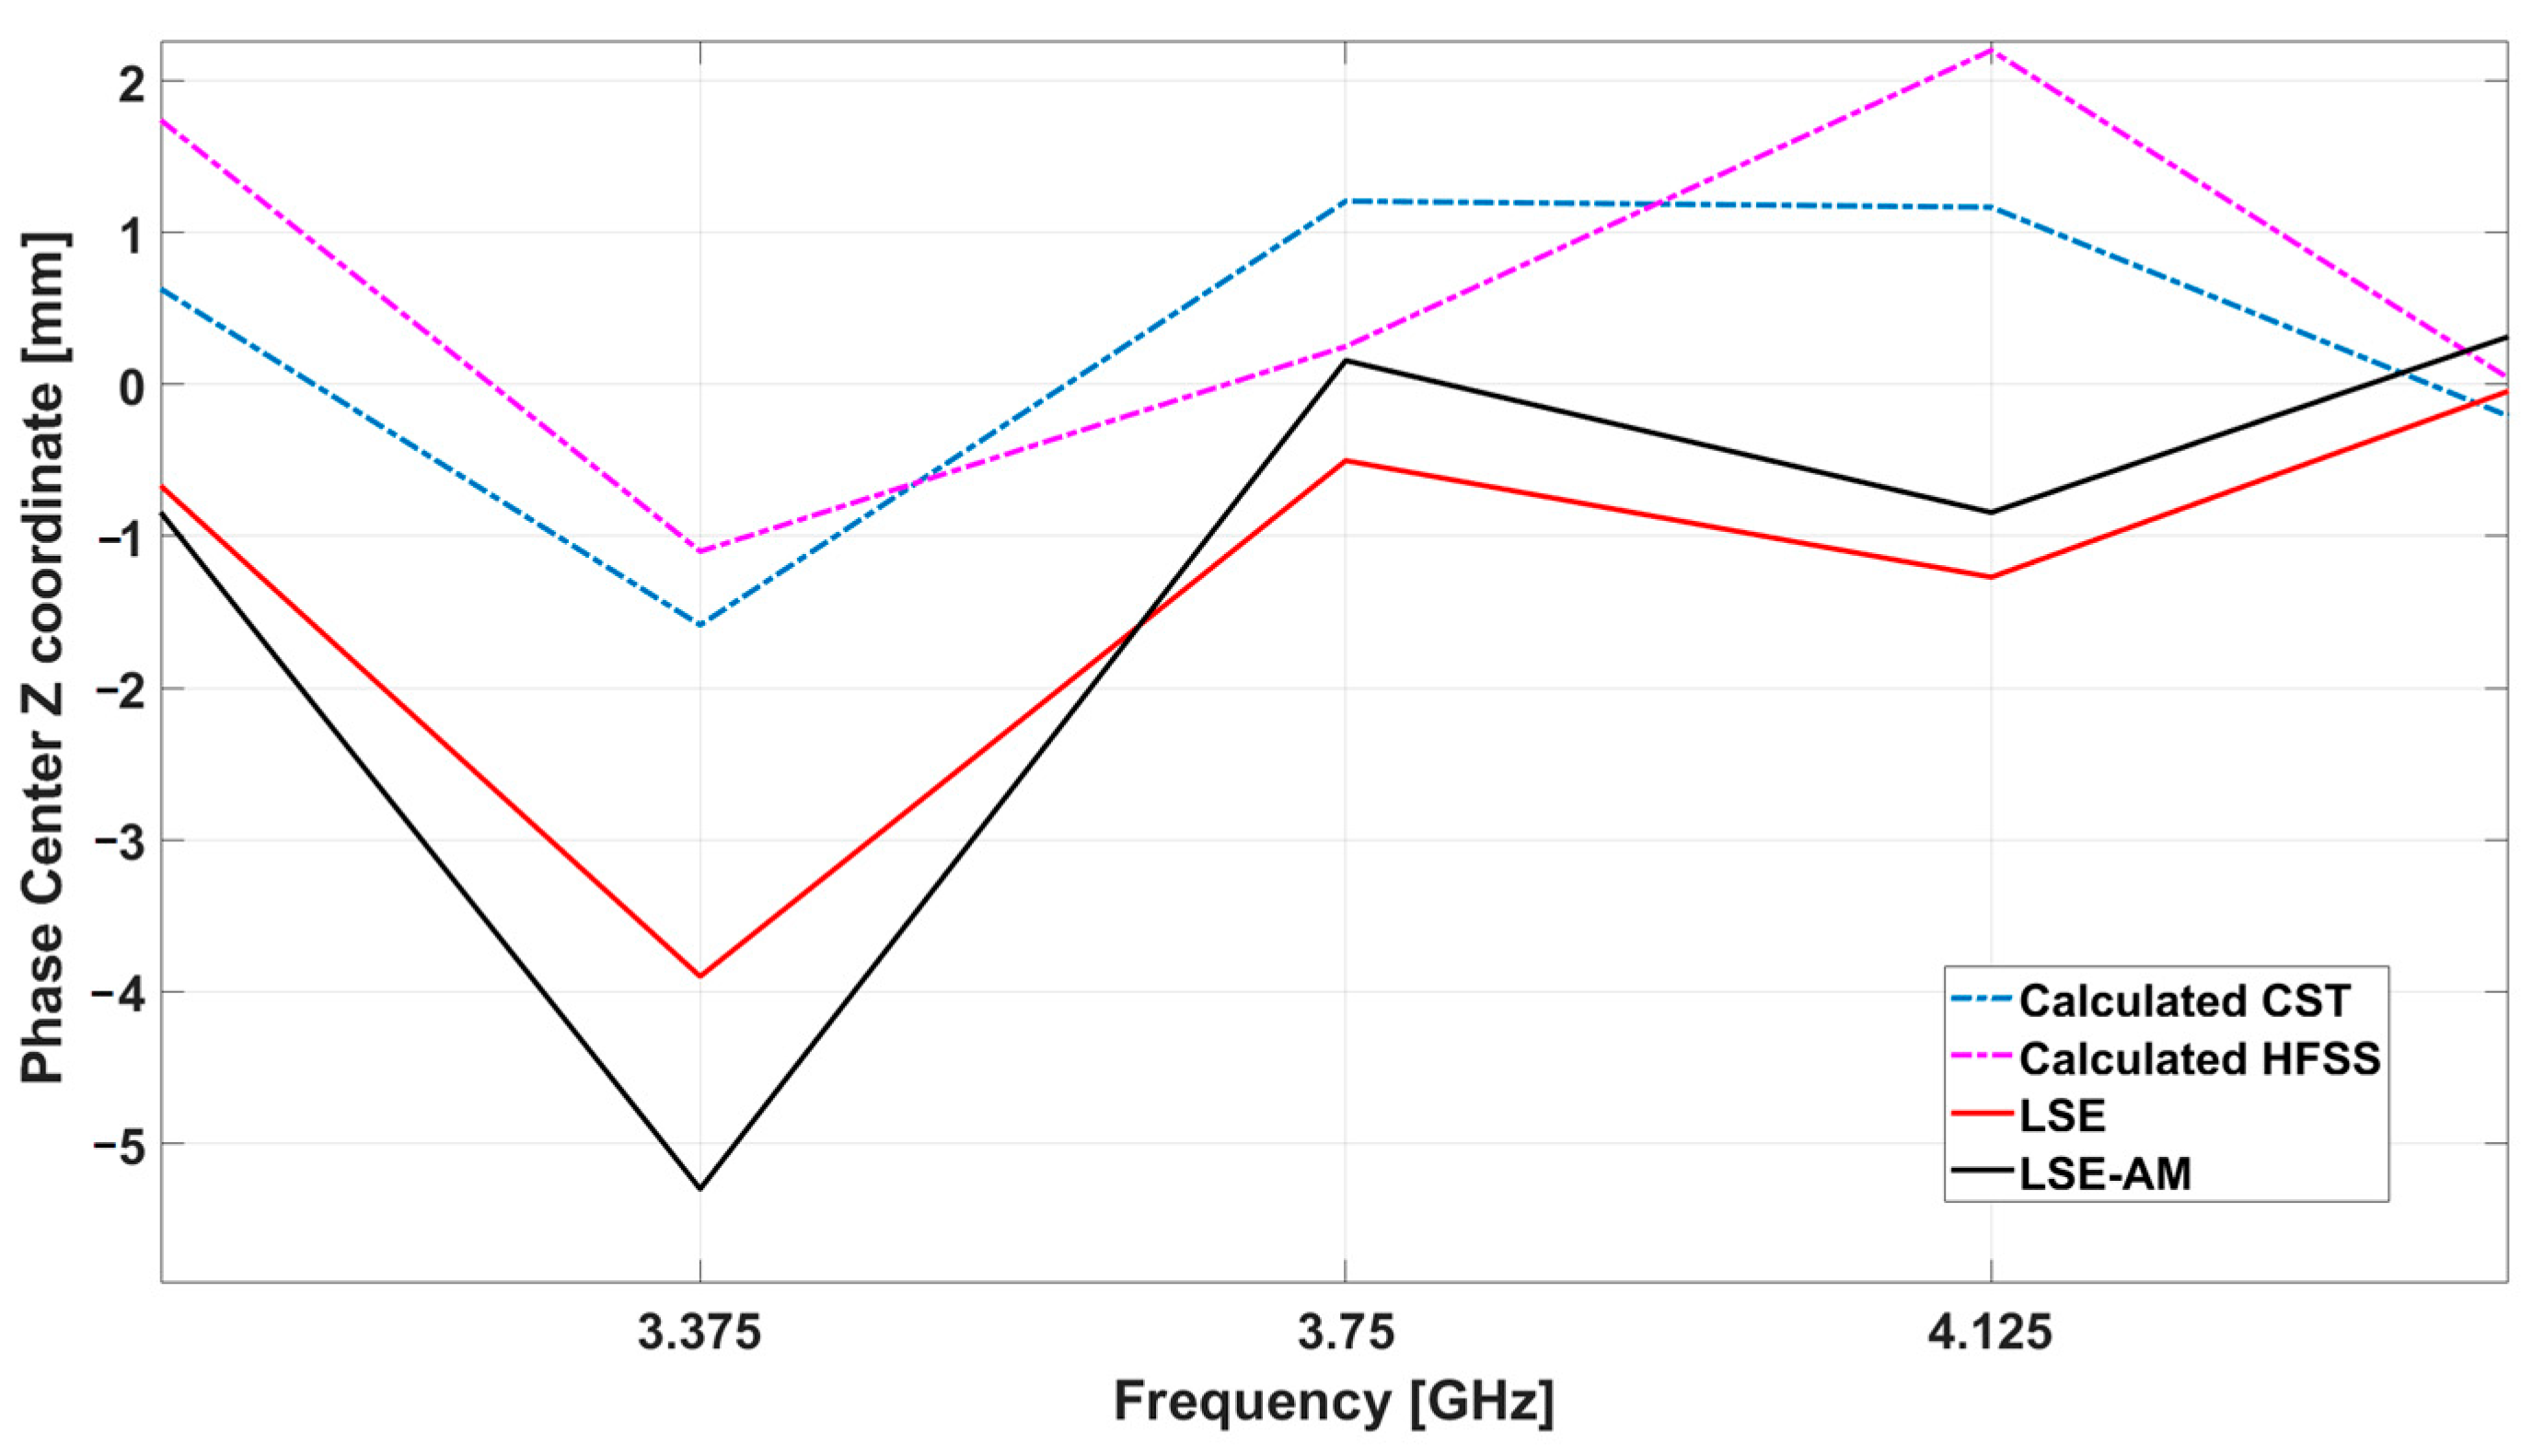
4.3. Phase Center Position

The final step of the measurement campaign involved the estimation of the phase center position of the feed horn. The phase center position plays a crucial role in the proper feed horn’s positioning in a radio telescope antenna [72]; this point, also known as “phase reference”, is a “virtual” point of an antenna from which the electromagnetic radiation spread outward with equi-phase front: its position is not necessarily equal to the geometric center of the antenna and depends on both the frequency and the angle considered (azimuth and elevation).
The variation of the z-position of the phase center as a function of the frequency has been calculated using both CST Studio Suite and Ansys HFSS and compared with the results obtained using the measured phase data of far-fields with two different methods: a least square (LSE) and a “LSE Amplitude Weighted” (LSE-AM) estimate. In the second case, each phase term in the cost function that minimizes the phase shift for phase center calculation is weighted using the beam pattern amplitude.
The results obtained are summarized in Table 2 and in Figure 23: the difference between simulated and measured data are in very good agreement, being below λmin/10.

5. Conclusions and Future Work

The electromagnetic design, fabrication, and characterization of the single radiation element of the SRT multi-feed S-band receiver have been presented. The feed horn covers the band from 3 to 4.5 GHz and consists of a cylindrical truncated waveguide with a cylindrical choke for side lobe reduction and improvement of the operative bandwidth. The entire project was simulated using CST Studio Suite and Ansys HFSS.
The feed horn is part of a hexagonal layout with a central one optimized to be placed in the primary focus of the SRT. For the electromagnetic characterization, the single feed horn was connected to a dedicated chain composed of two adapters in order to make the electromagnetic characterization more feasible. The feed horn was fully characterized (in one polarization) in the anechoic chamber of the Arcetri Astronomical Observatory, and an estimation of the phase center position was performed.
The measurement results show very good agreement between the simulated and measured data, confirming the good realization of the system.
As a future work, the next step to be carried out for the SRT S-band receiver project will be to assemble all the components inside the Dewar and proceed with the vacuum and cooling operations.

Author Contributions

Conceptualization, T.P., P.M. and G.V.; methodology, T.P., G.V. and A.N.; software, T.P., P.M. (Paolo Maxia), R.N., G.V., R.C., P.M. (Pasqualino Marongiu), F.G, P.O., L.S., P.D.N., L.C. and A.S.; validation, T.P.; formal analysis, T.P., A.N., S.P. and G.V.; investigation, P.M. (Paolo Maxia); resources, T.P.; data curation, P.M. (Paolo Maxia) and G.V.; writing—original draft preparation, L.S. and P.M. (Paolo Maxia); writing—review and editing, L.S., P.M. (Paolo Maxia) and G.V.; visualization, P.M. (Pasqualino Marongiu), A.L., R.C. and F.G.; supervision, T.P.; project administration, T.P.; funding acquisition, T.P. All authors have read and agreed to the published version of the manuscript.

Funding

This research received no external funding.

Data Availability Statement

We cannot share the data online because we haven’t a specific archive where to store, but we can make this material available upon request to interested researchers.

Conflicts of Interest

The authors declare no conflicts of interest.

Abbreviations

The following abbreviations are used in this manuscript:
SRTSardinia Radio Telescope
BWGBeam Waveguide
U.M.Under Maintenance
U.C.Under Construction
U.D.Under Development
DUTDevice Under Test

References

  1. Burke, B.F. An Introduction to Radio Astronomy, 4th ed.; Cambridge University Press: Cambridge, UK, 2001; pp. 3–15. [Google Scholar]
  2. Wilson, T.L.; Rohlfs, K.; Huttemeister, S. Tools of Radio Astronomy, 5th ed.; Springer-Verlag: Berlin, Heidelberg, 2009. [Google Scholar]
  3. 521-984-IEEE Standard Letter Designations for Radar-Frequency Bands. Available online: https://ieeexplore.ieee.org/document/29086 (accessed on 20 February 2025).
  4. Liu, J.; Yan, Z.; Shen, Z.-Q.; Huang, Z.-P.; Zhao, R.-S.; Wu, Y.-J.; Yuan, J.-P.; Wu, X.-J. New Timing Measurement Results of 16 Pulsars. Publ. Astron. Soc. Jpn. 2020, 72, 96. [Google Scholar] [CrossRef]
  5. Wang, P.F.; Han, J.L.; Zhang, J.H.; Li, J.Q.; Wang, C.; Han, J.; Wang, T.; Gao, X.Y. Jiamusi pulsar observations. II. Scintillations of ten pulsars. Astron. Astrophys. 2018, 618, A186. [Google Scholar] [CrossRef]
  6. Schonfeld, S.J.; White, S.M.; Henney, C.J.; Arge, C.N.; McAteer, R.T.J. Coronal Sources of the Solar F10.7 Radio Flux. Astrophys. J. 2015, 808, 29. [Google Scholar] [CrossRef]
  7. Solar Observing. National Radio Astronomy Observatory. Available online: https://science.nrao.edu/facilities/vla/docs/manuals/oss/performance/solar-observing (accessed on 20 February 2025).
  8. Carretti, E.; Haverkorn, M.; Staveley-Smith, L.; Bernardi, G.; Gaensler, B.M.; Kesteven, M.J.; Poppi, S.; Brown, S.; Crocker, R.M.; Purcell, C.; et al. S-band Polarization All-Sky Survey (S-PASS): Survey Description and Maps. Mon. Not. R. Astron. Soc. 2019, 486, 1097–1110. Available online: https://academic.oup.com/mnras/article/489/2/2330/5561417 (accessed on 20 February 2025).
  9. Prayag, V.; Beeharry, G.K.; Vydelingum, N.; Inggs, M. RFI in Mauritius. In Proceedings of the 2016 Radio Frequency Interference (RFI), Socorro, NM, USA, 17–20 October 2016. [Google Scholar] [CrossRef]
  10. Sitompul, P.P.; Manik, T.; Batubara, M.; Suhandi, B. Radio Frequency Interference Measurements for a Radio Astronomy Observatory Site in Indonesia. Aerospace 2021, 8, 51. [Google Scholar] [CrossRef]
  11. Peng, B.; Sun, J.M.; Zhang, H.I.; Piao, T.Y.; Li, J.Q.; Lei, L.; Luo, T.; Li, D.H.; Zheng, Y.J.; Nan, R. RFI test observations at a candidate SKA site in China. Exp. Astron. 2004, 17, 423–430. [Google Scholar] [CrossRef]
  12. Ford, J.M.; Buch, K.D. RFI mitigation techniques in radio astronomy. In Proceedings of the 2014 IEEE Geoscience and Remote Sensing Symposium, Quebec City, QC, Canada, 13–18 July 2014. [Google Scholar] [CrossRef]
  13. Khan, I.; Raut, A.; Sureshkumar, S. Design of Switchable Hairpin Band Pass Filters for Low Frequency Radio Astronomy 2019. In Proceedings of the IEEE MTT-S International Microwave and RF Conference (IMARC), Mumbai, India, 13–15 December 2019. [Google Scholar] [CrossRef]
  14. Fridman, P.A.; Baan, W.A. RFI mitigation methods in radio astronomy. Astron. Astrophys. 2001, 1, 327–344. [Google Scholar] [CrossRef]
  15. Cohen, J.; Spoelstra, T.; Amborsini, R.; van Driel, W. CRAF Handbook for Radio Astronomy, 3rd ed.; European Science Foundation: Strasbourg, France, 2005; pp. 141–145. [Google Scholar]
  16. Barnes, D.G.; Briggs, F.H.; Calabretta, M.R. Post-correlation ripple removal and radio frequency interference rejection for Parkes Telescope survey data. Radio Sci. 2005, 40, RS5S13. [Google Scholar] [CrossRef]
  17. Arecibo Observatory. Available online: https://arecibo.space.swri.edu/ (accessed on 20 February 2025).
  18. Venditti, F.C.F.; Marshall, S.E.; Devogele, M.; Zambrano-Marin, L.F.; McGilvray, A. The Arecibo Observatory′s legacy and future radar capabilities. Acta Astronaut. 2023, 210, 610–615. [Google Scholar] [CrossRef]
  19. Green Bank Observatory website. GBT Receivers & Frequency Ranges. Available online: https://greenbankobservatory.org/portal/gbt/instruments/ (accessed on 20 February 2025).
  20. Prestage, R.M.; Constantikes, K.T.; Hunter, T.R.; King, L.J.; Lacasse, R.J.; Lockman, F.J.; Norrod, R.D. The Green Bank Telescope. Proc. IEEE 2009, 97, 1382–1390. [Google Scholar] [CrossRef]
  21. Lynch, R.; White, S.; Simone, B.; Ransom, S.; Marganian, P.; Egan, D.; Creager, R.; Sizemore, D.; Jensen, L.; Symmes, A. The Green Bank Telescope 0.7-4 GHz Ultra-wideband Receiver. Bull. Am. Astron. Soc. 2023, 55, 2. [Google Scholar]
  22. Australia Telescope National Facility—Welcome to the CSIRO Parkes Observatory. Available online: https://www.parkes.atnf.csiro.au/ (accessed on 20 February 2025).
  23. Hobbs, G.; Manchester, R.N.; Dunning, A.; Jameson, A.; Roberts, P.; George, D.; Green, J.A.; Tuthill, J.; Toomey, L.; Kaczmarek, J.F.; et al. An ultra-wide bandwidth (704 to 4032 MHz) receiver for the Parkes radio telescope. Publ. Astron. Soc. Aust. 2020, 37, e012. [Google Scholar] [CrossRef]
  24. Max Planck Institute for Radio Astronomy—Radio Telescope Effelsberg. Available online: https://www.mpifr-bonn.mpg.de/en/effelsberg (accessed on 13 March 2025).
  25. Effelsberg 9 cm (3.2 GHz, Primary Focus) Receiver. Available online: https://www3.mpifr-bonn.mpg.de/div/electronic/content/receivers/9cm.html (accessed on 13 March 2025).
  26. SRT–Sardinia Radio Telescope. Available online: https://srt-documentation.readthedocs.io/en/latest/index.html (accessed on 20 February 2025).
  27. OAC–Astronomical Observatory of Cagliari. Available online: https://www.oa-cagliari.inaf.it/index.php?set_language=1 (accessed on 20 February 2025).
  28. Science with SRT–Sardinia Radio Telescope. Available online: https://srt-documentation.readthedocs.io/en/latest/antenna.html#user-guide-and-observing-modes (accessed on 20 February 2025).
  29. Bartkiewicz, A.; Sanna, A.; Szymczak, M.; Moscadelli, L.; van Langevelde, H.J.; Wolak, P.; Kobak, A.; Durjasz, M. Proper motion study of the 6.7 GHz methanol maser rings. I. A sample of sources with little variation. Astron. Astrophys. 2024, 686, A275. [Google Scholar] [CrossRef]
  30. Perrodin, D.; Burgay, M.; Corongiu, A.; Pilia, M.; Possenti, A.; Iacolina, M.N.; Egron, E.; Ridolfi, A.; Tiburzi, C.; Casu, S.; et al. Pulsar science at the Sardinia radio telescope. In Proceedings of the International Astronomical Union, Macclesfield, UK, 4–8 September 2017. [Google Scholar]
  31. Egron, E.; Pellizzoni, A.; Giroletti, M.; Righini, S.; Stagni, M.; Orlati, A.; Migoni, C. Single-dish and VLBI observations of CygnusX-3 during the 2016 giant flare episode. Mon. Not. Roy. Astron. Soc. 2017, 471, 2703–2714. [Google Scholar] [CrossRef]
  32. Pilia, M.; Burgay, M.A.; Possenti, A.N.; Ridolfi, A.L.; Gajjar, V.; Corongiu, A.L.; Perrodin, D.E.; Bernardi, G.I.; Naldi, G.; Pupillo, G.; et al. The lowest-frequency fast radio bursts: Sardinia radio telescope detection of the periodic FRB 180,916 at 328 MHz. Astrophys. J. 2020, 896, L40. [Google Scholar] [CrossRef]
  33. Njeri, A.; Beswick, R.J.; Radcliffe, J.F.; Thomson, A.P.; Wrigley, N.; Muxlow, T.W.B.; Garrett, M.A.; Deane, R.P.; Moldon, J.; Norris, R.P.; et al. SPARCS-North Wide-field VLBI Survey: Exploring the resolved μJy extragalactic radio source population with EVN + e-MERLIN. Mon. Not. R. Astron. Soc. 2023, 519, 1732–1744. [Google Scholar] [CrossRef]
  34. European VLBI Network. Capabilities—Frequency Coverage and Real-Time (e-EVN) Capabilities. Available online: https://www.evlbi.org/capabilities (accessed on 20 February 2025).
  35. Schirru, L.; Pisanu, T.; Podda, A. The Ad Hoc Back-End of the BIRALET Radar to Measure Slant-Range and Doppler Shift of Resident Space Objects. Electronics 2021, 10, 577. [Google Scholar] [CrossRef]
  36. Italian Space Agency–ASI. Available online: https://www.asi.it/ (accessed on 20 February 2025).
  37. Valente, G.; Pelorossi, F.; Serra, G.; Urru, E.; Saba, A.; Iacolina, M.N. The Optical Design of the Sardinia Deep Space Antenna for Telemetry, Tracking, and Command. IEEE Access 2024, 12, 141653–141670. [Google Scholar] [CrossRef]
  38. Navarrini, A.; Valente, G.; Marongiu, P.; Ladu, A.; Gaudiomonte, F. Optical design of S-band multifeed for the Sardinia Radio Telescope primary focus. In Proceedings of the 2017 IEEE MTT-S International Conference on Numerical Electromagnetic and Multiphysics Modeling and Optimization for RF, Microwave, and Terahertz Applications (NEMO), Seville, Spain, 17–19 May 2017. [Google Scholar] [CrossRef]
  39. Pisanu, T.; Valente, G.; Marongiu, P.; Maxia, P.; Ortu, P.; Navarrini, A. Status of the multibeam S band receiver for the Sardinia Radio Telescope. In Proceedings of the 2022 3rd URSI Atlantic and Asia Pacific Radio Science Meeting (AT-AP-RASC), Gran Canaria, Spain, 30 May–4 June 2022. [Google Scholar] [CrossRef]
  40. Prandoni, I.; Murgia, M.; Tarchi, A.; Burgay, M.; Castangia, P.; Egron, E.; Govoni, F.; Pellizzoni, A.; Ricci, R.; Righini, S.; et al. The Sardinia Radio Telescope, From a technological project to a radio observatory. Astron. Astrophys. 2017, 608, 26. [Google Scholar] [CrossRef]
  41. Sardinia Radio Telescope Documentation—Welcome to SRT’s Documentation! Available online: https://srt-documentation.readthedocs.io/en/latest/index.html (accessed on 20 February 2025).
  42. Mouroulis, P.; Macdonald, J. Geometrical Optics and Optical Design (Oxford Series on Optical and Imaging Sciences), 1st ed.; Oxford University Press: Oxford, UK, 1997. [Google Scholar]
  43. Bolli, P.; Olmi, L.; Roda, J.; Zacchiroli, G. A novel application of the active surface of the shaped Sardinia radio telescope for primary-focus operations. IEEE Antennas Wirel. Propag. Lett. 2014, 13, 1713–1716. [Google Scholar] [CrossRef]
  44. Orfei, A.; Carbonaro, L.; Cattani, A.; Cremonini, A.; Cresci, L.; Fiocchi, F. A Multi-Feed Receiver in the 18 to 26. 5 GHz Band for Radio Astronomy. IEEE Antennas Propag. Mag. 2010, 52, 62–72. [Google Scholar] [CrossRef]
  45. Peverini, O.A.; Tascone, R.; Virone, G.; Addamo, G.; Olivieri, A.; Orta, R. C-band dual-polarization receiver for the Sardinia Radio-Telescope. In Proceedings of the 2009 International Conference on Electromagnetics in Advanced Applications, Turin, Italy, 14–18 September 2009. [Google Scholar] [CrossRef]
  46. Ladu, A.; Schirru, L.; Gaudiomonte, F.; Marongiu, P.; Angius, G.; Perini, F.; Vargiu, G.P. Upgrading of the L-P Band Cryogenic Receiver of the Sardinia Radio Telescope: A Feasibility Study. Sensors 2022, 22, 4261. [Google Scholar] [CrossRef] [PubMed]
  47. Govoni, F.; Bolli, P.; Buffa, F.; Caito, L.; Carretti, E.; Comoretto, G.; Fierro, D.; Melis, A.; Murgia, M.; Navarrini, A.; et al. The high-frequency upgrade of the Sardinia Radio Telescope. In Proceedings of the 2021 XXXIVth General Assembly and Scientific Symposium of the International Union of Radio Science (URSI GASS), Rome, Italy, 28 August–4 September 2021. [Google Scholar] [CrossRef]
  48. Orfei, A.; Cresci, L.; Nesti, R.; Panella, D.; Roda, J.; Mariotti, S. Il Feed System per il Ricevitore Multibeam nella Banda 33–50 GHz (Q-Band); INAF Technical Reports—Rapporti Tecnici; INAF: Rome, Italy, 2024; Volume 311, Available online: http://hdl.handle.net/20.500.12386/35175 (accessed on 20 February 2025).
  49. Navarrini, A.; Olmi, L.; Nesti, R.; Ortu, P.; Marongiu, P.; Orlati, A. Feasibility Study of a W-Band Multibeam Heterodyne Receiver for the Gregorian Focus of the Sardinia Radio Telescope. IEEE Access 2022, 10, 26369–26403. [Google Scholar] [CrossRef]
  50. Paiella, A.; Cacciotti, F.; Isopi, G.; Barbavara, E.; Battistelli, E.S.; De Bernardis, P.; Capalbo, V.; Carbone, A.; Carretti, E.; Ciccalotti, E.; et al. The MISTRAL Instrument and the Characterization of Its Detector Array. J. Low Temp. Phys. 2024, 217, 436–445. [Google Scholar] [CrossRef]
  51. Bolli, P.; Han, S.-T.; Choi, J.; Orfei, A.; Porceddu, I.; Byun, D.-Y. Tri-band receivers for the INAF radio telescopes: From procurement to acceptance tests. In Proceedings of the 2023 XXXVth General Assembly and Scientific Symposium of the International Union of Radio Science (URSI GASS), Sapporo, Japan, 19–26 August 2023. [Google Scholar] [CrossRef]
  52. Sardinia Radio Telescope Documentation–Receivers. Available online: https://srt-documentation.readthedocs.io/en/latest/antenna.html#receivers (accessed on 20 February 2025).
  53. Valente, G.; Pisanu, T.; Navarrini, A.; Marongiu, P.; Orfei, A.; Mariotti, S.; Nesti, R.; Roda, J.; Cattani, A.; Bolli, P.; et al. The Coaxial L-P Cryogenic Receiver of the Sardinia Radio Telescope. IEEE Access 2022, 10, 2631–2645. [Google Scholar] [CrossRef]
  54. Balanis, C.A. Antenna Theory: Analysis and Design; Wiley: Hoboken, NJ, USA, 2016. [Google Scholar]
  55. Rudge, A.W.; Milne, K.; Olver, A.D.; Knight, P. Microwave Horns and Feeds; IET: London, UK, 1984. [Google Scholar]
  56. Beherens, G.; Campbell, W.; Williams, D.; White, S. Guidelines for the design of cryogenic systems. In National Radio Astronomy Observatory–Technical reports; Electronics Division Internal Report n. 306; National Radio Astronomy Observatory: Green Bank, WV, USA, 1997. [Google Scholar]
  57. Weisend, J.G., II (Ed.) Handbook of Cryogenic Engineering; Taylor & Francis: Philadelphia, PA, USA, 1998. [Google Scholar]
  58. CTI-Cryogenics. Installation, Operation and Servicing Instructions. Model 350C Cryodyne Cryocooler. Available online: http://docs.eao.hawaii.edu/JCMT/a/024_helium_compressors/06/CTI%20350CwithSC_Compressor-1985.pdf (accessed on 20 February 2025).
  59. Valente, G.; Marongiu, P.; Navarrini, A.; Saba, A.; Montisci, G.; Ladu, A.; Pisanu, T.; Pili, M.; Dessi, S.; Uccheddu, A.; et al. The 7-beam S-band cryogenic receiver for the SRT primary focus: Project status. In Proceedings of the SPIE Astronomical Telescopes + Instrumentation–Millimeter, Submillimeter, and Far-Infrared Detectors and Instrumentation for Astronomy VIII, Edinburgh, UK, 26 June–1 July 2016; p. 991422. [Google Scholar] [CrossRef]
  60. TTI–Welcome to TTI Europe. Electronic Component Distribution. Available online: https://www.ttieurope.com/content/ttieurope/en.html (accessed on 20 February 2025).
  61. Narda-Miteq. Available online: https://www.nardamiteq.com/ (accessed on 20 February 2025).
  62. Mini-Circuits. Available online: https://www.minicircuits.com/?srsltid=AfmBOorMSl_wtvlhnSydtZYQwC-u88kjMsxbLcDWLKPDw9L5OEiVBgrW (accessed on 20 February 2025).
  63. R&S®SMB100A Microwave Signal Generator. Available online: https://www.rohde-schwarz.com/it/prodotti/misura-e-collaudo/generatori-di-segnali-analogici/rs-smb100a-microwave-signal-generator_63493-9379.html (accessed on 20 February 2025).
  64. Styrodur. Sicuro. Forte. Available online: https://www.styrodur-italia.it/ (accessed on 20 February 2025).
  65. Professional Plastics–Overview of Kapton HN Polymide Film. Available online: https://www.professionalplastics.com/KAPTONFILMPOLYIMIDE?XLT_TO=en (accessed on 20 February 2025).
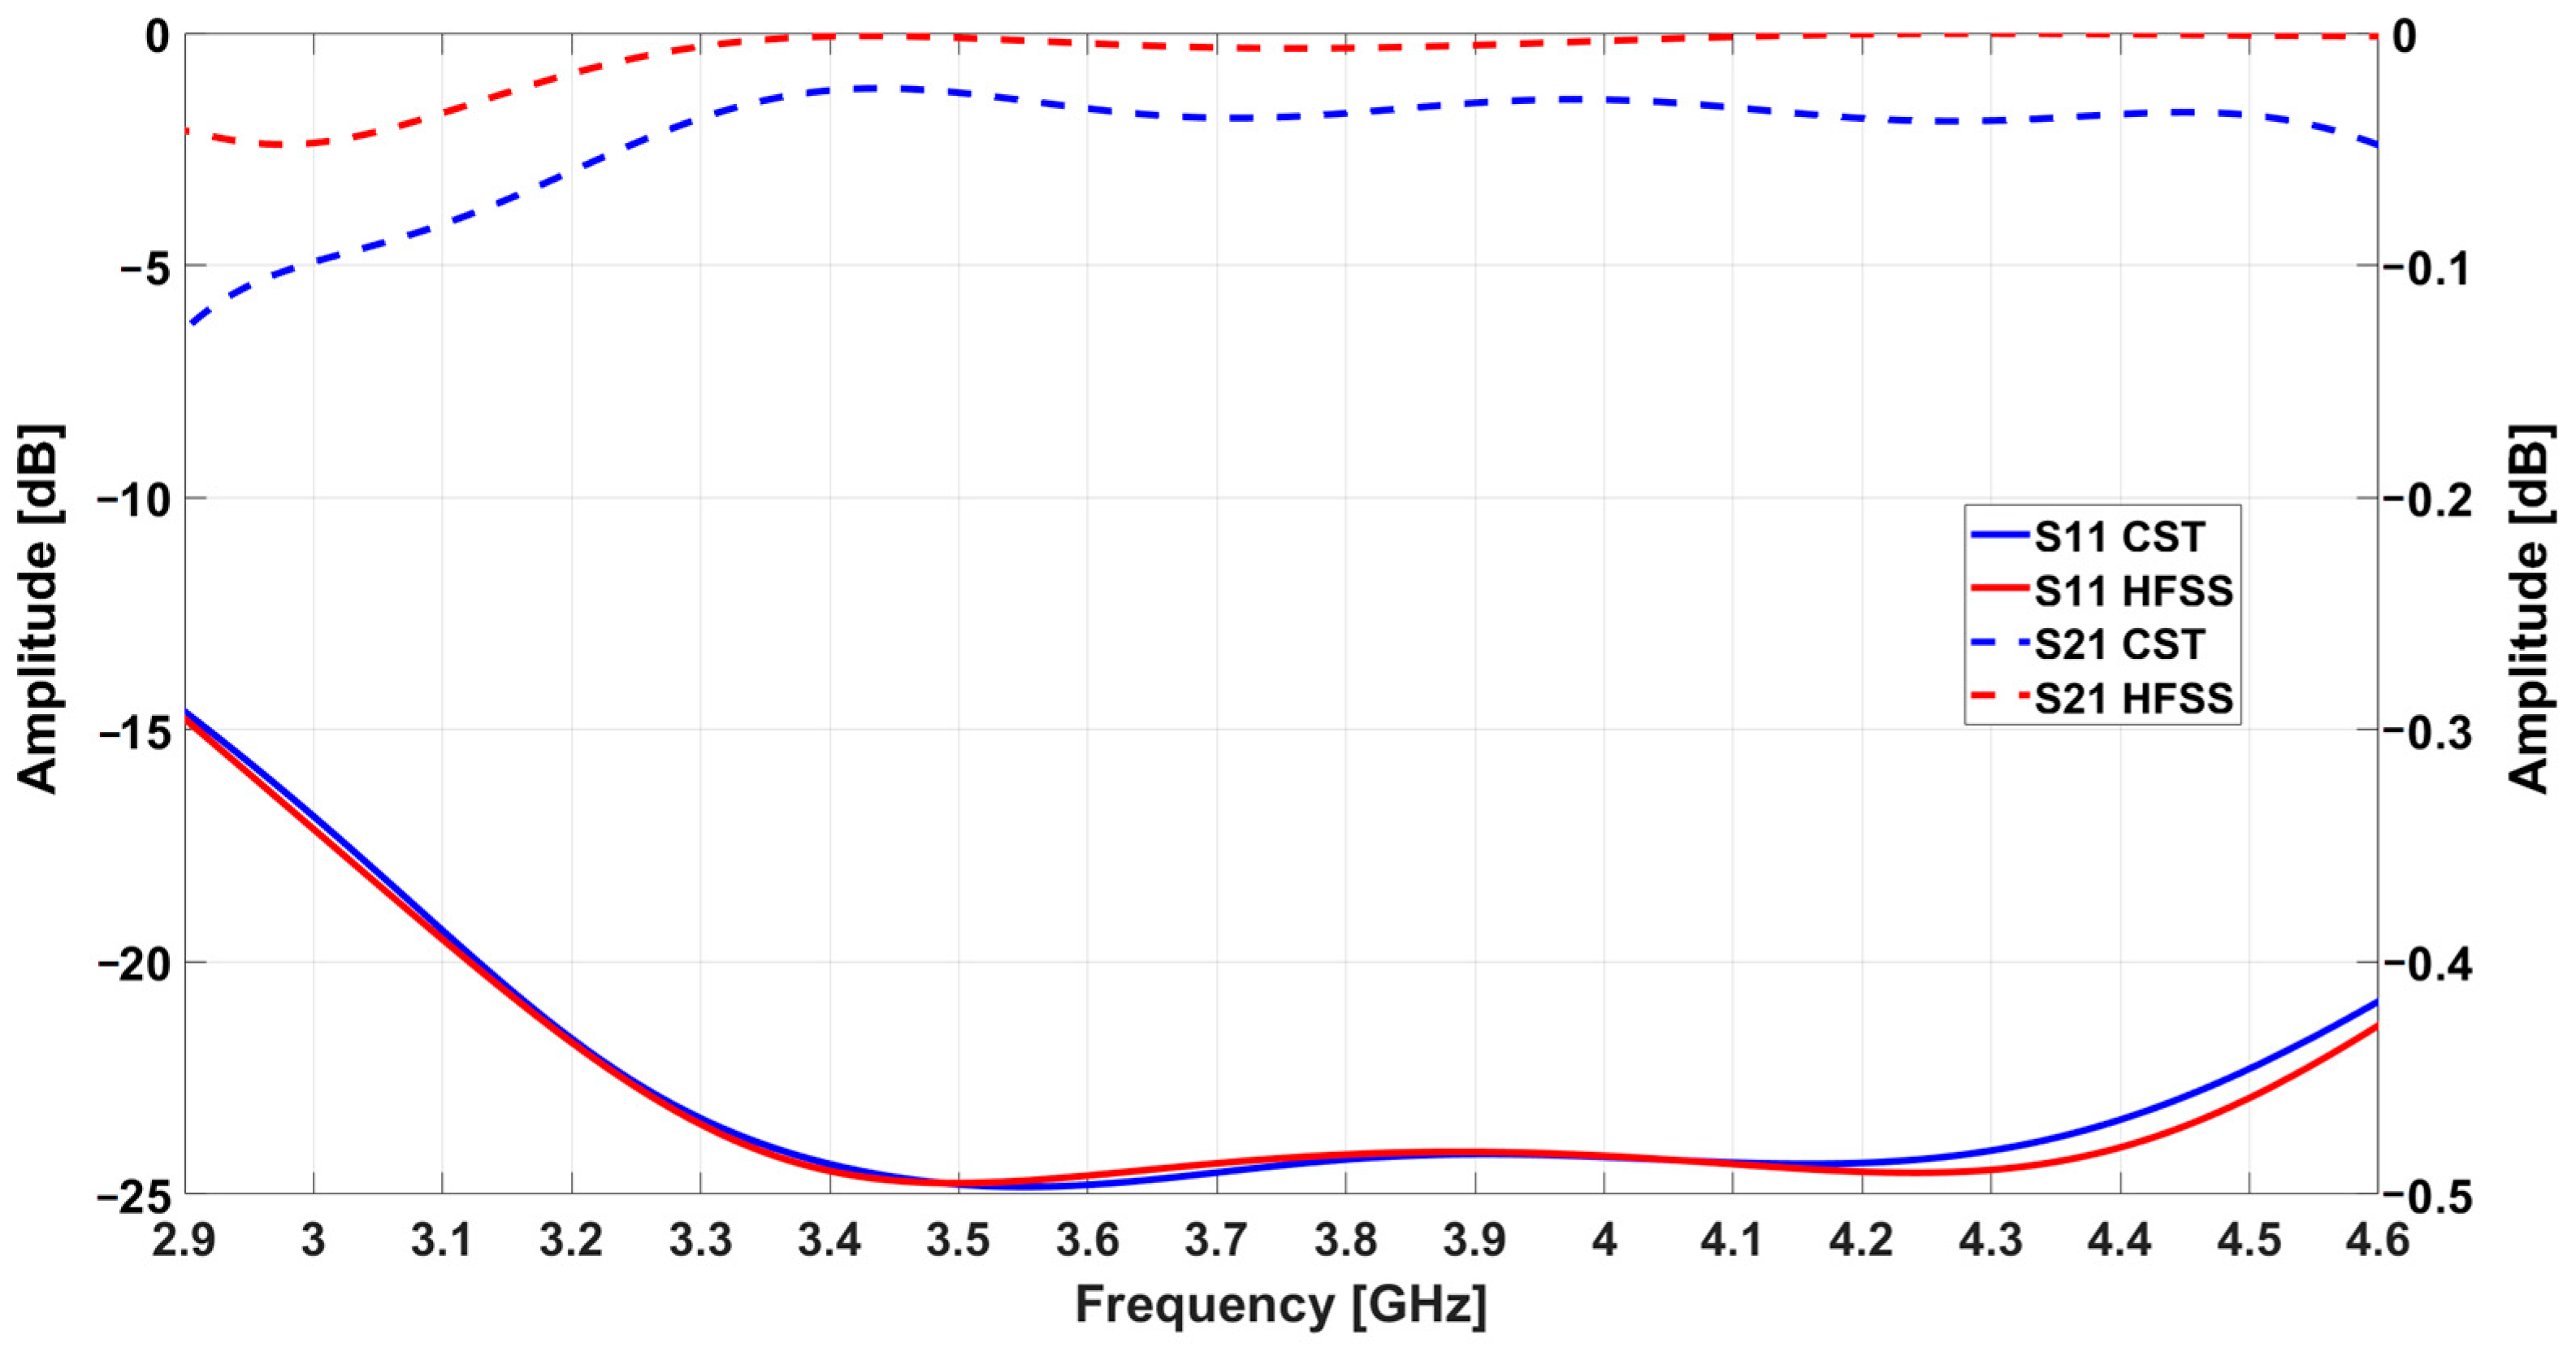
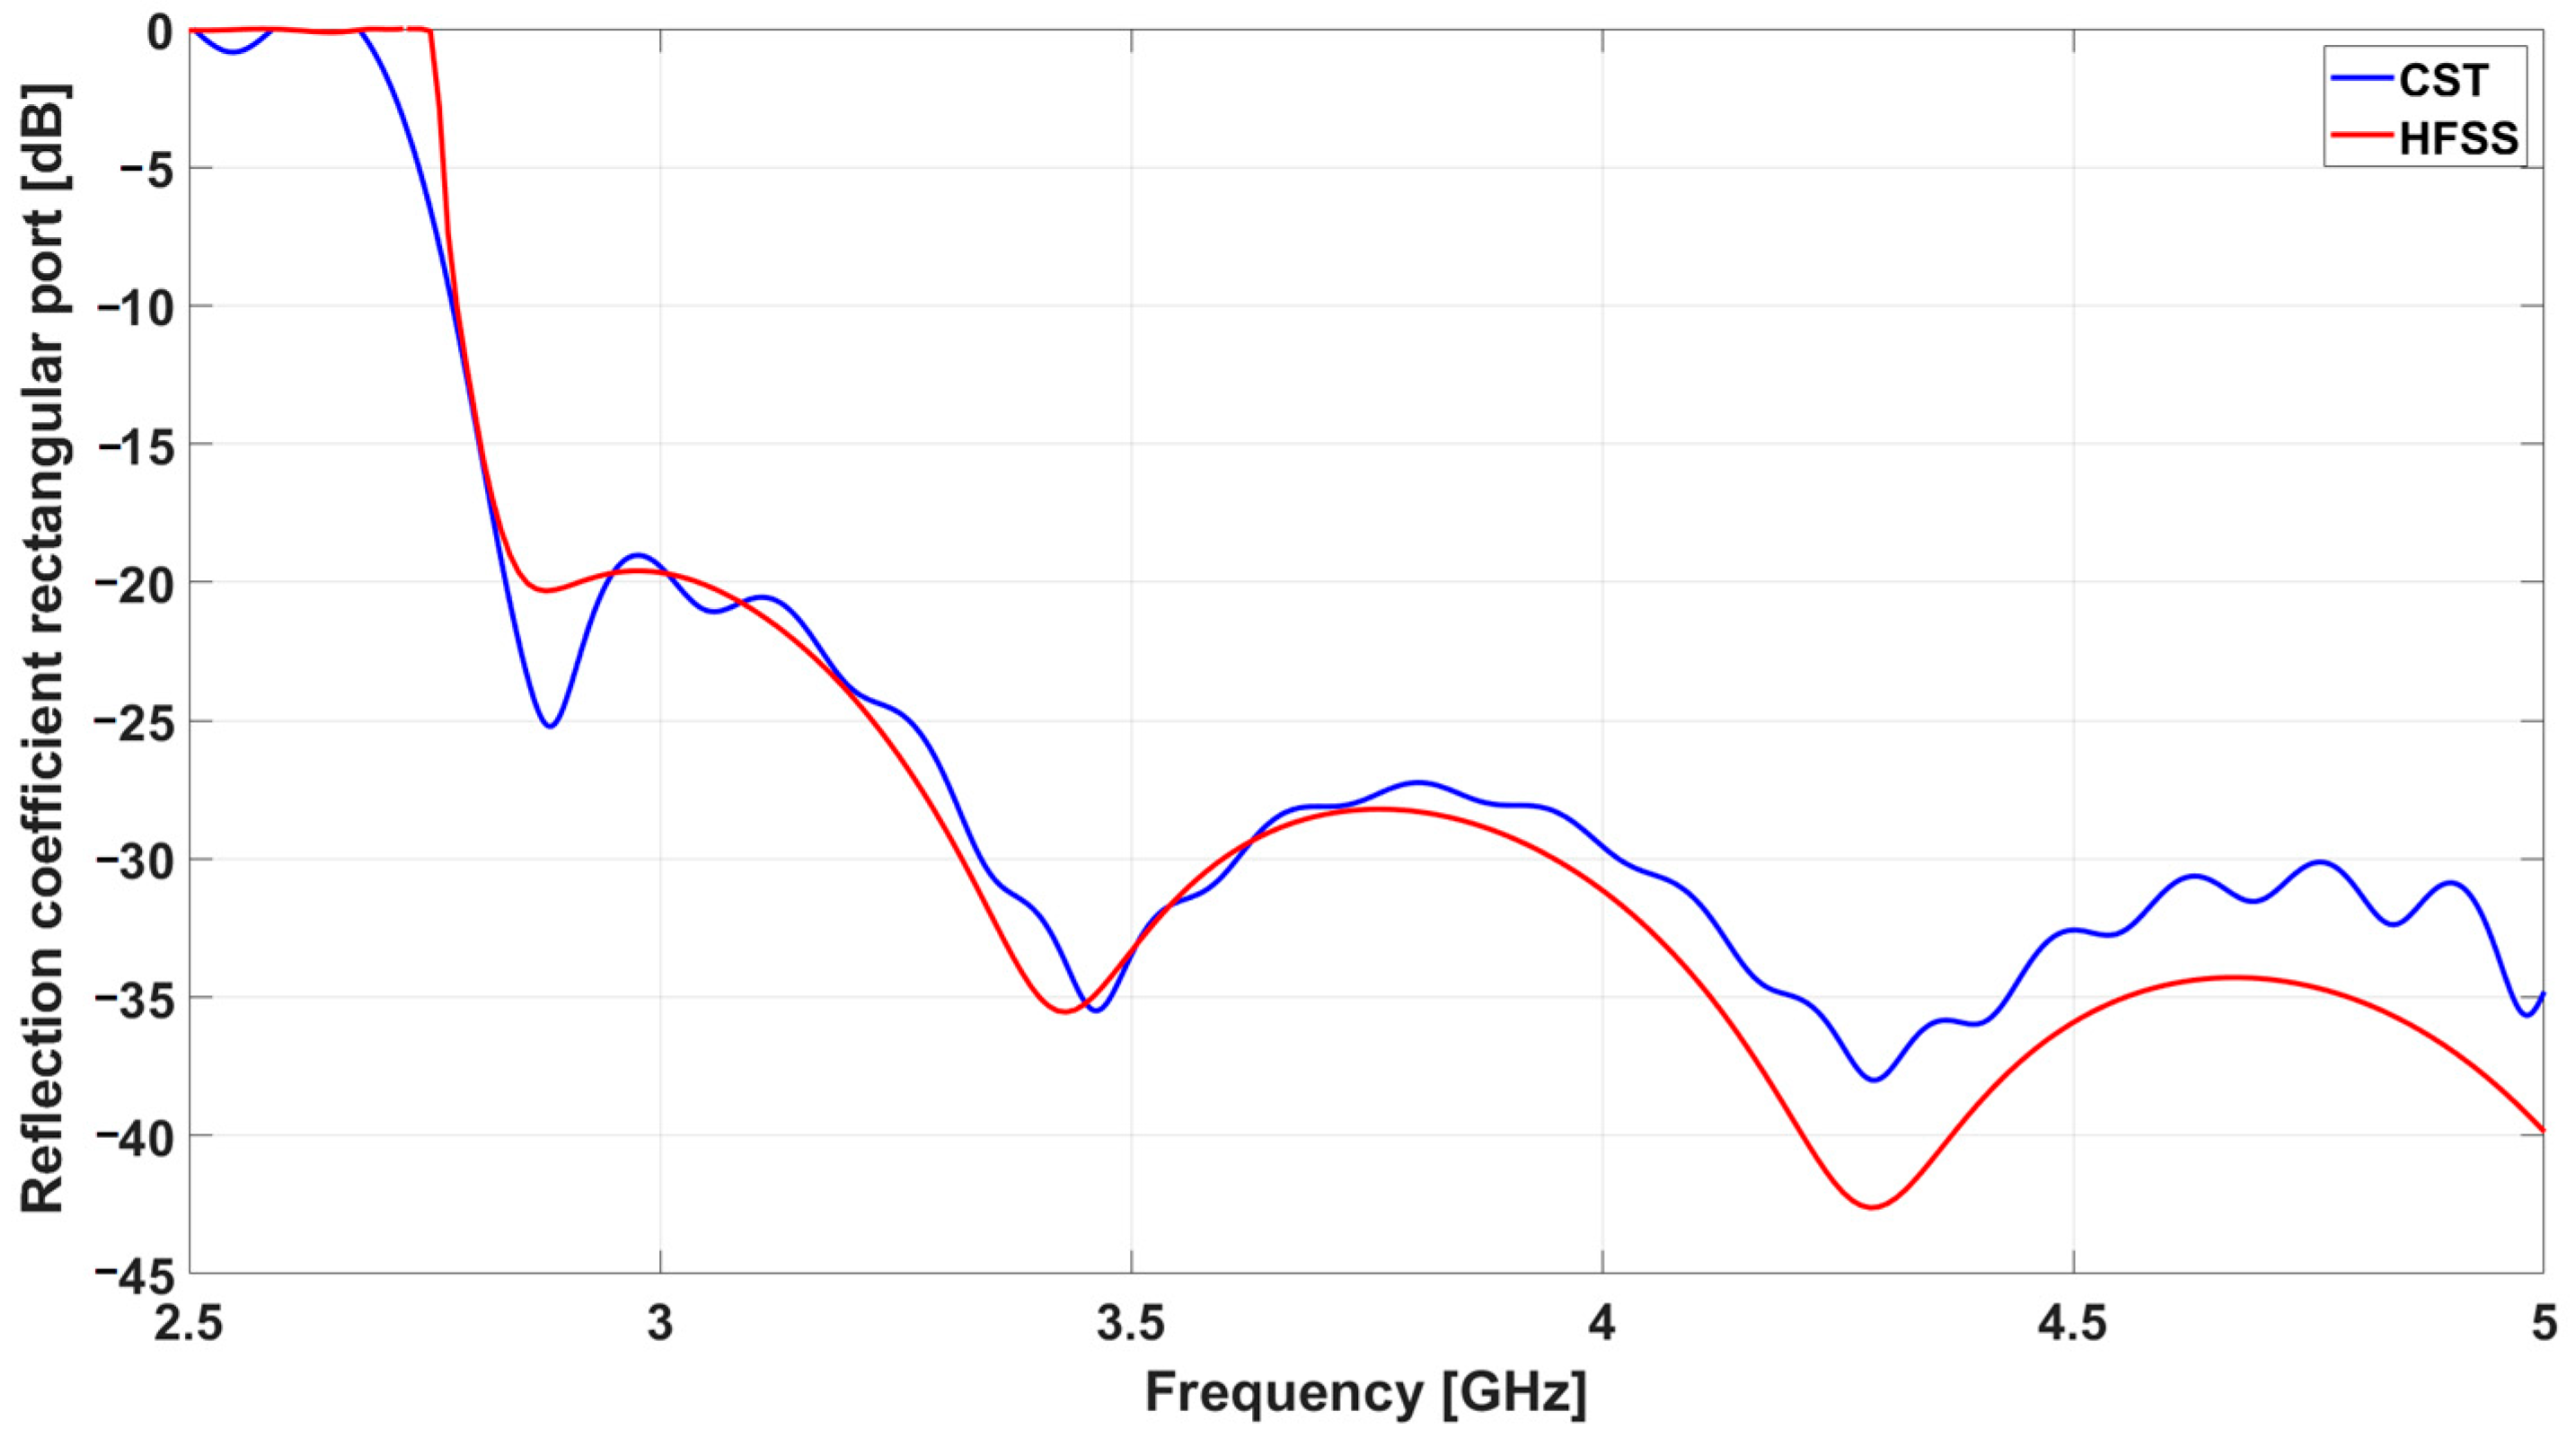
  66. CST Studio Suite. Electromagnetic Field Simulation Software. Available online: https://www.3ds.com/products/simulia/cst-studio-suite (accessed on 20 February 2025).
  67. Ansys HFSS. Best-in-Class 3D High Frequency Structure Simulation Software. Available online: https://www.ansys.com/it-it/products/electronics/ansys-hfss (accessed on 20 February 2025).
  68. Radiall. SMA. Available online: https://www.radiall.com/products/rf-coaxial-connectors/screw-on-connectors/sma.html (accessed on 20 February 2025).
  69. Arcetri Astrophysical Observatory. Available online: https://www.arcetri.inaf.it/en/ (accessed on 20 February 2025).
  70. Anritsu VNA 37277C. Available online: https://dl.cdn-anritsu.com/en-us/test-measurement/files/Manuals/Operation-Manual/10410-00261.pdf (accessed on 20 February 2025).
  71. Fielg Regions. Far Field (Fraunhofer) Region. Available online: https://www.antenna-theory.com/basics/fieldRegions.php (accessed on 20 February 2025).
  72. Rao, K.; Shafai, L. Phase Center Calculations of Reflector Antenna Feeds. IEEE Trans. Antennas Propag. 1984, 32, 740–742. [Google Scholar] [CrossRef]
Figure 1. Optical configuration, with a detail of the four focal positions, and picture of the Sardinia Radio Telescope (SRT), where the primary focus position for the new S-band receiver is highlighted in violet and in red the ray tracing.
Electronics 14 02301 g001
Figure 2. Schematic of one of the seven identical channels of the new cryogenic seven-beam S-band receiver for the Sardinia Radio Telescope. Each channel is further divided into two paths: one for vertical polarization and the other for horizontal polarization.
Electronics 14 02301 g002
Figure 3. On-the-sky positions of the 7 beams (from the central one numbered 0 to 6) of the multi-beam S-band receiver. The circle represents the angular beam dimension and the position their angular distance on the Sky.
Electronics 14 02301 g003
Figure 4. (a) First configuration of the S-Band multi-feed receiver; (b) Modified configuration of the S-Band multi-feed receiver. In green are visible the vacuum window Styrodur® cylinders.
Electronics 14 02301 g004
Figure 5. Sketched cross-section of the S-Band feed horn. The 40 mm cylinder in blue represents the Styrodur® material inside the circular waveguide, and the Kapton® film is in brown.
Electronics 14 02301 g005
Figure 6. Three-dimensional image of the CST model for the waveguide-to-coaxial cable adapter: (a) the external section view; (b) the internal section view. In blue is visible a section of the dielectric of the coaxial transition.
Electronics 14 02301 g006
Figure 7. Comparison of the simulated reflection coefficient and insertion loss at the coaxial port, of the waveguide-to-coaxial cable adapter, obtained with the two electromagnetic simulators CST Studio Suite and Ansys HFSS.
Electronics 14 02301 g007
Figure 8. Three-dimensional image of the CST model and cross-section of the circular-to-rectangular waveguide adapter.
Electronics 14 02301 g008
Figure 9. Rectangular-to-circular adapter: reflection coefficient, at the input of the rectangular section, obtained with the two electromagnetic simulators CST Studio Suite and Ansys HFSS.
Electronics 14 02301 g009
Figure 10. Rectangular-to-circular adapter: reflection coefficient and insertion loss at the input of the circular section, obtained with the two electromagnetic simulators CST Studio Suite and Ansys HFSS.
Electronics 14 02301 g010
Figure 11. Three-dimensional image of the CST model for the modified front-end, where (a) represents the circular feed horn, (b) is the rectangular-to-circular adapter, and (c) is the waveguide-to-coaxial cable adapter.
Electronics 14 02301 g011
Figure 12. Photo of the fabricated S-band single feed horn.
Electronics 14 02301 g012
Figure 13. Anechoic chamber of Arcetri Astronomical Observatory.
Electronics 14 02301 g013
Figure 14. Anechoic chamber: (a) schematic of the near-field measurement setup; (b) schematic of the far-field measurement setup. In blue are represented the cones of the absorbing material in the chamber walls.
Electronics 14 02301 g014
Figure 15. Probes for near- and far-field measurements: (a) WR284 truncated waveguide, (b) double-ridge wideband horn.
Electronics 14 02301 g015
Figure 16. 3 GHz near-field co-polar (sx) and cross-polar (dx) maps; D = 80 mm.
Electronics 14 02301 g016
Figure 17. 3.75 GHz near-field co-polar (sx) and cross-polar (dx) maps; D = 80 mm.
Electronics 14 02301 g017
Figure 18. 4.5 GHz near-field co-polar (sx) and cross-polar (dx) maps; D = 80 mm.
Electronics 14 02301 g018
Figure 19. Comparison of the S-Band front-end reflection coefficient measured and simulated with the two electromagnetic simulators CST Studio Suite and Ansys HFSS.
Electronics 14 02301 g019
Figure 20. 3.0 GHz normalized far-field. The gray dashed lines represent the angular aperture of the primary beam as seen from the primary focus.
Electronics 14 02301 g020
Figure 21. 3.75 GHz normalized far-field. The gray dashed lines represent the angular aperture of the primary beam as seen from the primary focus.
Electronics 14 02301 g021
Figure 22. 4.5 GHz normalized far-field. The gray dashed lines represent the angular aperture of the primary beam as seen from the primary focus.
Electronics 14 02301 g022
Figure 23. Comparison between the calculated and measured Z-coordinate of the position of phase center. The value Z = 0 corresponds to the feed horn aperture and negatives Z are inside the feed horn.
Electronics 14 02301 g023
Table 1. Operational frequencies of the four focal positions and the corresponding focal length-to-diameter ratio (f/D) [28].
f/D
Ratio
Maximum FrequencyMinimum FrequencyFocus
0.3320 GHz300 MHzPrimary Focus F1
2.34116 GHz7.5 GHzGregorian Focus F2
1.3835 GHz1.4 GHzBWG I, F3
2.8135 GHz1.4 GHzBWG II, F4
Table 2. Z coordinate (in millimeters) of the position of phase center. The value Z = 0 corresponds to the feed horn aperture, and negatives Z are inside the feed horn.
Frequency [GHz]Z-Position [mm] (HFSS)Z-Position [mm]
(CST)
Z-Position [mm]
(LSE)
Z-Position [mm]
(LSE-AM)
32.301.06−0.030.03
3.375−1.10−1.58−3.90−5.30
3.750.251.20−0.500.15
4.1252.21.16−1.27−0.84
4.5−0.49−0.550.260.6
Disclaimer/Publisher’s Note: The statements, opinions and data contained in all publications are solely those of the individual author(s) and contributor(s) and not of MDPI and/or the editor(s). MDPI and/or the editor(s) disclaim responsibility for any injury to people or property resulting from any ideas, methods, instructions or products referred to in the content.

