4.2.1. Evaluation Indicators
- (1)
AP
Given a total of n, let
denote the recall rate when detecting k samples, and
represents the maximum precision rate where the recall rate is greater than or equal to
. The average precision (AP) is defined as follows:
- (2)
Recall
In the formula, FN represents the total number of false negatives, and TP denotes the number of true positives.
- (3)
Precise
Precision represents the proportion of true positive samples detected by the algorithm relative to the total number of detected positive samples, defined as follows:
where TP denotes true positives, and FP denotes false positives.
- (4)
mAP
The mean average precision (mAP) is defined as the average of the average precision (AP) across all categories, formulated as follows:
where N denotes the total number of categories, and
represents the average precision for the
i-th category.
- (5)
F1
To validate the model’s robustness, this study utilizes the F1-score, which is the harmonic mean of precision and recall, formulated as follows:
- (6)
FPS
Frames per second (FPS) measures the processing speed of an object detection algorithm and reflects the model’s real-time performance. It is defined as the number of image frames processed by the model within a unit time (1 s). The calculation formula is as follows:
In the formula, denotes the total number of image frames processed by the model within time t (in seconds), and t represents the total processing time. Generally, a higher FPS value indicates faster image processing speed, offering significant advantages in real-time detection scenarios (e.g., real-time product detection in intelligent retail environments) by enabling more timely feedback of detection results.
- (7)
Detection Time
Detection time is used to measure the total time consumption of an object detection algorithm when processing large-scale image datasets, reflecting the algorithm’s efficiency in large-scale data processing scenarios. Since this study conducted experimental testing on 20,000 images, the detection time here refers to the total time required to process all 20,000 images. The calculation formula is as follows:
In the formula, denotes the time required to process the image (unit: seconds). A shorter total detection time () indicates that the algorithm consumes less time and achieves higher efficiency when processing the 20,000-image task. In practical applications such as batch product detection in large-scale intelligent retail scenarios, a reduced enables rapid completion of large-scale product inspections, thereby accelerating operational throughput, minimizing temporal costs, and enhancing the system’s practicality and competitiveness.
4.2.2. Comparative Experiments on Base Models
This study addresses a specific engineering problem requiring models with both high precision and high efficiency. After comprehensive evaluation, YOLOv11 was selected as the base model based on a thorough comparative analysis with traditional state-of-the-art (SOTA) models, focusing on accuracy and real-time performance. To validate model performance, comparative experiments against conventional models were conducted on the public COCO2017 dataset and our custom dataset, with results presented in
Table 2.
The COCO dataset, released by Microsoft, is a large-scale public benchmark extensively adopted for object detection, instance segmentation, and keypoint localization tasks. As shown in
Figure 12, comprising 123,287 images (118,287 for training and 5000 for validation), it provides JSON-format annotations downloadable from the official source. These annotations were converted to YOLO-standard format (xywh representation) using a json2txt.py script, facilitating public dataset benchmarking. To optimize training efficiency, a subset of 12,719 images covering all validation set categories was selected. Experiments were conducted on an A6000 GPU-equipped cloud server, The proposed method was implemented and evaluated on an A6000 GPU-equipped cloud server (49 GB MiB) deployed in Jingzhou District, Jingzhou City, Hubei Province, China (No. 1 Nanhuan Road, East Campus Main Building, Yangtze University). The software environment consisted of Ubuntu 22.04, PyTorch 2.3.0, and CUDA 12.1. The proposed method was implemented on an A6000 GPU-equipped cloud server with a batch size of 64, while maintaining all other hyperparameters at their default values. Results demonstrate YOLOv11n’s superior performance across multiple metrics, particularly in parameter efficiency, aligning well with industrial requirements.
As shown in
Table 2, performance comparisons on COCO2017 reveal distinct characteristics: transformer-based DETR and deformable DETR achieve notable accuracy (deformable DETR: mAP50-95 = 0.230; DETR: 0.212), indicating robust detection across IoU thresholds. However, both exhibit limited inference speeds (15 FPS and 30 FPS, respectively).
Conversely, YOLO-series models demonstrate exceptional real-time performance: YOLOv5n (280 FPS), YOLOv8n (310 FPS), YOLOv10n (350 FPS), and YOLOv11n (380 FPS) satisfy real-time detection requirements. Traditional models show moderate performance: RetinaNet (single-stage: 48.64G FLOPS, 0.128 mAP50-95, and 18 FPS) and faster R-CNN (two-stage: 88.32G FLOPS, 0.129 mAP50-95, and 20 FPS). CenterNet balances accuracy (0.130 mAP50-95) and speed (50 FPS) with low computational cost (15.32G FLOPS) and short training time (1.52 h). The emerging RT-DETR achieves dual optimization (0.233 mAP50-95, 80 FPS, and 52.63G FLOPS), demonstrating significant potential.
In summary, models exhibit trade-offs across accuracy, speed, and computational cost (FLOPS): transformer-based models lead in accuracy but lack real-time capability; YOLO variants excel in inference speed; others achieve different balances. Selection should prioritize YOLO-series for latency-sensitive applications (e.g., video surveillance) and transformer-based models for high-precision research scenarios.
Subsequent comparative performance analysis of various baseline models on our custom dataset reveals detailed results presented in
Table 3.
As shown in
Table 3, the experimental results collectively demonstrate that YOLOv12 does not achieve optimal performance on all metrics. Given the engineering constraints requiring both high precision and efficiency, a multi-criteria evaluation framework was essential. Although YOLOv12 incorporates local attention mechanisms that moderately improve accuracy, the enhancement remains marginal. Crucially, its training demands high-end GPUs (e.g., A100/A6000), a requirement unfeasible under our experimental conditions. While YOLOv5 was formerly a SOTA model widely adopted in object detection research, it exhibits suboptimal performance on mAP50-95 and inadequate inference speed. After comprehensive consideration of these factors, YOLOv11 was ultimately selected as the foundational model.
4.2.7. Ablation Studies and Comparative Experiments of Independent Module
- 1.
Comparative Experiment on Attention Mechanisms
To rigorously validate the effectiveness of the proposed modules, comparative experiments with multiple attention mechanisms were conducted on the baseline model. The deep learning environment was configured identically to the original setup, with the only distinction being the epoch setting adjusted to 100, while all other hyperparameters (e.g., learning rate, batch size, and optimizer) remained consistent.
As shown in
Table 5, after integrating different attention mechanisms into the YOLOv11 model, all performance metrics exhibit an improving trend. Metrics such as mAP50, mAP50-95, and recall demonstrate varying degrees of enhancement. Although the improvement is not particularly substantial, this strongly validates the correctness of incorporating attention mechanism modules into the model. In future work, expanding the training dataset to include more product images from diverse retail scenarios could enable the retail cabinet product recognition system to adapt to complex conditions such as varying lighting, angles, and occlusions, thereby driving further advancements in intelligent retail performance.
- 2.
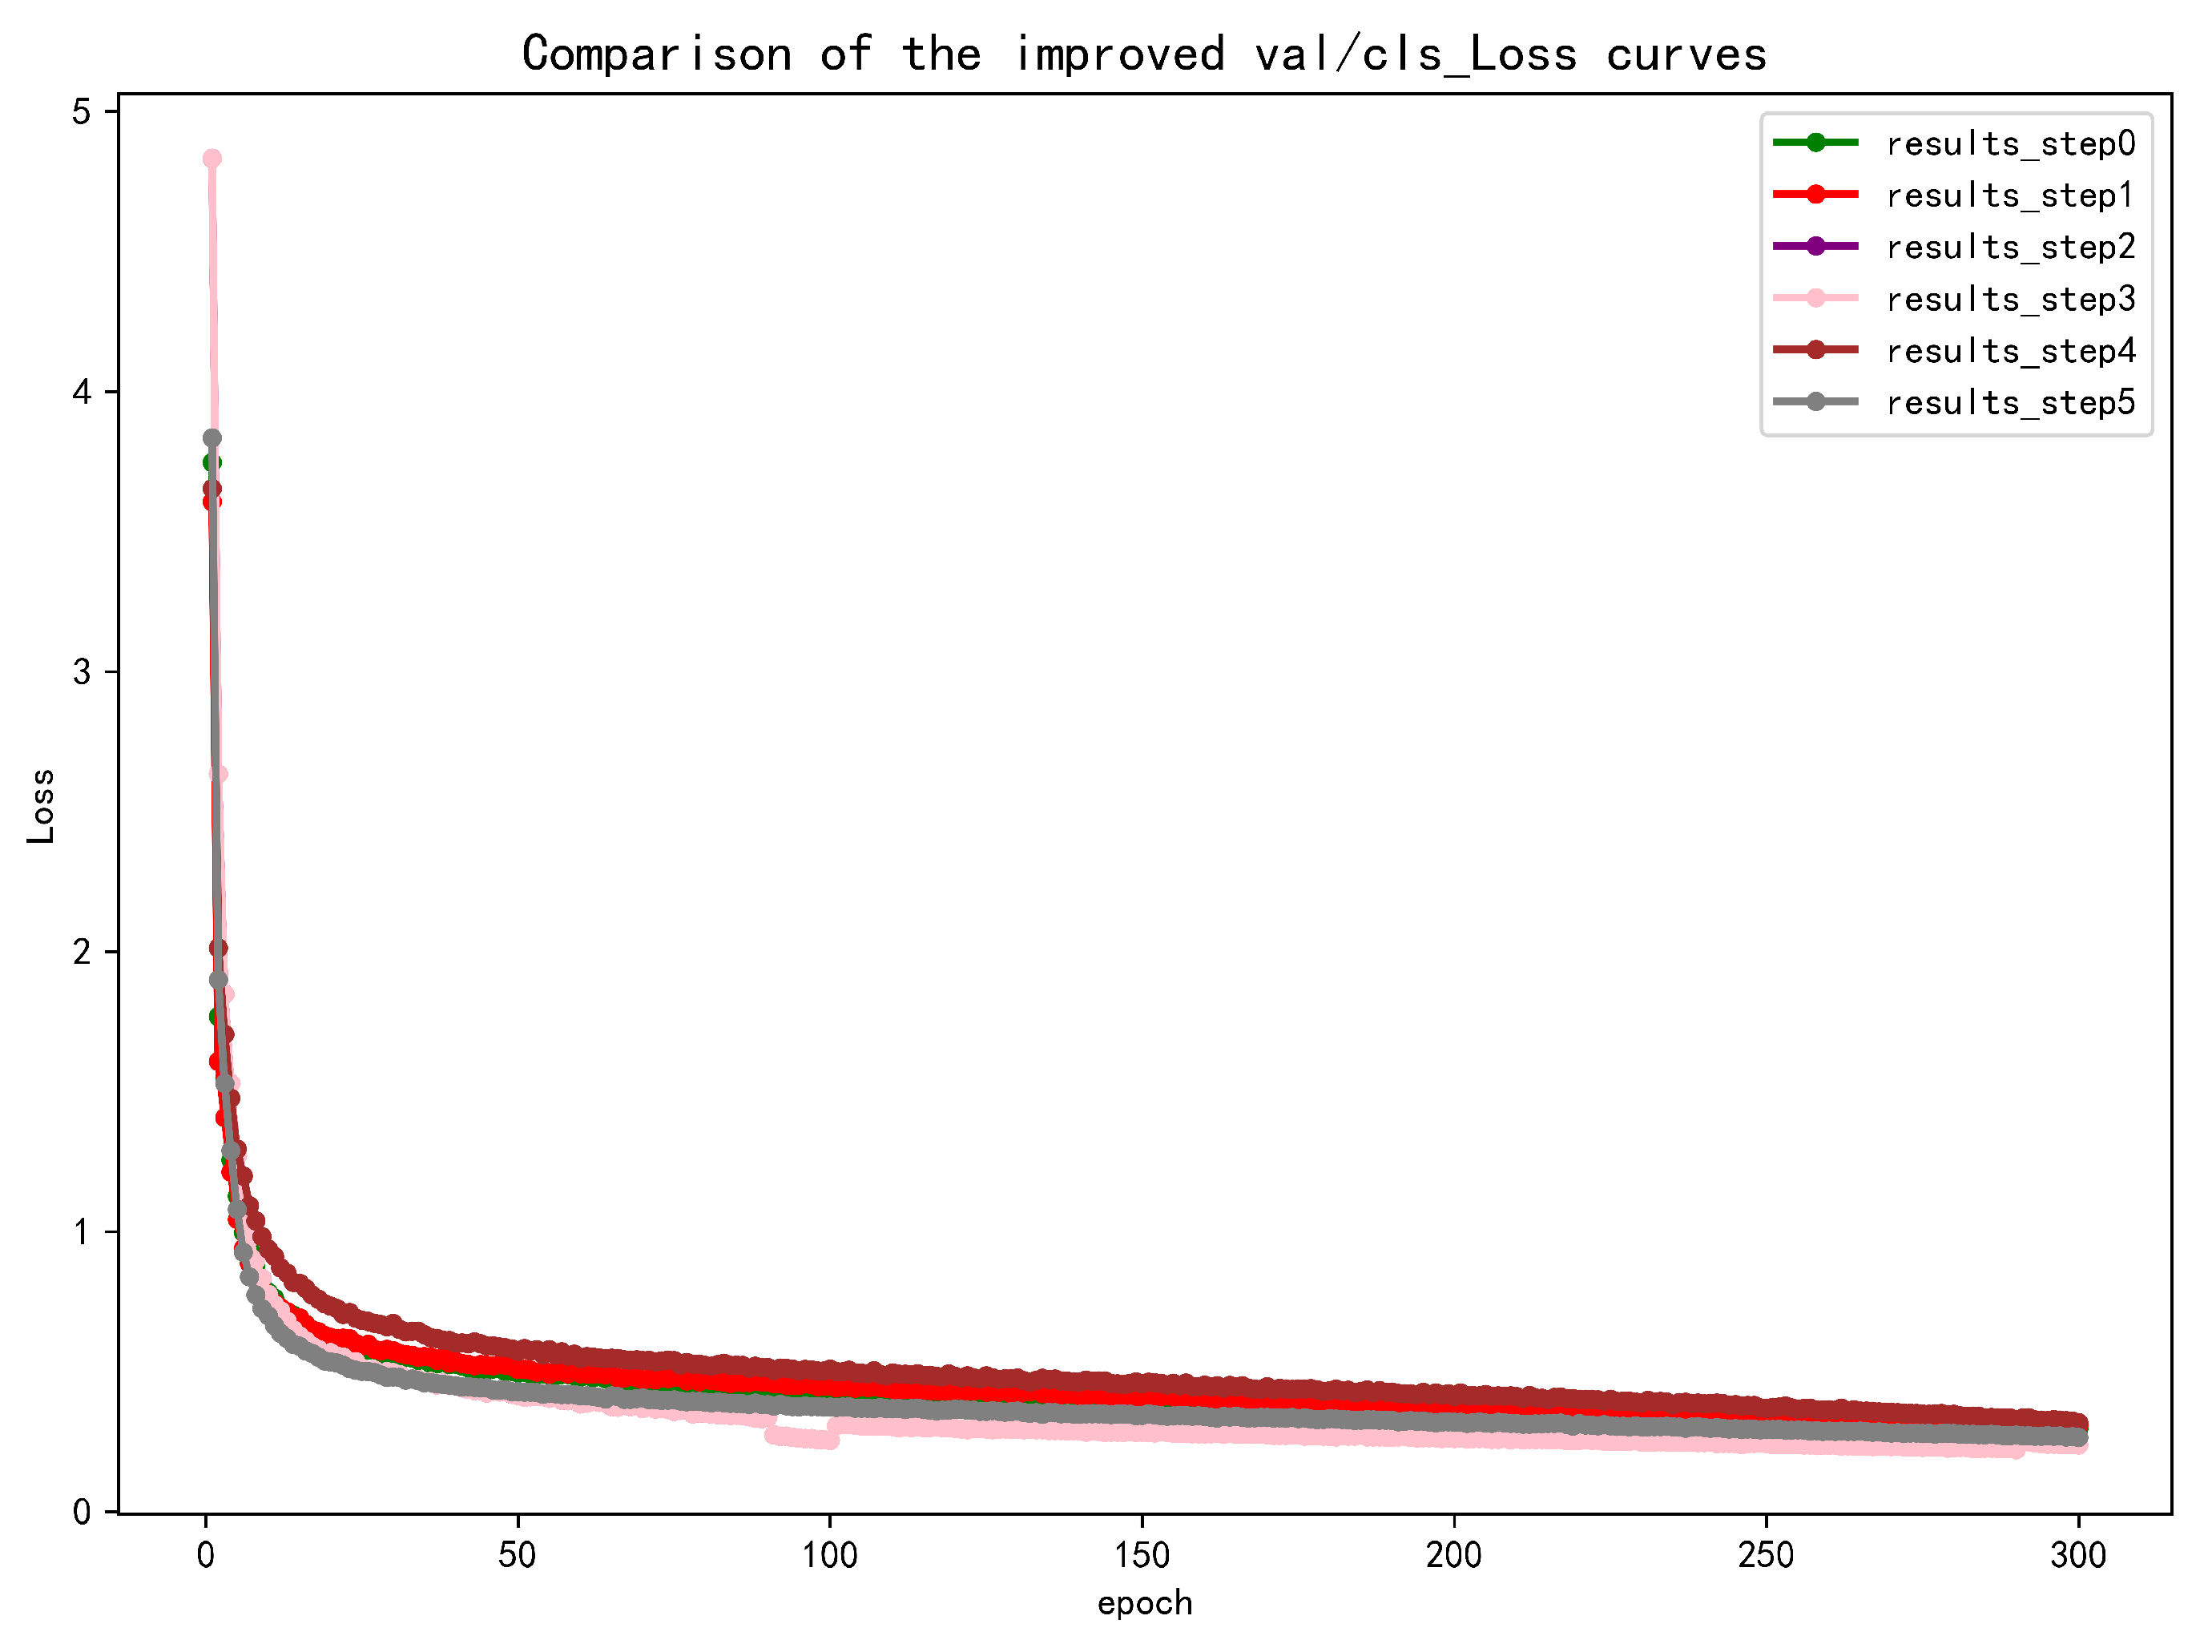
Loss function comparison experiment
The experiments were conducted on a cloud server equipped with an NVIDIA RTX A6000 GPU.The proposed method was implemented and evaluated on an A6000 GPU-equipped cloud server (48,670 MiB) deployed in Jingzhou District, Jingzhou City, Hubei Province, China (No. 1 Nanhuan Road, East Campus Main Building, Yangtze University). The software environment consisted of Ubuntu 22.04, PyTorch 2.3.0, and CUDA 12.1. The proposed method was implemented on an A6000 GPU-equipped cloud server with a batch size of 64, while maintaining all other hyperparameters at their default values. The results are presented in
Table 6.
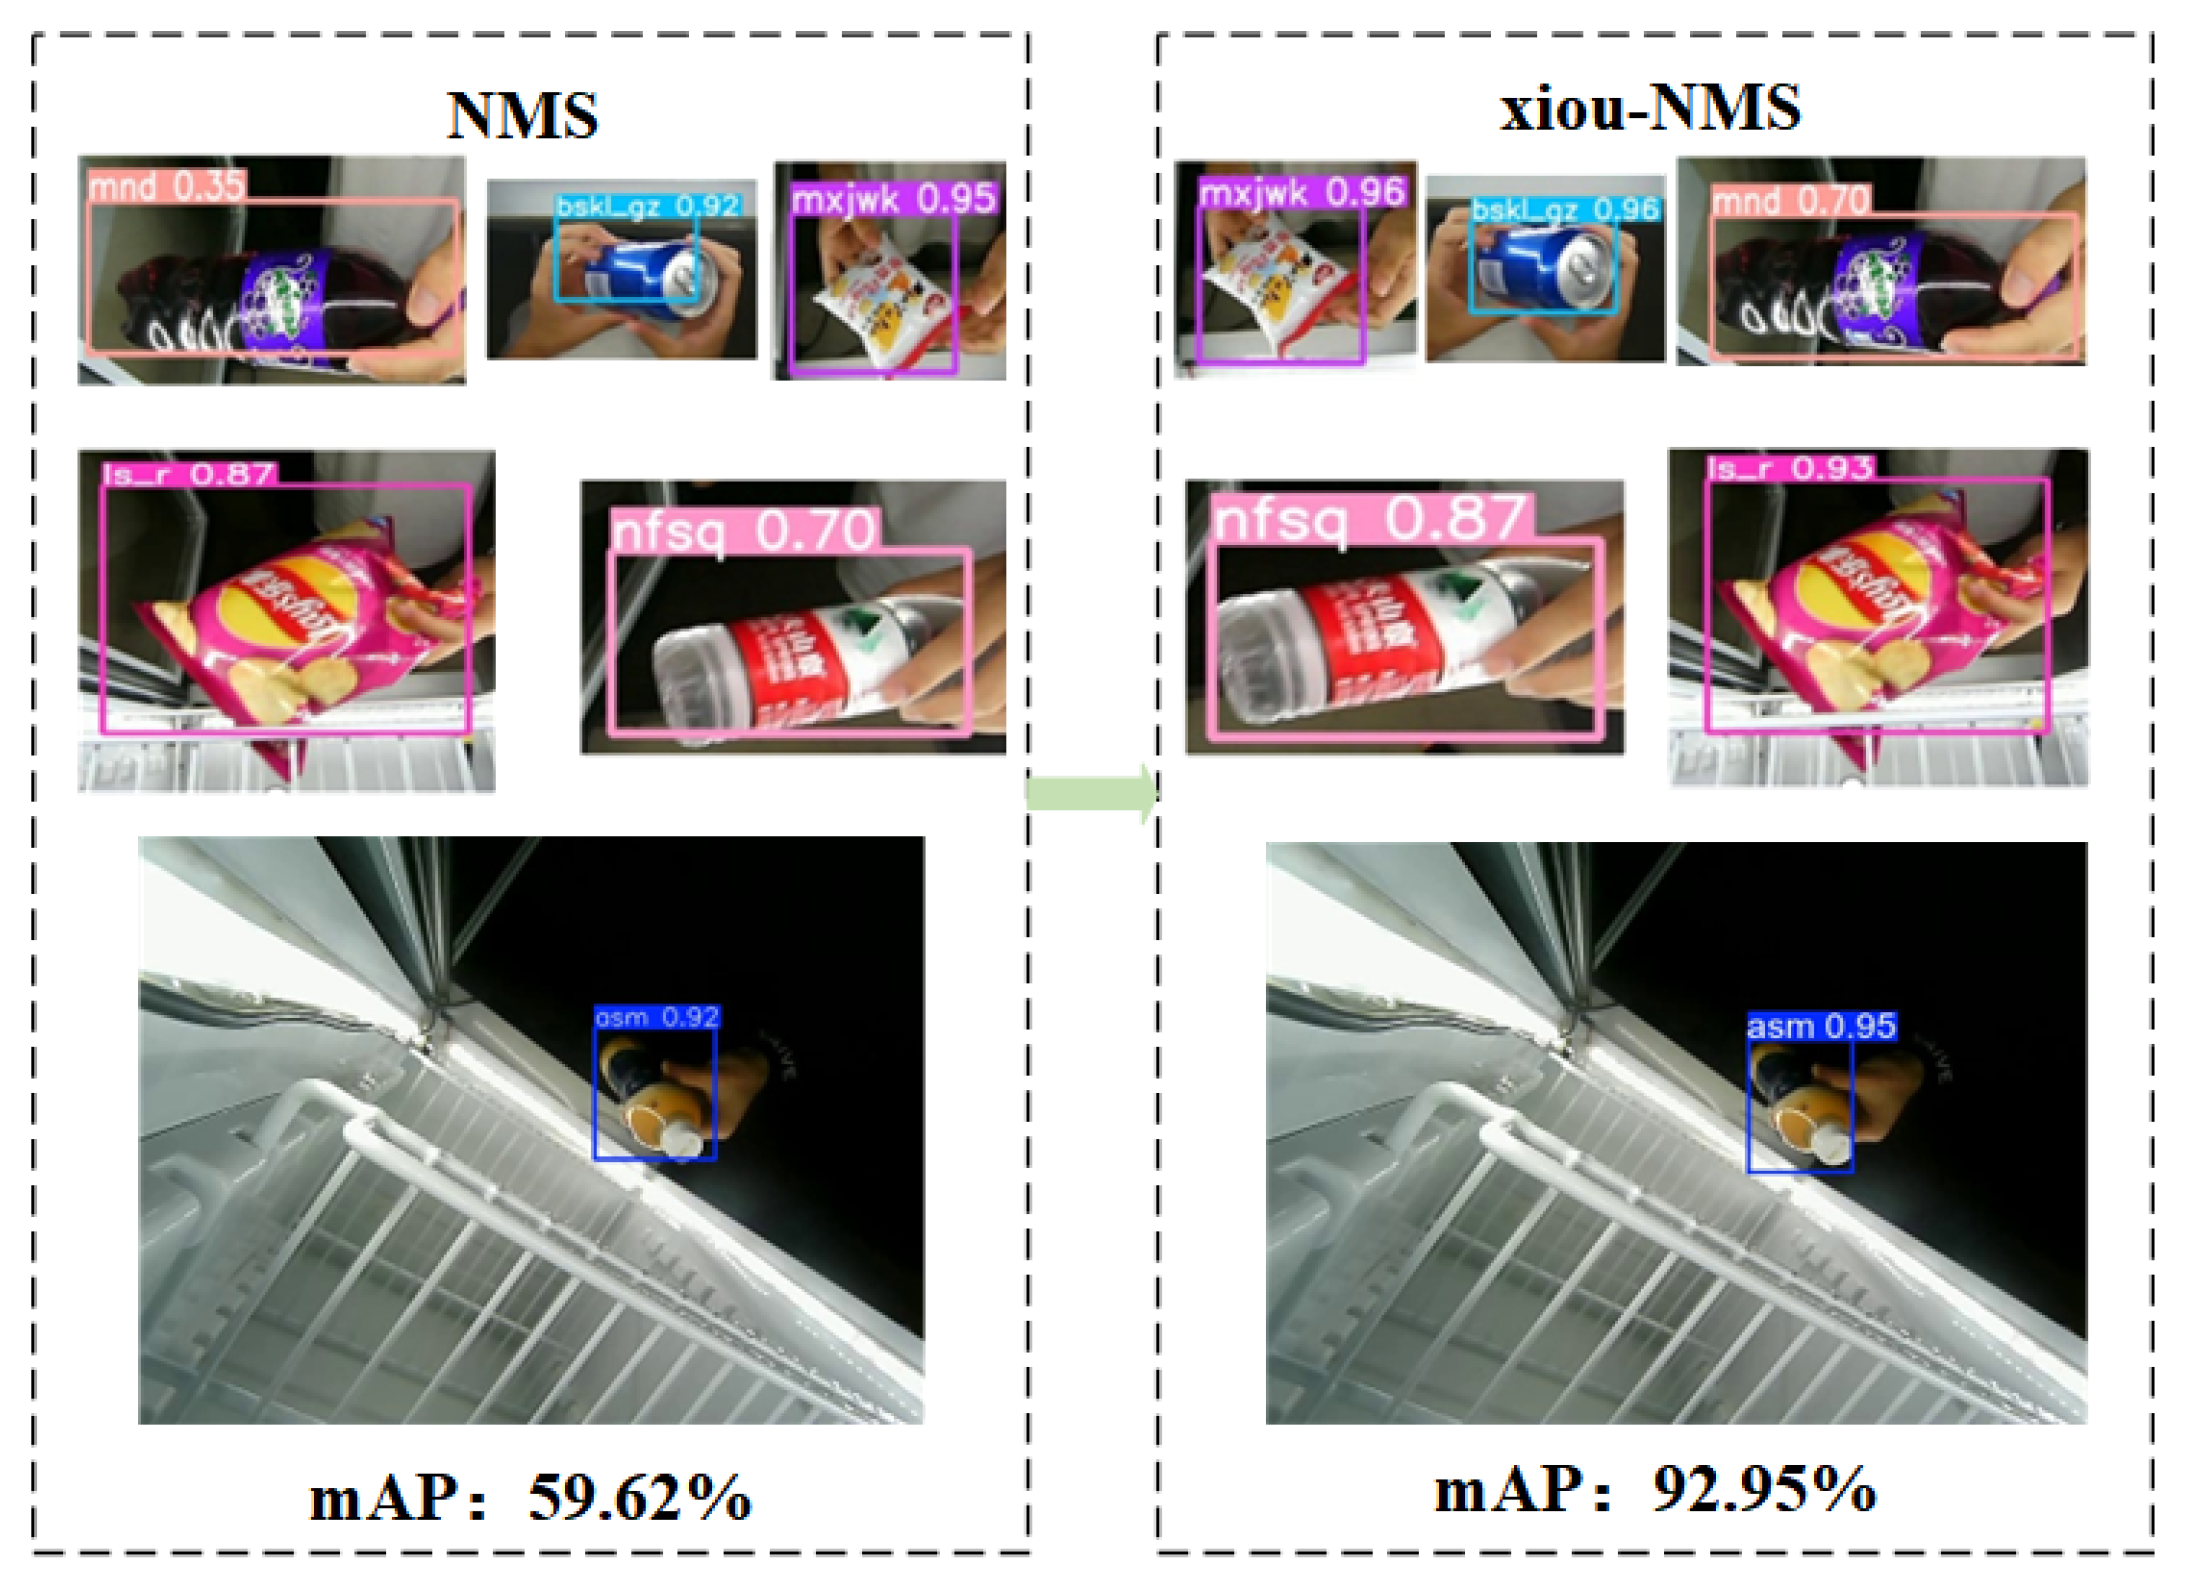
Table 6 presents a comparative analysis of different loss functions in terms of detection performance and computational efficiency. The evaluated metrics include mAP50, mAP50-95, recall, FLOPS, and FPS. The results demonstrate that all loss functions (cIoU, DIoU, GIoU, and XIoU) achieve nearly identical performance in mAP50 (0.994–0.995) and mAP50-95 (0.876–0.877), with XIoU slightly outperforming others in mAP50-95 (0.877). GIoU and XIoU yield the highest Recall (0.999), while cIoU and XIoU attain the best FPS (330 and 325, respectively). Notably, all methods maintain consistent computational costs (6.6G FLOPS), indicating that the choice of loss function does not significantly affect model complexity. These findings suggest that XIoU achieves a balanced trade-off between accuracy (mAP50-95 and recall) and speed (FPS), making it a competitive candidate for real-time detection tasks.
- 3.
Single-module ablation comparative experiments
To rigorously validate the performance of individual modules, we conducted the following independent module comparison experiments using an NVIDIA RTX A6000 GPU with a batch size = 64 and workers = 10.
As evidenced by
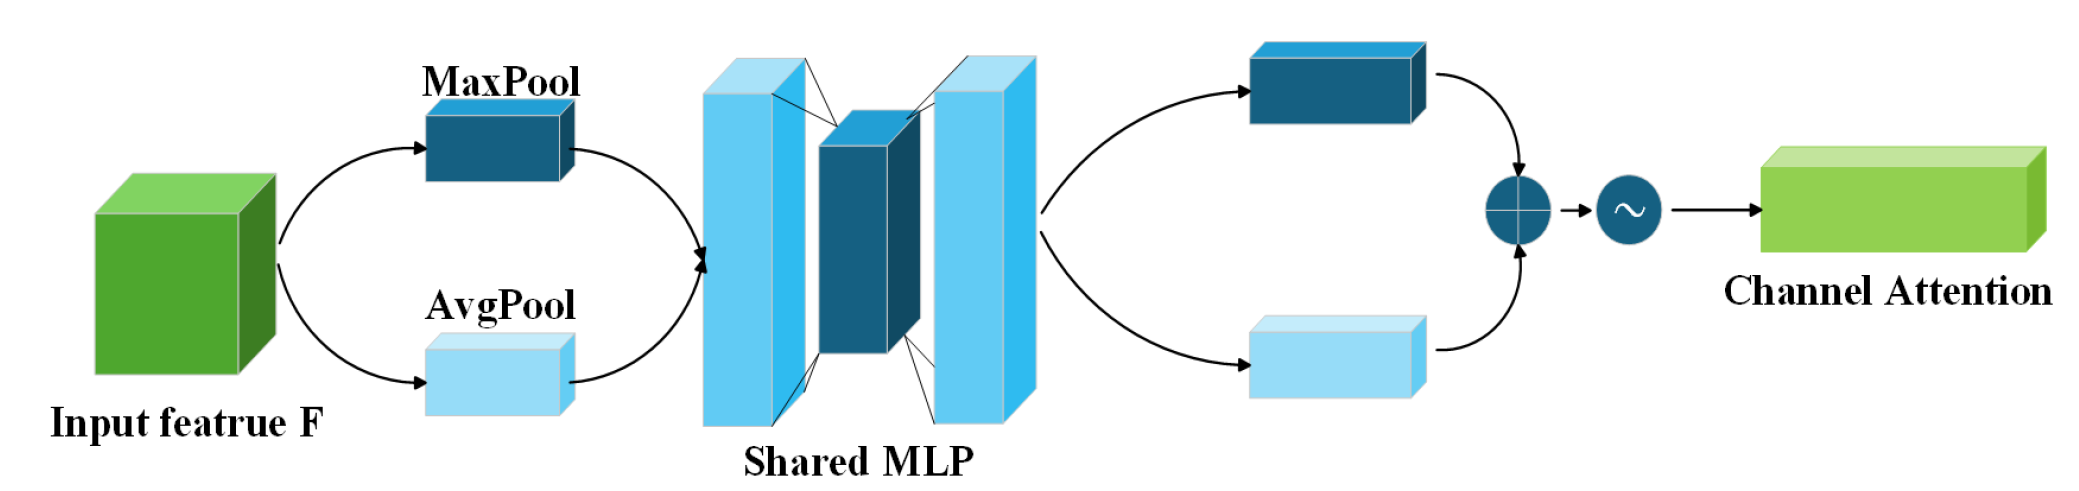
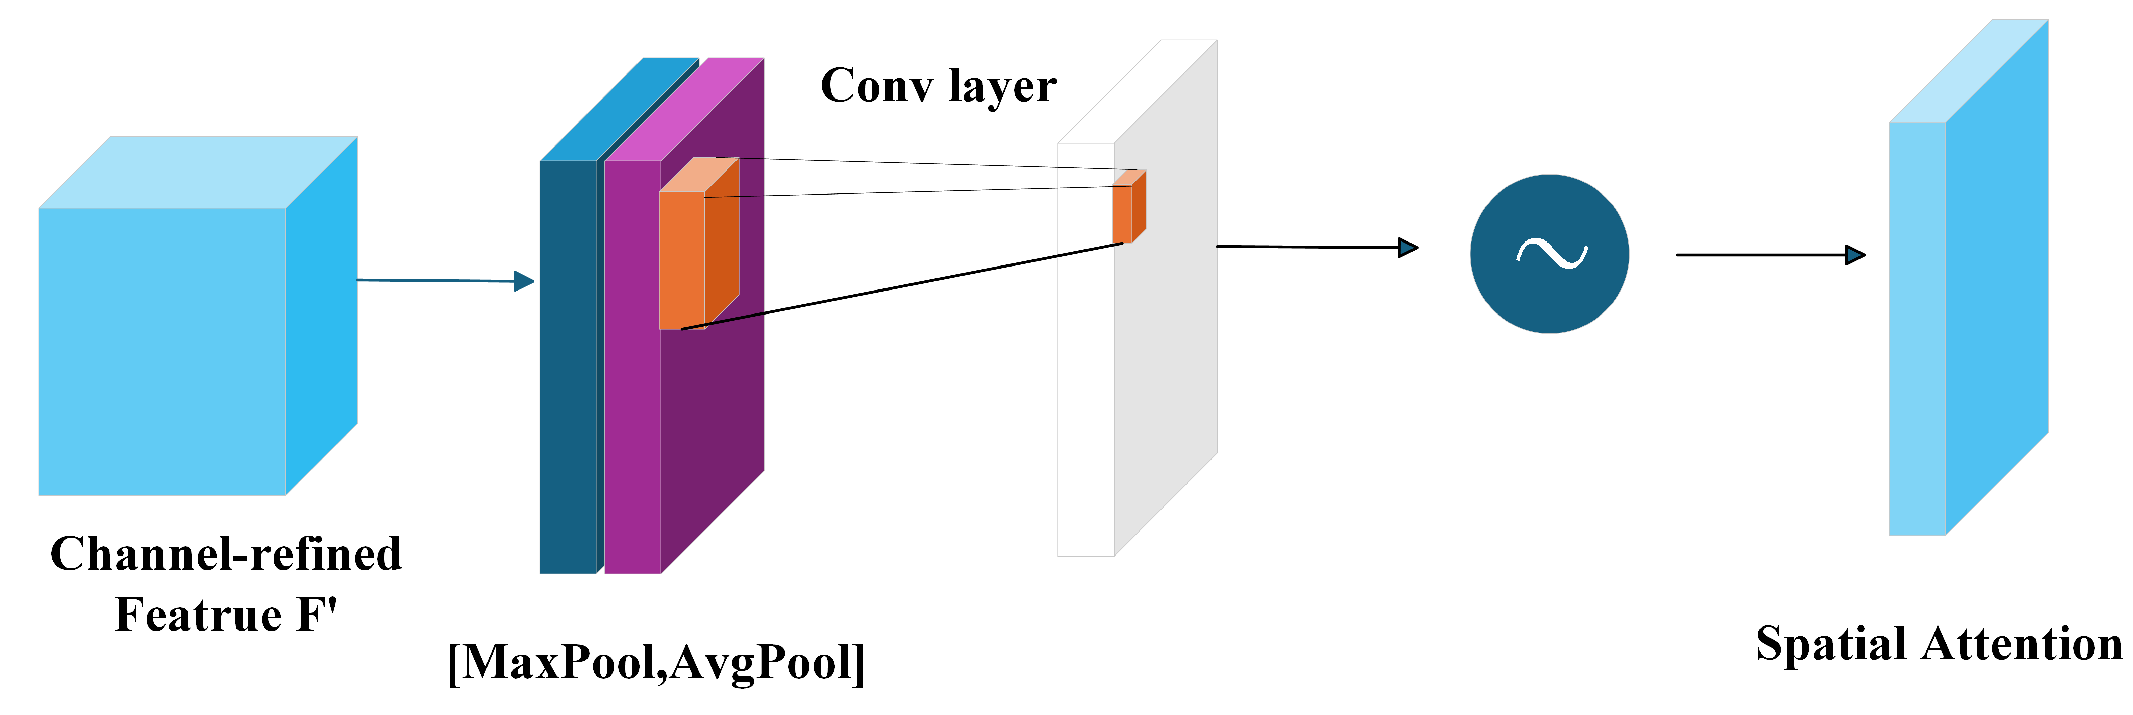
Table 7, each independently introduced improvement module demonstrates varying degrees of performance improvement compared to the baseline model. Notably, the CBAM module exhibits particularly outstanding results. By dynamically computing attention weights along both channel and spatial dimensions on feature maps after feature fusion, CBAM effectively enhances critical features while suppressing interference from irrelevant regions, rather than simply forwarding features to the detect layer. This approach significantly improves the model’s capability to model abstract features in images. Given CBAM’s plug-and-play nature, it serves as an ideal enhancement for YOLO-series models. Many researchers have adopted similar optimization approaches using CA attention or SENet attention in various application scenarios, all achieving measurable performance improvements. Through comprehensive evaluation in practical engineering contexts, we ultimately selected CBAM as the optimal module based on its overall performance.
Regarding the MFENet module proposed for the backbone network, its standalone performance improvement was limited during individual testing. This primarily stems from its multi-branch structure and feature fusion mechanism showing constrained effectiveness at current feature scales. Subsequent experiments will further validate its potential synergistic effects in multi-module integration scenarios.
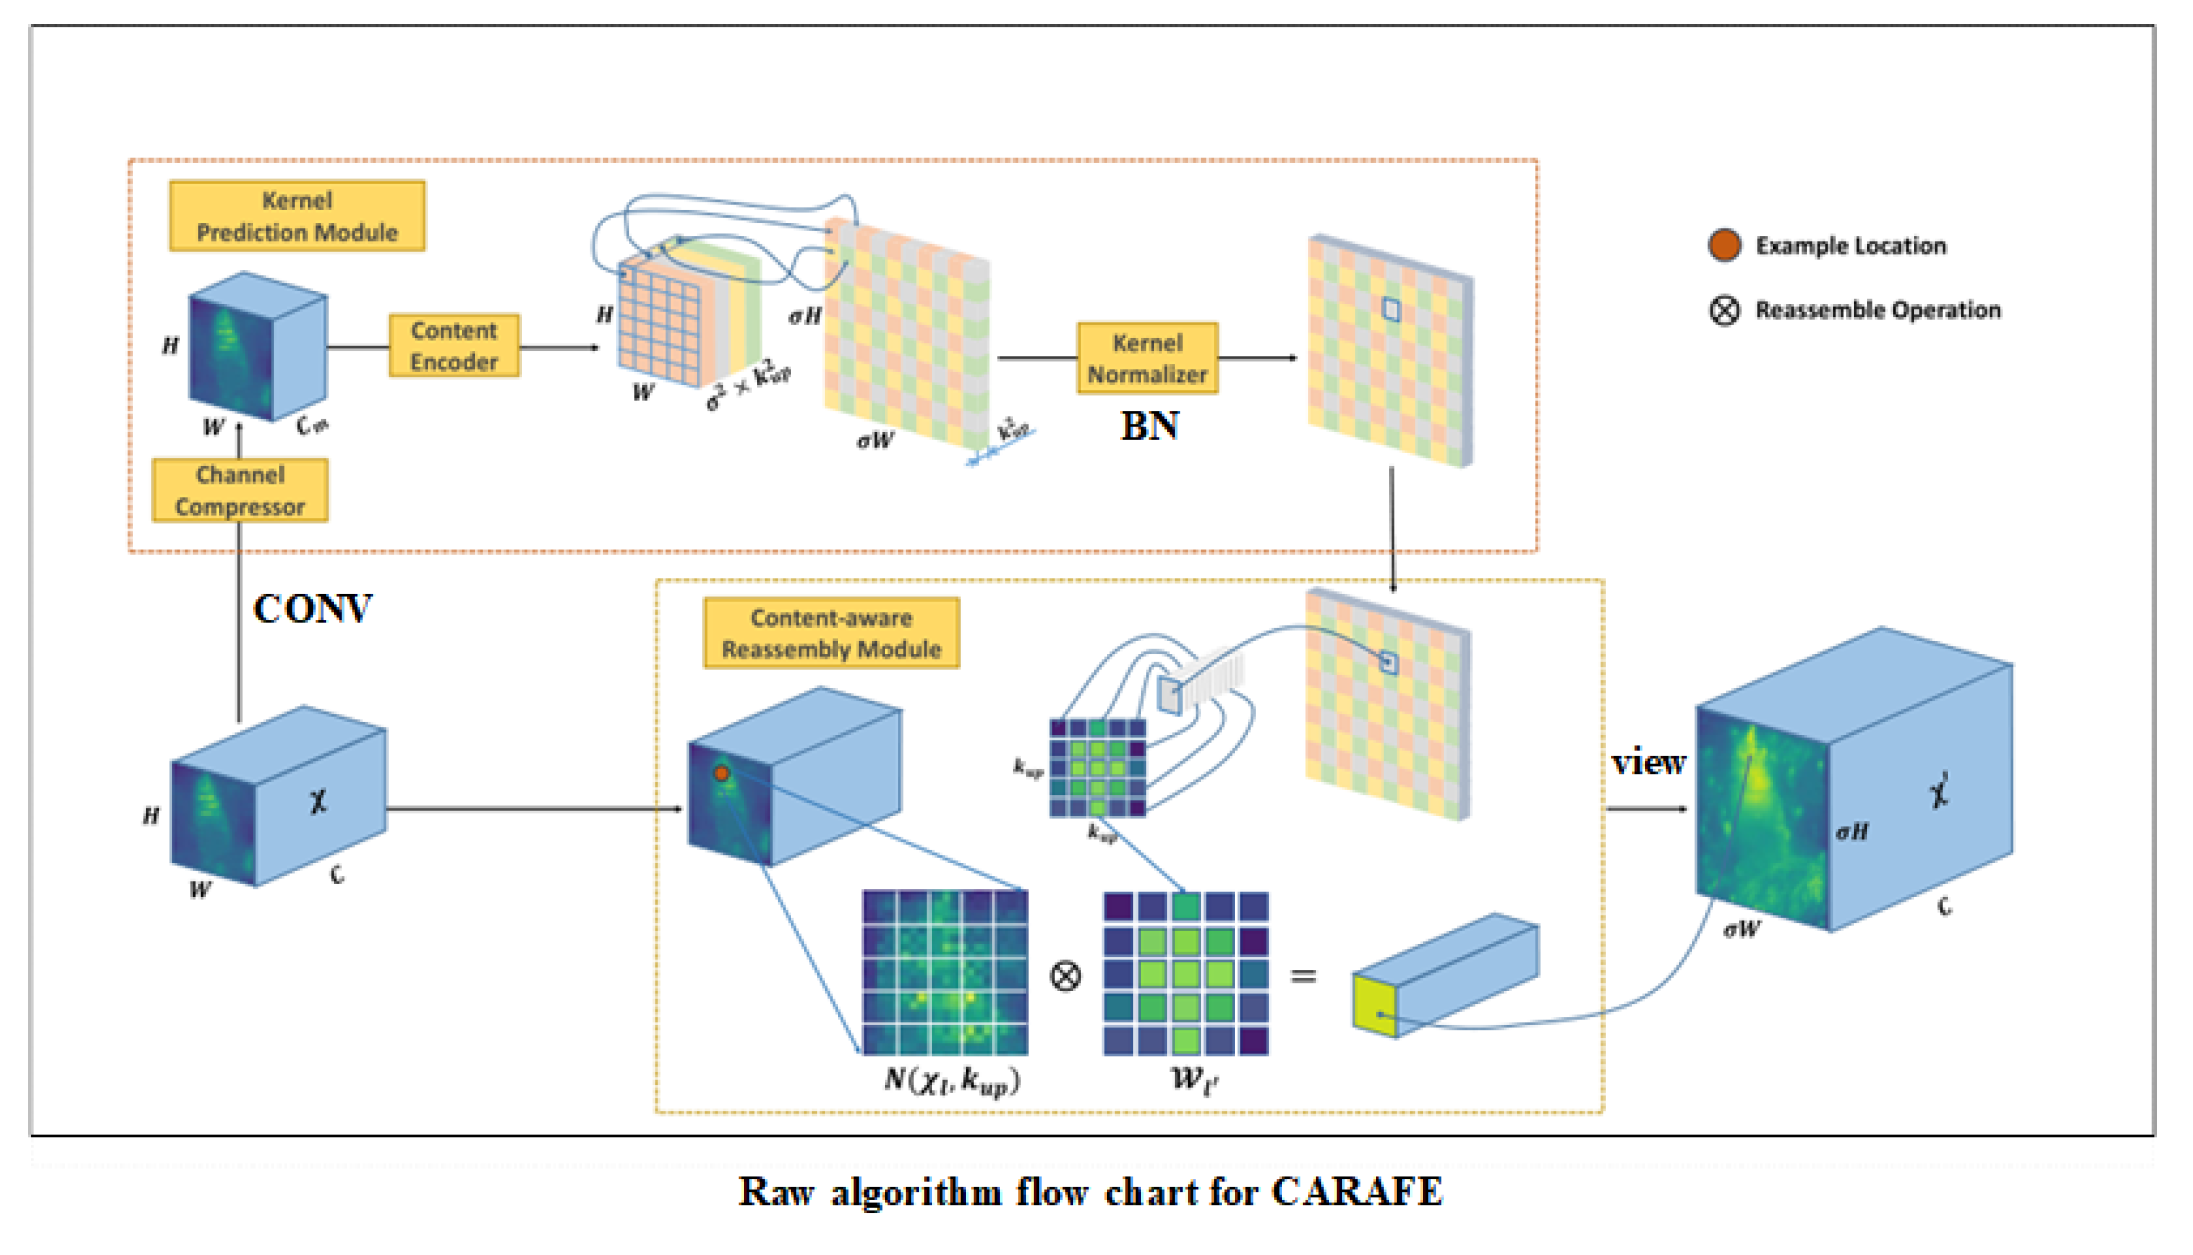
The CARAFE module, a classical dynamic upsampling method, achieved a 0.3% improvement in mAP50-95 when incorporated into the neck section. This module also possesses plug-and-play characteristics and demonstrates excellent compatibility with the YOLO framework, providing robust support for upsampling optimization in object detection.
The FuseModule showed no significant detection performance improvement in this round of experiments while increasing FLOPS, indicating limited overall impact. Future work will evaluate its potential through combination experiments with other modules.
Furthermore, the introduction of XIoU-NMS effectively enhanced model performance. As an improved non-maximum suppression strategy, it optimizes bounding box selection without increasing model parameters, positively influencing localization accuracy and convergence speed. This module will remain a key candidate for multi-module integration.
In summary, among the proposed improvements, CBAM and CARAFE modules delivered excellent results, while XIoU-NMS demonstrated stable performance. MFENet and FuseModule require further validation through integration strategies. Subsequent research will focus on exploring optimal detection architecture combinations through multi-module synergistic integration.
- 4.
Module Fusion Comparative Experiments
The experiments were conducted on a local workstation equipped with an NVIDIA RTX A6000 GPU.The proposed method was implemented and evaluated on an A6000 GPU-equipped cloud server (49 GB VRAM) deployed in Jingzhou District, Jingzhou City, Hubei Province, China (No. 1 Nanhuan Road, East Campus Main Building, Yangtze University). The software environment consisted of Ubuntu 22.04, PyTorch 2.3.0, and CUDA 12.1. In addition, the proposed method was implemented on an A6000 GPU-equipped cloud server with a batch size of 64, while maintaining all other hyperparameters at their default values. Six comparative experimental groups were performed.
From
Table 8, since the CARAFE module and the XIoU-NMS module have minimal impact on other modules, this ablation study adopts a progressive stacking approach to evaluate the remaining three main modules, thus assessing the feasibility of each module. As shown in the figure above, although the overall performance is improved, the FPS decreases by 35 F/S, compromising the real-time detection capability of the model. Moreover, the FLOPS increases by 2.8 G, which is indeed significant. Compared to the original model, MFENet incorporates multiple additional modules compared to Conv. When the fuseModule is excluded from the improvements, the accuracy drops from 0.993 to 0.986, a decrease of 0.7%, and the recall also declines, yielding unsatisfactory results. This modification increases computational complexity and workload. Future work will consider optimizing the image preprocessing stage to address these issues.
4.2.10. Generalizability Experiments
Since the model in this study was trained on a custom dataset, its performance in the local environment demonstrates considerable reliability. Specifically, the model exhibits strong performance across key metrics including mean average precision (mAP), recall, and inference speed. However, considering the requirement for the developed product recognition model to adapt to diverse shelf systems, generalization capability experiments were conducted to evaluate its detection effectiveness on public datasets. During experimentation, the RPC dataset was selected for generalization testing, with an additional 1000 images sampled from our custom dataset for evaluation. The experimental results provide a comparative analysis of YOLOv11 versus YOLOv11-retail model performance. Subsequent analyses will compare detection performance differences across varied complex environments.
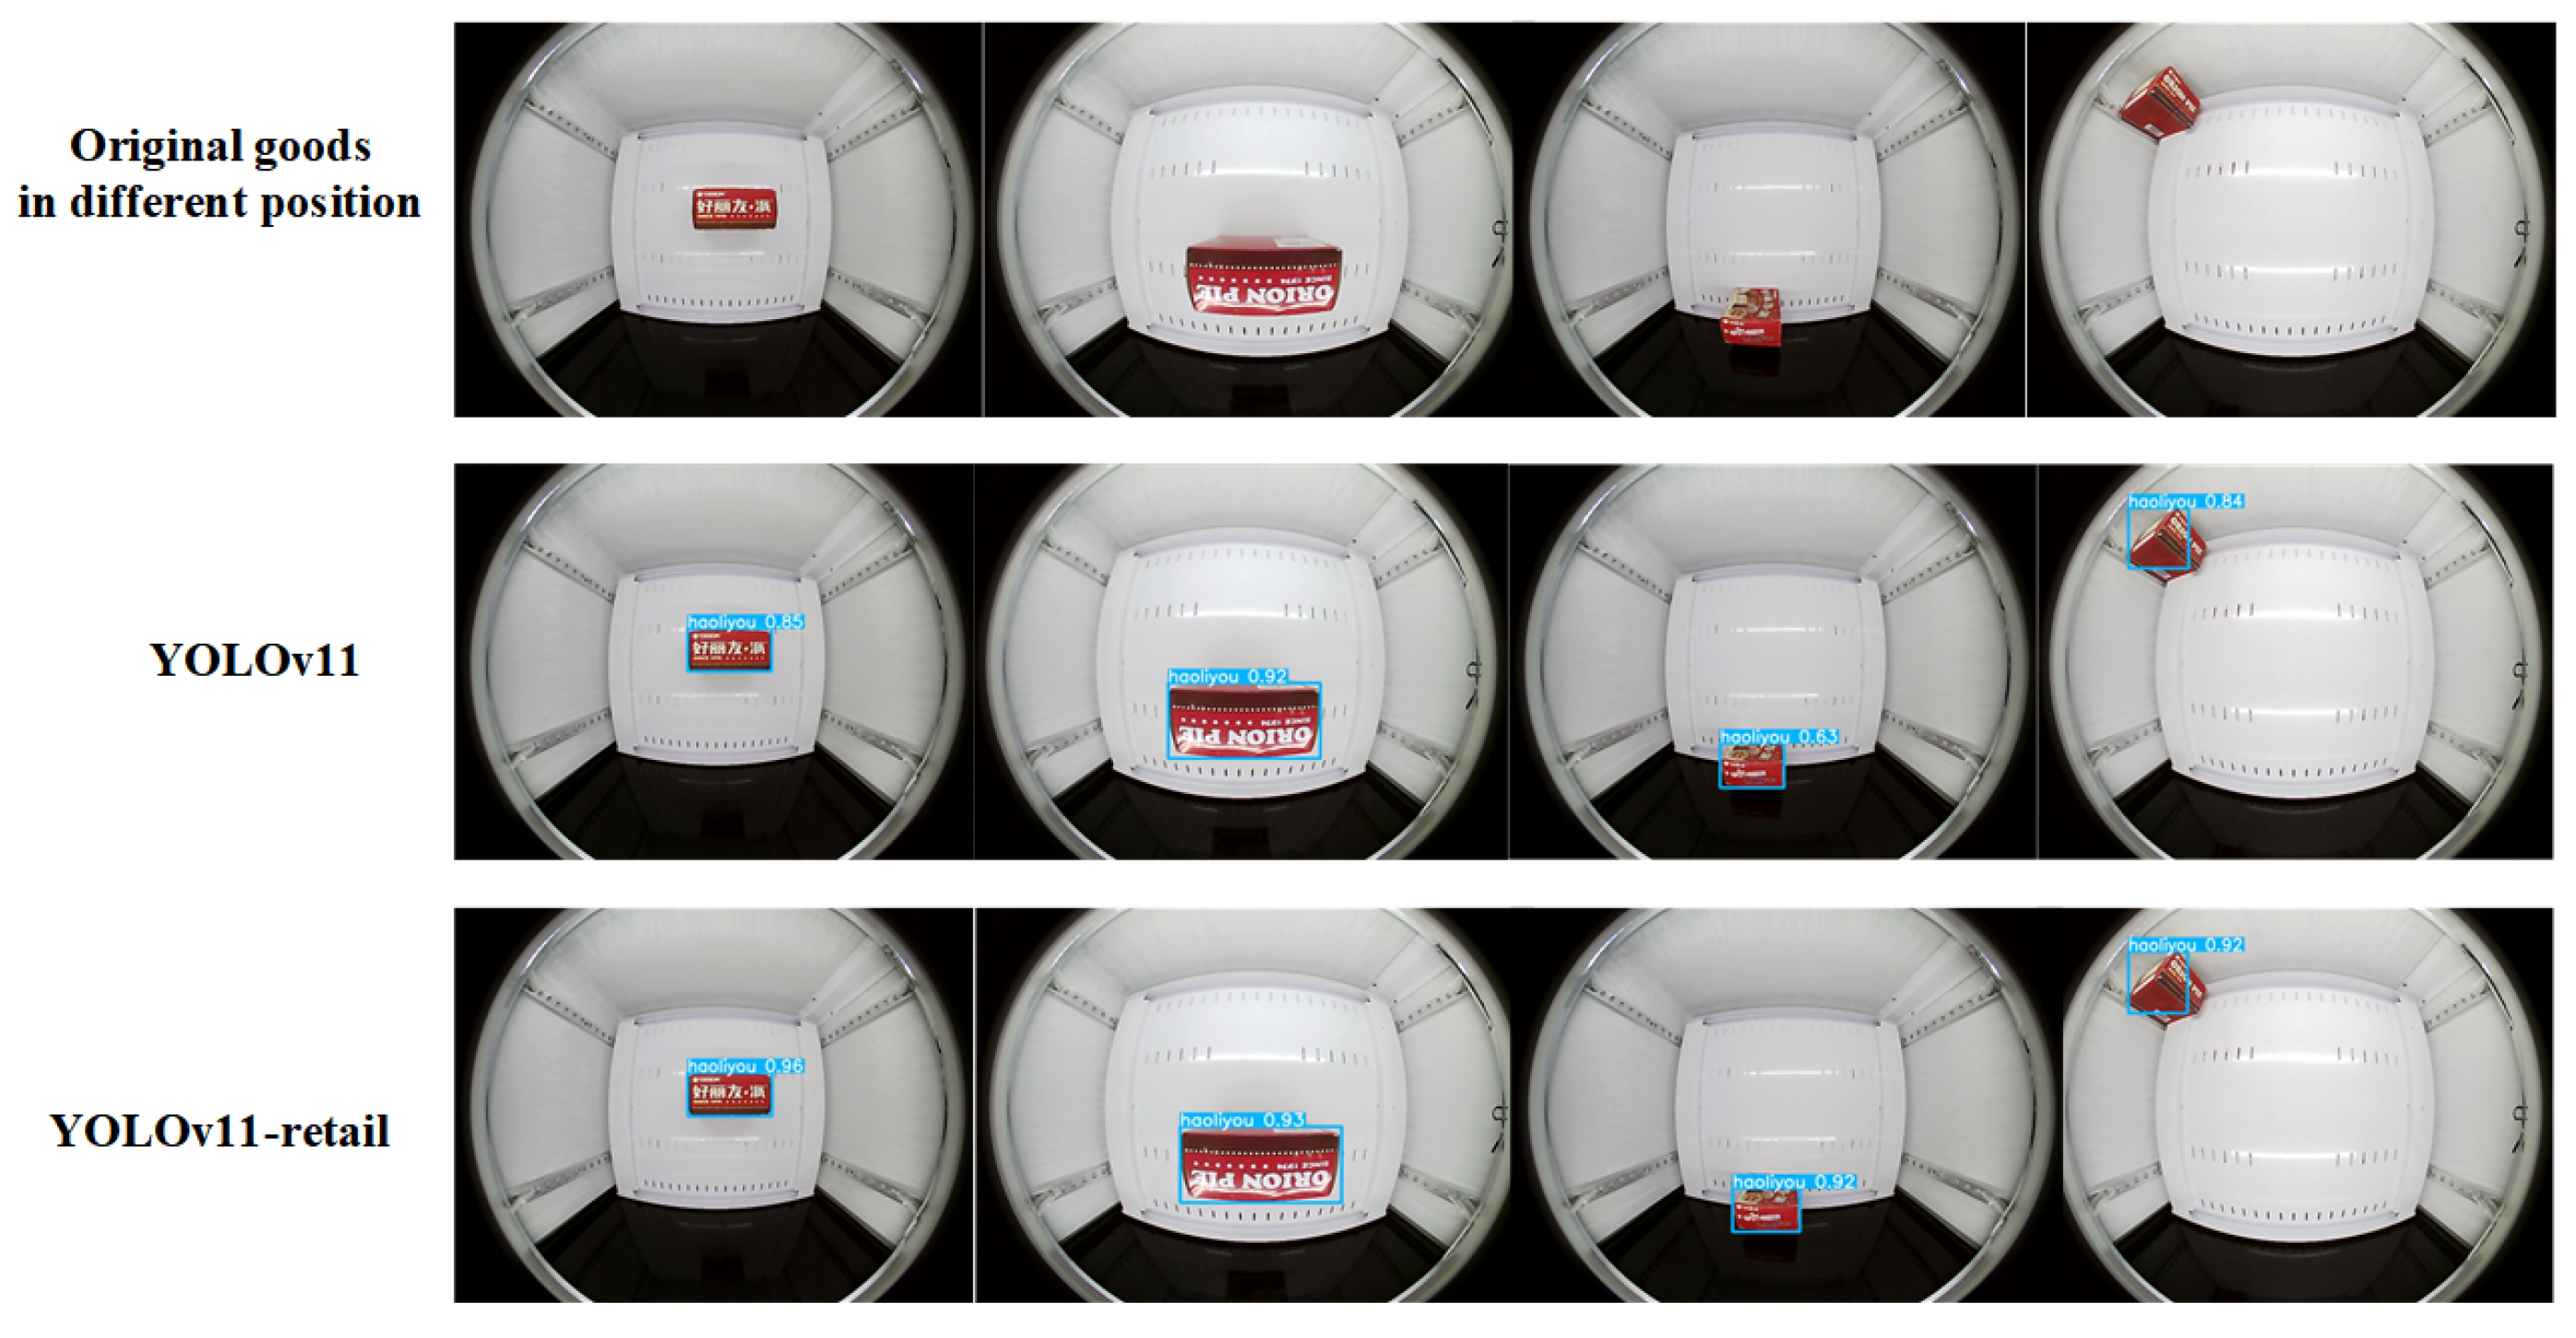
- 1.
Detection results under the normal scene
As illustrated in
Figure 18 and
Figure 19, the detection performance under normal conditions demonstrates high efficacy across varied merchandise placements. Compared to the original YOLOv11, the proposed YOLOv11-Retail exhibits superior detection accuracy regardless of item arrangement. These results validate the effectiveness of model enhancements, establishing it as a critical component in practical shopping scenarios with high-precision characteristics.
- 2.
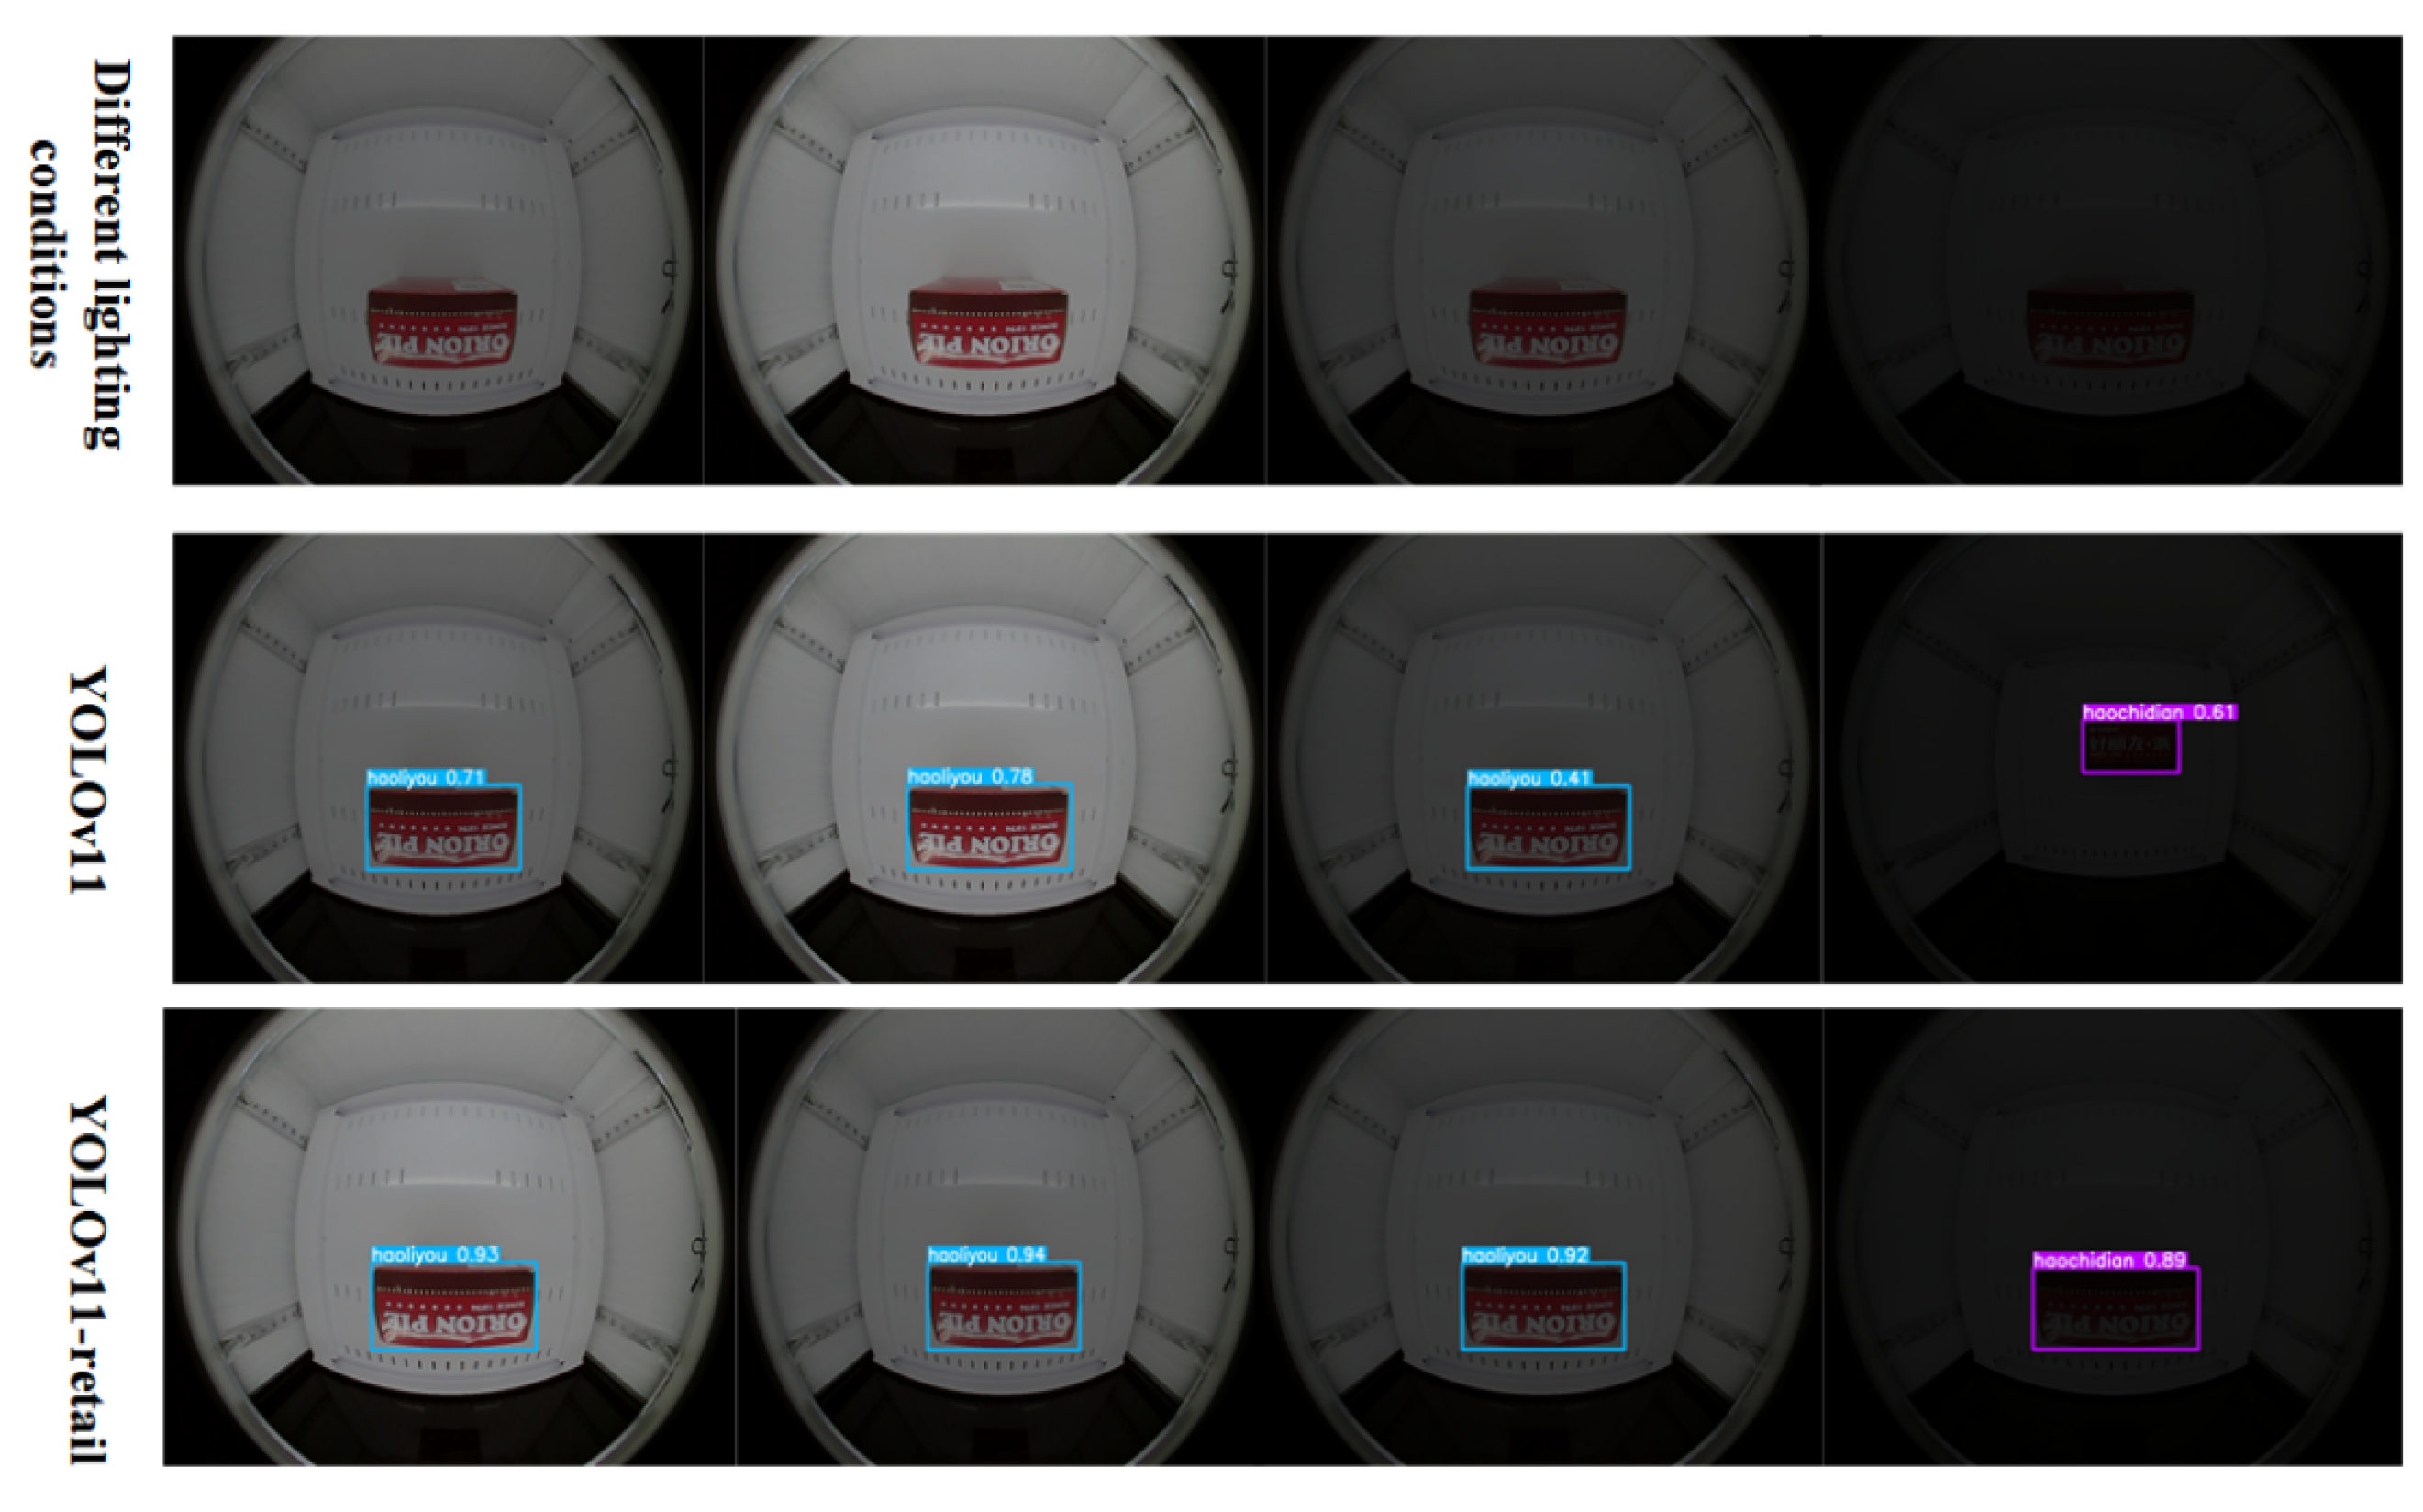
Detection results under the low-light scene
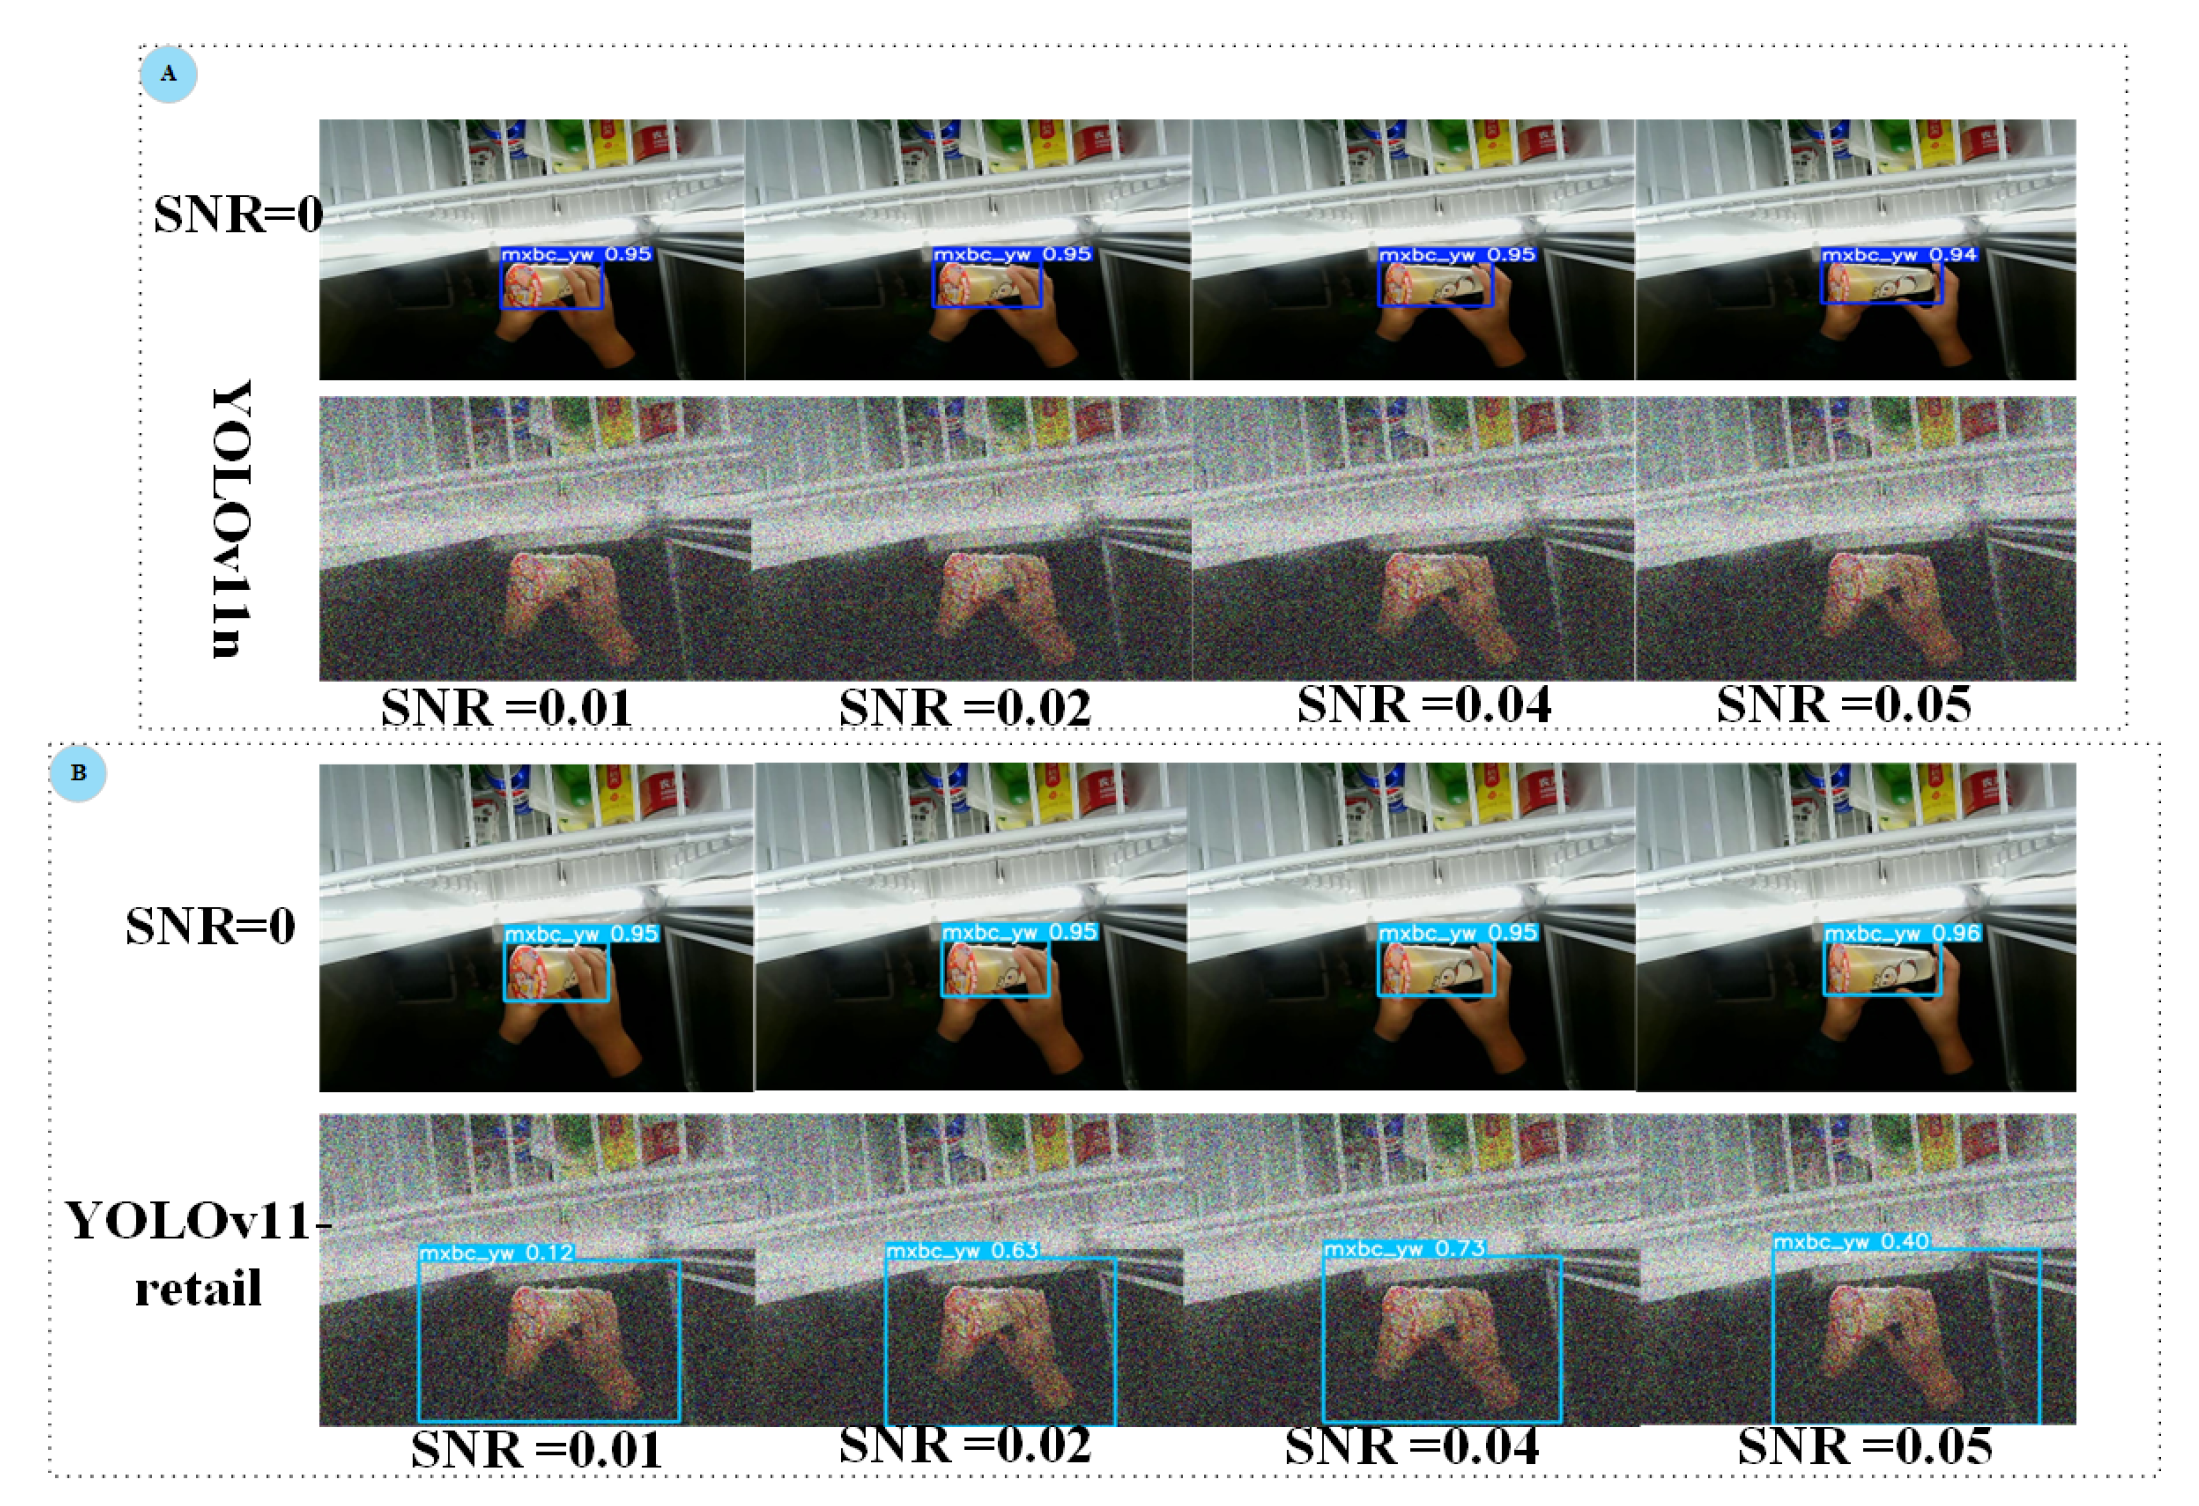
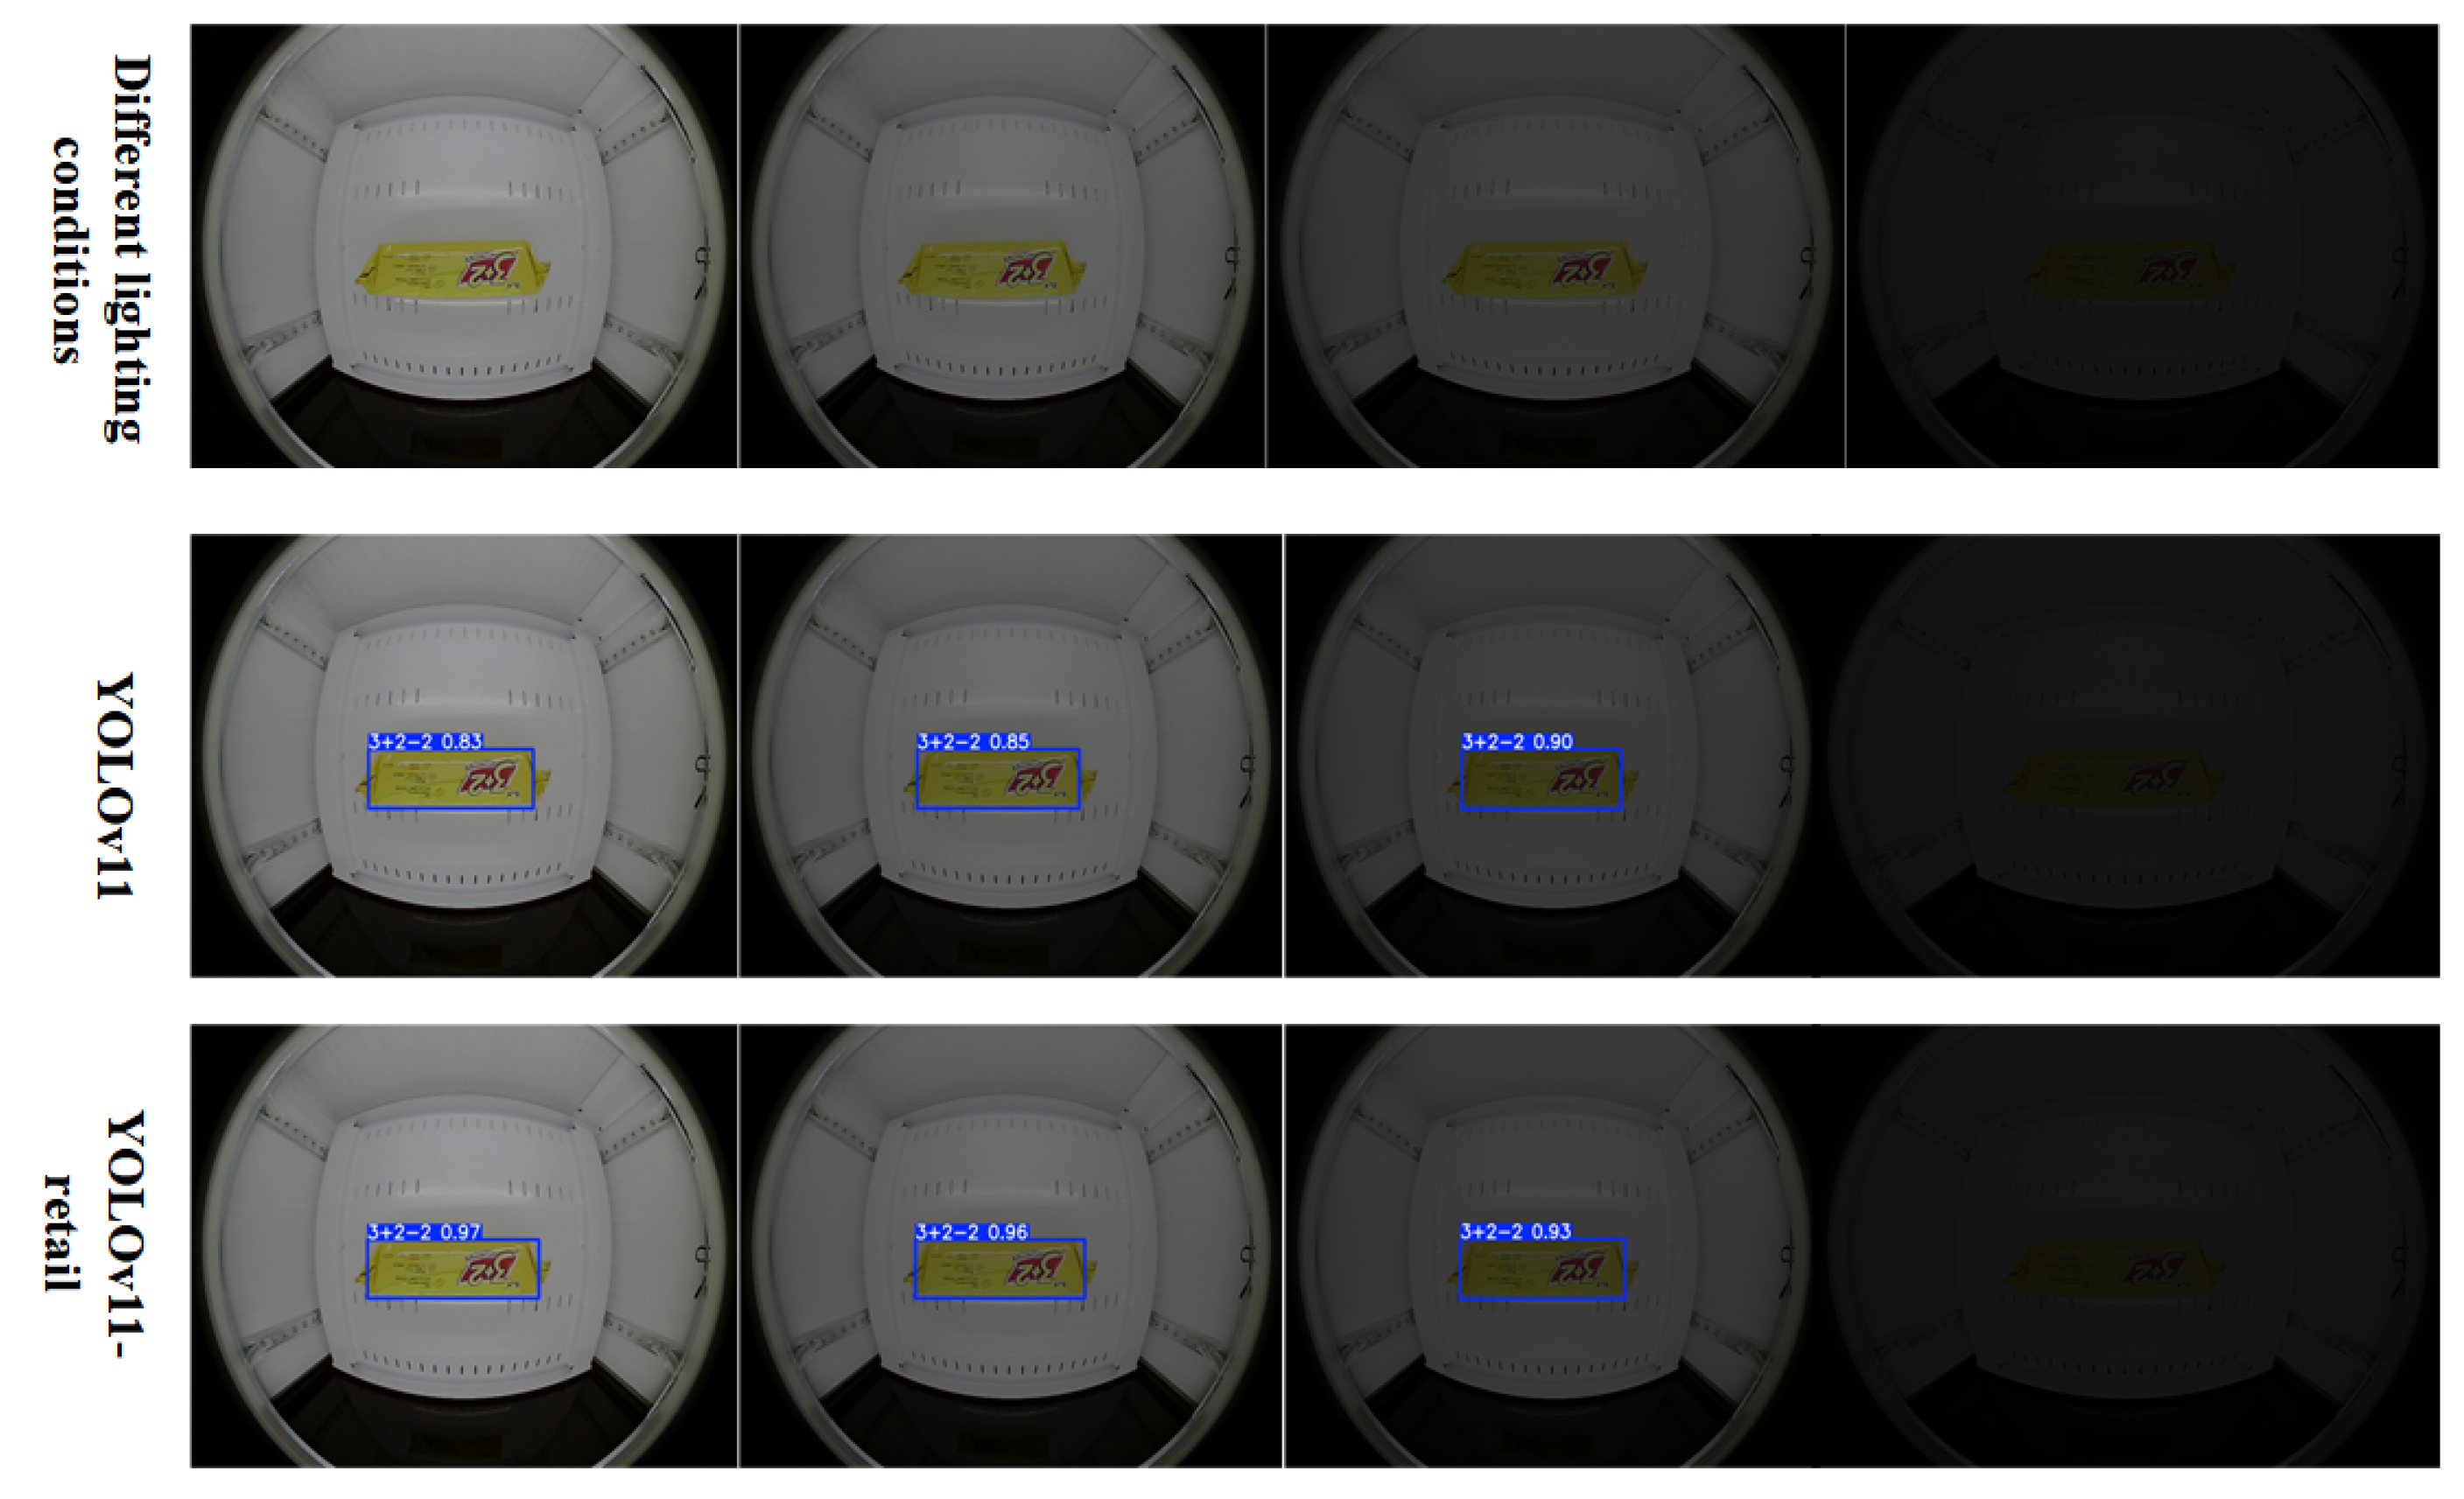
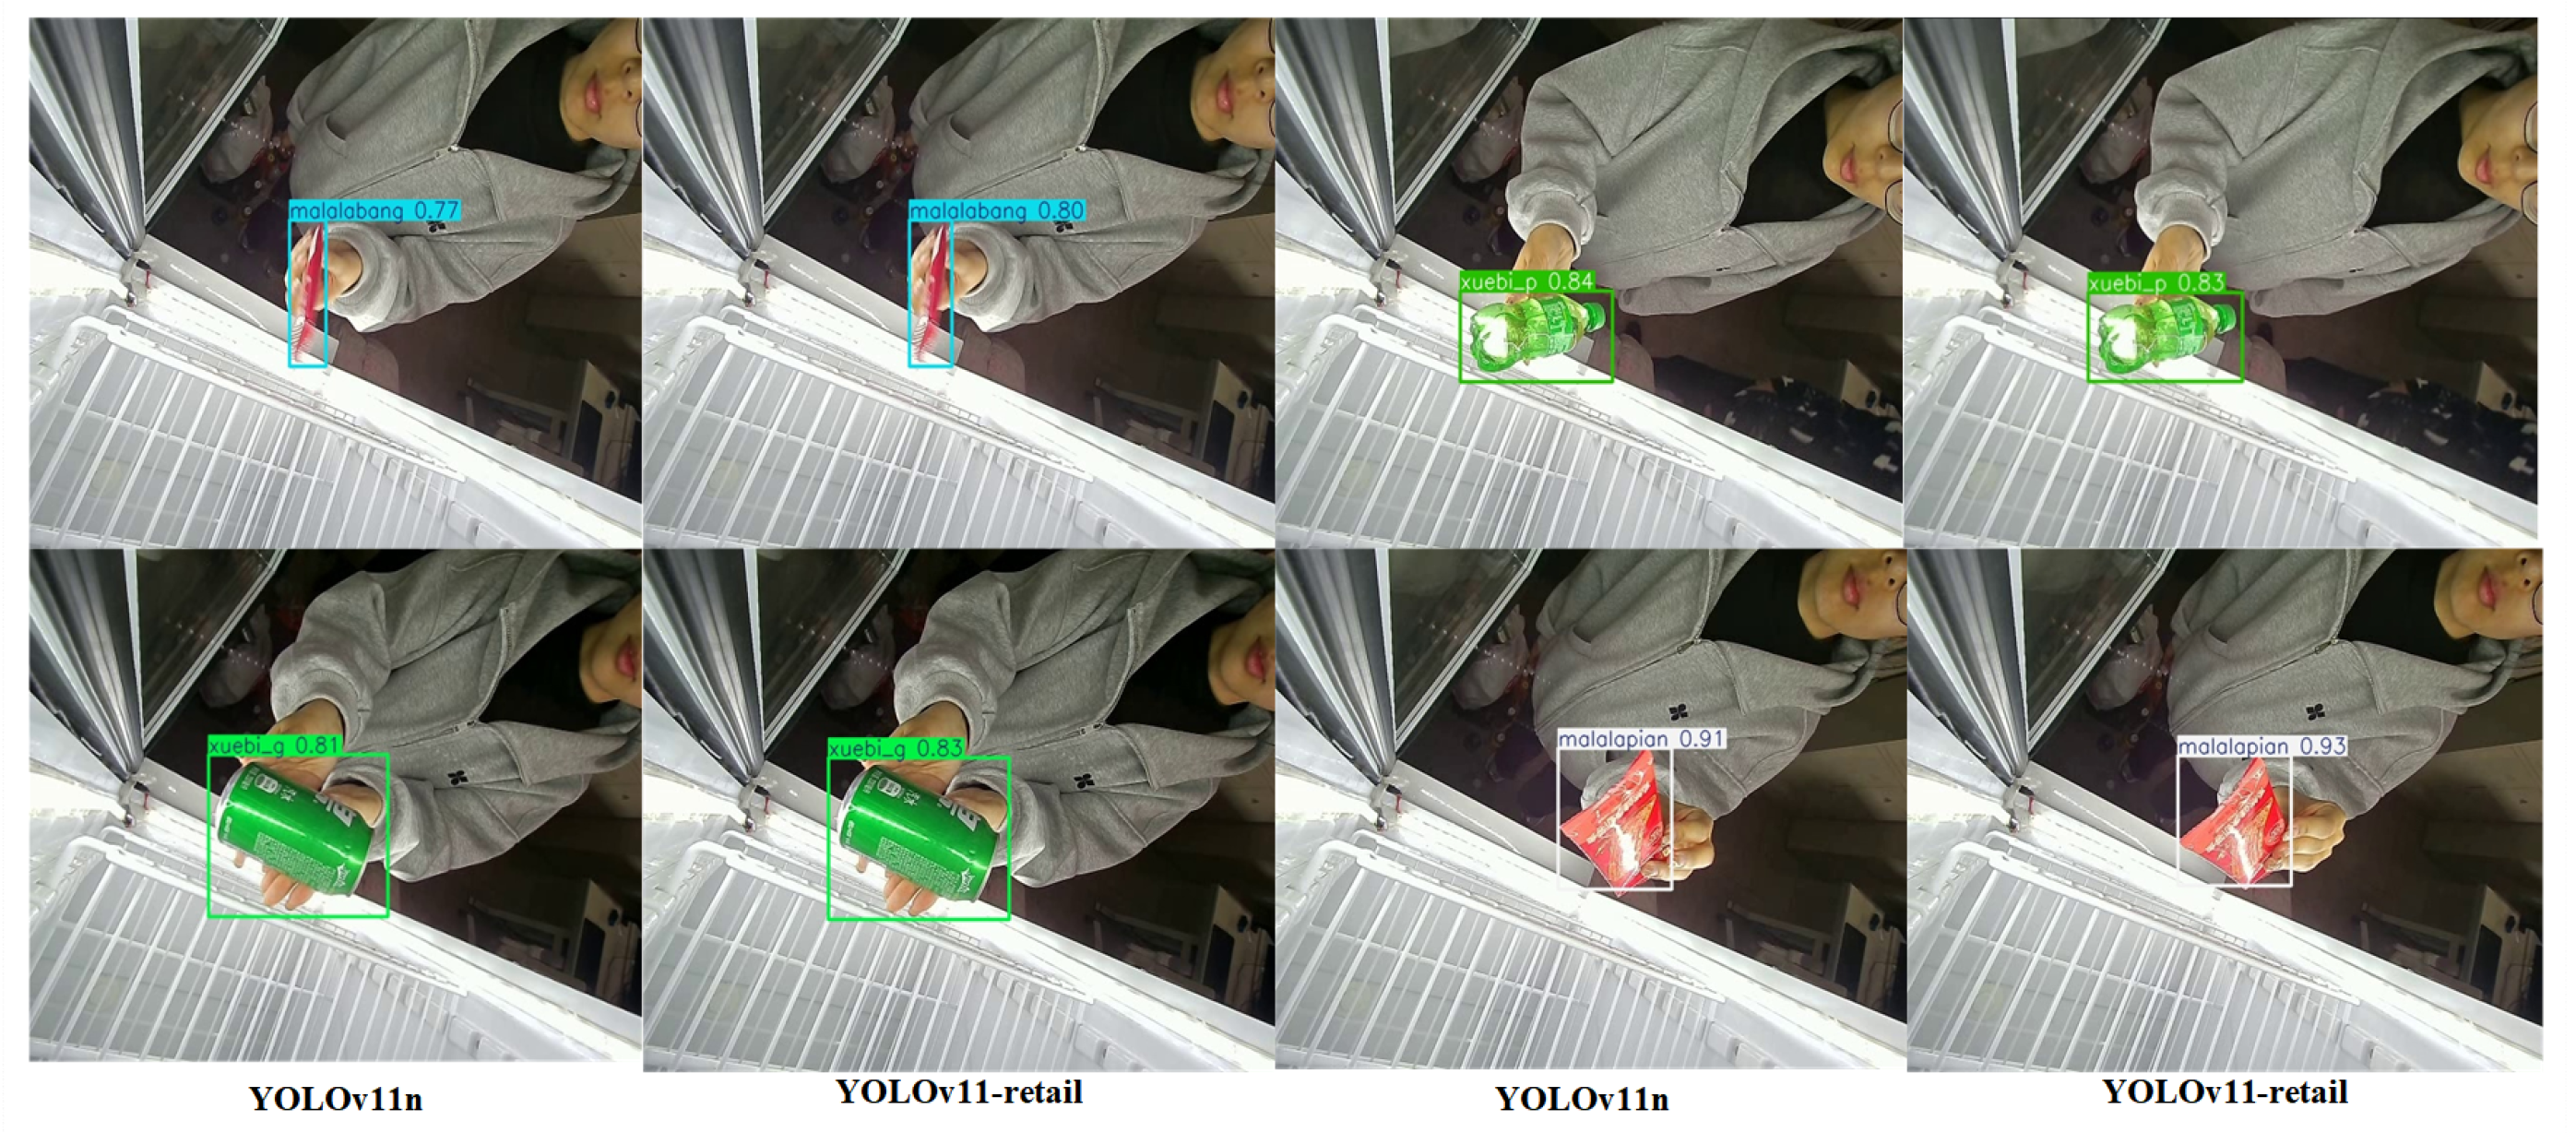
In
Figure 20 and
Figure 21, the comparison results of different detection models for various products under different lighting conditions are presented.
Figure 20 shows the results for the Goodrich product, while
Figure 21 shows the results for the 3+2 product. The experimental results show that the proposed improved model significantly enhances detection accuracy compared to the original model, particularly in low-light conditions, where the improvement is more pronounced. This demonstrates that the improved model has strong environmental resistance and robustness. However, it is important to note that in the last set of images, there are still instances of missed detections, indicating that the current model has room for improvement in detecting complex scenes. To address this issue, future work can focus on two main areas: first, by enriching the training dataset with samples from various environments and lighting conditions, to enhance the model’s generalization ability; second, by introducing a more diverse range of data augmentation techniques to improve the model’s adaptability to complex environments, thereby further enhancing the robustness and practical effectiveness of the detection system.
- 3.
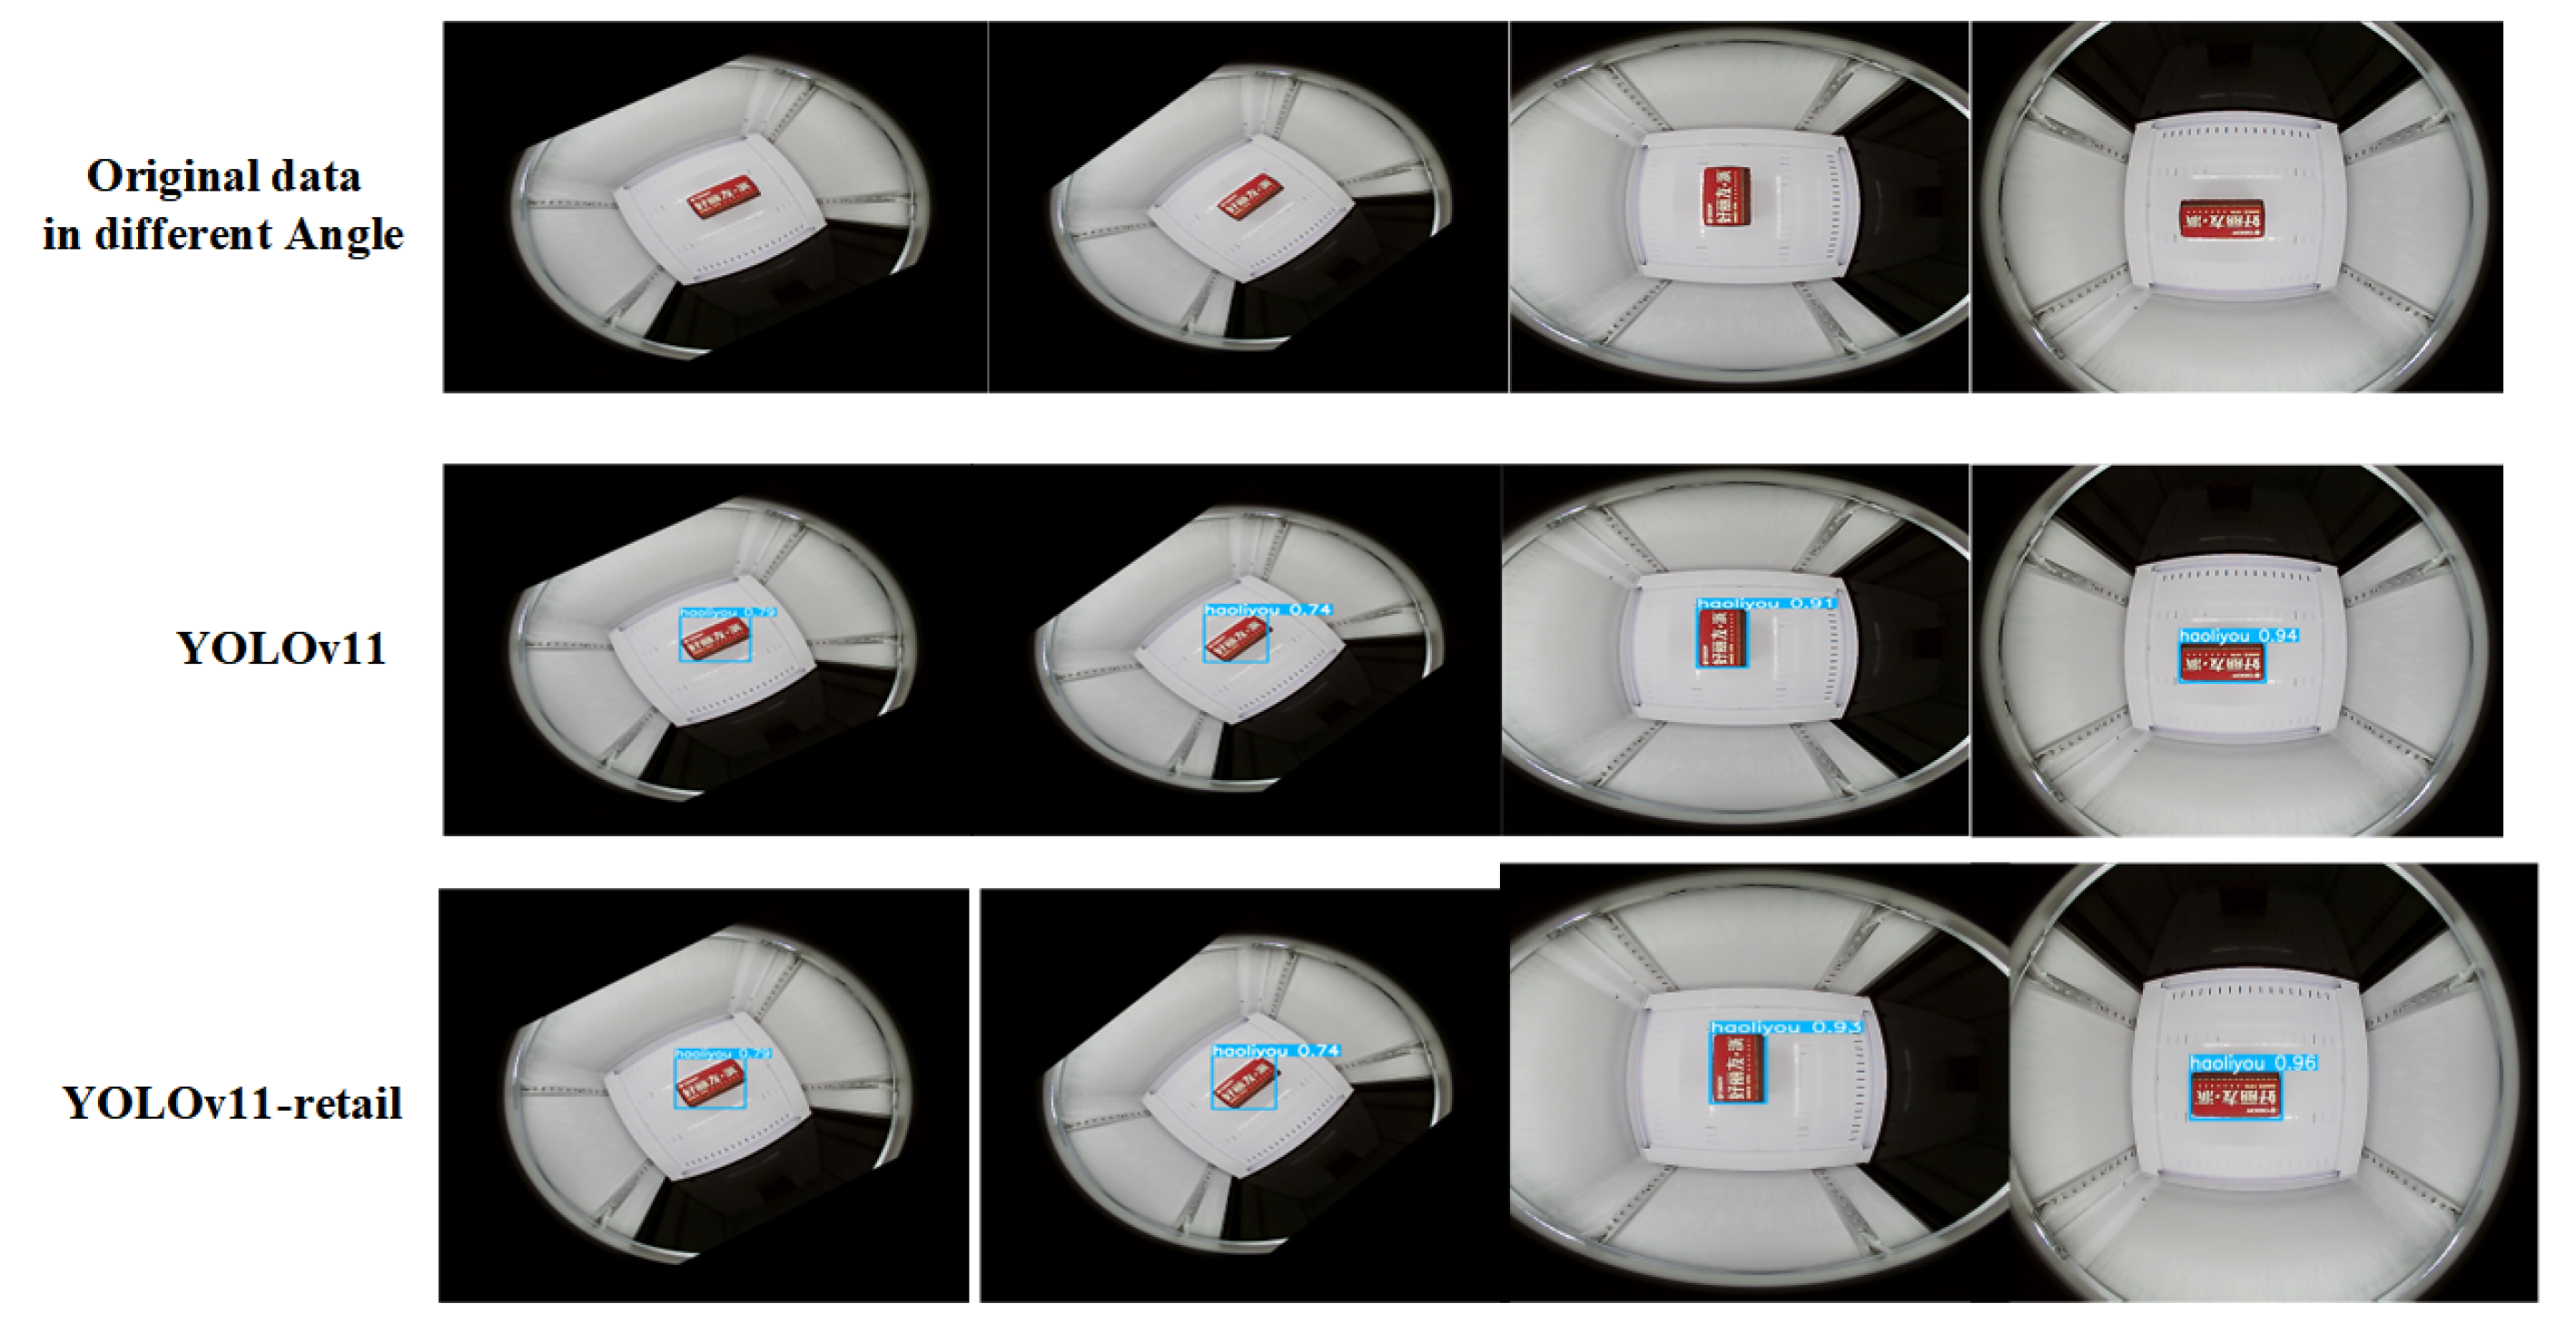
Detection results under different camera angles
As shown in
Figure 22, while confidence scores under varying camera angles show a slight decline compared to the original normal-angle scenarios, the overall detection performance remains robust. This robustness is attributed to image augmentation operations applied during dataset preprocessing, where diverse computer vision transformations (e.g., rotation and perspective shifts) are employed to enable the model to capture multi-angle features and enhance its generalization capability. Under the supervised learning framework, such design ensures adaptability to diverse testing environments, making the model suitable for practical deployment in unmanned retail cabinet transaction scenarios, including real-world production settings.
- 4.
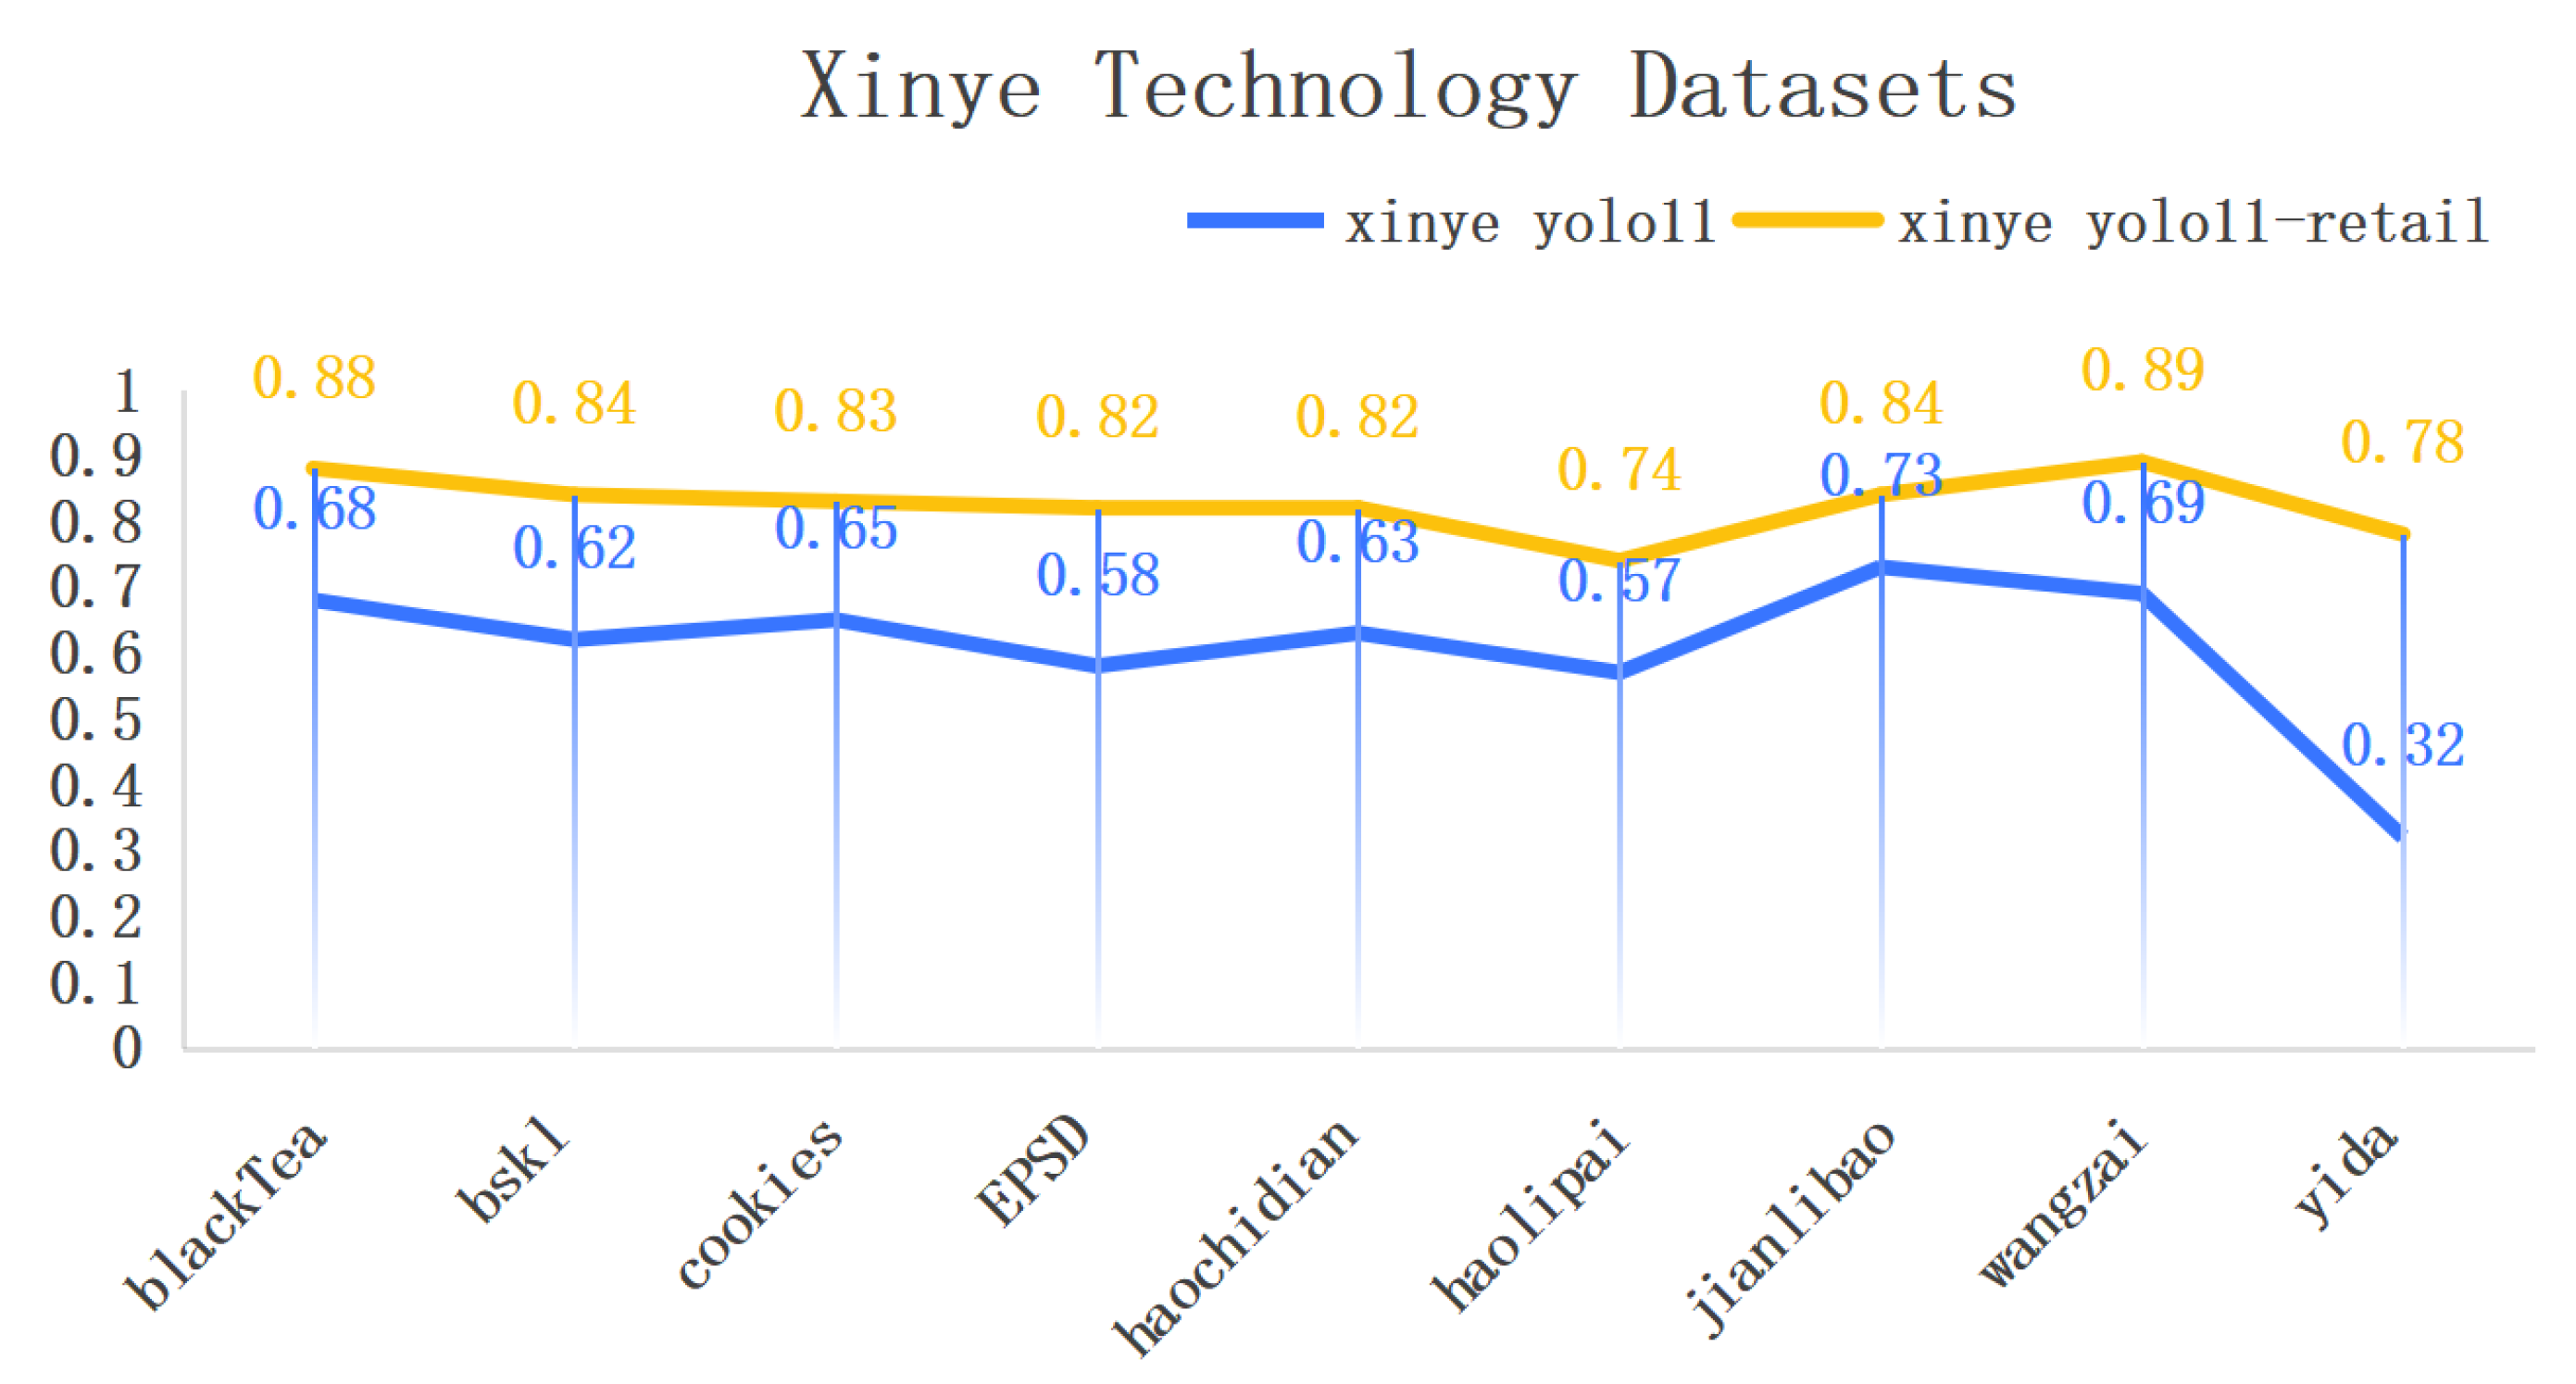
AP Comparison experiments for locally trained goods
To quantitatively analyze the average precision (AP) values for different merchandise categories, this study meticulously curated 100 image samples per product category to ensure the reliability and representativeness of comparative experiments. These samples encompass diverse real-world application scenarios, including variations in illumination conditions and viewing angles. Such dataset design aims to simulate real-world complexities, thereby effectively evaluating model performance under heterogeneous conditions.
Figure 23 and
Figure 24 details comparative experimental results between the baseline YOLOv11 model and the retail-optimized YOLOv11-retail model on a subset of test data. Comparative analysis demonstrates that the enhanced YOLOv11-retail achieves significant improvements in precision metrics over the original model. These results visually validate the efficacy of architectural refinements and further confirm the superior accuracy of the optimized model in merchandise recognition tasks. Building upon these preliminary findings, subsequent sections present experimental results on two widely recognized public datasets to substantiate their generalization capability and practical utility.
In the generalization comparative experiments on the RPC dataset, this study demonstrates that the optimized model achieves significant performance improvements in merchandise recognition tasks under varying illumination conditions. Furthermore, experiments on the Xinye Merchandise Dataset confirm the model’s ability to maintain high average precision (AP) across diverse product categories, validating its robust generalization capability in practical applications.
To summarize, the enhanced model exhibits superior performance in locally trained merchandise recognition tasks, reaffirming its high accuracy and generalizability while establishing a solid foundation for future commercial deployment.


 ,
, 


