Abstract
Hallux valgus is a common foot deformity. Traditional diagnosis mainly relies on X-ray images, which present radiation risks and require professional equipment, limiting their use in daily screening. In addition, in large-scale community screenings and resource-limited regions, where rapid processing of numerous patients is required, access to radiographic equipment or specialists may be constrained. Therefore, this study improves the MobileNetV3 model to automatically determine the presence of hallux valgus from digital foot photographs. In this study, we used 2934 foot photos from different organizations, combined with the segment anything model (SAM) to extract foot regions and replace the photo backgrounds to simulate different shooting scenarios, and used data enhancement techniques such as rotations and noise to extend the training set to more than 10,000 images to improve the diversity of the data and the model’s generalization ability. We evaluated several classification models and achieved over 95% accuracy, precision, recall, and F1 score by training the improved MobileNetV3. Our model offers a cost-effective, radiation-free solution to reduce clinical workload and enhance early diagnosis rates in underserved areas.
1. Introduction
Hallux valgus (HV) is a foot disease in which the angle of the joint between the thumb and the first metatarsal bone (also known as the “big toe”) is greater than or equal to 15 degrees. It is generally caused by a variety of conditions. Hallux valgus is a common foot deformity worldwide, with a global overall prevalence and incidence rate of 19%, which means that one in five people suffer from hallux valgus to varying degrees, and the incidence rate in women is as high as 23.74% [1]. As shown in Figure 1, Figure 1a represents HV, and Figure 1b represents a healthy foot. Clinically, X-rays are often used to determine the diagnosis and treatment plan for hallux valgus. However, X-rays have a certain radiation effect on the human body [2], and patients need to go to the hospital to take X-rays, which causes a lot of trouble. Therefore, if there is an easy-to-use method that can be used to initially screen for hallux valgus through non-radiographic photos, it will greatly improve the doctor’s work efficiency and reduce the patient’s pain and financial losses.
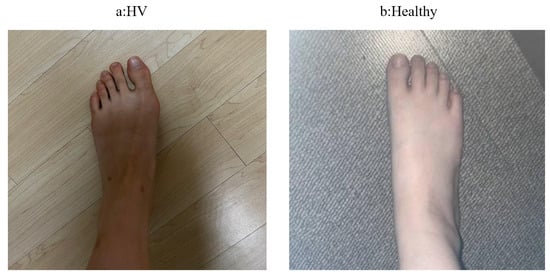
Figure 1.
Non-radioactive images of HV and healthy foot.
Medical imaging refers to the image information formed by the morphological or functional changes of substances (mainly cells) in various organisms, with the human body as the main research object. It includes the display of the anatomy, physiological processes, and pathological states of the subject, as well as the techniques and theoretical basis for quantitative analysis of these measurements [3]. With the development of science and technology, modern medicine has entered the era of computer-aided diagnosis and treatment. Medical image processing refers to the use of computers to simulate human visual functions and realize processes such as perception and recognition [4].
In recent years, deep learning [5], as an artificial intelligence algorithm, has been developing rapidly and has become one of the most advanced technologies. More and more people are beginning to try to apply it to medical-image-related problems, such as medical image segmentation, lesion localization, disease prediction, and so on. Its current application in medical images is becoming more and more widespread, greatly improving the work efficiency of medical staff [6,7,8].
However, due to the high cost of testing methods such as X-rays, CT scans, MRIs, and ultrasounds, in most cases medical imaging is manually operated by doctors, which leads to low efficiency in diagnosing diseases, and repetitive work can also affect the accuracy of manual judgments. Thus, this study aims to directly determine the presence of hallux valgus from non-radiographic foot images using an improved MobileNetV3. In our study, the training set contains more than 10,000 foot photos from multiple data sources after data enhancement, which provides sufficient data support for model training and performance improvement compared to existing studies. Furthermore, unlike traditional methods based on geometric analysis and manual labeling, the goal of this study is to construct a non-radiographic, economical, and efficient HV detection system. By combining a foot image dataset (including data enhancement techniques) with advanced deep learning methods, features in non-radiographic foot images can be automatically learned to achieve more efficient and more accurate HV detection.
At the same time, the practical utility of our approach lies in three key scenarios:
- Mass Screening Programs: In high-volume settings (e.g., school screenings, geriatric care facilities), automated HV detection can prioritize cases requiring urgent clinical evaluation, reducing manual triage efforts.
- Telemedicine for Remote Areas: Patients in rural or low-resource regions can self-capture foot images via mobile apps for preliminary assessment, minimizing travel costs and wait times.
- Longitudinal Monitoring: HV progression can be tracked in postoperative or at-risk patients through periodic photo uploads, avoiding repeated radiation exposure from X-rays.
These applications align with WHO recommendations for leveraging AI to bridge healthcare disparities [9].
2. Related Work
2.1. Research on Deep Learning in Medicine
Hayat et al. proposed a hybrid model combining EfficientNetV2, which is strong in local feature extraction, and Vision Transformer, which is strong in global information modeling, and its performance on the BreakHis dataset was satisfactory, which demonstrates its potential in breast cancer histology image classification, and at the same time provides a new idea for breast cancer histology image classification [10]. Chung et al. explored deep learning for proximal humeral fracture detection using flat shoulder anterior and posterior radiographs, which resulted in the ability to achieve 96% top-1 accuracy as well as high sensitivity and specificity in distinguishing between normal and fractured shoulders. In addition, the model was able to classify fracture types with significant accuracy, outperforming both general practitioners and orthopedic surgeons [11].
Of course, in the past few years, some scholars have also turned their attention to ordinary pictures, and have improved the prediction and diagnosis rates of diseases by combining traditional photos with deep learning. Protik et al. proposed a fully automated diabetic foot ulcer detection method based on a convolutional neural network (CNN) that scans ordinary foot photos to identify diabetic foot ulcers. This method uses a CNN model to capture the information contained in the foot image, which can then accurately distinguish between normal feet and feet with ulcers [12]. Image-based detection methods are superior in terms of accuracy and sensitivity and are especially suitable for resource-poor areas or long-distance diagnosis and treatment processes. They provide a convenient and low-cost tool for early screening of diseases.
2.2. Research About HV
HV is a common foot deformity, and the traditional diagnosis usually relies on radiographic images, where the severity of HV is assessed by a doctor manually measuring the hallux valgus angle (HVA). However, the manual measurement process is not only time consuming and laborious, but also easily affected by the experience of the operator, leading to subjective measurement results and consistency issues. Based on this, many studies have been devoted to automating the measurement of the hallux valgus angle in X-ray images to improve efficiency and reduce human error.
Kwolek et al. used a method combining deep learning with image processing to perform bone segmentation on X-ray images to obtain the HVA angle [13]. Yilmaz et al. also proposed a similar method, first using deep learning to extract key points, and then calculating the angle value based on the bone shape. Their results show that deep learning models can significantly reduce the workload of manual measurement and improve diagnostic efficiency [14]. In order to achieve more accurate diagnosis, Takeda et al. proposed a method based on deep convolutional neural networks (CNNs) on this basis (i.e., Automatic Estimation of Hallux Valgus Angle Using Deep Neural Network with Axis-Based Annotation). Xu et al. also established a corresponding deep learning database containing a large number of hallux valgus (X-ray) images, which provides a basis for data sharing and model improvement in the field [15]. Meanwhile, Kwolek et al. have developed an automated decision support system to assist physicians in formulating hallux valgus treatment strategies based on anteroposterior foot radiographs. This achievement not only reflects the importance of radiology in medical practice, but also further promotes the application of radiology in clinical decision making [16]. However, although the measurement method based on X-ray images is accurate, it is difficult to apply it in routine examinations or extensive screening work because it requires expensive professional imaging equipment, consumes a lot of time, and causes a certain amount of radiation damage to the human body.
In response to these problems, in recent years, scholars at home and abroad have proposed many methods for evaluating the HV angle using non-radiographic images to solve this problem, improve diagnostic efficiency, and reduce costs. Yamaguchi et al. and Nix et al. explored the application of non-radiographic imaging. These studies used self-photography to obtain foot photos and measured the HVA angle using traditional image processing techniques [17,18]. These methods have shown their reliability and effectiveness, but most of the current research still requires human participation, and only simple geometric knowledge is used to calculate the relevant data. The powerful feature learning ability of deep learning models cannot be fully utilized, so there are still deficiencies in terms of automation and detection accuracy. In addition, these methods have high requirements for the shooting angle and image quality, which leads to a lack of versatility in the entire process and makes it difficult to standardize. Therefore, their clinical application is limited.
In order to improve the automation of non-radiographic imaging methods, some researchers have begun to use deep learning techniques to automate the HV detection of non-radiographic images. Hida et al. used machine learning based on digital plantar foot photos to achieve a graded assessment of HV, providing an automated and convenient solution for non-radiographic HV detection [19]; Inoue et al. proposed a method using a deep convolutional neural network (DCNN) to directly calculate the HV parameters in foot photos, thereby replacing the measurement values on the X-ray image. It is demonstrated that the DCNN can convert non-radiological imaging of foot photos into results similar to radiological examinations, that is, similar diagnostic results can be obtained without the aid of radiological images [20].
Non-radiological imaging solutions based on deep learning have certain advantages. To some extent, they can automate the generation and classification of HV and reduce the need for radiological images, improving their convenience and practicality. However, the datasets used in the current work are relatively small and come from the same institution or individual patients, which limits the generalizability and accuracy of the model. At the same time, the lack of sufficient data support also hinders clinical application to some extent.
3. Materials and Methods
To address these challenges, we propose the TCBAM-enhanced MobileNetV3 with data augmentation method. We detail our approach in this section.
3.1. Neural Network
This paper proposes an improved method based on MobileNetV3. We replace the SE (squeeze and excitation) attention mechanism in the reverse residual block with a CBAM (convolutional block attention module). In contrast, the SE module can enhance features, but it only acts on the channel dimension and does not take into account information in the spatial dimension. The CBAM, on the other hand, combines spatial and channel information and is therefore more suitable for the detection of hallux valgus.
3.1.1. Overview of MobileNet V3
MobileNetV3 is a further optimization of MobileNetV1 and MobileNetV2 by Google [21,22], which additionally introduces SE and combines resource-constrained NAS with NetAdapt to design the most suitable network structures, large and small [23]. On this basis, MobileNetV3 also uses the HardSwish activation function, which can achieve better performance at a deeper level. Meanwhile, MobileNetV3, based on MobileNetV2, merges the last depth separable convolution module with the output convolution layer, advances the average pooling to reduce the feature size, and removes the 3 × 3 depth convolution layer that does not change the feature dimension. This greatly reduces the computational cost of the output layer, thereby improving the inference speed and efficiency of the model. Thanks to these improvements, MobileNetV3 is more suitable for low-computing-resource environments than other classification models. On mobile devices (such as mobile phones and embedded devices), MobileNetV3 can be used in real time, with a 25% improvement in inference speed. On the ImageNet classification task, MobileNetV3 achieves a Top-1 accuracy of 75.2% on ImageNet, while MobileNetV2 is 71.8%, an improvement of 3.4%.
3.1.2. Modification of SE to CBAM
The SE module attempts to improve the learning ability of the model by allowing the neural network to adaptively reallocate the channels through learning (i.e., dynamically recalibrate the channel features). In the MobileNetV3 model, the SE module performs average pooling on the feature maps output by each convolutional layer, and then passes the results of all four channels as input vectors to the fully connected layer (FC). The FC is used to calculate the importance of each channel, and then passes through another FC and is transformed by the hard sigmoid activation function to scale the importance of each channel to the interval [0, 1]. Finally, the coefficients of each channel importance are multiplied by the corresponding feature map of that channel and weighted, which makes the network adaptively focus on more important channels and suppress irrelevant or unimportant channels. The SE module can provide more effective channel recalibration, but it only operates along the channel dimension, ignoring the spatial dependence in the feature map. In medical images, this limitation is particularly problematic in tasks such as medical image analysis, where the spatial location of specific regions in the image is critical for accurate diagnosis.
To solve this problem, we propose replacing the SE module with the CBAM [24], which can simultaneously optimize feature representation by considering what to focus on and where to focus. This is also a more powerful attention mechanism that can operate in both the channel and spatial dimensions. The CBAM consists of two key components: the channel attention mechanism and the spatial attention mechanism. In the CBAM, the input is first processed by the channel attention mechanism, which first goes through global max pooling and global average pooling, and then goes through a fully connected layer and a sigmoid activation function to transform it. Finally, using the obtained attention weights, they are multiplied by each channel of the original feature map to obtain the attention-weighted channel feature map. Then, the channel attention-processed features are sent to the spatial attention mechanism for processing. First, max pooling and average pooling operations are performed along the channel dimension to generate features with different contextual scales. Then, the spatial attention weights are calculated through a convolutional layer. The spatial attention mechanism processes in the spatial dimension to identify which part of the spatial position in the input feature map is more important.
The CBAM is able to output a feature map weighted by both the channel attention mechanism and the spatial attention mechanism as the final result, which not only improves the representation ability of the model, but also improves its performance in various visual tasks. Figure 2 shows the workflow of the improved MobileNetV3 model. The raw pixels of the thumb-upward image are used as input, and the initial feature extraction is performed by a standard convolutional layer, using H-Swish as the activation function. The model uses a series of reverse residual blocks, each of which consists of a depth separable convolution and CBAM, to enhance feature extraction. Finally, a global average pooling layer (GAP) is used to spatially compress all channels, and a softmax layer is used to calculate the probability distribution of each class and output the predicted hallux valgus result.
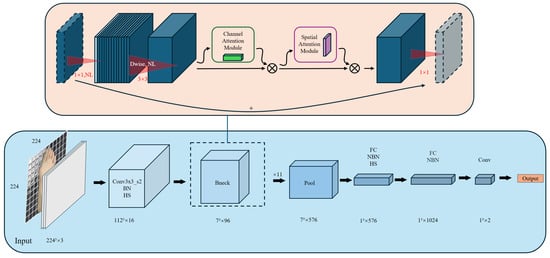
Figure 2.
Modified model process.
3.2. Dataset and Pre-Processing
To ensure the diversity and comprehensiveness of the data, covering different people and shooting conditions, we obtained these non-radiographic images of hallux valgus from different institutions and platforms for training. We collected a total of 2934 foot images, including 1843 images of people with hallux valgus and 1091 images of healthy feet. Among them, 900 HV images were provided by Beijing Tongren Hospital, Capital Medical University, and the remaining 2034 images were from the Roboflow platform (the world’s largest collection of open-source computer vision datasets). In order to better train and evaluate the model, we convert all images to 224 × 224 in size as the input of the model while maintaining the image features, which can reduce the consumption of computing resources while ensuring details. At the same time, the dataset is identified and labeled by medical experts to ensure the accuracy and reliability of the data used.
The backgrounds of some images in the dataset are too monotonous, and this may cause the model to mistakenly regard background information as useful features during the learning process, which affects the generalization ability and robustness of the model. To solve this problem, we used the segment anything model (SAM) to accurately extract the foot area [25]. Then, the extracted foot area was randomly replaced with different background images (see Figure 3) to simulate various real shooting scenarios, such as different lighting conditions, background colors, and environmental complexity. This process significantly increased the diversity of the data, enabling the model to maintain good performance in a wider range of application environments.

Figure 3.
Background replacement using the segment anything model.
In addition, in order to increase the generalizability of the model, we used rotate, flip, enhance brightness, add noise, and other data enhancement methods to expand the dataset, in order to improve data diversity. An example of applying these techniques to random images in the data enhancement can be seen in Figure 4. Through the data preprocessing and enhancement steps described above, the results provide a more complete picture of true performance and ensure that it can achieve high accuracy and good stability in practical applications. Note that since we use five-fold cross-validation, in each cross-validation iteration, the background replacement operation for the training set is dynamically generated by calling the segment anything model (SAM) in real time, and the validation set always remains the original unmodified data.
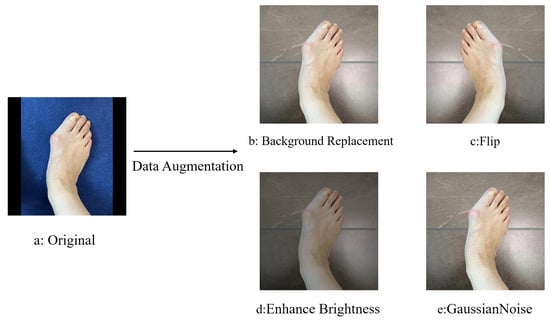
Figure 4.
Data enhancement.
3.3. Mobile Application Implementation
We developed a custom mobile app for the detection of HV from foot images. The app is designed as a convenient screening tool that can directly classify HV deformities based on patient foot photos. Its core functionality allows users (patients or clinicians) to take or upload an image of the foot, which is then analyzed by a trained deep learning model. The app provides users with a binary result (e.g., whether or not HV is present) and visual feedback in the form of text. The mobile solution is designed to make HV screening more convenient and immediate, without the need for specialised imaging equipment. Users can take a new photo of the foot using their smartphone camera or select an existing image of the foot from their device’s gallery. Once the image is obtained, the app uploads it to the server for analysis. Upon receipt of the image, the server resizes the segmented foot image to 224 × 224 pixels to match the input size requirements of the deep learning model, ensuring consistency with the images used to train the model. The model then processes the image and generates a classification output indicating the presence or absence of HV. Finally, the server returns the inference result to the mobile app in real time and presents it to the user in text form.
3.4. Training and Testing
To rigorously evaluate the effectiveness and generalization performance of the improved MobileNetV3 model, we employ five-fold cross-validation instead of a single train-validate-test separation. Specifically, we randomly divide the entire dataset into five equal-sized folds. In each iteration, one fold is used as the validation set, and the remaining four folds are used for training, at which point we perform the pre-processing mentioned in Section 3.2 on the training set. Data enhancement after folding does not result in data leakage. This process was repeated five times, once for each fold as the validation set.
For each round, we calculated key performance metrics including accuracy, precision, recall, F1 score, and AUC. the final reported results are expressed as the mean ± standard deviation (SD) of all five folds. This cross-validation approach provides more robust and statistically reliable estimates of model performance while minimizing the impact of potentially favorable or biased splits. It also effectively reduces the risk of overfitting or data leakage that can easily result from single-split evaluations and increases the model’s ability to generalize to the real world.
3.5. Software Environment
A NVIDIA GeForce RTX 4090 (Manufacturer: NVIDIA Corporation, Santa Clara, CA, USA) graphics card and 24G video memory are used to conduct segmentation experiments on the public platform PyTorch. The system is built using Python 3.7.16 (Python Software Foundation, Wilmington, NC, USA) and PyTorch 2.5.1.
3.6. Evaluation of the Model
Evaluating the proposed network structure as well as some of the now mainstream classification structures, we compute the following performance measures.
where TP: true positives, TN: true negatives, FP: false positives, FN: false negatives, , and .
In addition, we have introduced the loss standard deviation to assess the stability of the model in ablation experiments.
These criteria can be used to evaluate the modified MobileNetV3 model.
4. Results
We conducted a comprehensive evaluation of the improved MobileNetV3 model’s effectiveness in detecting hallux valgus (HV) in foot images using an expanded dataset and multiple metrics. Over 100 epochs, we compared several models, including VGG-16, ResNet, AlexNet, DenseNet, EfficientNet, MobileViTv2, MobileNetV3, and MobileNetV2. The final performance metrics (accuracy, precision, recall, and F1 score) were calculated as the mean ± standard deviation across all five folds, ensuring a robust and statistically reliable evaluation of generalization ability. These metrics collectively assess a model’s ability to correctly classify data, balancing overall accuracy, false positives, false negatives, and the trade-off between precision and recall. Table 1 presents the results of our testing. The improved MobileNetV3 achieved accuracy, precision, recall, and F1 score values of 95.52%, 95.51%, 95.53%, and 95.53%, respectively. Figure 5 provides a graphical representation of these results, intuitively demonstrating that the improved MobileNetV3 model’s performance has been enhanced and that it has achieved the best results among the compared models. Although the accuracy of MobileViTv2 and the improved MobileNetV3 model were not very different from each other, in computational complexity, the FLOPs and parameters of MobileViTv2 are much larger than the improved MobileNetV3 model, which requires a certain amount of computing power on the user’s device and causes slightly higher latency, resulting in a poor user experience. The improved MobileNetV3 model did not significantly increase in terms of floating-point operations (FLOPs) and parameters compared to the original MobileNetV3. The integration of the CBAM has significantly improved MobileNetV3’s overall classification performance without a substantial increase in computational cost.

Table 1.
Results of different network models for target detection on a test set. : replaces SE with CBAM.
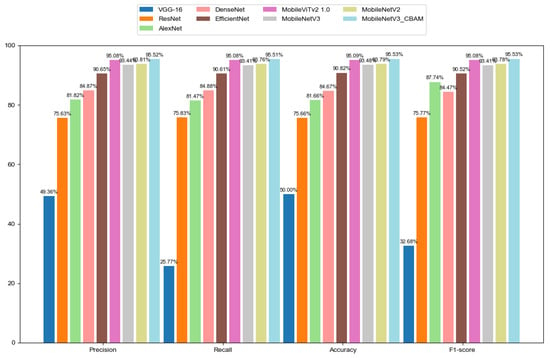
Figure 5.
Comparison of models.
To isolate the contributions of the CBAM module and background augmentation, we conducted an ablation study with four model variants (Table 2). Replacing SE with CBAM (Variant 1) improved accuracy by 2.08% over the baseline (93.44% → 95.52%), demonstrating the CBAM’s ability to leverage both spatial and channel attention for precise feature localization. Removing background augmentation from the CBAM model (Variant 2) resulted in a 2.12% performance drop (95.52% → 93.40%), underscoring the importance of synthetic background diversity for generalization. Notably, even without augmentation, CBAM outperformed the SE baseline by 2.65% (93.40% vs. 90.75%), further validating its architectural superiority. The computational cost of CBAM remained minimal, with only a 1.72 M increase in FLOPs and no additional parameters.

Table 2.
Ablation study on CBAM and data augmentation. ΔAccuracy: performance change relative to the best variant (Variant 1). Data Augmentation †: includes background replacement (via SAM), rotation, flipping, brightness adjustment, and noise addition. “No” indicates removal of background replacement.
Through ablation experiments, we verified the effectiveness of the CBAM in enhancing the model’s ability to focus on important features in space, while the SE module, although it has certain advantages in reducing computational overhead, is still inferior in performance to CBAM. Overall, MobileNetV3+CBAM achieves a good balance between performance and computational complexity. The CBAM significantly improves the performance of MobileNetV3 and is suitable for tasks that require high accuracy.
To further validate the model’s generalizability, we conducted a site-held-out test where the model was trained exclusively on publicly available data (Roboflow HV images and online healthy images) and tested on an independent clinical dataset from Beijing Tongren Hospital. As shown in Table 3, the model achieved 95.23% accuracy and 0.9976 AUC on the hospital test set, demonstrating only a marginal performance drop compared to the mixed-data evaluation (95.52% accuracy, 0.9983 AUC). This minimal discrepancy (Accuracy: −0.29%, AUC: −0.0007) suggests that while domain shifts between clinical and online images exist (e.g., standardized hospital lighting vs. heterogeneous backgrounds), the proposed SAM-based data augmentation and CBAM attention mechanism effectively mitigate their impact. The retained high performance (>95% across all metrics) underscores the model’s practical utility in real-world clinical workflows, particularly for large-scale screenings requiring consistent cross-institutional reliability.

Table 3.
Cross-domain generalization performance comparison (MobileNetV3+CBAM). Mixed (All) †: The training data contain HV images from Tongren Hospital, HV images from Public images, and healthy images; the test set is a randomly retained 20% sample from the mixed data. Tongren ‡: The test set is completely independent and contains HV images from Tongren Hospital and additional healthy images to ensure no overlap with the training set.
Finally, in order to validate that the proposed model is focusing on medically relevant features rather than spurious background artifacts or skin tone, we employed visual explanation techniques using Grad-CAM and XGrad-CAM. As shown in Figure 6, the highlighted activation regions clearly concentrate around the first metatarsophalangeal joint area—the clinically significant region for hallux valgus detection. These visualizations demonstrate that the model effectively learns to localize and attend to the deformity site associated with HV, instead of relying on irrelevant background patterns, lighting, or color distribution. This suggests a high level of interpretability and anatomical consistency in the model’s decision-making process, which is essential for clinical trust and deployment.
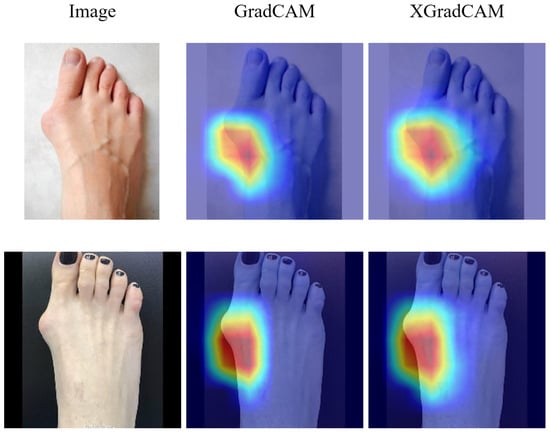
Figure 6.
The Grad-CAM and XGrad-CAM visualisation results.
At the same time, we successfully deployed the model and successfully applied it to the app, as shown in Figure 7.
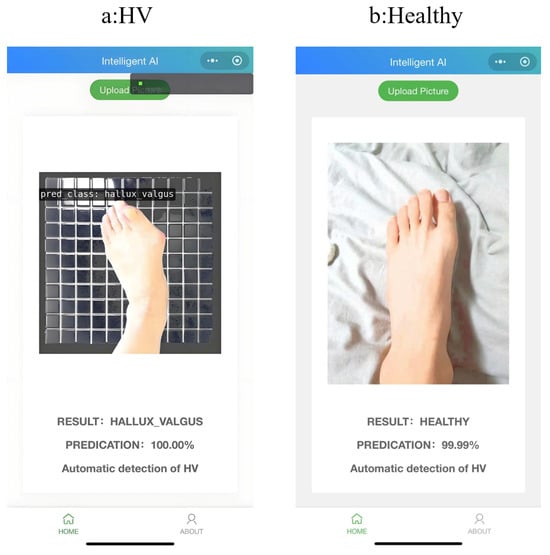
Figure 7.
Mobile application implementation.
5. Conclusions
This paper proposes an improved MobileNetV3 model for the detection and diagnosis of hallux valgus in photographs. Instead of expensive X-ray images and time-consuming manual detection, the method we studied uses a deep learning model to detect the presence of hallux valgus in ordinary non-radioactive photographs. The improved MobileNetV3 model takes the original pixels of the image as input. In the reverse residual block, we replace the SE attention mechanism with the CBAM attention mechanism. The spatial attention of CBAM automatically learns to focus on the deformed area near the big toe, rather than spreading the attention to the entire foot, which greatly improves the output prediction results. The improved model outperforms the MobileNetV3 model and other classification models, with an accuracy of 95.52% in detecting hallux valgus from photographs, demonstrating its viability for (1) mass screening in community health campaigns, (2) telemedicine platforms serving remote populations, and (3) longitudinal monitoring of at-risk individuals. For future work, we will integrate this tool with electronic health records and validate its clinical impact through multi-center trials.
Author Contributions
Conceptualization, P.L., D.W., Y.P. and H.W.; Methodology, X.F., D.W. and Y.P.; Software, X.F.; Validation, X.F.; Formal analysis, D.W. and Y.P.; Investigation, X.F.; Data curation, P.L.; Writing—original draft, X.F.; Writing—review & editing, D.W. and Y.P.; Supervision, H.W.; Project administration, H.W. All authors have read and agreed to the published version of the manuscript.
Funding
This research received no external funding.
Data Availability Statement
The dataset used in this research is publicly available at the https://universe.roboflow.com/ (accessed on 27 May 2025). Part of our dataset comes from Beijing Tongren Hospital, so this part of the data is not publicly available.
Conflicts of Interest
Author Pengfei Li was employed by the Beijing Tongren Hospital. The remaining authors declare that the research was conducted in the absence of any commercial or financial relationships that could be construed as a potential conflict of interest.
References
- Nix, S.; Smith, M.; Vicenzino, B. Prevalence of hallux valgus in the general population: A systematic review and meta-analysis. J. Foot Ankle Res. 2010, 3, 1–9. [Google Scholar] [CrossRef] [PubMed]
- Taqi, A.; Faraj, K.; Zaynal, S. The effect of long-term X-ray exposure on human lymphocyte. J. Biomed. Phys. Eng. 2019, 9, 127. [Google Scholar] [CrossRef]
- Hussain, S.; Mubeen, I.; Ullah, N.; Shah, S.S.U.D.; Khan, B.A.; Zahoor, M.; Ullah, R.; Khan, F.A.; Sultan, M.A. Modern diagnostic imaging technique applications and risk factors in the medical field: A review. BioMed Res. Int. 2022, 2022, 5164970. [Google Scholar] [CrossRef] [PubMed]
- Suzuki, K. Overview of deep learning in medical imaging. Radiol. Phys. Technol. 2017, 10, 257–273. [Google Scholar] [CrossRef] [PubMed]
- LeCun, Y.; Bengio, Y.; Hinton, G. Deep learning. Nature 2015, 521, 436–444. [Google Scholar] [CrossRef]
- Liu, X.; Song, L.; Liu, S.; Zhang, Y. A review of deep-learning-based medical image segmentation methods. Sustainability 2021, 13, 1224. [Google Scholar] [CrossRef]
- Khan, M.A.; Muhammad, K.; Sharif, M.; Akram, T.; Kadry, S. Intelligent fusion-assisted skin lesion localization and classification for smart healthcare. Neural Comput. Appl. 2024, 36, 37–52. [Google Scholar] [CrossRef]
- Mahajan, P.; Uddin, S.; Hajati, F.; Moni, M.A. Ensemble learning for disease prediction: A review. Healthcare 2023, 11, 1808. [Google Scholar] [CrossRef]
- Global strategy on digital health 2020–2025. Available online: https://www.who.int/publications/i/item/9789240020924 (accessed on 27 May 2025).
- Hayat, M.; Ahmad, N.; Nasir, A.; Tariq, Z.A. Hybrid Deep Learning EfficientNetV2 and Vision Transformer (EffNetV2-ViT) Model for Breast Cancer Histopathological Image Classification. IEEE Access 2024, 12, 184119–184131. [Google Scholar] [CrossRef]
- Chung, S.W.; Han, S.S.; Lee, J.W.; Oh, K.S.; Kim, N.R.; Yoon, J.P.; Kim, J.Y.; Moon, S.H.; Kwon, J.; Lee, H.J.; et al. Automated detection and classification of the proximal humerus fracture by using deep learning algorithm. Acta Orthop. 2018, 89, 468–473. [Google Scholar] [CrossRef] [PubMed]
- Protik, P.; Atiqur Rahaman, G.; Saha, S. Automated detection of diabetic foot ulcer using convolutional neural network. In Proceedings of the Fourth Industrial Revolution and Beyond: Select Proceedings of IC4IR+, Dhaka, Bangladesh, 10–11 December 2021; Springer: Singapore, 2023; pp. 565–576. [Google Scholar]
- Kwolek, K.; Liszka, H.; Kwolek, B.; Gądek, A. Measuring the angle of hallux valgus using segmentation of bones on X-ray images. In Proceedings of the Artificial Neural Networks and Machine Learning—ICANN 2019: Workshop and Special Sessions: 28th International Conference on Artificial Neural Networks, Munich, Germany, 17–19 September 2019; Springer: Berlin/Heidelberg, Germany, 2019; pp. 313–325. [Google Scholar]
- Yılmaz, D.; Aydın, H.; Alp, E.; Çaviş, T.; Sunamak, B.; Turgut, R.; Kaynakcı, E. Automatic Calculation of Hallux Valgus Angle with Image Processing and Deep Learning. In Proceedings of the International Conference on Advanced Technologies (ICAT’22), Van, Türkiye, 25–27 November 2022. [Google Scholar]
- Xu, N.; Song, K.; Xiao, J.; Wu, Y. A Dataset and Method for Hallux Valgus Angle Estimation Based on Deep Learing. In Proceedings of the 2022 7th International Conference on Intelligent Computing and Signal Processing (ICSP), Xi’an, China, 15–17 April 2022; pp. 34–40. [Google Scholar]
- Kwolek, K.; Gądek, A.; Kwolek, K.; Kolecki, R.; Liszka, H. Automated decision support for Hallux Valgus treatment options using anteroposterior foot radiographs. World J. Orthop. 2023, 14, 800. [Google Scholar] [CrossRef] [PubMed]
- Yamaguchi, S.; Sadamasu, A.; Kimura, S.; Akagi, R.; Yamamoto, Y.; Sato, Y.; Sasho, T.; Ohtori, S. Nonradiographic measurement of hallux valgus angle using self-photography. J. Orthop. Sport. Phys. Ther. 2019, 49, 80–86. [Google Scholar] [CrossRef] [PubMed]
- Nix, S.; Russell, T.; Vicenzino, B.; Smith, M. Validity and reliability of hallux valgus angle measured on digital photographs. J. Orthop. Sport. Phys. Ther. 2012, 42, 642–648. [Google Scholar] [CrossRef] [PubMed]
- Hida, M.; Eto, S.; Wada, C.; Kitagawa, K.; Imaoka, M.; Nakamura, M.; Imai, R.; Kubo, T.; Inoue, T.; Sakai, K.; et al. Development of hallux valgus classification using digital foot images with machine learning. Life 2023, 13, 1146. [Google Scholar] [CrossRef] [PubMed]
- Inoue, K.; Maki, S.; Yamaguchi, S.; Kimura, S.; Akagi, R.; Sasho, T.; Ohtori, S.; Orita, S. Estimation of the Radiographic Parameters for Hallux Valgus from Photography of the feet using a deep convolutional neural network. Cureus 2024, 16, e65557. [Google Scholar] [CrossRef] [PubMed]
- Howard, A.G.; Zhu, M.; Chen, B.; Kalenichenko, D.; Wang, W.; Weyand, T.; Andreetto, M.; Adam, H. Mobilenets: Efficient convolutional neural networks for mobile vision applications. arXiv 2017, arXiv:1704.04861. [Google Scholar]
- Sandler, M.; Howard, A.; Zhu, M.; Zhmoginov, A.; Chen, L.C. Mobilenetv2: Inverted residuals and linear bottlenecks. In Proceedings of the IEEE Conference on Computer Vision and Pattern Recognition, Salt Lake City, UT, USA, 18–23 June 2018; pp. 4510–4520. [Google Scholar]
- Howard, A.; Sandler, M.; Chu, G.; Chen, L.C.; Chen, B.; Tan, M.; Wang, W.; Zhu, Y.; Pang, R.; Vasudevan, V.; et al. Searching for mobilenetv3. In Proceedings of the IEEE/CVF international Conference on Computer Vision, Seoul, Republic of Korea, 27–28 October 2019; pp. 1314–1324. [Google Scholar]
- Woo, S.; Park, J.; Lee, J.Y.; Kweon, I.S. Cbam: Convolutional block attention module. In Proceedings of the European Conference on Computer Vision (ECCV), Munich, Germany, 8–14 September 2018; pp. 3–19. [Google Scholar]
- Kirillov, A.; Mintun, E.; Ravi, N.; Mao, H.; Rolland, C.; Gustafson, L.; Xiao, T.; Whitehead, S.; Berg, A.C.; Lo, W.Y.; et al. Segment anything. In Proceedings of the IEEE/CVF International Conference on Computer Vision, Paris, France, 2–3 October 2023; pp. 4015–4026. [Google Scholar]
- Simonyan, K.; Zisserman, A. Very deep convolutional networks for large-scale image recognition. arXiv 2014, arXiv:1409.1556. [Google Scholar]
- He, K.; Zhang, X.; Ren, S.; Sun, J. Deep residual learning for image recognition. In Proceedings of the IEEE Conference on Computer Vision and Pattern Recognition, Las Vegas, NV, USA, 27–30 June 2016; pp. 770–778. [Google Scholar]
- Krizhevsky, A.; Sutskever, I.; Hinton, G.E. Imagenet classification with deep convolutional neural networks. Adv. Neural Inf. Process. Syst. 2012, 25, 84–90. [Google Scholar] [CrossRef]
- Huang, G.; Liu, Z.; Van Der Maaten, L.; Weinberger, K.Q. Densely connected convolutional networks. In Proceedings of the IEEE Conference on Computer Vision and Pattern Recognition, Honolulu, HI, USA, 21–26 July 2017; pp. 4700–4708. [Google Scholar]
- Tan, M.; Le, Q. Efficientnet: Rethinking model scaling for convolutional neural networks. In Proceedings of the International Conference on Machine Learning, PMLR, Long Beach, CA, USA, 9–15 June 2019; pp. 6105–6114. [Google Scholar]
Disclaimer/Publisher’s Note: The statements, opinions and data contained in all publications are solely those of the individual author(s) and contributor(s) and not of MDPI and/or the editor(s). MDPI and/or the editor(s) disclaim responsibility for any injury to people or property resulting from any ideas, methods, instructions or products referred to in the content. |
© 2025 by the authors. Licensee MDPI, Basel, Switzerland. This article is an open access article distributed under the terms and conditions of the Creative Commons Attribution (CC BY) license (https://creativecommons.org/licenses/by/4.0/).