Article

Support Vector Machines with Hyperparameter Optimization Frameworks for Classifying Mobile Phone Prices in Multi-Class

1
Department of Information Management, National Chi Nan University, 1 University Rd., Puli, Nantou 54561, Taiwan
2
PhD Program in Strategy and Development of Emerging Industries, National Chi Nan University, 1 University Rd., Puli, Nantou 54561, Taiwan
*
Author to whom correspondence should be addressed.
Electronics 2025, 14(11), 2173; https://doi.org/10.3390/electronics14112173
Submission received: 21 March 2025 / Revised: 19 May 2025 / Accepted: 23 May 2025 / Published: 27 May 2025
(This article belongs to the Special Issue Data-Centric Artificial Intelligence: New Methods for Data Processing)

Abstract

Accurately predicting mobile phone prices is essential for improving consumer decision-making, supporting business strategies, and enhancing market transparency. However, studies on improving the performance of multi-class classification models by using hyperparameter selection frameworks are limited. Thus, this study aims to develop a mobile phone price classification model by integrating support vector machines (SVM) with two advanced hyperparameter optimization (HPO) frameworks, namely Hyperopt (HYP) and Optuna (OPT), for hyperparameter determination to increase classification accuracy. A public dataset with various training and testing conditions is used by presented models, namely SVMHYP and SVMOPT models. Numerical results indicate that the developed models outperform results from the previous literature in terms of classification accuracy. Furthermore, a 5-fold cross-validation strategy is performed to examine generalizability and robustness of the presented multi-classification models. These findings highlight the effectiveness of combining SVM with HPO as a robust solution for mobile phone price prediction.

1. Introduction

The rapid growth of the smartphone market and continuous technological innovation are driving the diversification of consumer demand. According to an analysis by Mordor Intelligence, the global smartphone market is expected to grow further. This growth is fueled not only by advancements in communication technology but also by the integration of Artificial Intelligence (AI) and Augmented Reality (AR) technologies. The widespread adoption of 5G technology is expected to unlock even greater growth potential for the smartphone market [1]. Smartphones have evolved into multifunctional devices, spanning communication, entertainment, education, and business applications, making them indispensable tools in consumers’ daily lives. Given the immense commercial value of the smartphone market, accurately predicting mobile phone prices offers several benefits. It can assist consumers in making informed purchasing decisions, support businesses in developing effective sales strategies, enhance market analysis and positioning, and improve market transparency. This transparency enables both consumers and businesses to better understand product value, fostering a fair and competitive market environment.
The pricing of mobile phones is significantly influenced by their technical specifications, which not only impact production costs but also play a pivotal role in consumer decision-making. The Kaggle “Mobile Price Classification” dataset [2], comprising 20 technical specifications, has been widely utilized in studies investigating mobile price prediction. Table 1 summarizes 12 relevant studies [3,4,5,6,7,8,9,10,11,12,13,14], detailing their dataset split ratios, machine learning models employed, hyperparameter optimization (HPO) methods, and accuracy results. Most studies adopted conventional dataset split ratios, such as 70% training, 30% testing or 80% training, 20% testing, while a few did not clearly specify their data partitioning methods. Notably, Zhang et al. [13] was the only study to implement a three-way split, dividing the data into 70% for training, 15% for validation, and 15% for testing, which contributed to a relatively high-quality model with an accuracy of 95.5%. However, the majority of studies relied on traditional splitting methods, with limited application of advanced evaluation techniques like cross-validation, highlighting an area for improvement. The range of machine learning methods spans from simple and easily implemented linear models to highly complex deep learning models, showcasing the diversity of techniques used to address the challenge of mobile price classification. Popular models included support vector machines (SVM), Random Forest (RF), Decision Trees (DT), Logistic Regression (LR), and K-Nearest Neighbors (KNN). Some studies explored the models based on gradient-boosting methods, such as Gradient Boosting (GB) [4], and eXtreme Gradient Boosting (XGBoost) [13]. Among these, SVM consistently dominated with high accuracy across multiple studies. However, most studies did not specify their HPO methods for hyperparameter tuning, excluding trial-and-error [6], Grid Search [5], and a Dung Beetle Optimizer (DBO) algorithm [13]. The insufficient use of advanced HPO techniques likely limited the models’ potential, leaving considerable room for performance improvement. From the research reviewed, most studies achieved accuracy levels between 90% and 97%, with the highest accuracy of 98% reported by Sunariya et al. [14] using an SVM model that focused on feature selection guided by dimensionality reduction and correlation analysis. Despite this high accuracy, they did not provide detailed information on their dataset partitioning or HPO strategies. This lack of transparency raises concerns about the robustness and reproducibility of the results, suggesting that there is untapped potential for further improving model performance [15].
The primary objective of this study is to develop a more accurate mobile phone price classification model and further enhance its performance using hyperparameter optimization frameworks. In machine learning, classification tasks are among the most common and widely applied problems across various fields and applications. These tasks aim to map input data to predefined categories or labels that are meaningful and well-defined. Classification problems can generally be categorized into two types based on the number of output categories: binary classification and multi-class classification. Binary classification involves two types of targets, whereas multi-class classification deals with targets of more than two types.
The support vector machine method is a widely used method in machine learning, known for its effectiveness in classification, regression, and anomaly detection tasks. It has been successfully applied to both binary classification problems [16,17,18,19,20] and multi-class classification tasks [20,21,22,23,24,25,26,27,28,29,30,31,32,33]. Given the crucial role of hyperparameter optimization in enhancing model performance and adapting to diverse data characteristics [17,19], it becomes even more critical in the context of multi-class classification, where SVM is inherently more complex and sensitive to hyperparameter settings. Utilizing HPO frameworks can significantly reduce the manual effort required for tuning and helps ensure that the multi-class SVM model effectively captures complex data patterns, thereby improving both prediction accuracy and model robustness.
Two advanced HPO frameworks, Hyperopt [34,35] and Optuna [36], have been widely and successfully applied in optimizing machine learning and deep learning models across various domains. In this study, the effectiveness of applying advanced HPO frameworks to multi-class SVM models was investigated. Recent studies have explored the use of Hyperopt [37] and Optuna [38,39] in multi-class SVM applications. However, the related investigations are relatively limited in the current literature, highlighting both the novelty and practical relevance of this study. This study addresses the gap by leveraging Optuna and Hyperopt in a multi-class classification context. In addition, the cross-validation was conducted in this study to demonstrate the generalizability and robustness of classification results.
The remainder of this paper is structured as follows: Section 2 details the SVM method with HPO frameworks; Section 3 introduces the architecture for mobile phone price prediction; Section 4 presents numerical results and discussions; and Section 5 concludes with key insights and future research directions.

2. Support Vector Machines (SVM) with Hyperparameter Optimization Framework

The main objective of this study is to predict mobile phone price using multi-class classification SVM models with hyperparameter optimization frameworks including Optuna and Hyperopt. This section introduces the SVM model along with hyperparameter optimization frameworks.

2.1. Support Vector Machines

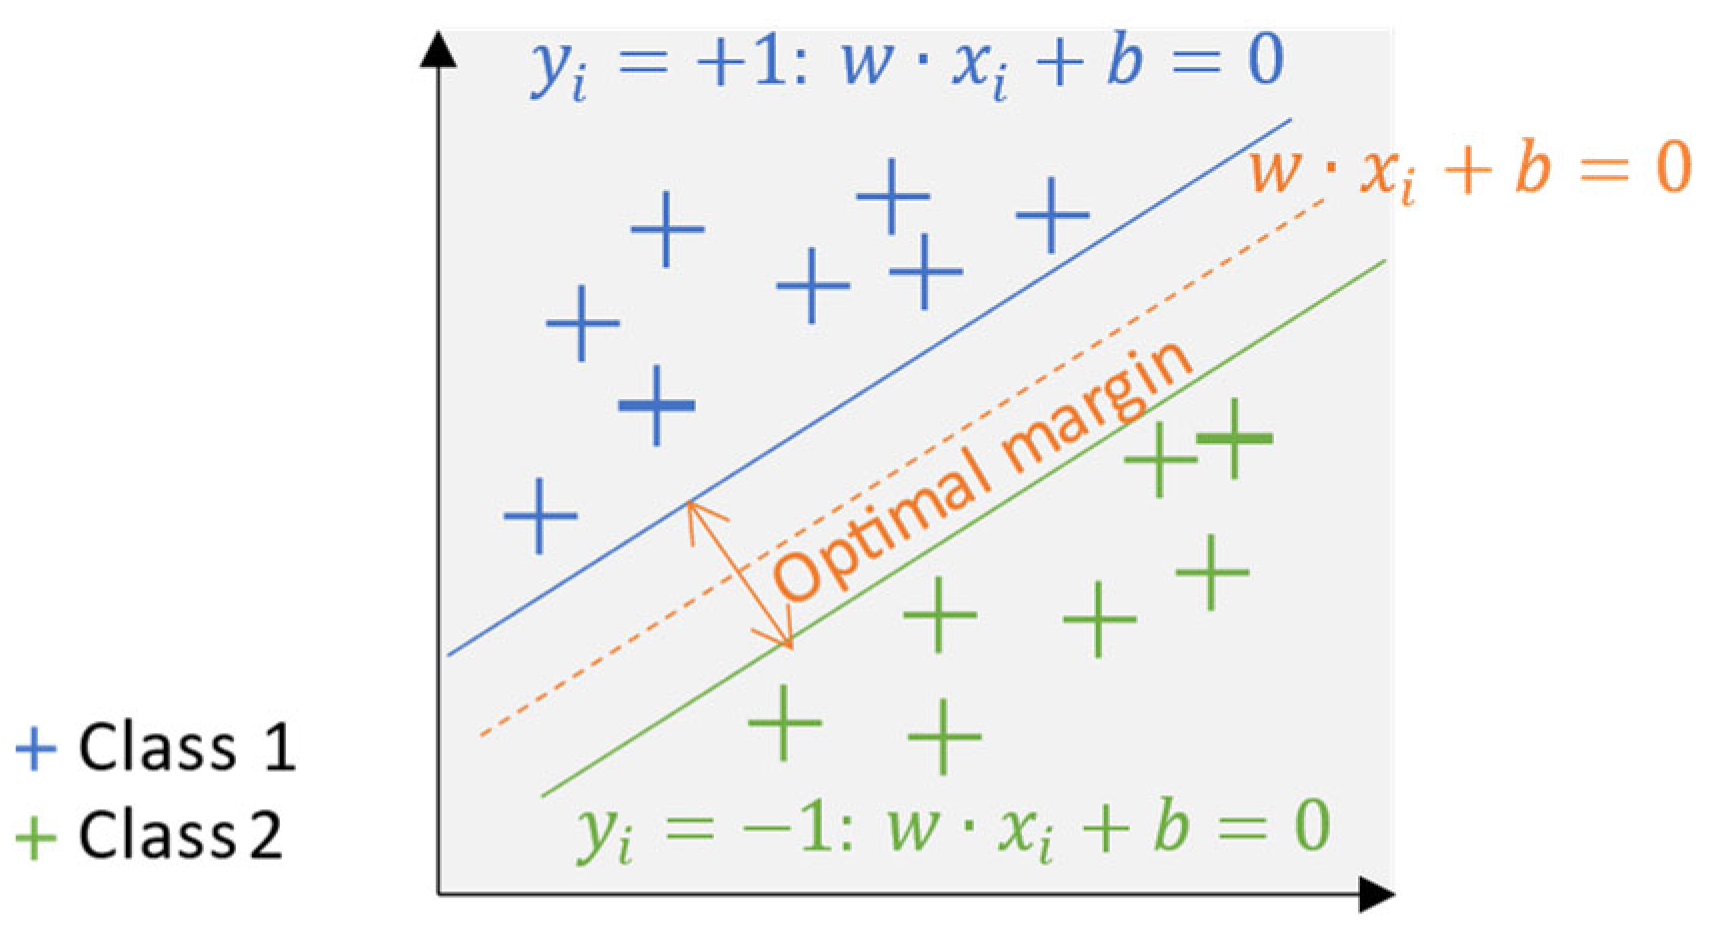
Support vector machine [40] is a supervised learning algorithm widely used for both classification and regression tasks. The fundamental principle of SVM lies in identifying an optimal hyperplane that separates data points belonging to different classes while maximizing the margin between them. In two-dimensional space, this hyperplane manifests as a straight line, whereas, in higher-dimensional spaces, it generalizes to a hyperplane. The primary objective of SVM is to maximize this margin, thereby ensuring robust classification performance [41,42]. Given a set of training data, where each data point is associated with a class label, the primary goal is to identify a hyperplane that separates data points belonging to different classes. For linearly separable data, a hyperplane exists that can perfectly classify the data points, as illustrated in the SVM classification shown in Figure 1 for linearly separable data. The objective in this scenario is to determine the optimal hyperplane that maximizes the margin between the classes, thereby improving classification performance. In contrast, when the data are linearly non-separable, meaning no hyperplane can perfectly separate data points from different classes, a method called the “Kernel Trick” can be applied. This approach maps the original data into a higher-dimensional feature space, where the data becomes linearly separable. By applying this transformation, a hyperplane can be identified in the transformed space to achieve effective separation, as illustrated in Figure 2 SVM with kernel trick for nonlinearly separable data. The choice of kernel function, such as polynomial or radial basis function (RBF), plays a crucial role in determining the success of this transformation and subsequent classification accuracy.
Figure 3 visually illustrates the fundamental concepts and mathematical principles underlying SVM, including classification margin, hyperplane, and mathematical description. Given a set of training data x 1 , y 1 , x 2 , y 2 , …, x n , y n , where x i R d represents a feature vector, and y i 1 , + 1 represents the class label. The objective of SVM is to find an optimal hyperplane, w · x i + b = 0 , that correctly separates data points of different classes and maximizes the margin between them. To achieve this, SVM enforces the following condition for all i, as shown in Equation (1):
y i w · x i + b 1 ,           i
where w R d is the normal vector that defines the direction and slope of the hyperplane, and b R is the bias term that determines the position of the hyperplane.
To find the optimal hyperplane, the objective is to maximize the margin between the hyperplane and the support vectors. This can be reformulated as minimizing the norm of the normal vector w. The resulting optimization problem is expressed in Equation (2):
m i n i m i z e 1 2 w 2
Subject to the constraint shown in Equation (3):
y i w · x i + b 1 ,               i
where 1 2 w 2 is the objective function, aiming to minimize the norm of the normal vector w and thereby maximize the margin of separation between classes. In Figure 3, the red line represents the hyperplane w · x i + b = 0 , which separates the two classes, while the dashed blue and green lines ( y i = + 1 :   w · x i + b 1 and   y i = 1 :   w · x i + b 1 ) denote the boundaries of the margin. The red double-arrow highlights the margin width, and the blue and green points indicate the two classes.
Several key hyperparameters influence SVM performance and generalization, including the regularization parameter C, the kernel function, the kernel coefficient γ (gamma), and the decision function shape (DF_S). The regularization parameter C controls the trade-off between maximizing the margin and minimizing classification errors. A larger C improves data fit but may lead to overfitting. The kernel function transforms the input space into a higher-dimensional feature space, making the data linearly separable. Common kernel functions include the linear, polynomial, RBF, and sigmoid kernels. The formulas are expressed as Equations (4)–(7):
L i n e a r   k e r n e l :   K   x i ,   x j = x i ·   x j
P o l y n o m i a l   k e r n e l :   K   x i ,   x j = γ x i ·   x j + r d
R B F :   K   x i ,   x j = e x p γ x i x j 2
S i g m o i d   k e r n e l :   K   x i ,   x j = t a n h γ x i ·   x j + r
where γ , the kernel coefficient gamma, is a positive v parameter affecting different kernels in various ways. For linear kernel, γ has no impact. In the polynomial kernel, it scales feature interactions and enhances nonlinearity. In the RBF kernel, it controls the width of the Gaussian function and influences the importance of training data points. For the sigmoid kernel, it determines the intensity of interactions between features. The default γ value is given by Equation (8):
γ = 1 n _ f e a t u r e X . v a r ( )
where n _ f e a t u r e denotes the number of features, and X . v a r ( ) represents the average variance across all features.
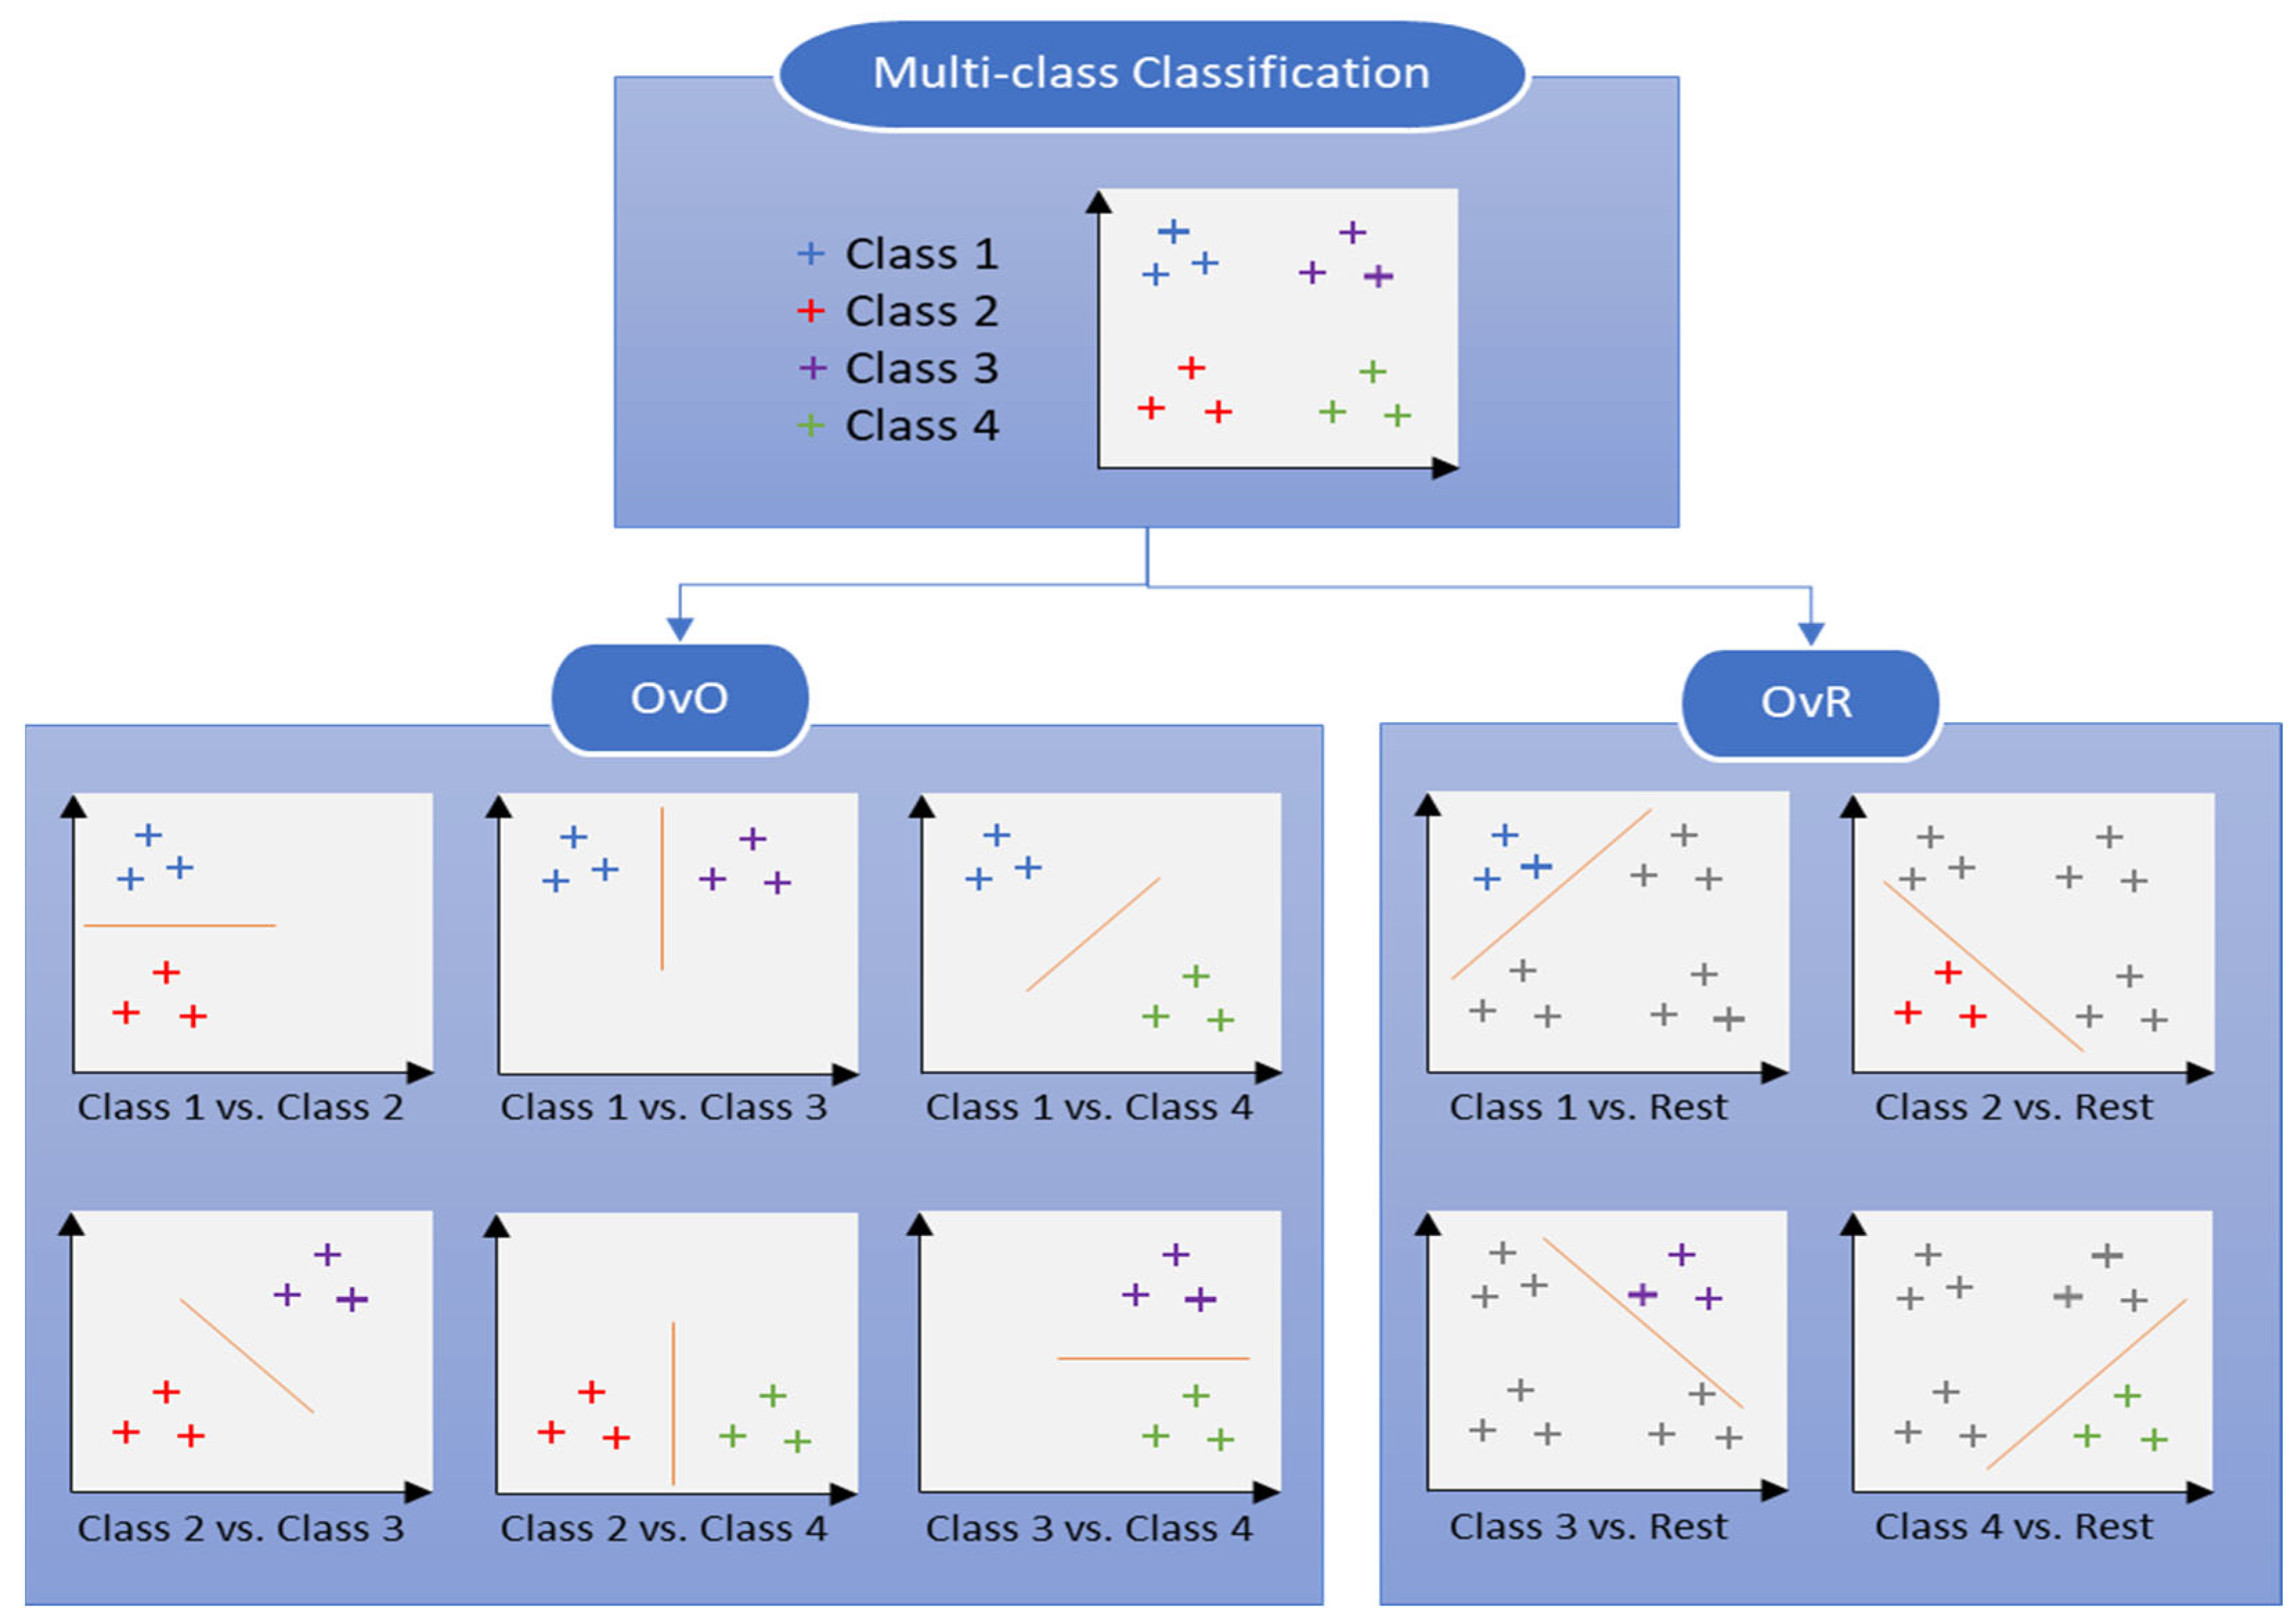
Although SVM is inherently a binary classifier, it can be extended to multi-class classification using different strategies. Figure 4 illustrates two common strategies, including One-vs-One (OvO) and One-vs-Rest (OvR). In the OvO strategy, the problem is divided into multiple binary classification tasks, with the number of tasks calculated as shown in Equation (9):
k ( k 1 ) 2
where k represents the number of classes. Each classifier distinguishes between two classes. In contrast, the OvR approach constructs k binary classifiers, each separating one class from all others.

2.2. Hyperparameter Optimization Framework

Hyperparameter tuning is essential for enhancing the performance of machine learning (ML) and deep learning (DL) models. Selecting optimal hyperparameters typically requires a deep understanding of the underlying algorithms and effective optimization techniques. Traditionally, hyperparameter tuning was performed manually using trial-and-error methods. However, this approach is often inefficient due to the model complexity, time-intensive evaluations, and the nonlinear interactions between hyperparameters. With advancements in technology, systematic hyperparameter optimization methods have emerged. Pokhrel [45] identified four primary approaches: Grid Search, Random Search, Gaussian Processes, and the Tree-structured Parzen Estimator (TPE). Additionally, frameworks such as Hyperopt [34,35] and Optuna [36] have gained prominence for their efficient ML hyperparameter optimization, particularly through TPE-based algorithms [46,47,48].
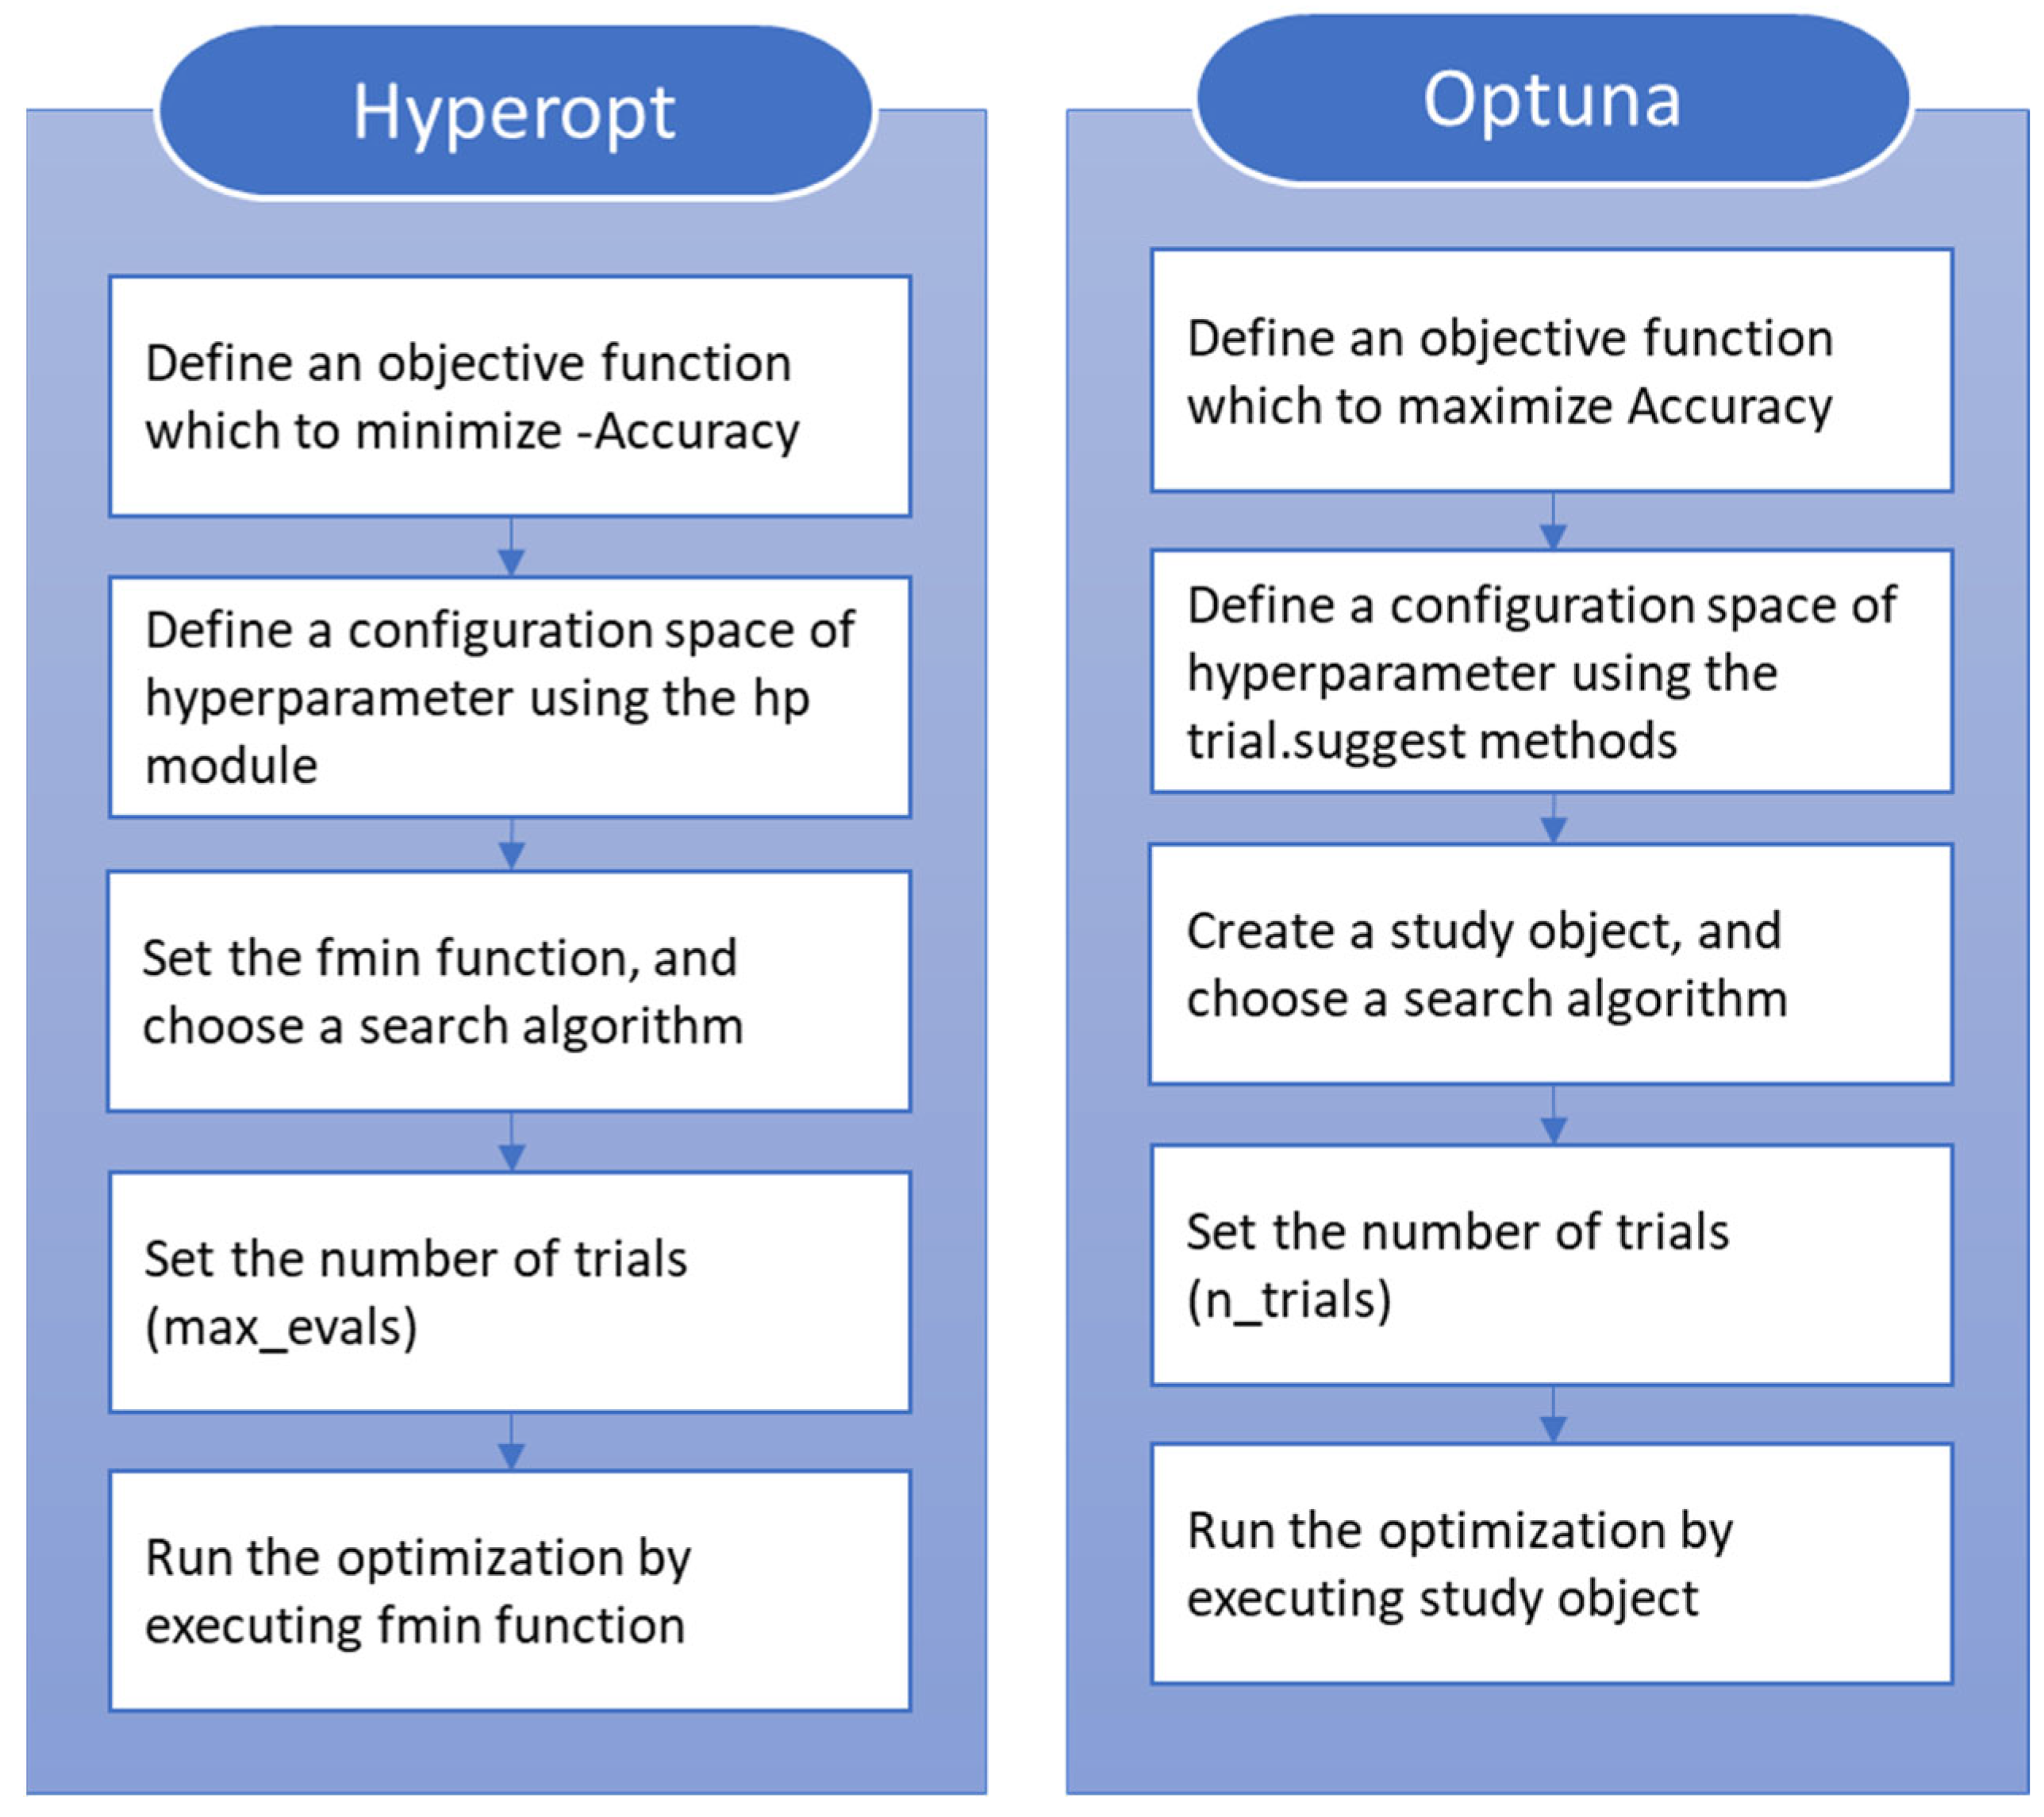
Hyperopt and Optuna are Python(3.9.15)-based libraries specifically designed for hyperparameter optimization. Their primary goal is to identify the optimal values of an objective function within a defined hyperparameter space, while a function of both is the ability to configure a database to store all point evaluations during the search process. Hyperopt supports algorithms such as Random Search, TPE, and Adaptive TPE. In contrast, Optuna offers a broader range of samplers, including RandomSampler, GridSampler, TPESampler, CmaEsSampler, NSGAIISampler, QMCSampler, GPSampler, BoTorchSampler, and BruteForceSampler. Figure 5 describes the workflow for using Hyperopt and Optuna to optimize hyperparameters, which comprises the following five steps: The first step is to define an objective function. In Hyperopt, the objective function must be minimized, as the library supports only minimization. To maximize metrics such as accuracy, the function must return a negative value as -Accuracy. Optuna, on the other hand, supports both minimization and maximization directly, allowing accuracy to be returned without transformation. The second step is to define a configuration space. Hyperopt’s configuration space is defined using the hp module, such as hp.uniform and hp.choice. Optuna defines its configuration space using trial.suggest_* methods, such as trial.suggest_float and trial.suggest_int. The third step is to select a search algorithm. Hyperopt uses the fmin function to execute the optimization, and users can select algorithms like TPE or Random Search. Optuna initializes a study object with TPE as the default sampler but also supports other samplers, such as RandomSampler, GridSampler, and CmaEsSampler. The fourth step is to set the number of trials. In Hyperopt, the maximum number of iterations is specified using the max_evals parameter. In Optuna, the equivalent parameter is n_trials. The final step is to run the optimization, and the optimization process in Hyperopt is executed using the fmin function, while Optuna uses the study.optimize method. In summary, Hyperopt offers a straightforward approach, supporting only minimization and a limited set of algorithms, whereas Optuna provides greater flexibility by accommodating a wider range of algorithms and supporting both maximization and minimization.

3. The Proposed Architecture for Predicting Mobile Phone Price

In this study, the multi-class classification forecasting method support vector machines with hyperparameter optimization frameworks was proposed to predict mobile phone prices. Figure 6 illustrates the proposed architecture for predicting mobile phone prices, which is described through the following stages. In the data preprocessing stage, the mobile phone dataset is obtained from Kaggle [2], and subsequently the completeness and accuracy of dataset are verified. The dataset is then split using 5-fold cross-validation [49,50], with 80% allocated for training and 20% reserved for testing. In the model learning stage, the training data are used to train the SVM model, incorporating hyperparameter optimization with two HPO frameworks, Hyperopt and Optuna, to identify the most optimal model. In the forecasting and analysis stage, the test data are fed into the optimized models to generate predictions for each experimental subset. Finally, the predicted results are analyzed and evaluated based on the average performance across the five cross-validation folds. The overall procedure for mobile phone price classification using the proposed SVM-based framework with hyperparameter optimization is summarized in Algorithm 1. This algorithm incorporates data preprocessing, 5-fold cross-validation, and the application of two HPO methods to determine hyperparameters. The details are provided as follows:
Algorithm 1. Mobile phone price classification using SVM with HPO
1:
Input: the mobile phone dataset with features X and labels y
2:
Verify data completeness (missing values checking)
3:
Initialize 5-Fold CV: split the dataset into k folds (each with 80% training, 20% testing)
4:
For each fold i in 1 to k:
5:
          Training_set ← dataset excluding fold i
6:
          Testing_set ← fold i
7:
Train the multi-class SVM model on Training_set using the HPO framework
8:
Perform HPO:
9:
           Select a framework: Hyperopt or Optuna
10:
          Define objective function:
11:
                 For Hyperopt: −Accuracy (for minimization)
12:
                 For Optuna: +Accuracy (for maximization)
13:
          Define Hyperparameter search space (kernel, C, gamma, decision_function_shape)
14:
          Create the corresponding object or function for HPO with 100 trials separately
15:
          Perform hyperparameter optimization:
16:
                 If HPO method employed == Optuna: Create a study and use study.optimize()
17:
                 else if HPO method employed == Hyperopt: Use fmin() with TPE algorithm
18:
          Generate selected hyperparameters from HPO
19:
          Complete determined SVMHYP and SVMOPT models for Fold 1 to Fold 5 separately
20:
Input Testing_set to the determined models
21:
Performance evaluation of Testing_set:
22:
          Calculate Accuracy, MA_Precision, MA_Recall, MA_F1-Score
23:
          Store results
24:
Aggregate Results: average all metrics across the k folds

3.1. Data Collection and Splitting

The study begins by acquiring the “Mobile Price Classification” dataset from the Kaggle platform [2]. This dataset contains 2000 samples, each associated with a target variable and 20 features. Table 2 summarizes the variables and their descriptions. The target variable categorizes the price range of the mobile phones into four levels: low, medium, high, and very high. The features represent various specifications of mobile phones, such as battery capacity, processor speed, and internal memory. A thorough review of the dataset confirmed that there were no missing values.
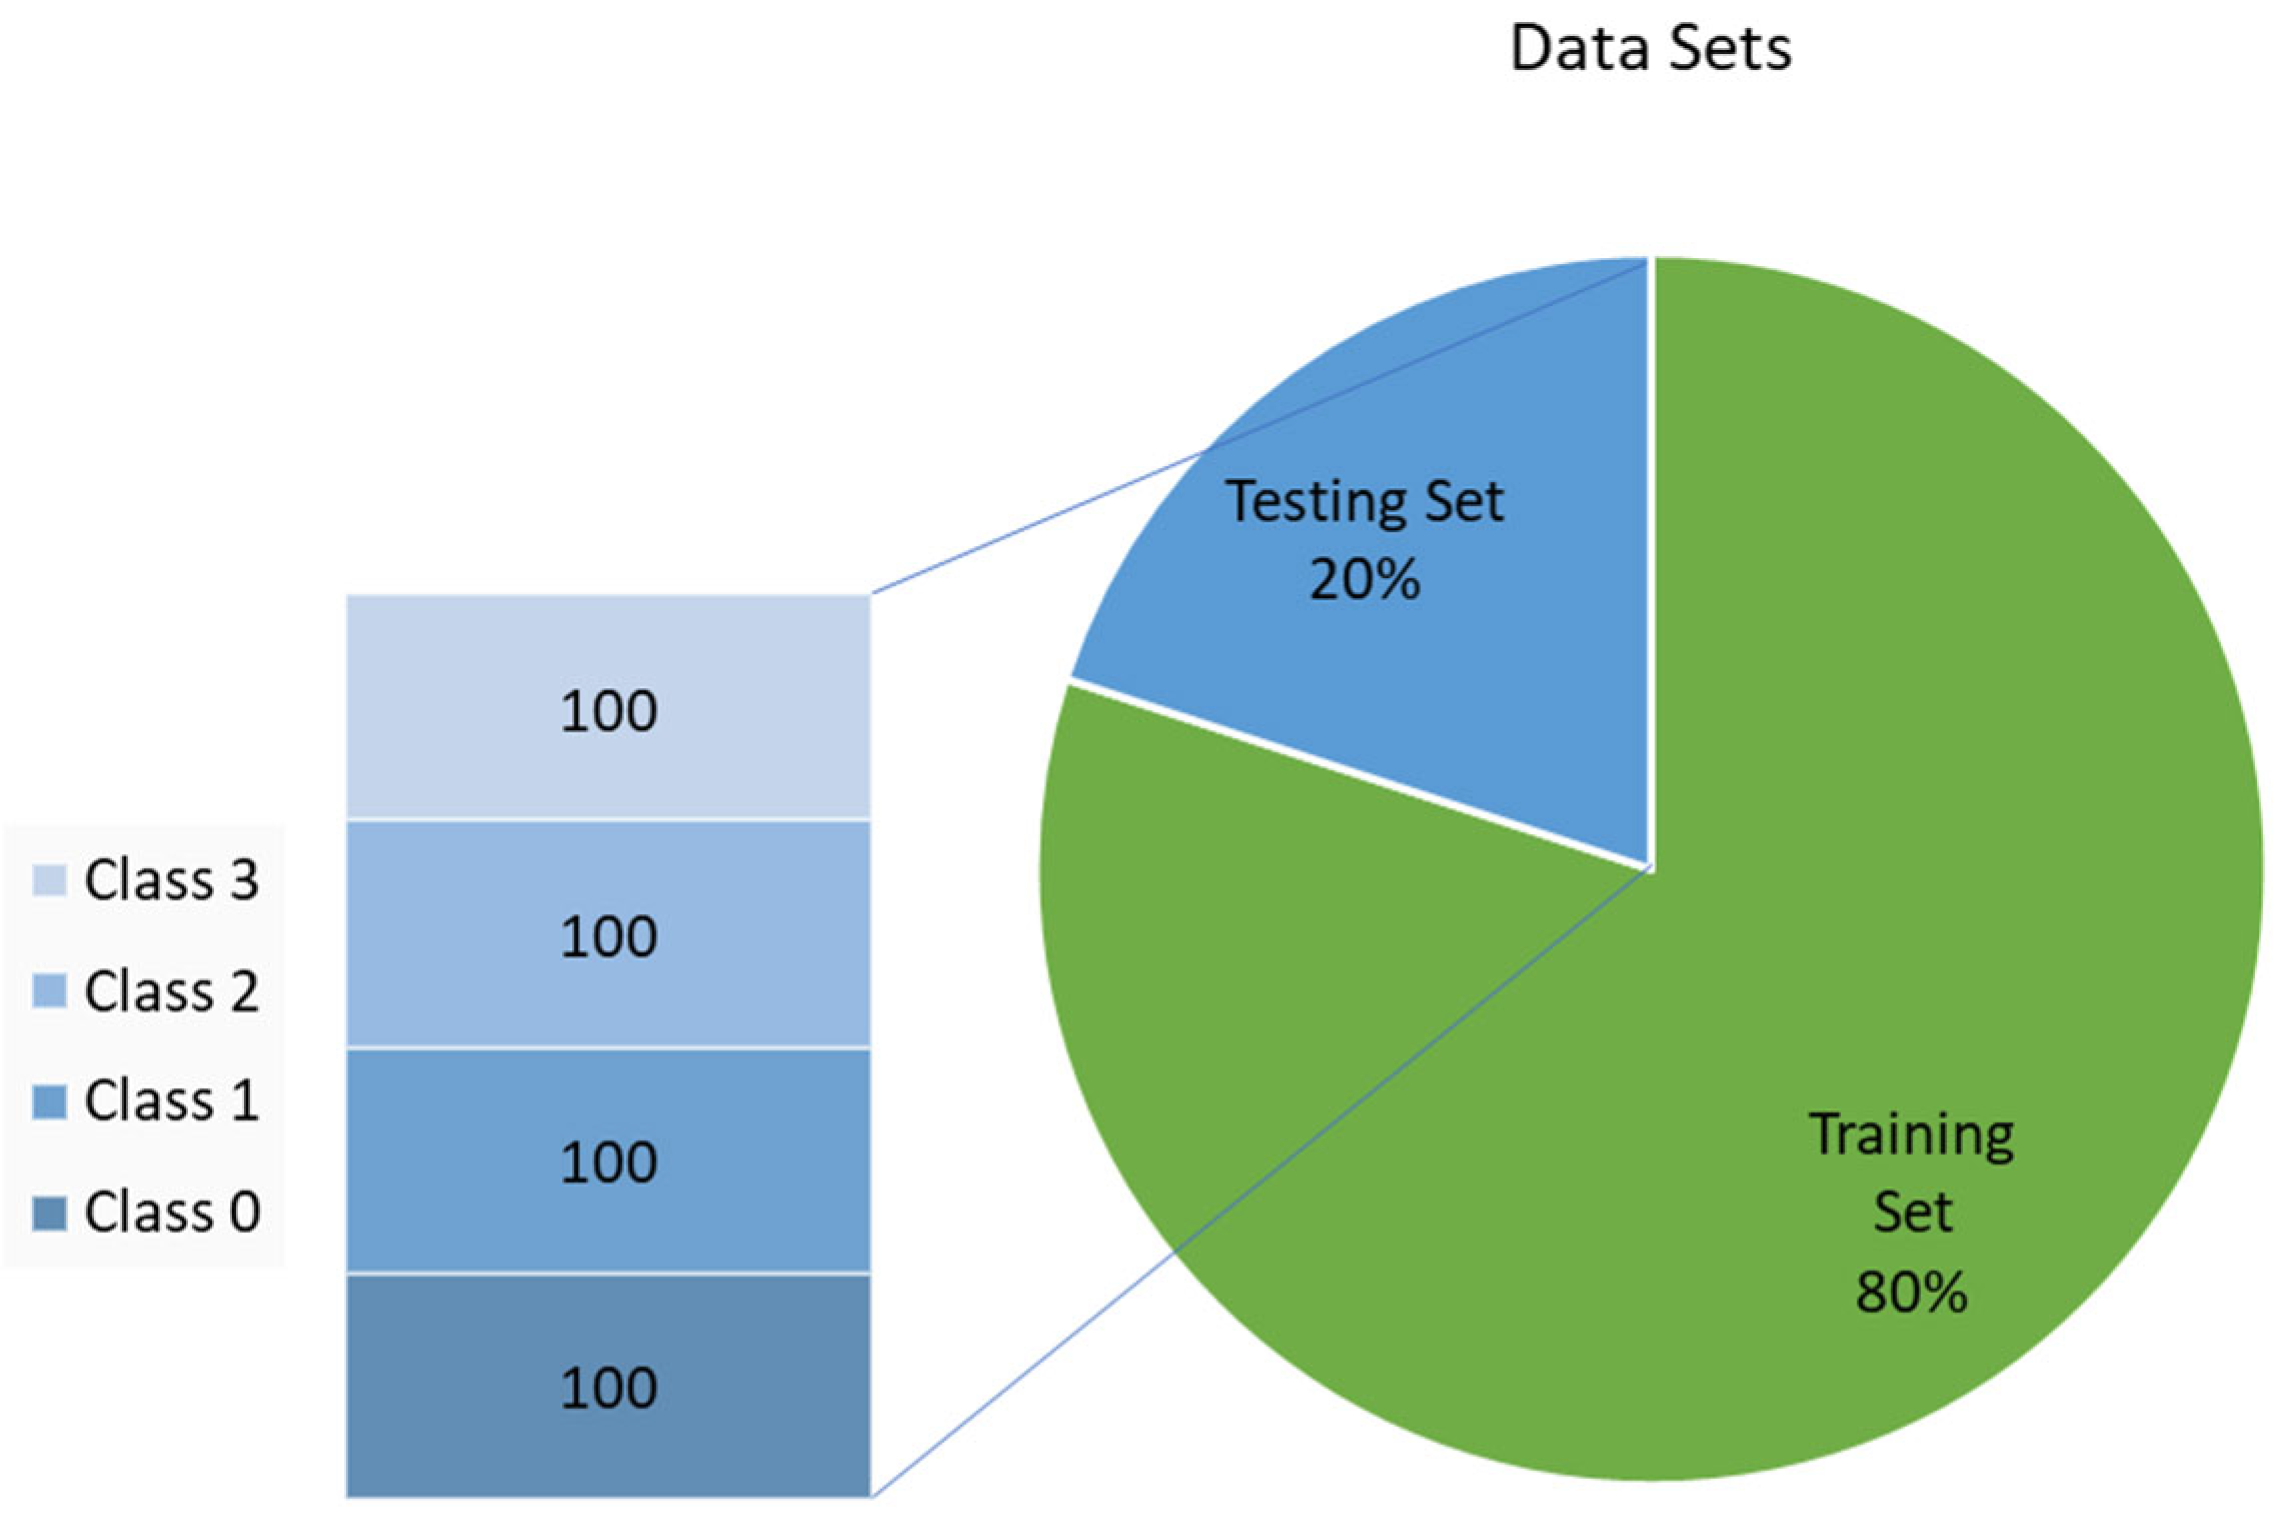
After ensuring the completeness and accuracy of the data, the dataset was divided into 80% for training and 20% for testing. Figure 7 illustrates the distribution of the training and testing sets across the 5-fold datasets, where the training set comprises 1600 samples, and the testing set includes 400 samples. The dataset is balanced across the target classes. This data split is designed to enhance the model’s generalization capability during training. By utilizing the training set, the model learns the relationships between various mobile phone specifications and their corresponding price ranges. Predictions on the testing set ensure that the model delivers accurate results when applied to new, unseen data.

3.2. Model Learning

During the model learning stage, this study employed a multi-class support vector machines model using the Scikit-learn library [51]. The hyperparameters were optimized using two frameworks, Hyperopt and Optuna, for comparison. For a fair evaluation, the configurations of Hyperopt and Optuna were aligned in terms of the hyperparameter search space, and the number of optimization trials set to 100. The optimized hyperparameters included kernel, C, gamma, and decision_function_shape, aiming to identify the best combination of settings. Table 3 presents the default values and the search ranges for these SVM hyperparameters. The kernel function was selected from ‘linear’, ‘poly’, ‘rbf’, or ‘sigmoid’, allowing the model to determine the most suitable option. The decision_function_shape was set to either ‘ovo’ or ‘ovr’ to evaluate different multi-class classification strategies. This study referred to [52,53,54] and determined searching ranges for the continuous hyperparameters C and gamma. For the regularization parameter C, the default value was used as an initial reference, and the final searching range was set from 1 × 10⁻² to 1 × 10². For the kernel hyperparameter gamma, the default value was used as a central point with intervals expanded around it. The searching ranges were gradually narrowed from 1 × 10⁻⁷~1, to 1 × 10⁻⁷~1 × 10⁻¹, and then to 1 × 10⁻⁷~1 × 10⁻⁵. However, it was observed that wide searching spaces significantly increased training time and frequently resulted in unstable outcomes in early iterations. Therefore, based on the default value and the lower bound of gamma, which is greater than zero [55], a refined searching range from 4.701 × 10⁻⁷ to 6.701 × 10⁻⁷ was used in this study. The determination of searching ranges of these two hyperparameters is data-dependent. Reducing the searching space based on default-derived points led to more data-relevant parameter ranges.

4. Numerical Results and Discussion

4.1. Numerical Results

The SVM-based multi-class mobile phone price prediction model developed in this study was evaluated using the designated test dataset. The model’s performance was assessed using four evaluation metrics, including Accuracy, Macro-Averaging Precision (MA_Precision), Macro-Averaging Recall (MA_Recall), and Macro-Averaging F1-Score (MA_F1-Score), all of which were derived from the Confusion Matrix and are commonly used in multi-class classification to assess model performance [56,57,58]. They provide a comprehensive evaluation of the classifier’s ability to distinguish between different price categories. For a classification problem with n classes, the Confusion Matrix is typically organized as an n × n matrix, comparing the model’s predictions to the actual labels. Table 4 illustrates the structure of the Confusion Matrix.
A c c u r a c y = i = 1 n T P i i = 1 n ( T P i + j i F i , j )
M A _ P r e c i s i o n = 1 n i = 1 n T P i T P i + j i F j , i
M A _ R e c a l l = 1 n i = 1 n T P i T P i + j i F i , j
M A _ F 1 S c o r e = 1 n i = 1 n 2 × P r e c i s i o n i × R e c a l l i P r e c i s i o n i + R e c a l l i
where T P i is the number of samples that belong to class i and are correctly predicted by the model as class i, and F i , j is the number of samples that belongs to class i but is incorrectly classified by the model as class j. The formulas of Accuracy, MA_Precision, MA_Recall, and MA_F1-Score are shown in Equations (10)–(13).
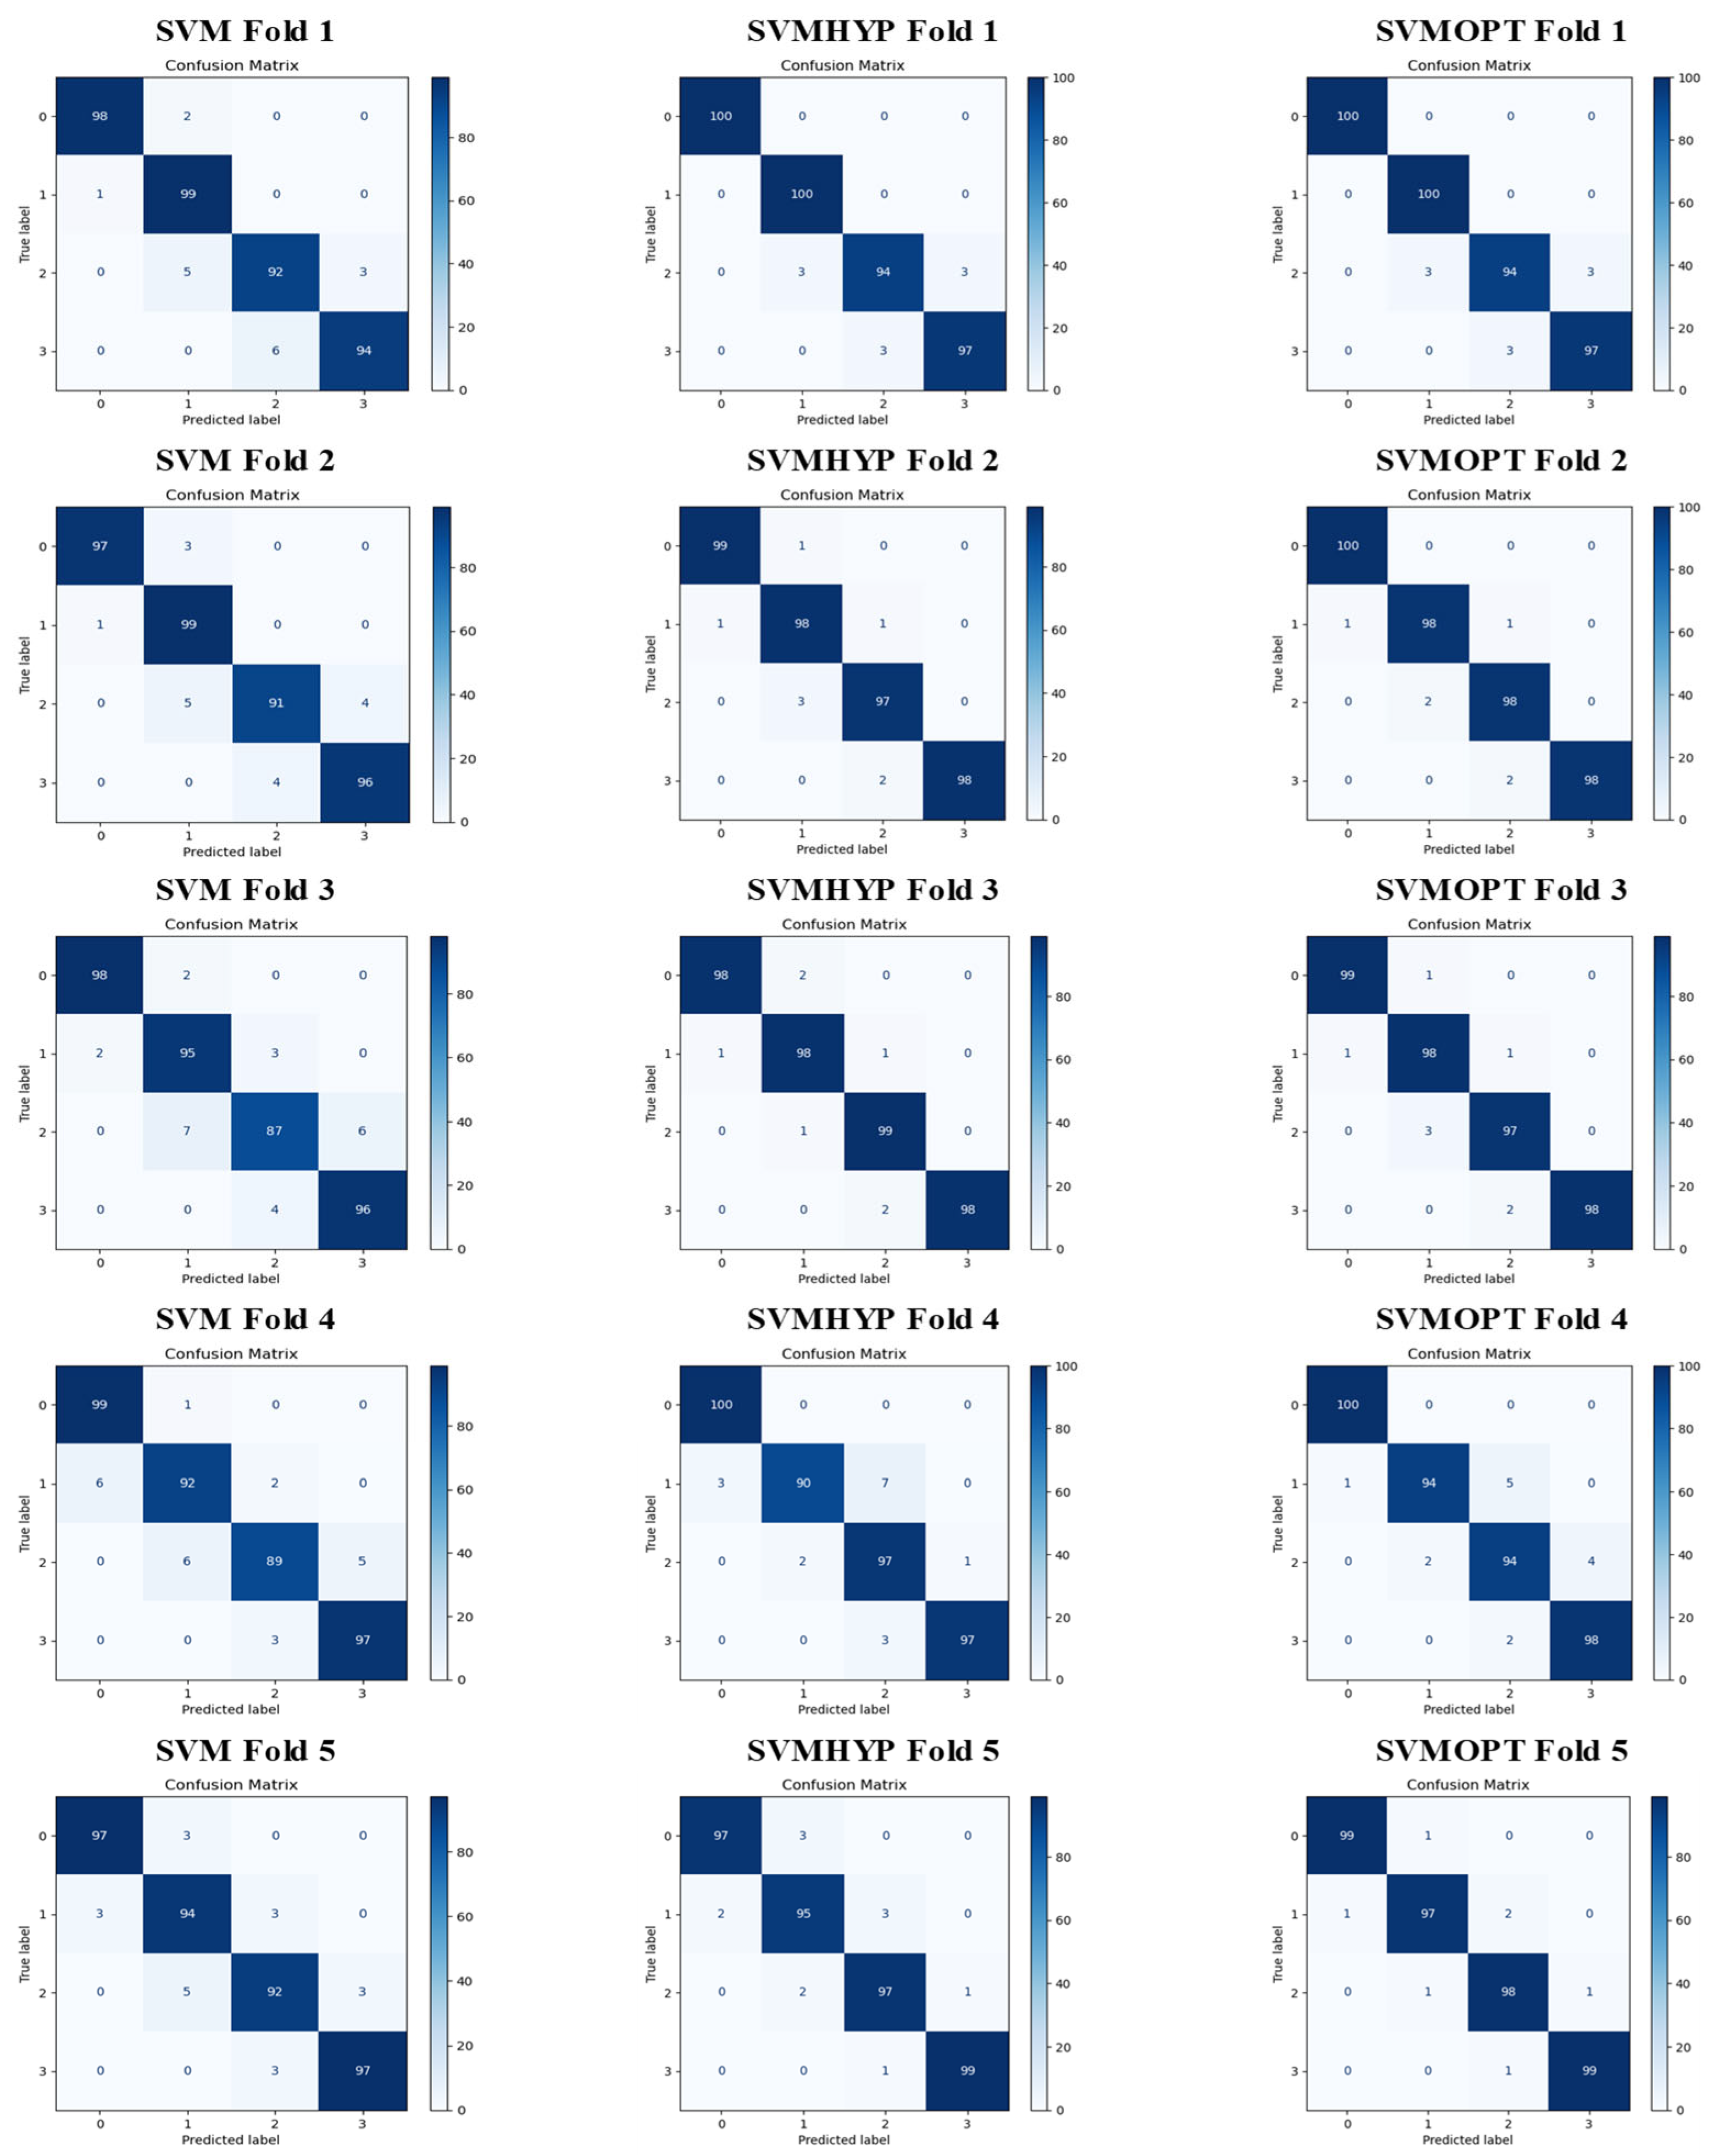
Figure 8 provides a comparison of the training process trends between the Hyperopt and Optuna frameworks for optimizing SVM hyperparameters in mobile phone price prediction using 5-fold cross-validation. Table 5 and Table 6 present the hyperparameter search results for SVM modeling using Hyperopt and Optuna, respectively. The experiments were conducted on a computer equipped with an Intel i5-12500 CPU, an NVIDIA RTX 4070 Ti Super GPU, and 16 GB of RAM. The software environment included scikit-learn (SVM) version 1.4.2, Optuna version 4.0.0, and Hyperopt version 0.2.7. Across the five cross-validation folds, both Hyperopt and Optuna predominantly selected the polynomial kernel and linear kernel, indicating that these kernels are well-suited for the given data distribution. The gamma values were extremely small, ranging from 5.2013E−07 to 6.6103E−07, suggesting that the model requires very smooth decision boundaries. This observation implies that the data distribution is likely relatively simple and linearly separable but may contain some nonlinear features, requiring smooth decision boundaries to capture underlying complexities. Figure 9 presents the confusion matrices for the SVM, SVMHYP, and SVMOPT models across 5-fold cross-validation. Both SVMHYP and SVMOPT exhibit significantly improved classification performance compared to the baseline SVM model, as evidenced by the higher values along the diagonal, indicating more accurate predictions. Among the three models, SVMOPT consistently achieves the highest accuracy in most folds while maintaining stable performance across all five folds, with minimal variation in classification accuracy. This demonstrates that hyperparameter tuning, particularly with Optuna, substantially enhances both the accuracy and stability of the model.
Table 7, Table 8 and Table 9 compare the performance of SVM models without hyperparameter optimization (W/O HPO), with Optuna, and with Hyperopt for predicting mobile phone prices. The results are evaluated using Accuracy, MA_Precision, MA_Recall, and MA_F1-Score across five folds. The W/O HPO model demonstrates consistent performance across the folds, with slight variations; however, its overall performance is lower than that of both Optuna and Hyperopt. Hyperopt improves the performance compared to the W/O HPO results, and the model remains stable across different folds. Optuna achieves the best overall performance, with a significant improvement over the W/O HPO results. The values are fairly consistent across the folds, indicating the robustness of the tuning approach. Figure 10 presents a bar chart comparing the accuracy of the three SVM models (SVM, SVMHYP, and SVMOPT) across five cross-validation folds. SVMOPT consistently achieves the highest accuracy, particularly in Folds 2, 3, and 5, where it exceeds 98%. SVMHYP also outperforms the baseline SVM model, demonstrating a significant improvement in accuracy across all folds. Overall, hyperparameter optimization enhances model performance, with Optuna delivering the best results in terms of both accuracy and stability. To further assess the performance between SVMOPT and SVMHYP, a McNemar–Bowker test [59] was conducted for both SVMOPT and SVMHYP models based on 1600 training data and 400 testing data with the most accurate classification for each model. The p-value of the test is 0.995 larger than 0.05. Thus, the difference in testing observations between SVMOPT and SVMHYP models is not statistically significant.

4.2. Discussion

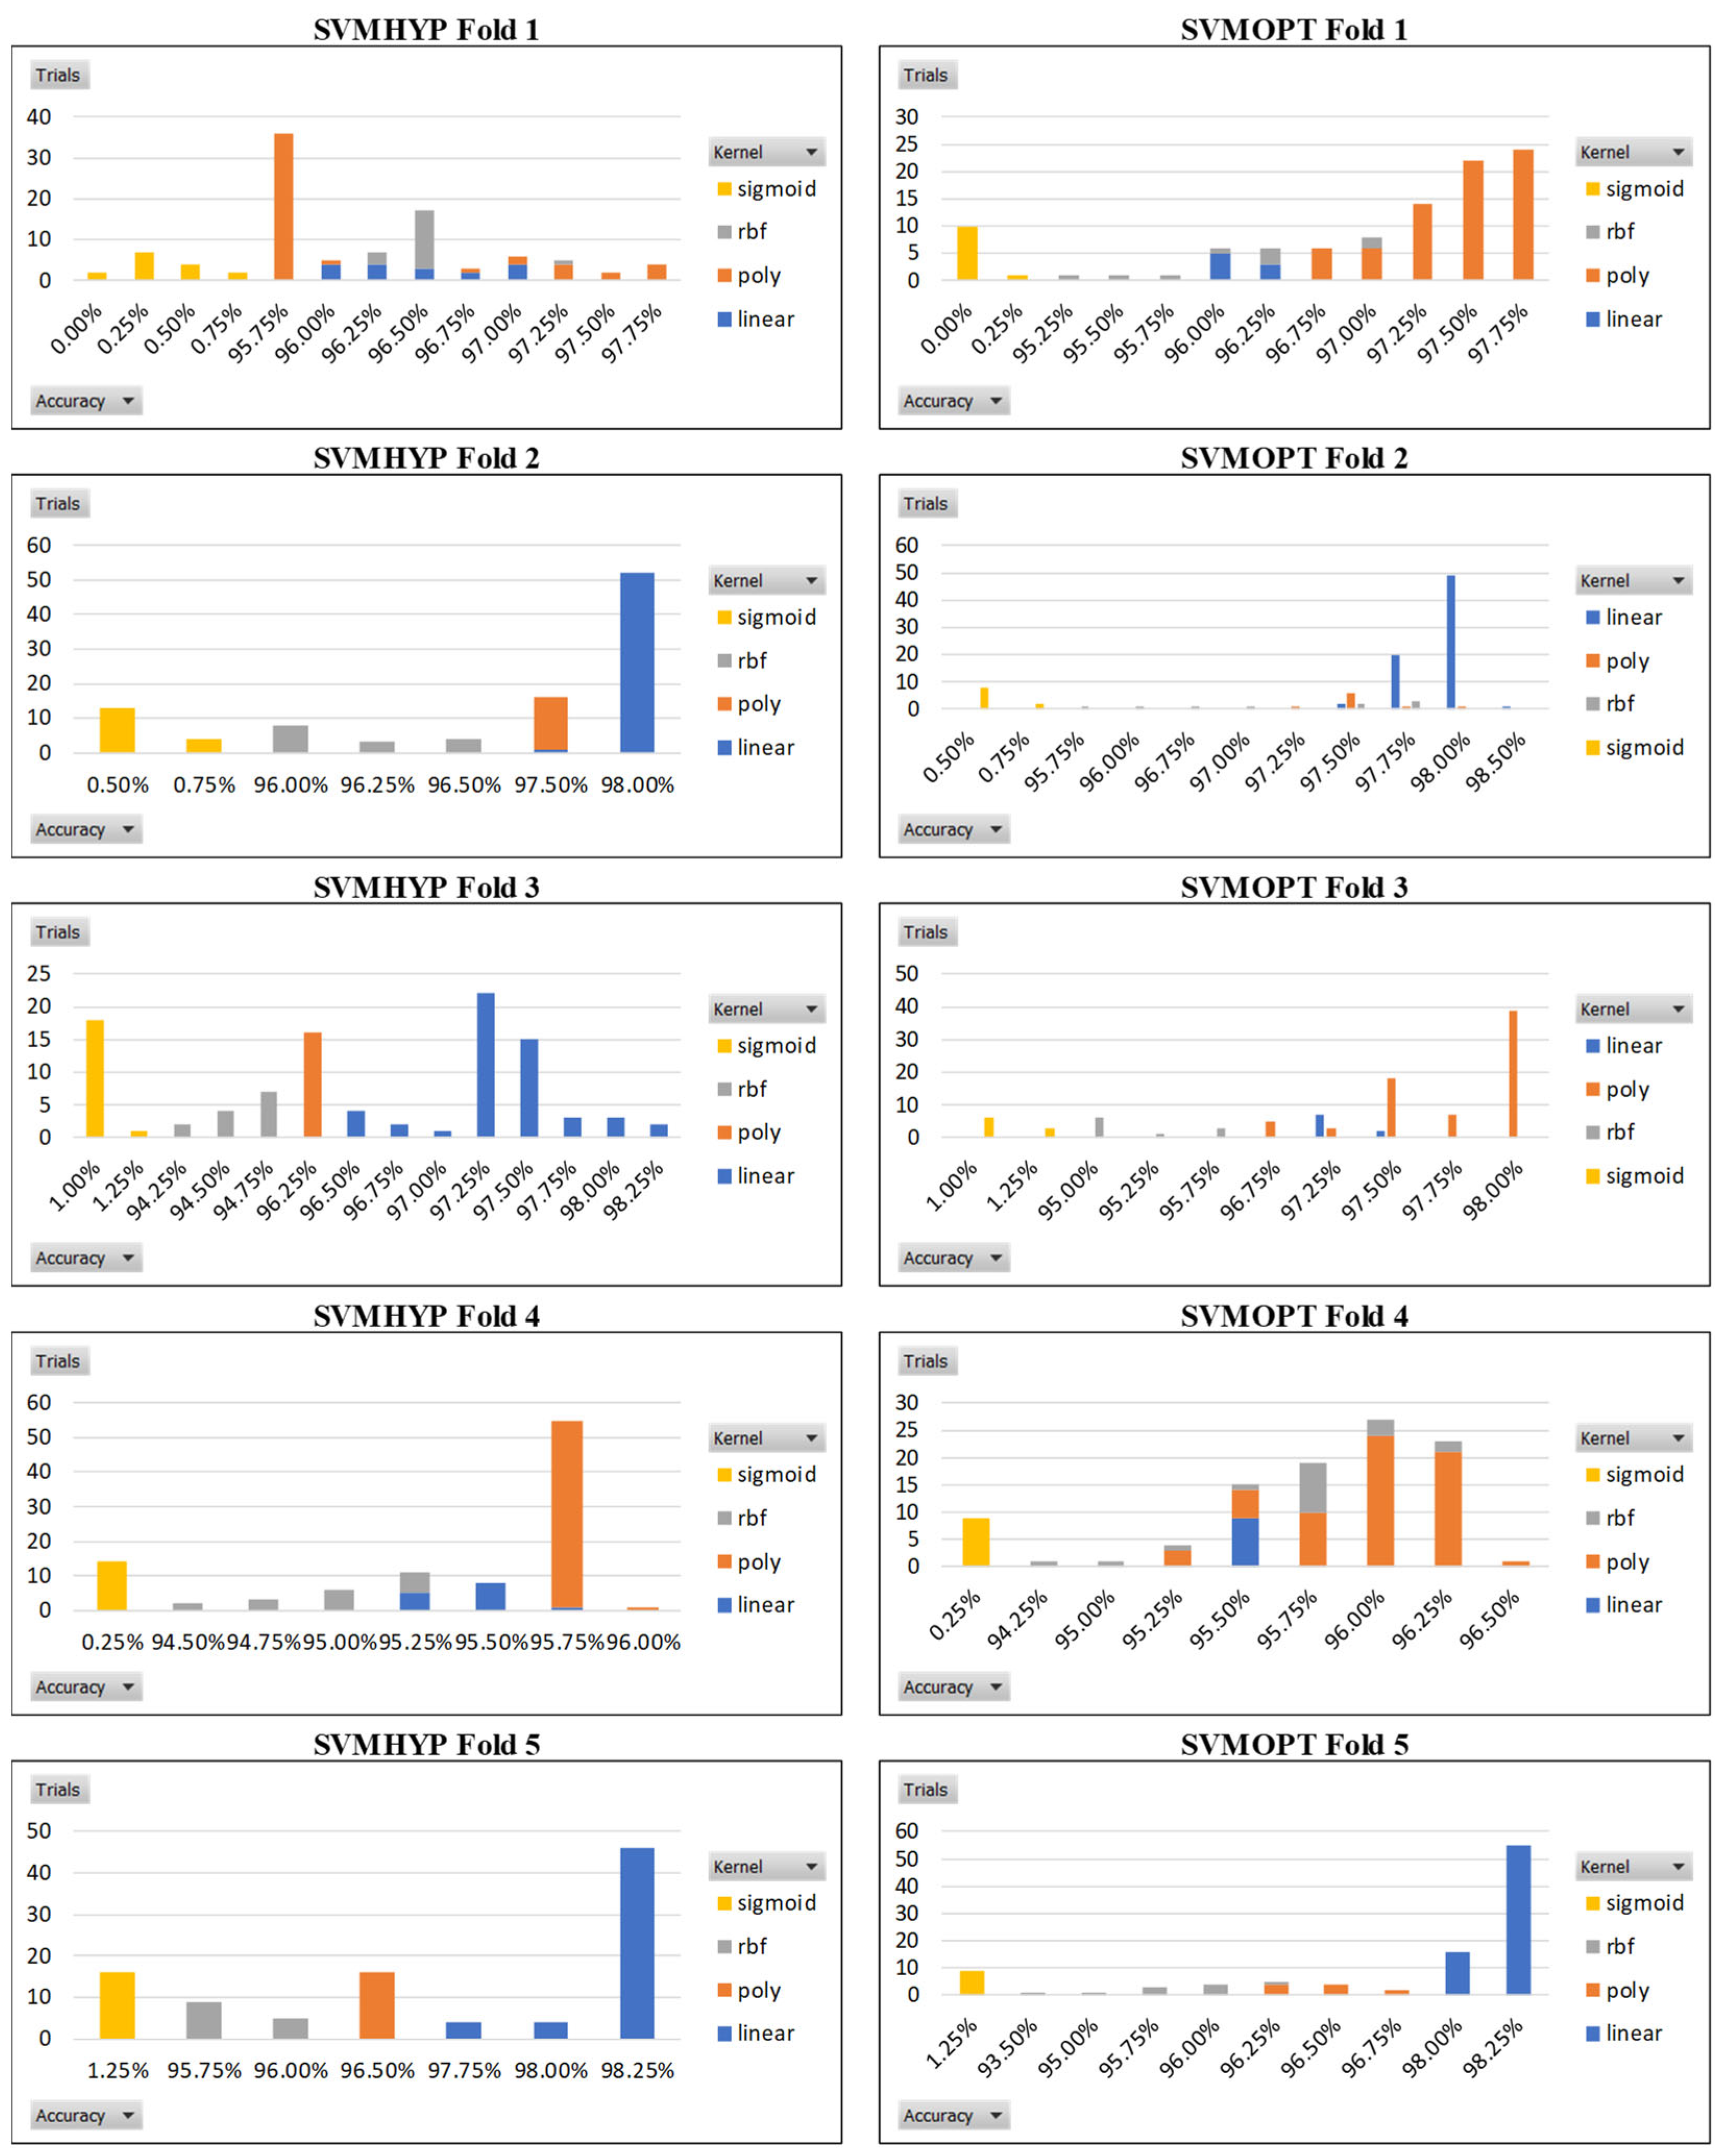
Figure 11 illustrates the distribution of kernel types across accuracy levels, showcasing histograms of accuracy over 100 trials across five folds, using four kernel functions with Optuna and Hyperopt. The results indicate that the highest accuracies are predominantly achieved with the linear and poly kernels, whereas the sigmoid kernel consistently yields the lowest accuracy. This suggests that linear and poly kernels are more suitable for achieving high accuracy during hyperparameter optimization with Optuna and Hyperopt, while the sigmoid kernel is less effective.
Moreover, the principal component analysis (PCA) [60] was performed before the classification tasks. Table 10 presents the classification accuracy of SVM models with and without the use of PCA. It can be observed that using PCA can increase average classification accuracy for the SVM model, the SVMHYP model, and the SVMOPT model.
In addition, XGBoost [61] and LGBM [62] were used to conduct the classification tasks with 80% training data and 20% testing data. Table 11 presents the classification accuracies of three models and indicates that the SVM model outperformed the other models in terms of average classification accuracy.
This study proposes an SVM-based method incorporating hyperparameter optimization within a five-fold cross-validation framework, a novel approach not previously applied in the literature on mobile phone price prediction. To compare the classification performance with previous literature by the same data splits, 70–30%, 80–20%, and 85–15% data divisions for training data and testing data were employed to conduct the classification tasks. Table 12, Table 13 and Table 14 provide classification performance accordingly. The results reveal that the proposed SVMHYP model and SVMOPT model outperform techniques in the previous literature with various data splits in terms of classification accuracy.

5. Conclusions

This study successfully developed a mobile phone price classification model based on SVM, utilizing the Hyperopt and Optuna frameworks for hyperparameter optimization. The results demonstrate that both optimized models, SVMHYP and SVMOPT, outperformed the baseline SVM model without optimization, confirming the effectiveness of hyperparameter tuning in enhancing model performance. Between SVMHYP and SVMOPT, performance was comparable, with SVMOPT slightly surpassing SVMHYP. The average classification accuracy of SVM-based classifiers could be increased by using PCA. Furthermore, the proposed SVM-based method outperformed the XGBoost model and the LGBM model in terms of average classification accuracy. These findings validate the proposed hyperparameter tuning approach as a reliable tool for mobile phone price prediction, benefiting both consumers and manufacturers in making informed decisions.
The key contributions of this study include the application of two hyperparameter optimization frameworks to SVM models for effective mobile phone price prediction, achieving outstanding performance. The findings suggest that for this smartphone price dataset, the sigmoid kernel in SVM performs less effectively, while linear and polynomial kernels are better suited for achieving high accuracy during hyperparameter optimization with Optuna and Hyperopt. Given the significant implications of this study for practical applications, the customers can utilize the price prediction tool developed in this research to make more cost-effective decisions when selecting mobile phones. By understanding the technical specifications of a phone, consumers can more accurately predict its price range and avoid overspending. In addition, manufacturers can refer to the model when pricing new products, allowing them to formulate more competitive market strategies.
The dataset used in this study has been widely adopted in prior studies as a benchmark for evaluating machine learning models in mobile phone price prediction. The availability and standardized structure make the dataset well-suited for reproducible experimentation and comparative analysis. Although real-world applications may involve more complex and high-dimensional factors, such as manufacture, geographic market conditions, target demographics, and the status of the rivals, the current dataset provides a solid foundation for testing the effectiveness of different algorithms and optimization strategies. Future work may incorporate more comprehensive and real-world datasets to further validate the robustness and applicability of the proposed approach. In addition, using the other techniques such as Ray Tune [63,64] and BoTorch [64,65] to determine hyperparameters of classifiers could be another potential option for further study.
In conclusion, this research provides valuable insights into hyperparameter optimization in SVM models for mobile phone price prediction, offering practical tools and recommendations for various stakeholders in the mobile phone industry.

Author Contributions

Conceptualization, P.-F.P., Y.-J.C. and Y.-L.L.; data curation, Y.-J.C.; methodology, P.-F.P., Y.-J.C. and Y.-L.L.; software, Y.-J.C.; formal analysis, Y.-J.C. and Y.-L.L.; writing—original draft preparation, Y.-J.C., Y.-L.L. and P.-F.P.; writing—review and editing, P.-F.P.; visualization, Y.-J.C. and Y.-L.L. All authors have read and agreed to the published version of the manuscript.

Funding

This study was partially funded by National Science and Technology Council Taiwan, R.O.C. with the grant number NSTC 113-2221-E-260-013-MY2.

Data Availability Statement

The data are contained within the article.

Acknowledgments

This work was supported by Hsun-Yi Huang, who assisted in data analysis.

Conflicts of Interest

The authors declare no conflicts of interest.

References

  1. Smartphone Market Size & Share Analysis—Growth Trends & Forecasts (2025–2030). Available online: https://www.mordorintelligence.com/industry-reports/smartphones-market (accessed on 17 January 2025).
  2. Mobile Price Classification. Available online: https://www.kaggle.com/datasets/iabhishekofficial/mobile-price-classification (accessed on 23 October 2024).
  3. Nasser, I.M.; Al-Shawwa, M.O.; Abu-Naser, S.S. Developing artificial neural network for predicting mobile phone price range. Int. J. Acad. Inf. Syst. Res. 2019, 3, 1–6. [Google Scholar]
  4. Pipalia, K.; Bhadja, R. Performance evaluation of different supervised learning algorithms for mobile price classification. Int. J. Res. Appl. Sci. Eng. Technol. (IJRASET) 2020, 8, 1841–1848. [Google Scholar] [CrossRef]
  5. Çetın, M.; Koç, Y. Mobile phone price class prediction using different classification algorithms with feature selection and parameter optimization. In Proceedings of the 2021 5th International Symposium on Multidisciplinary Studies and Innovative Technologies (ISMSIT), Ankara, Turkey, 21–23 October 2021; pp. 483–487. [Google Scholar]
  6. Güvenç, E.; Çetin, G.; Koçak, H. Comparison of KNN and DNN classifiers performance in predicting mobile phone price ranges. Adv. Artif. Intell. Res. 2021, 1, 19–28. [Google Scholar]
  7. Kalaivani, K.; Priyadharshini, N.; Nivedhashri, S.; Nandhini, R. Predicting the price range of mobile phones using machine learning techniques. In Proceedings of the 4th National Conference On Current And Emerging Process Technologies E-Concept-2021, Erode, India, 20 February 2021. [Google Scholar]
  8. Pramanik, R.; Agrawal, R.; Gourisaria, M.K.; Singh, P.K. Comparative analysis of mobile price classification using feature engineering techniques. In Proceedings of the 2021 5th International Conference on Information Systems and Computer Networks (ISCON), Mathura, India, 22–23 October 2021; pp. 1–7. [Google Scholar]
  9. Kiran, A.V.; Jebakumar, R. Prediction of mobile phone price class using supervised machine learning techniques. Int. J. Innov. Sci. Res. Technol. 2022, 7, 248–251. [Google Scholar]
  10. Hu, N. Classification of Mobile Phone Price Dataset Using Machine Learning Algorithms. In Proceedings of the 2022 3rd International Conference on Pattern Recognition and Machine Learning (PRML), Chengdu, China, 22–24 July 2022; pp. 438–443. [Google Scholar]
  11. Chen, M. Mobile Phone Price Prediction with Feature Reduction. Highlights Sci. Eng. Technol. 2023, 34, 155–162. [Google Scholar] [CrossRef]
  12. Ercan, S.İ.A.; ŞİMŞEK, M. Mobile Phone Price Classification Using Machine Learning. Int. J. Adv. Nat. Sci. Eng. Res. 2023, 7, 458–462. [Google Scholar]
  13. Zhang, Y.; Ding, Q.; Liu, C. An Enhanced XGBoost Algorithm for Mobile Price Classification. In Proceedings of the 2023 IEEE 6th International Conference on Big Data and Artificial Intelligence (BDAI), Jiaxing, China, 7–9 July 2023; pp. 154–159. [Google Scholar]
  14. Sunariya, N.; Singh, A.; Alam, M.; Gaur, V. Classification of Mobile Price Using Machine Learning. In Proceedings of the Symposium on Computing & Intelligent Systems, New Delhi, India, 10 May 2024; pp. 55–66. [Google Scholar]
  15. Chang, Y.-J. A Study of Support Vector Machines and Hyperparameters Selection in Multiclass Classification. Master’s Thesis, National Chi Nan University, Nantou County, Taiwan, 2024. [Google Scholar]
  16. Jain, T.; Garg, P.; Chalil, N.; Sinha, A.; Verma, V.K.; Gupta, R. SMS spam classification using machine learning techniques. In Proceedings of the 2022 12th International Conference on Cloud Computing, Data Science & Engineering (Confluence), Noida, India, 27–28 January 2022; pp. 273–279. [Google Scholar]
  17. Gupta, M.; Kumar, R.; Badala, D.; Sharma, R. Optimizing SVM Hyperparameters For Accurate Cancer Cell Classification. In Proceedings of the 2023 International Conference on New Frontiers in Communication, Automation, Management and Security (ICCAMS), Bangalore, India, 27–28 October 2023; pp. 1–5. [Google Scholar]
  18. Soumaya, Z.; Taoufiq, B.D.; Benayad, N.; Yunus, K.; Abdelkrim, A. The detection of Parkinson disease using the genetic algorithm and SVM classifier. Appl. Acoust. 2021, 171, 107528. [Google Scholar] [CrossRef]
  19. Wang, J. Optimizing support vector machine (SVM) by social spider optimization (SSO) for edge detection in colored images. Sci. Rep. 2024, 14, 9136. [Google Scholar] [CrossRef]
  20. Zhang, J.; Lai, Z.; Kong, H.; Yang, J. Learning The Optimal Discriminant SVM with Feature Extraction. IEEE Trans. Pattern Anal. Mach. Intell. 2025, 47, 2897–2911. [Google Scholar] [CrossRef]
  21. Wei, P.; He, F.; Li, L.; Li, J. Research on sound classification based on SVM. Neural Comput. Appl. 2020, 32, 1593–1607. [Google Scholar] [CrossRef]
  22. Haile, M.B.; Walle, Y.M.; Belay, A.J. Enhanced Image-Based Malware Multiclass Classification Method with the Ensemble Model and SVM. Open Inf. Sci. 2024, 8, 20240003. [Google Scholar] [CrossRef]
  23. Suresh Kumar, K.; Radha Mani, A.; Ananth Kumar, T.; Jalili, A.; Gheisari, M.; Malik, Y.; Chen, H.-C.; Jahangir Moshayedi, A. Sentiment Analysis of Short Texts Using SVMs and VSMs-Based Multiclass Semantic Classification. Appl. Artif. Intell. 2024, 38, 2321555. [Google Scholar] [CrossRef]
  24. Prabhavathy, T.; Elumalai, V.K.; Balaji, E. Hand gesture classification framework leveraging the entropy features from sEMG signals and VMD augmented multi-class SVM. Expert Syst. Appl. 2024, 238, 121972. [Google Scholar]
  25. Şengül, G.; Ozcelik, E.; Misra, S.; Damaševičius, R.; Maskeliūnas, R. Fusion of smartphone sensor data for classification of daily user activities. Multimed. Tools Appl. 2021, 80, 33527–33546. [Google Scholar] [CrossRef]
  26. Azhar, M.H.; Jalal, A. Human-Human Interaction Recognition using Mask R-CNN and Multi-class SVM. In Proceedings of the 2024 3rd International Conference on Emerging Trends in Electrical, Control, and Telecommunication Engineering (ETECTE), Lahore, Pakistan, 26–27 November 2024; pp. 1–6. [Google Scholar]
  27. Thirumala, K.; Pal, S.; Jain, T.; Umarikar, A.C. A classification method for multiple power quality disturbances using EWT based adaptive filtering and multiclass SVM. Neurocomputing 2019, 334, 265–274. [Google Scholar] [CrossRef]
  28. Dhandhia, A.; Pandya, V.; Bhatt, P. Multi-class support vector machines for static security assessment of power system. Ain Shams Eng. J. 2020, 11, 57–65. [Google Scholar] [CrossRef]
  29. Liu, F.; Liu, B.; Zhang, J.; Wan, P.; Li, B. Fault mode detection of a hybrid electric vehicle by using support vector machine. Energy Rep. 2023, 9, 137–148. [Google Scholar] [CrossRef]
  30. Janjarasjitt, S. Investigating the Effect of Vibration Signal Length on Bearing Fault Classification Using Wavelet Scattering Transform. Sensors 2025, 25, 699. [Google Scholar] [CrossRef]
  31. Phatai, G.; Luangrungruang, T. Improving Multi-Class Classification with Machine Learning and Metaheuristic Algorithm. In Proceedings of the 2025 International Conference on Artificial Intelligence in Information and Communication (ICAIIC), Fukuoka, Japan, 18–21 February 2025; pp. 665–670. [Google Scholar]
  32. Kamal, S.; Alhasson, H.F.; Alnusayri, M.; Alatiyyah, M.; Aljuaid, H.; Jalal, A.; Liu, H. Vision Sensor for Automatic Recognition of Human Activities via Hybrid Features and Multi-Class Support Vector Machine. Sensors 2025, 25, 200. [Google Scholar] [CrossRef]
  33. Li, S.; Liu, J.; Xu, W.; Zhang, S.; Zhao, M.; Miao, L.; Hui, M.; Wang, Y.; Hou, Y.; Cong, B. A multi-class support vector machine classification model based on 14 microRNAs for forensic body fluid identification. Forensic Sci. Int. Genet. 2025, 75, 103180. [Google Scholar] [CrossRef]
  34. Bergstra, J.; Bardenet, R.; Bengio, Y.; Kégl, B. Algorithms for hyper-parameter optimization. In Advances in Neural Information Processing Systems, Proceedings of the 25th International Conference on Neural Information Processing Systems, Granada, Spain, 12–15 December 2011; Curran Associates Inc.: Red Hook, NY, USA, 2011; Volume 24. [Google Scholar]
  35. Bergstra, J.; Yamins, D.; Cox, D.D. Hyperopt: A Python Library for Optimizing the Hyperparameters of Machine Learning Algorithms. SciPy 2013, 13, 20. [Google Scholar]
  36. Akiba, T.; Sano, S.; Yanase, T.; Ohta, T.; Koyama, M. Optuna: A next-generation hyperparameter optimization framework. In Proceedings of the 25th ACM SIGKDD International Conference on Knowledge Discovery & Data Mining, Anchorage, AK, USA, 4–8 August 2019; pp. 2623–2631. [Google Scholar]
  37. Radhika, Y. Resnet-53 for Alzheimer’s Disease Detection from MRI Images and Analysis with SVM Tuning with Hyper Optimization Technique. In Proceedings of the 2024 4th International Conference on Sustainable Expert Systems (ICSES), Kaski, Nepal, 15–17 October 2024; pp. 1065–1072. [Google Scholar]
  38. Efendi, A.; Fitri, I.; Nurcahyo, G.W. Improvement of Machine Learning Algorithms with Hyperparameter Tuning on Various Datasets. In Proceedings of the 2024 International Conference on Future Technologies for Smart Society (ICFTSS), Kuala Lumpur, Malaysia, 7–8 August 2024; pp. 75–79. [Google Scholar]
  39. Shin, J.; Matsumoto, M.; Maniruzzaman, M.; Hasan, M.A.M.; Hirooka, K.; Hagihara, Y.; Kotsuki, N.; Inomata-Terada, S.; Terao, Y.; Kobayashi, S. Classification of Hand-Movement Disabilities in Parkinson’s Disease Using a Motion-Capture Device and Machine Learning. IEEE Access 2024, 12, 52466–52479. [Google Scholar] [CrossRef]
  40. Cortes, C.; Vapnik, V. Support-vector networks. Mach. Learn. 1995, 20, 273–297. [Google Scholar] [CrossRef]
  41. Ben-Hur, A.; Weston, J. A user’s guide to support vector machines. Data Min. Tech. Life Sci. 2010, 609, 223–239. [Google Scholar]
  42. Cervantes, J.; Garcia-Lamont, F.; Rodríguez-Mazahua, L.; Lopez, A. A comprehensive survey on support vector machine classification: Applications, challenges and trends. Neurocomputing 2020, 408, 189–215. [Google Scholar] [CrossRef]
  43. Ji, Y.; Song, L.; Yuan, H.; Li, H.; Peng, W.; Sun, J. Prediction of strip section shape for hot-rolled based on mechanism fusion data model. Appl. Soft Comput. 2023, 146, 110670. [Google Scholar] [CrossRef]
  44. Andhalkar, S.; Momin, B. Multiclass IFROWNN classification algorithm using OVA and OVO strategy. In Proceedings of the 2018 9th International Conference on Computing, Communication and Networking Technologies (ICCCNT), Bengaluru, India, 10–12 July 2018; pp. 1–7. [Google Scholar]
  45. Pokhrel, P. A Comparison of AutoML Hyperparameter Optimization Tools for Tabular Data. Master’s Thesis, Youngstown State University, Youngstown, OH, USA, 2023. [Google Scholar]
  46. Shekhar, S.; Bansode, A.; Salim, A. A comparative study of hyper-parameter optimization tools. In Proceedings of the 2021 IEEE Asia-Pacific Conference on Computer Science and Data Engineering (CSDE), Brisbane, Australia, 8–10 December 2021; pp. 1–6. [Google Scholar]
  47. Shar, L.K.; Duong, T.N.B.; Yeo, Y.C.; Fan, J. Empirical Evaluation of Hyper-parameter Optimization Techniques for Deep Learning-based Malware Detectors. Procedia Comput. Sci. 2024, 246, 2090–2099. [Google Scholar] [CrossRef]
  48. Woźniacki, A.; Książek, W.; Mrowczyk, P. A novel approach for predicting the survival of colorectal cancer patients using machine learning techniques and advanced parameter optimization methods. Cancers 2024, 16, 3205. [Google Scholar] [CrossRef]
  49. Khan, S.A.; Khan, M.A.; Amin, M.N.; Ali, M.; Althoey, F.; Alsharari, F. Sustainable alternate binding material for concrete using waste materials: A testing and computational study for the strength evaluation. J. Build. Eng. 2023, 80, 107932. [Google Scholar] [CrossRef]
  50. Kiraga, S.; Peters, R.T.; Molaei, B.; Evett, S.R.; Marek, G. Reference evapotranspiration estimation using genetic algorithm-optimized machine learning models and standardized Penman–Monteith equation in a highly advective environment. Water 2024, 16, 12. [Google Scholar] [CrossRef]
  51. Pedregosa, F.; Varoquaux, G.; Gramfort, A.; Michel, V.; Thirion, B.; Grisel, O.; Blondel, M.; Prettenhofer, P.; Weiss, R.; Dubourg, V. Scikit-learn: Machine learning in Python. J. Mach. Learn. Res. 2011, 12, 2825–2830. [Google Scholar]
  52. Mun, S.; Oh, Y.-j.; Lee, S. Data Processing Method for Evaluating Pipe Wall Thinning in Nuclear Secondary Systems using SVM Regression Algorithm. Nucl. Eng. Technol. 2025, 57, 103517. [Google Scholar] [CrossRef]
  53. Sahoo, R.; Karmakar, S. Comparative analysis of machine learning and deep learning techniques on classification of artificially created partial discharge signal. Measurement 2024, 235, 114947. [Google Scholar] [CrossRef]
  54. Zhou, B.; Guo, W.; Wang, M.; Zhang, Y.; Zhang, R.; Yin, Y. The spike recognition in strong motion records model based on improved feature extraction method and SVM. Comput. Geosci. 2024, 188, 105603. [Google Scholar] [CrossRef]
  55. Que, Z.; Lin, C.-J. One-class SVM probabilistic outputs. IEEE Trans. Neural Netw. Learn. Syst. 2024, 36, 6244–6256. [Google Scholar] [CrossRef]
  56. Farhadpour, S.; Warner, T.A.; Maxwell, A.E. Selecting and interpreting multiclass loss and accuracy assessment metrics for classifications with class imbalance: Guidance and best practices. Remote Sens. 2024, 16, 533. [Google Scholar] [CrossRef]
  57. Alsmirat, M.; Kharsa, R.; Alzoubi, R. Supervised Deep Learning for Ideal Identification of Image Retargeting Techniques. IEEE Access 2024, 12, 2169–3536. [Google Scholar] [CrossRef]
  58. Xie, Y.; Li, S.; Chen, Z.; Du, H.; Jia, X.; Tang, J.; Du, Y. Malware Classification Method Based on Dynamic Features with Sensitive Behaviors. In Proceedings of the 2024 IEEE International Conference on Systems, Man, and Cybernetics (SMC), Kuching, Malaysia, 6–10 October 2024; pp. 4168–4173. [Google Scholar]
  59. Macsik, P.; Pavlovicova, J.; Kajan, S.; Goga, J.; Kurilova, V. Image preprocessing-based ensemble deep learning classification of diabetic retinopathy. IET Image Process. 2024, 18, 807–828. [Google Scholar] [CrossRef]
  60. Pearson, K. LIII. On lines and planes of closest fit to systems of points in space. Lond. Edinb. Dublin Philos. Mag. J. Sci. 1901, 2, 559–572. [Google Scholar] [CrossRef]
  61. Chen, T.; Guestrin, C. Xgboost: A scalable tree boosting system. In Proceedings of the 22nd ACM Sigkdd International Conference on Knowledge Discovery and Data Mining, San Francisco, CA, USA, 13–17 August 2016; pp. 785–794. [Google Scholar]
  62. Ke, G.; Meng, Q.; Finley, T.; Wang, T.; Chen, W.; Ma, W.; Ye, Q.; Liu, T.-Y. Lightgbm: A highly efficient gradient boosting decision tree. In Advances in Neural Information Processing Systems, Proceedings of the 31st International Conference on Neural Information Processing Systems, Long Beach, CA, USA, 4–9 December 2017; Curran Associates Inc.: Red Hook, NY, USA, 2017; Volume 30. [Google Scholar]
  63. Liaw, R.; Liang, E.; Nishihara, R.; Moritz, P.; Gonzalez, J.E.; Stoica, I. Tune: A research platform for distributed model selection and training. arXiv 2018, arXiv:1807.05118. [Google Scholar]
  64. Tan, J.M.; Liao, H.; Liu, W.; Fan, C.; Huang, J.; Liu, Z.; Yan, J. Hyperparameter optimization: Classics, acceleration, online, multi-objective, and tools. Math. Biosci. Eng. 2024, 21, 6289–6335. [Google Scholar] [CrossRef] [PubMed]
  65. Balandat, M.; Karrer, B.; Jiang, D.; Daulton, S.; Letham, B.; Wilson, A.G.; Bakshy, E. BoTorch: A framework for efficient Monte-Carlo Bayesian optimization. In Advances in Neural Information Processing Systems, Proceedings of the 34th International Conference on Neural Information Processing Systems, Vancouver, BC, Canada, 6–12 December 2020; Curran Associates Inc.: Red Hook, NY, USA, 2020; Volume 33, pp. 21524–21538. [Google Scholar]
Figure 1. SVM classification for linearly separable data [33].
Electronics 14 02173 g001
Figure 2. SVM with kernel trick for nonlinearly separable data [43].
Electronics 14 02173 g002
Figure 3. Classification margin, hyperplane, and mathematical description of SVM [40].
Electronics 14 02173 g003
Figure 4. Multi-class approaches of SVM [44].
Electronics 14 02173 g004
Figure 5. The workflow for using Hyperopt and Optuna to optimize hyperparameters.
Electronics 14 02173 g005
Figure 6. The proposed architecture for predicting mobile phone price.
Electronics 14 02173 g006
Figure 7. The distribution of training and testing sets.
Electronics 14 02173 g007
Figure 8. The comparison of the training process trends between the Hyperopt and Optuna frameworks for optimizing SVM hyperparameters in mobile phone price prediction using 5-fold cross-validation.
Electronics 14 02173 g008
Figure 9. The confusion matrix of predicting result using SVM, SVMHYP, and SVMOPT models across 5-fold cross-validation.
Electronics 14 02173 g009
Figure 10. The bar chart compares the accuracy of three SVM models across five cross-validation folds.
Electronics 14 02173 g010
Figure 11. The distribution of kernel types across accuracy levels for SVMHYP and SVMOPT models.
Electronics 14 02173 g011
Table 1. The mobile phone price classification studies.
AuthorYearDataset SplitModels UsedHPO MethodsBest Accuracy Result
Nasser et al. [3] 201970% training, 30% testingANN *NS *ANN: 96.31%
Pipalia and Bhadja [4]202070% training, 30% testingLR, KNN, DT, SVM, GBNS *GB: 90%
Çetın and Koç [5] 202180% training, 20% testingRF, LR, DT, LDA *, KNN, SVMGrid SearchSVM: 95.8%
Güvenç et al. [6] 202180% training, 20% validationKNN, DNN *Trial-and-ErrorDNN: 94%
Kalaivani et al. [7] 2021NS *SVM, RF, LRNS *SVM: 97%
Pramanik et al. [8]202180% training, 20% validationLR, KNN, SVM, NB *, DT, RF, ANN *, XGBoost, LGBM *, CatBoost *, AdaBoost *NS *SVM: 96.77%
Kiran and Jebakumar [9]202280% training, 20% testingDT, LDA *, NB *, KNN, RFNS *LDA: 95%
Hu [10]202270% training, 30% testingSVM, DT, KNN, NB *NS *SVM: 95.5%
Chen [11]202380% training, 20% testingMLP *GivianMLP: 95.8%
Ercan and Şimşek [12] 202370% training, 30% testingLR, SVM, DT, KNNNS *SVM: 96%
Zhang et al. [13]202370% training, 15% validation, and 15% testing.DBO-XGBoost, LR, DT, RF, AdaBoost *DBO algorithmDBO-XGBoost: 95.5%
Sunariya et al. [14] 2024NS *SVM, RF, DT, LR, KNNNS *SVM: 98%
* ANN = Artificial Neural Network, NS= Not Specified, LDA = Linear Discriminant Analysis, DNN = Deep Neural Networks, NB = Naïve Bayes, LGBM = Light Gradient Boosting Machine, CatBoost = Categorical Boosting, AdaBoost = Adaptive Boosting, MLP = Multilayer Perceptron.
Table 2. The description of the variables [2].
Target and
Features
Variable NameDescriptionTypeNull Count
Target ( y )price_rangePrice range (0: Low, 1: Medium, 2: High, 3: Very High)int640
Feature ( x 1 )battery_powerBattery capacityint640
Feature ( x 2 )blueBluetooth (0: No, 1: Yes)int640
Feature ( x 3 )clock_speedProcessor speed (GHz)float640
Feature ( x 4 )dual_simDual SIM (0: No, 1: Yes)int640
Feature ( x 5 )fcFront camera resolution (MP)int640
Feature ( x 6 )four_g4G support (0: No, 1: Yes)int640
Feature ( x 7 )int_memoryInternal memory (GB)int640
Feature ( x 8 )m_depThickness (cm)float640
Feature ( x 9 )mobile_wtMobile weight (g)int640
Feature ( x 10 )n_coresNumber of processor coresint640
Feature ( x 11 )pcPrimary camera resolution (MP)int640
Feature ( x 12 )px_heightPixel resolution heightint640
Feature ( x 13 )px_widthPixel resolution widthint640
Feature ( x 14 )ramRAM (MB)int640
Feature ( x 15 )sc_hScreen height (cm)int640
Feature ( x 16 )sc_wScreen width (cm)int640
Feature ( x 17 )talk_timeMaximum time that the battery can last on a single charge (sec)int640
Feature ( x 18 )three_g3G support (0: No, 1: Yes)int640
Feature ( x 19 )touch_screenTouch screen support (0: No, 1: Yes)int640
Feature ( x 20 )wifiWi-Fi support (0: No, 1: Yes)int640
Table 3. Description of hyperparameters settings.
HyperparametersDefault ValueSearching Range
kernel‘rbf’‘linear’, ‘poly’, ‘rbf’, ‘sigmoid’
decision_function_shape‘ovr’‘ovr’, ‘ovo’
C11 × 10−2, 1 × 10²
Gammascale4.701 × 10−7, 6.701 × 10⁻⁷
Table 4. The structure of the Confusion Matrix.
Predicted Labels
ClassClass 1Class 2Class n
True LabelsClass 1 T P 1 F 1,2 F 1 , n
Class 2 F 2,1 T P 2 F 2 , n
.....
.....
.....
Class n F n , 1 F n , 2 T P n
Table 5. The SVM hyperparameter searching result using Hyperopt.
Fold NumberBest Trail NumberKernelCGammaDF_STime (s)
Fold 173poly24.0911 5.7263 × 10⁻⁷ovr181
Fold 22linear8.0367 6.6103 × 10⁻⁷ovo530
Fold 334linear0.0339 5.6089 × 10⁻⁷ovo436
Fold 448poly5.0618 6.0715 × 10⁻⁷ovo66
Fold 515linear7.5976 6.2982 × 10⁻⁷ovr751
Table 6. The SVM hyperparameter searching result using Optuna.
Fold NumberBest Trail Number KernelCGammaDF_STime (s)
Fold 16poly28.5306 5.3762 × 10⁻⁷ovr159
Fold 293linear0.0361 5.2013 × 10⁻⁷ovo1101
Fold 30poly61.8569 5.8244 × 10⁻⁷ovr370
Fold 487poly86.5157 6.5313 × 10⁻⁷ovr63
Fold 59linear86.8067 5.4853 × 10⁻⁷ovr1505
Table 7. The performance of the SVM model without HPO for predicting mobile phone prices.
Fold NumberAccuracyMA_PrecisionMA_RecallMA_F1-Score
Fold 195.75%95.79%95.75%95.74%
Fold 295.75%95.82%95.75%95.74%
Fold 394.00%94.00%94.00%93.97%
Fold 494.25%94.25%94.25%94.21%
Fold 595.00%95.01%95.00%95.00%
Average94.95%94.97%94.95%94.93%
Table 8. The performance of the SVMHYP models for predicting mobile phone prices.
Fold NumberAccuracyMA_PrecisionMA_RecallMA_F1-Score
Fold 197.75%97.75%97.75%97.74%
Fold 298.00%98.02%98.00%98.00%
Fold 398.25%98.27%98.25%98.25%
Fold 496.00%96.14%96.00%95.99%
Fold 597.00%97.00%97.00%97.00%
Average97.40%97.44%97.40%97.40%
Table 9. The performance of the SVMOPT models for predicting mobile phone prices.
Fold NumberAccuracyMA_PrecisionMA_RecallMA_F1-Score
Fold 197.75%97.75%97.75%97.74%
Fold 298.50%98.51%98.50%98.50%
Fold 398.00%98.02%98.00%98.00%
Fold 496.50%96.52%96.50%96.50%
Fold 598.25%98.25%98.25%98.25%
Average97.80%97.81%97.80%97.80%
Table 10. The classification accuracy of SVM using different HPO frameworks with and without PCA.
Fold NumberModels Without PCAModels with PCA
SVMSVMHYPSVMOPTSVMSVMHYPSVMOPT
Fold 195.75%97.75%97.75%96.25%97.50%97.50%
Fold 295.75%98.00%98.50%96.25%98.00%98.50%
Fold 394.00%98.25%98.00%95.00%97.25%98.50%
Fold 494.25%96.00%96.50%95.25%96.75%96.75%
Fold 595.00%97.00%98.25%93.00%97.75%98.25%
Average94.95%97.40%97.80%95.15%97.45%97.90%
Table 11. The classification accuracy of SVM, XGBoost, and LGBM models with and without using HPO frameworks.
Fold NumberModels Without HPOModels with HyperoptModels with Optuna
SVMXGBoostLGBMSVMHYPXGBoostHYPLGBMHYPSVMOPTXGBoostOPTLGBMOPT
Fold 195.75%89.75%89.00%97.75%92.75%92.00%97.75%92.75%91.75%
Fold 295.75%93.00%92.25%98.00%94.75%94.00%98.50%95.75%94.75%
Fold 394.00%92.25%92.50%98.25%92.75%92.25%98.00%93.00%92.25%
Fold 494.25%91.50%91.00%96.00%93.25%93.00%96.50%93.25%93.25%
Fold 595.00%89.25%88.75%97.00%93.00%92.50%98.25%93.00%92.75%
Average94.95%91.15%90.70%97.40%93.30%92.75%97.80%93.55%92.95%
Table 12. The comparison of prediction accuracy with 70% training data and 30% testing data.
TechniquesAccuracy
Nasser et al. [3] 96.31%
Pipalia and Bhadja [4]90.00%
Hu [10]95.50%
Ercan and Şimşek [12]96.00%
Proposed (SVMHYP)97.50%
Proposed (SVMOPT)97.67%
Table 13. The comparison of prediction accuracy with 80% training data and 20% testing data.
TechniquesAccuracy
Çetın and Koç [5] 95.80%
Güvenç et al. [6] 94.00%
Pramanik et al. [8]96.77%
Kiran and Jebakumar [9]95.00%
Chen [11]95.80%
Proposed (SVMHYP)98.25%
Proposed (SVMOPT)98.50%
Table 14. The comparison of prediction accuracy with 85% training data and 15% testing data.
TechniquesAccuracy
Zhang et al. [13]95.50%
Proposed (SVMHYP)99.00%
Proposed (SVMOPT)99.67%
Disclaimer/Publisher’s Note: The statements, opinions and data contained in all publications are solely those of the individual author(s) and contributor(s) and not of MDPI and/or the editor(s). MDPI and/or the editor(s) disclaim responsibility for any injury to people or property resulting from any ideas, methods, instructions or products referred to in the content.