Article

Experimental Study on the Propagation Characteristics of LoRa Signals in Maize Fields

College of Information and Electrical Engineering, China Agricultural University, Beijing 100089, China
*
Author to whom correspondence should be addressed.
Electronics 2025, 14(11), 2156; https://doi.org/10.3390/electronics14112156
Submission received: 5 February 2025 / Revised: 23 April 2025 / Accepted: 24 April 2025 / Published: 26 May 2025

Abstract

:
LoRa, as a leading LPWAN technology, plays a pivotal role in enabling long-range, low-power wireless communication, especially in agricultural IoT applications. This study examines the propagation characteristics of 433 MHz LoRa signals in maize fields, focusing on signal attenuation, RSSI, SNR, and packet loss under dense crop conditions. Field experiments were conducted in Wuwei, Gansu Province, with validation tests in Tongliao, Inner Mongolia. The effects of transmitter and receiver antenna heights on signal quality and propagation distance were systematically analyzed. Results show a consistent improvement in signal quality and range with increased antenna height. Path loss models were developed using regression analysis, achieving high predictive accuracy (R2 > 0.9). Validation confirmed the models’ reliability, offering valuable insights for deploying wireless sensor networks (WSNs) in agriculture. Future research will integrate machine learning for dynamic modeling and explore variations across crop growth stages.

1. Introduction

1.1. Research Background

The Long Range (LoRa) is a long-range wireless communication technology based on spread spectrum techniques, classified under low-power wide-area network (LPWAN) communication technologies. Initially designed and promoted by Semtech Corporation in the United States [1,2], this technology offers a straightforward approach to achieving long-distance, low-power wireless communication [3]. LoRa primarily operates in the industrial, scientific, and medical (ISM) frequency bands, including 433 MHz, 868 MHz, and 915 MHz. Among these, the 868 MHz and 915 MHz bands are predominantly used in Europe and North America, while the 433 MHz band is more commonly adopted in Asian countries [4]. The utilization of these frequency bands must comply with the regulatory frameworks of respective countries or regions. As a representative LPWAN technology, LoRa provides a robust solution for Internet of Things (IoT) systems, enabling long-range communication, ultra-low power consumption, and high network capacity. It addresses the challenge of balancing transmission range and power consumption inherent in traditional wireless communication, offering a compelling option for low-power, long-distance communication in IoT applications [5].
The physical layer or wireless modulation of LoRa employs chirp spread spectrum (CSS) technology to establish long-range communication links. Compared with traditional frequency-shift keying (FSK) modulation, LoRa modulation significantly extends communication range while maintaining low power consumption. Chirp spread spectrum technology, with decades of proven applications in military and space communications, is valued for its extended range and robust interference resistance [6,7]. LoRa is the first solution to leverage this technology for cost-effective commercial use, enabling not only large-scale device connectivity but also substantial reductions in the costs of end devices and infrastructure [8]. These advantages have led to its widespread adoption in IoT applications such as smart agriculture, remote metering, and urban management [9].
The technical characteristics are summarized in Table 1 below.
The primary advantage of LoRa modules lies in their exceptional long-distance communication capabilities. A single gateway or base station can provide coverage for an entire city or an area spanning hundreds of square kilometers, with the exact coverage range depending on environmental factors and physical obstructions. In modern smart agriculture, the most widely adopted communication approach employs a star network topology, shown in Figure 1, based on LoRa technology. This topology enables all sensor nodes to communicate directly with a central gateway. In this configuration, field sensors and controllers utilize LoRa wireless sensor network technology to transmit data to an agricultural IoT gateway, facilitating network scalability and ease of management. The agricultural IoT gateway serves as a data aggregation and bridging hub [10,11].
As one of the world’s leading staple crops alongside wheat and rice, maize plays a pivotal role in global food systems. It serves not only as a vital food resource for humans but also as an essential source of livestock feed and a valuable raw material for industrial production, thus holding critical importance in global trade and economic development. According to statistics, the global maize cultivation area amounts to approximately 160 million hectares, accounting for a significant share of the world’s arable land [12]. Projections from the National Grain and Oil Information Center and the China Agricultural Industry Model indicate that by 2024, China’s maize cultivation area will expand to 44.23 million hectares.

1.2. Related Research Work

Typically, LoRa gateways and nodes are deployed in urban and rural environments. However, radio signals may experience attenuation due to diffraction, reflection, scattering, and absorption caused by vegetation and various environmental obstacles. To design efficient wireless systems capable of operating in such conditions, a deeper understanding of their propagation characteristics is essential. Researchers have conducted extensive studies on the behavior of LoRa signals across diverse propagation environments.
Myagmardulam B.A.M. et al. [13] evaluated the impact of canopy openness on the propagation of LoRa signals at the 920 MHz frequency band in hilly forest areas of Japan. Their study revealed that the density of forest canopies significantly influences the signal propagation path and attenuation characteristics. Pensieri S. et al. [14] assessed the performance of LoRaWAN for maritime monitoring applications. By integrating coastal urban environments with vessel-based nodes and inland gateways, they demonstrated the reliable transmission capabilities of LoRaWAN in complex marine and coastal scenarios. Chall R.E.A.L. et al. [15] conducted a study on LoRaWAN networks in various environments in Lebanon, proposing radio propagation models tailored to different conditions and providing a detailed evaluation of their performance. Wu et al. [16] developed a model based on the Leaf Area Index (LAI) and trunk diameter to investigate the propagation characteristics of LoRa signals in mixed forests in eastern China. Mahjoub T.A.M. et al. [17] analyzed the propagation characteristics of LoRa signals in date palm oasis environments in Tunisia. They developed and validated an optimized signal attenuation model based on the specific attributes of palm trees, providing theoretical support for LoRa applications in this region. Anzum R. [18] studied the scattering effects of date palm leaves and branches on LoRa signals. By incorporating Fresnel zone analysis, the study examined the impact of ground and nearby object reflections on signal propagation. The research further elucidated the complex interactions between vegetation structures and environmental characteristics in signal propagation.
Existing studies have clearly demonstrated that plant species exert a significant influence on wireless signal propagation characteristics, with particular attention given to the impact of obstacles in natural outdoor environments on LoRa signal behavior.
However, empirical research on signal attenuation models specific to maize fields remains insufficient, and a systematic analytical framework for this scenario has yet to be established in the existing academic literature.
Given the distinctive characteristics of maize plants, including their significant height and compact planting density, these features substantially impact the propagation of wireless signals within maize fields. To enhance the application of LoRa technology in crop management systems for maize fields, this study focuses on the 433 MHz frequency band to comprehensively investigate the propagation characteristics of LoRa signals within maize fields.
This study is structured as follows. Section 2 expounds on the principles and mathematical methodologies of wireless propagation modeling, and it also offers details regarding the experimental site, materials, and experimental setup. In Section 3, we initially compare the Received Signal Strength Indicator (RSSI) and Signal-to-Noise Ratio (SNR) across different transmitting-end antenna heights. Subsequently, leveraging the commonly used 6-meter transmitting-end and 0.15-meter receiving-end antenna heights, we assess multiple propagation models to select the most suitable one for fitting. This enables us to develop LoRa signal propagation models corresponding to various transmitting-end antenna heights, which are then validated across multiple production sites. Section 4 examines the impact of the receiving-end antenna height on LoRa signals by adjusting its height. Finally, Section 5 summarizes the research findings.
The findings of this research are expected to provide a robust theoretical foundation for developing highly stable and reliable wireless sensor network (WSN) node deployment strategies, as well as offering scientific guidance for optimizing LoRa WSN parameter configurations.

2. Materials and Methods

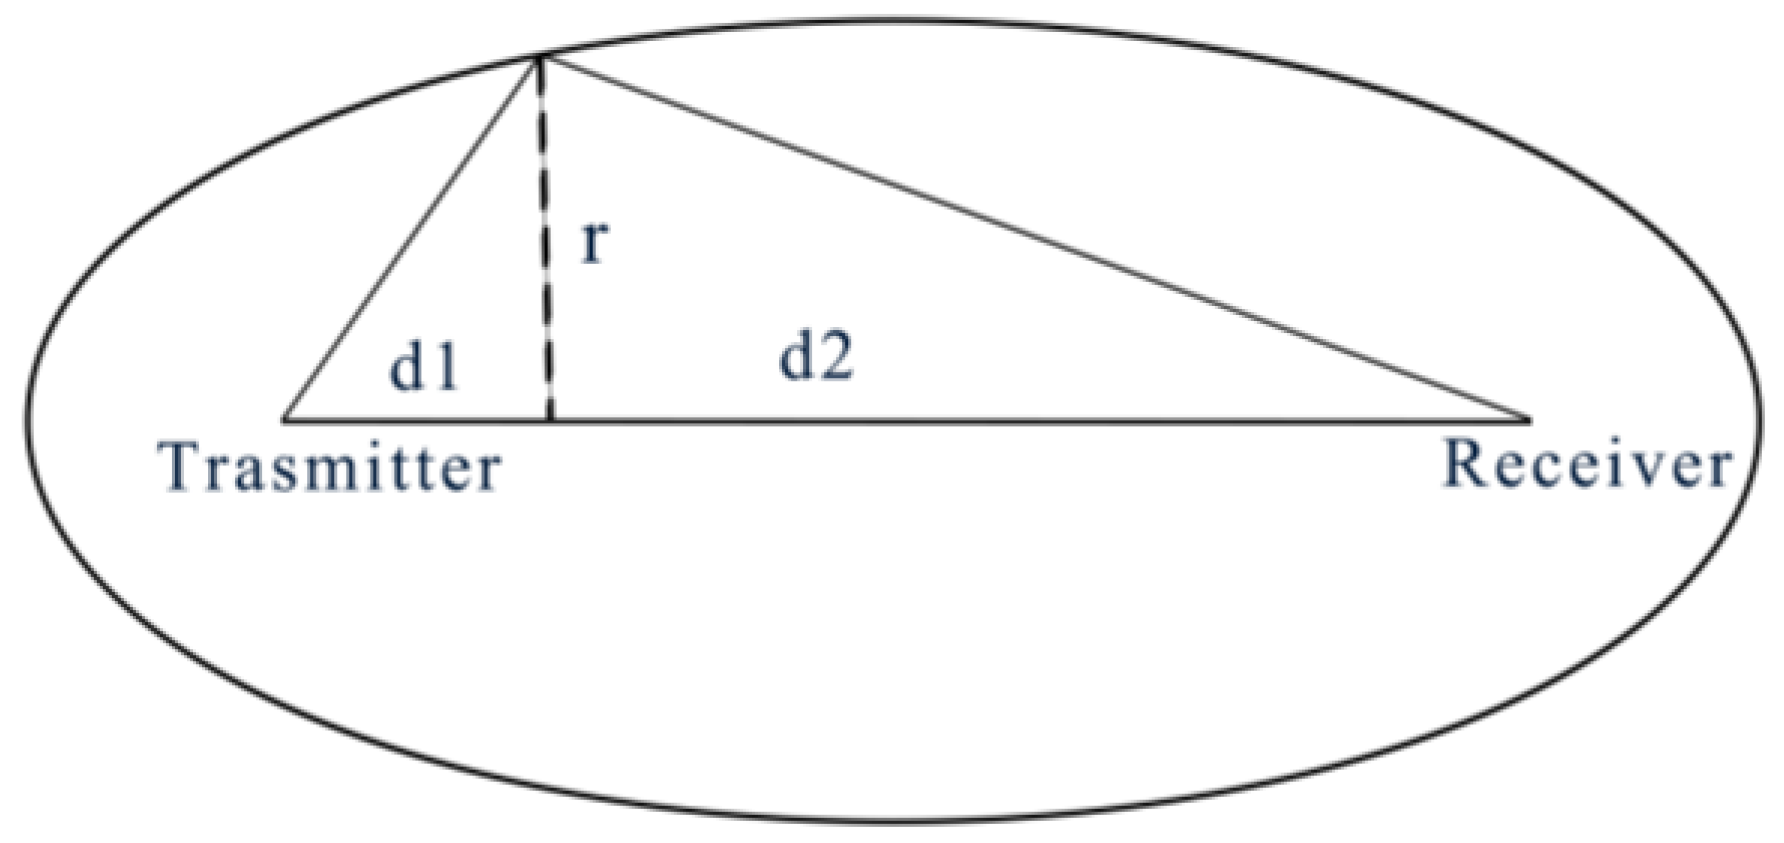
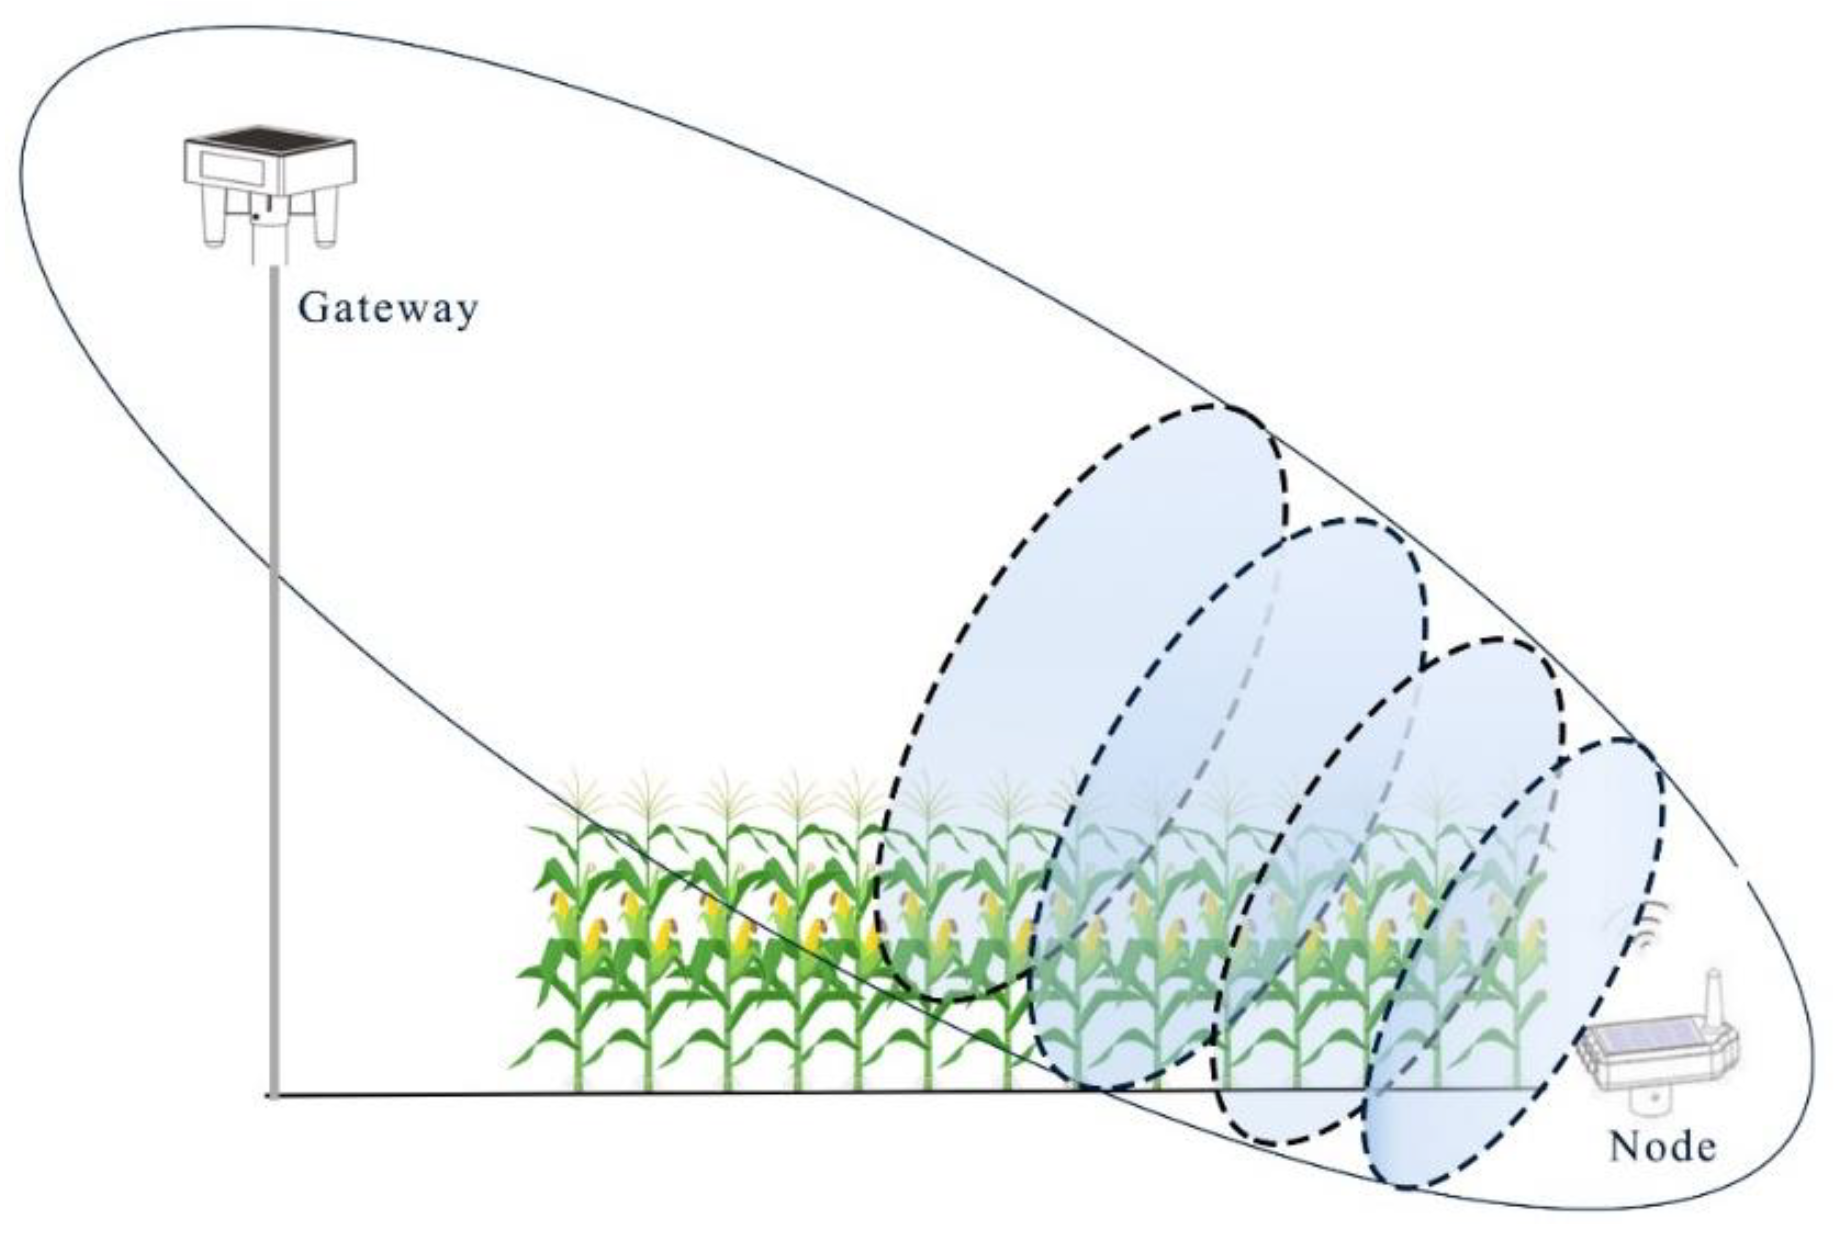
2.1. Propagation Principles of Radio Waves in the Presence of Obstacle

First Fresnel Radius
In wave propagation, each point on a wavefront acts as a secondary source of waves, and the interference between these sources affects the signal strength at the receiver. To analyze the propagation characteristics of waves, the French physicist Augustin-Jean Fresnel introduced a model that divides the space into several concentric ring-shaped regions, known as “Fresnel Zones”. [19]
Definition and Calculation of the First Fresnel Radius
In the process of wireless radio frequency signal propagation, the Fresnel Zone is a series of concentric ellipsoids centered around the pair of transmitting and receiving devices [20].
First Fresnel zone equation:
r = λ d 1 d 2 d
In Figure 2 and Equation (1), λ represents the wavelength, d 1   is the distance from the obstacle plane to the transmitter, d 2 is the distance from the obstacle plane to the receiver. The total distance between the transmitter and receiver is given by d = d 1 + d 2 .
By rotating this ellipsoid 360° around the x-axis, a series of rotating ellipsoidal surfaces are formed, and the space enclosed by these surfaces is referred to as the Fresnel ellipsoid, which represents the spatial Fresnel Zone.

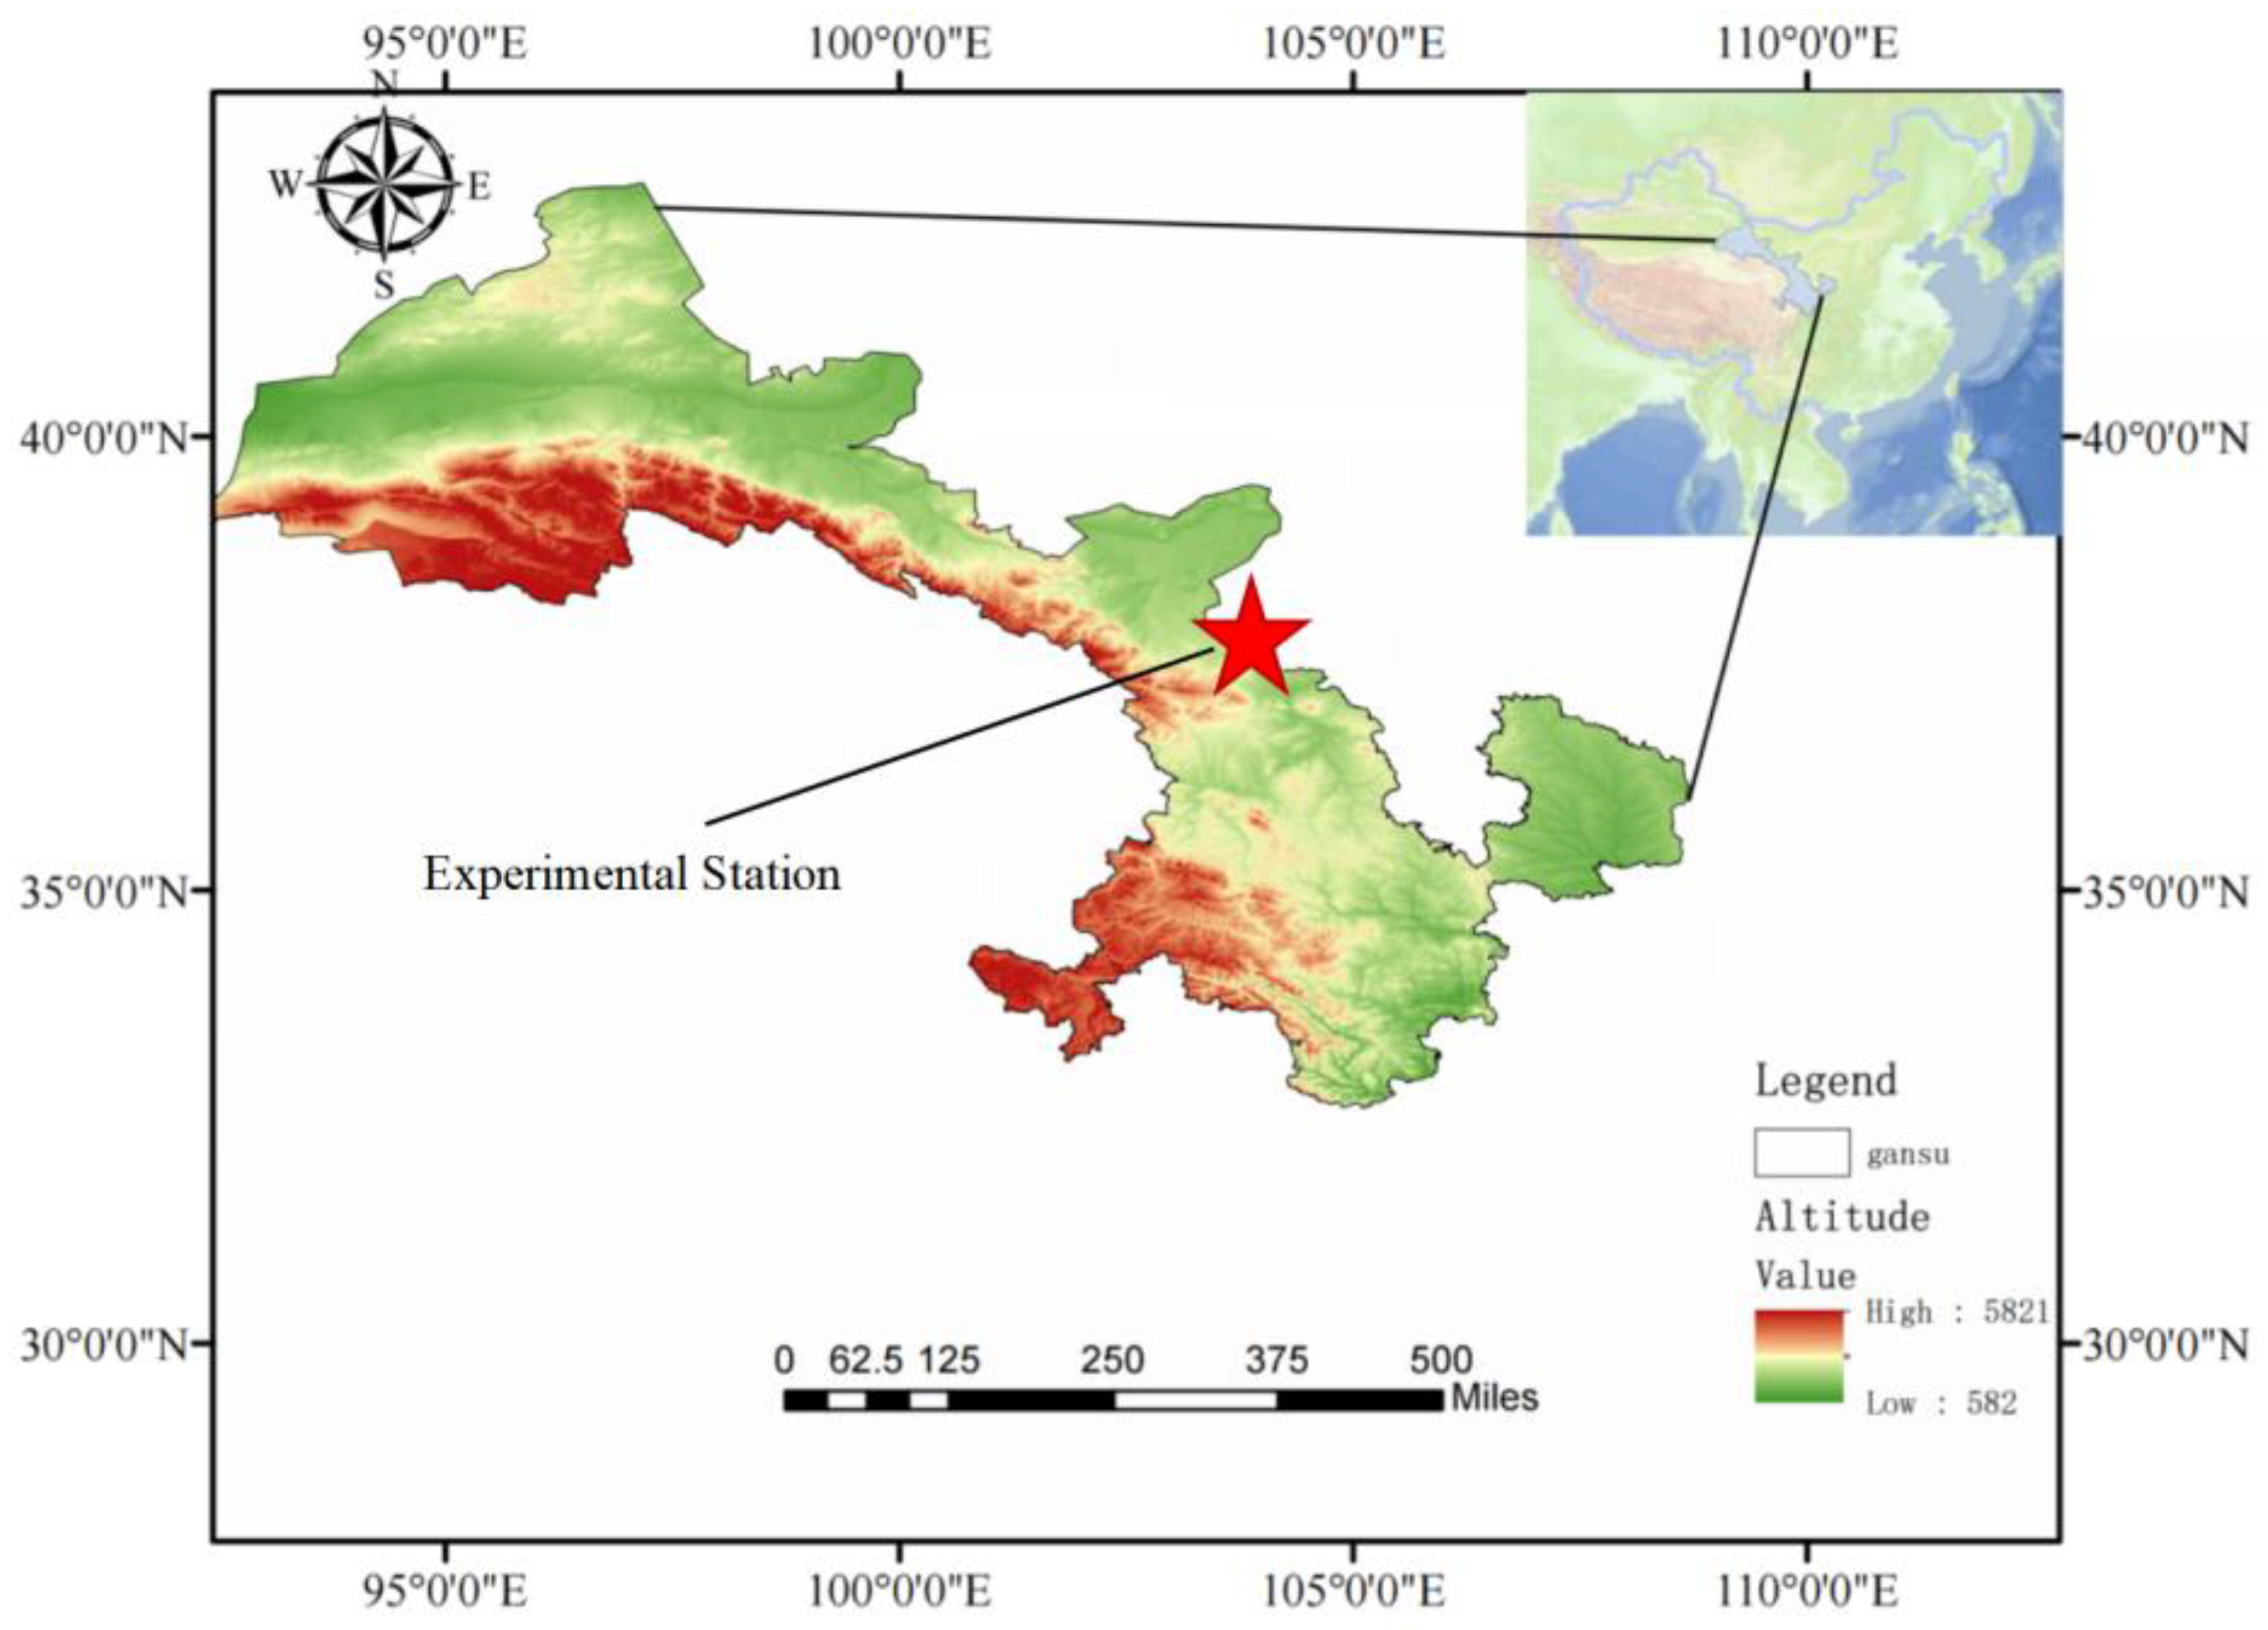
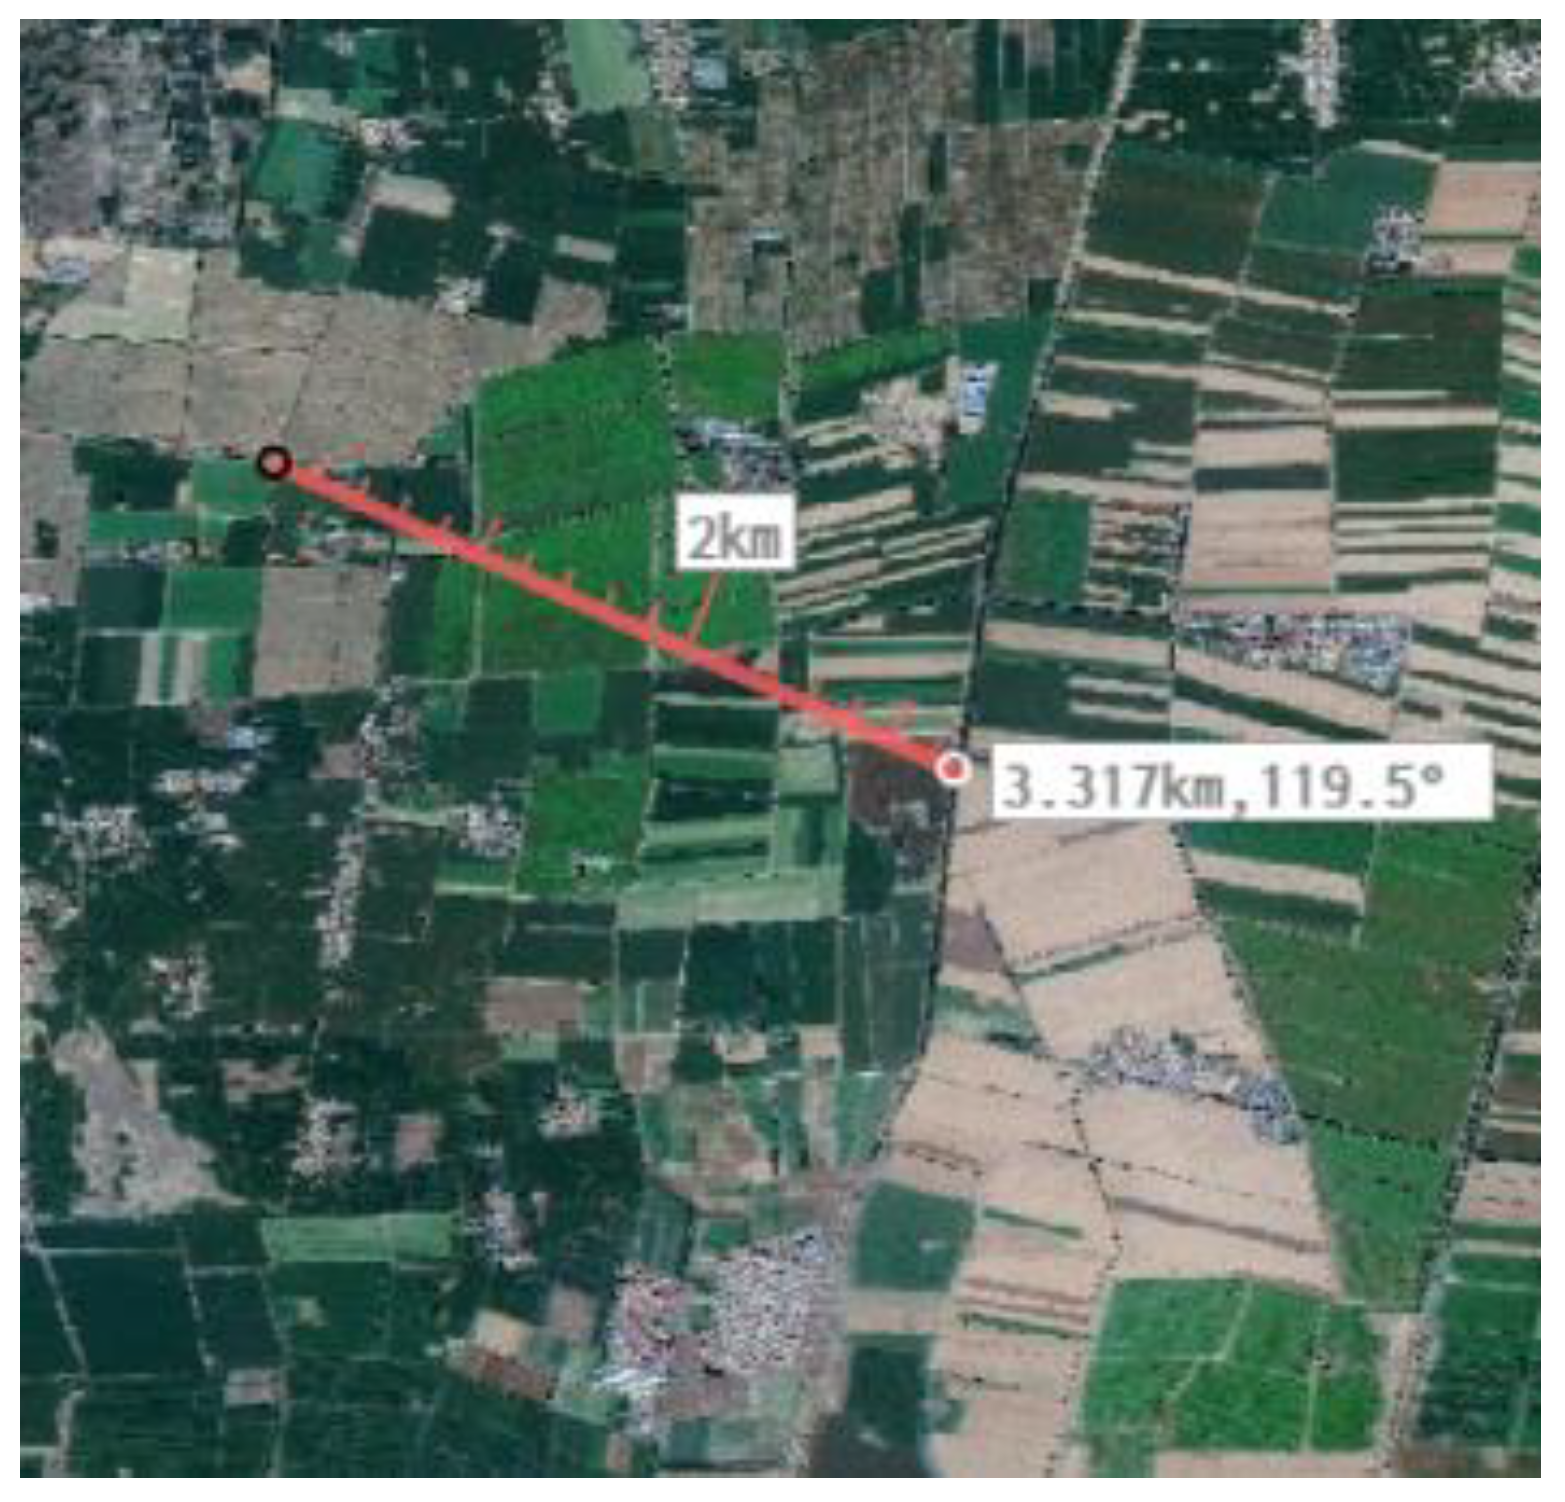
2.2. Experimental Location

The study was carried out in September 2024 in Wuwei City, Gansu Province, China. Gansu Province is characterized by a temperate continental arid climate with distinct seasons, cold winters, and hot summers. The temperature exhibits significant daily and annual variations. Situated in the northwest inland maize-growing region, as shown in Figure 3. Gansu is a key maize seed production base in China, ranking among the top in both maize seed production area and yield. Figure 4 shows the Shiyang River Experimental Station of China Agricultural University.
At this stage, maize was in its peak growth phase, with an average plant height exceeding 2.8 m and stem diameters surpassing 1.7 cm. As shown in Figure 5, the dense vegetation created a significant signal-blocking effect. From the perspective of radio wave propagation, the environmental conditions during this period are highly unfavorable for signal transmission.
As is shown in Figure 6. In Wuwei City, maize cultivation follows the “one-film, two-rows, and one-irrigation pipe” technique, employing a dry sowing and wet germination method with wide-narrow row spacing. The spacing between rows on the film ranges from 35 to 40 cm, while the distance between films ranges from 55 to 60 cm, resulting in an average planting density of 90,000 per hectare.
Validation Experiment Location:
  • Tongliao City, Inner Mongolia
Tongliao City, located in central Inner Mongolia, has relatively flat terrain, a cold and arid climate, sandy soil, and ample sunlight. During the experiment, the maize was in the maturation phase, showing vigorous growth, fully spread leaves, and sturdy stalks. With a planting density of 90,000–105,000 plants per hectare and an average plant height of about 3 m, it represented a typical environment for the study.
2.
KuQa, Xinjiang
KuQa is situated in southern Xinjiang. Its terrain mainly consists of basins and plains in some areas. The climate is arid with a large day–night temperature difference. Some areas have soil suitable for crop growth, and it is rich in sunlight resources. When the experiment took place, the maize was in the maturation stage, featuring vigorous growth, fully expanded leaves, and strong stalks.

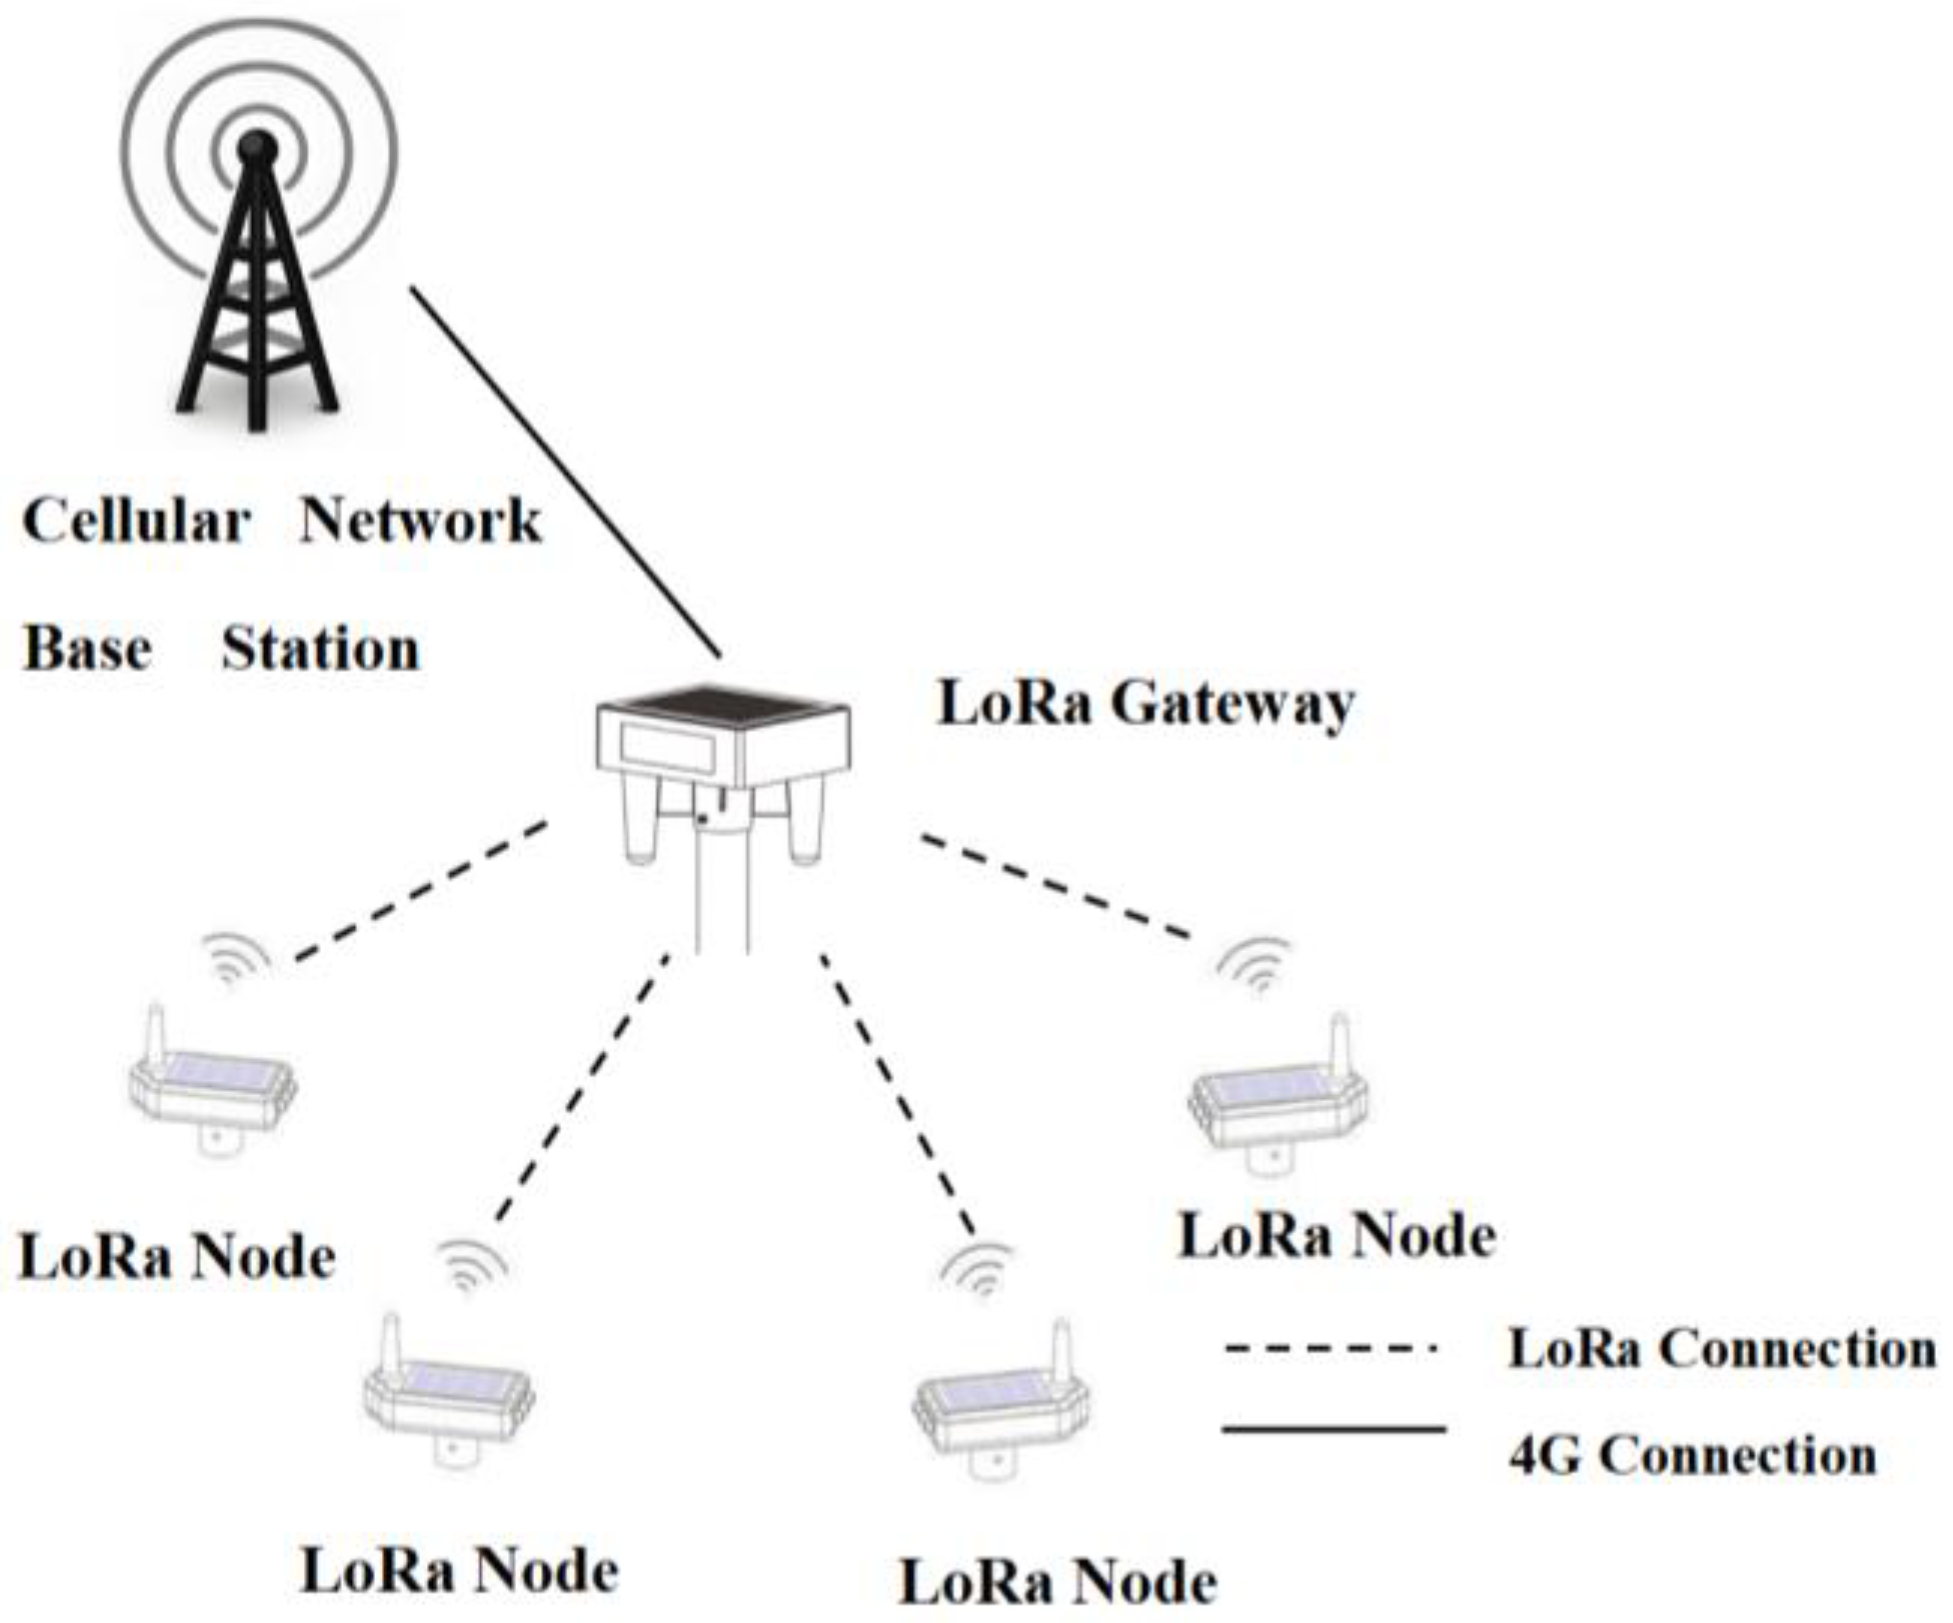
2.3. Hardware and Software Setup

The experimental equipment (gateways and nodes) was sourced from the following manufacturers:
China Agricultural University (developer), located in Beijing, China.
Beijing Lian Chuang Siyuan Measurement and Control Technology Co., Ltd. (developer and manufacturer), based in Beijing, China
Table 2 shows the experimental parameter configuration. Table 3 shows LoRa setting parameters.

3. Adjusting Transmitter Antenna Height Experimental

To mitigate the impact of crop obstructions on signal propagation, two primary strategies are typically employed: (1) increasing the antenna height of the transmitter and (2) raising the antenna height of the receiver. This study designed two experimental setups to simulate signal propagation under various real-world scenarios.

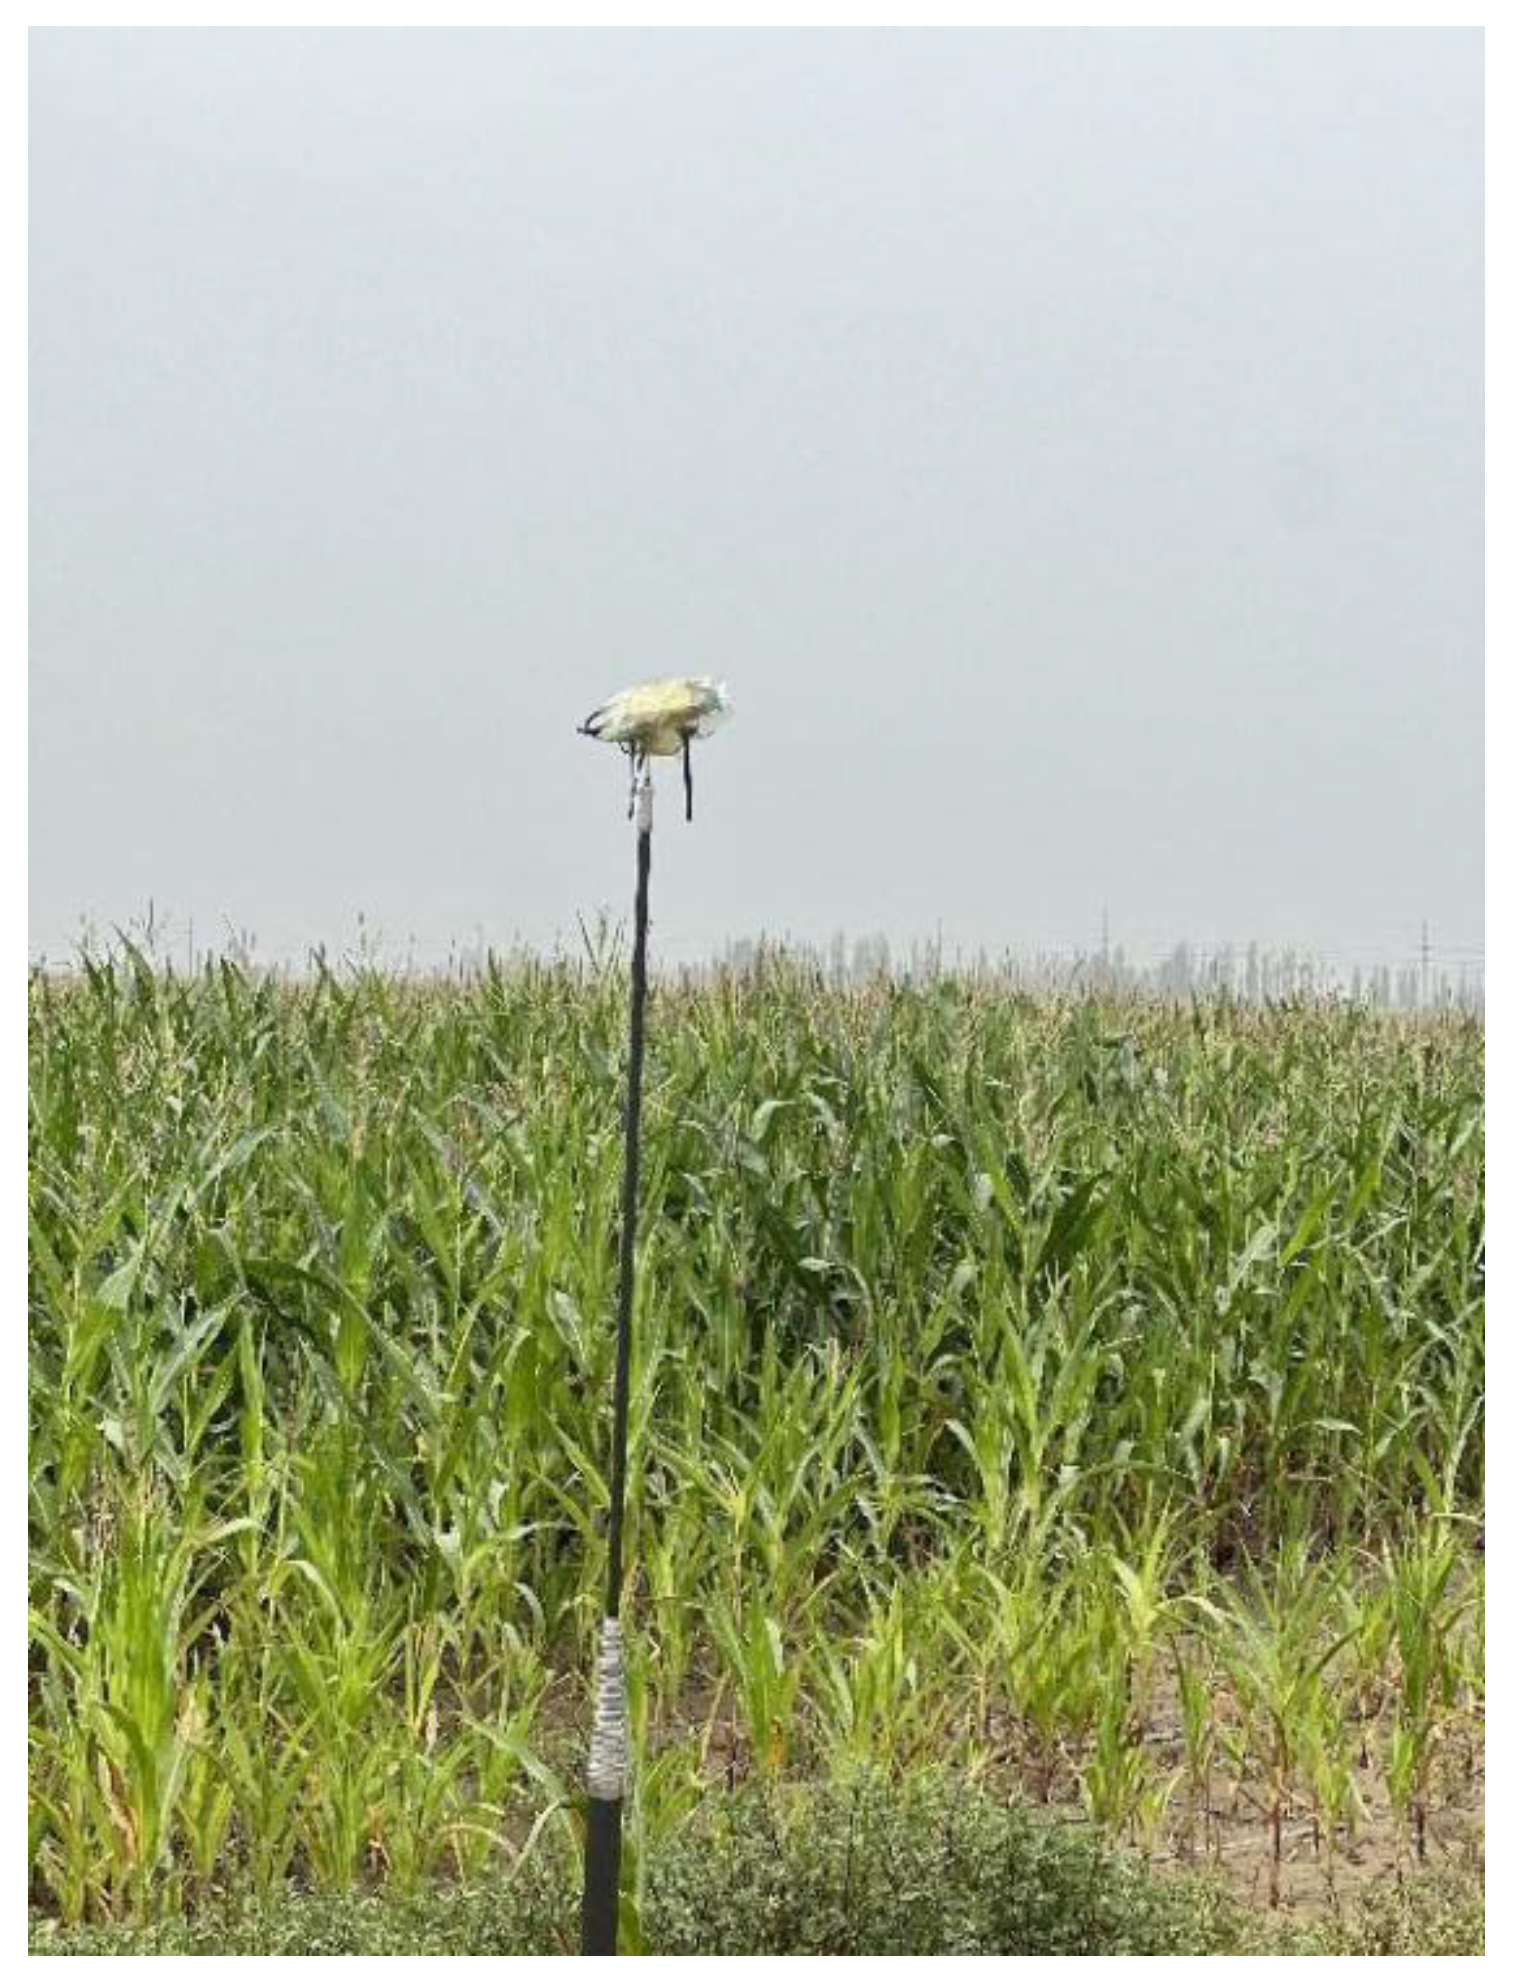
3.1. Adjusting Transmitter Antenna Height Experimental Procedure

Transmitter Antenna Configuration:
A height-adjustable stand was designed to mount the gateway. The stand was placed at the edge of the maize field, allowing the antenna height to be adjusted to 0 m, 2 m, 4 m, 6 m, 8 m, and 10 m. The gateway antenna was configured in a vertically polarized direction, with its top oriented towards the ground to ensure a well-aligned signal path, as illustrated in Figure 7.
Receiver Antenna Configuration:
As shown in Figure 8, the receiver antenna was installed at a height of 10 cm above the ground to simulate the environmental characteristics of field drip irrigation pipe control and measurement nodes, reflecting typical agricultural IoT application scenarios.
Signal Measurement:
The receiving terminal was moved 10 m at a time within the field to collect data on signal quality and range under different gateway antenna heights.
A computer was used to send commands via a 4G module integrated into the gateway. Upon receiving the command, the gateway transmitted the information to the terminal device using the LoRa module. The terminal device recorded the communication’s Received Signal Strength Indicator (RSSI), Signal-to-Noise Ratio (SNR), and success rate for each transmission. Results were subsequently sent back to the connected computer for analysis. Each round of testing involved the transmission of 50 data packets. The terminal device recorded the results for each round and calculated the average values for analysis.

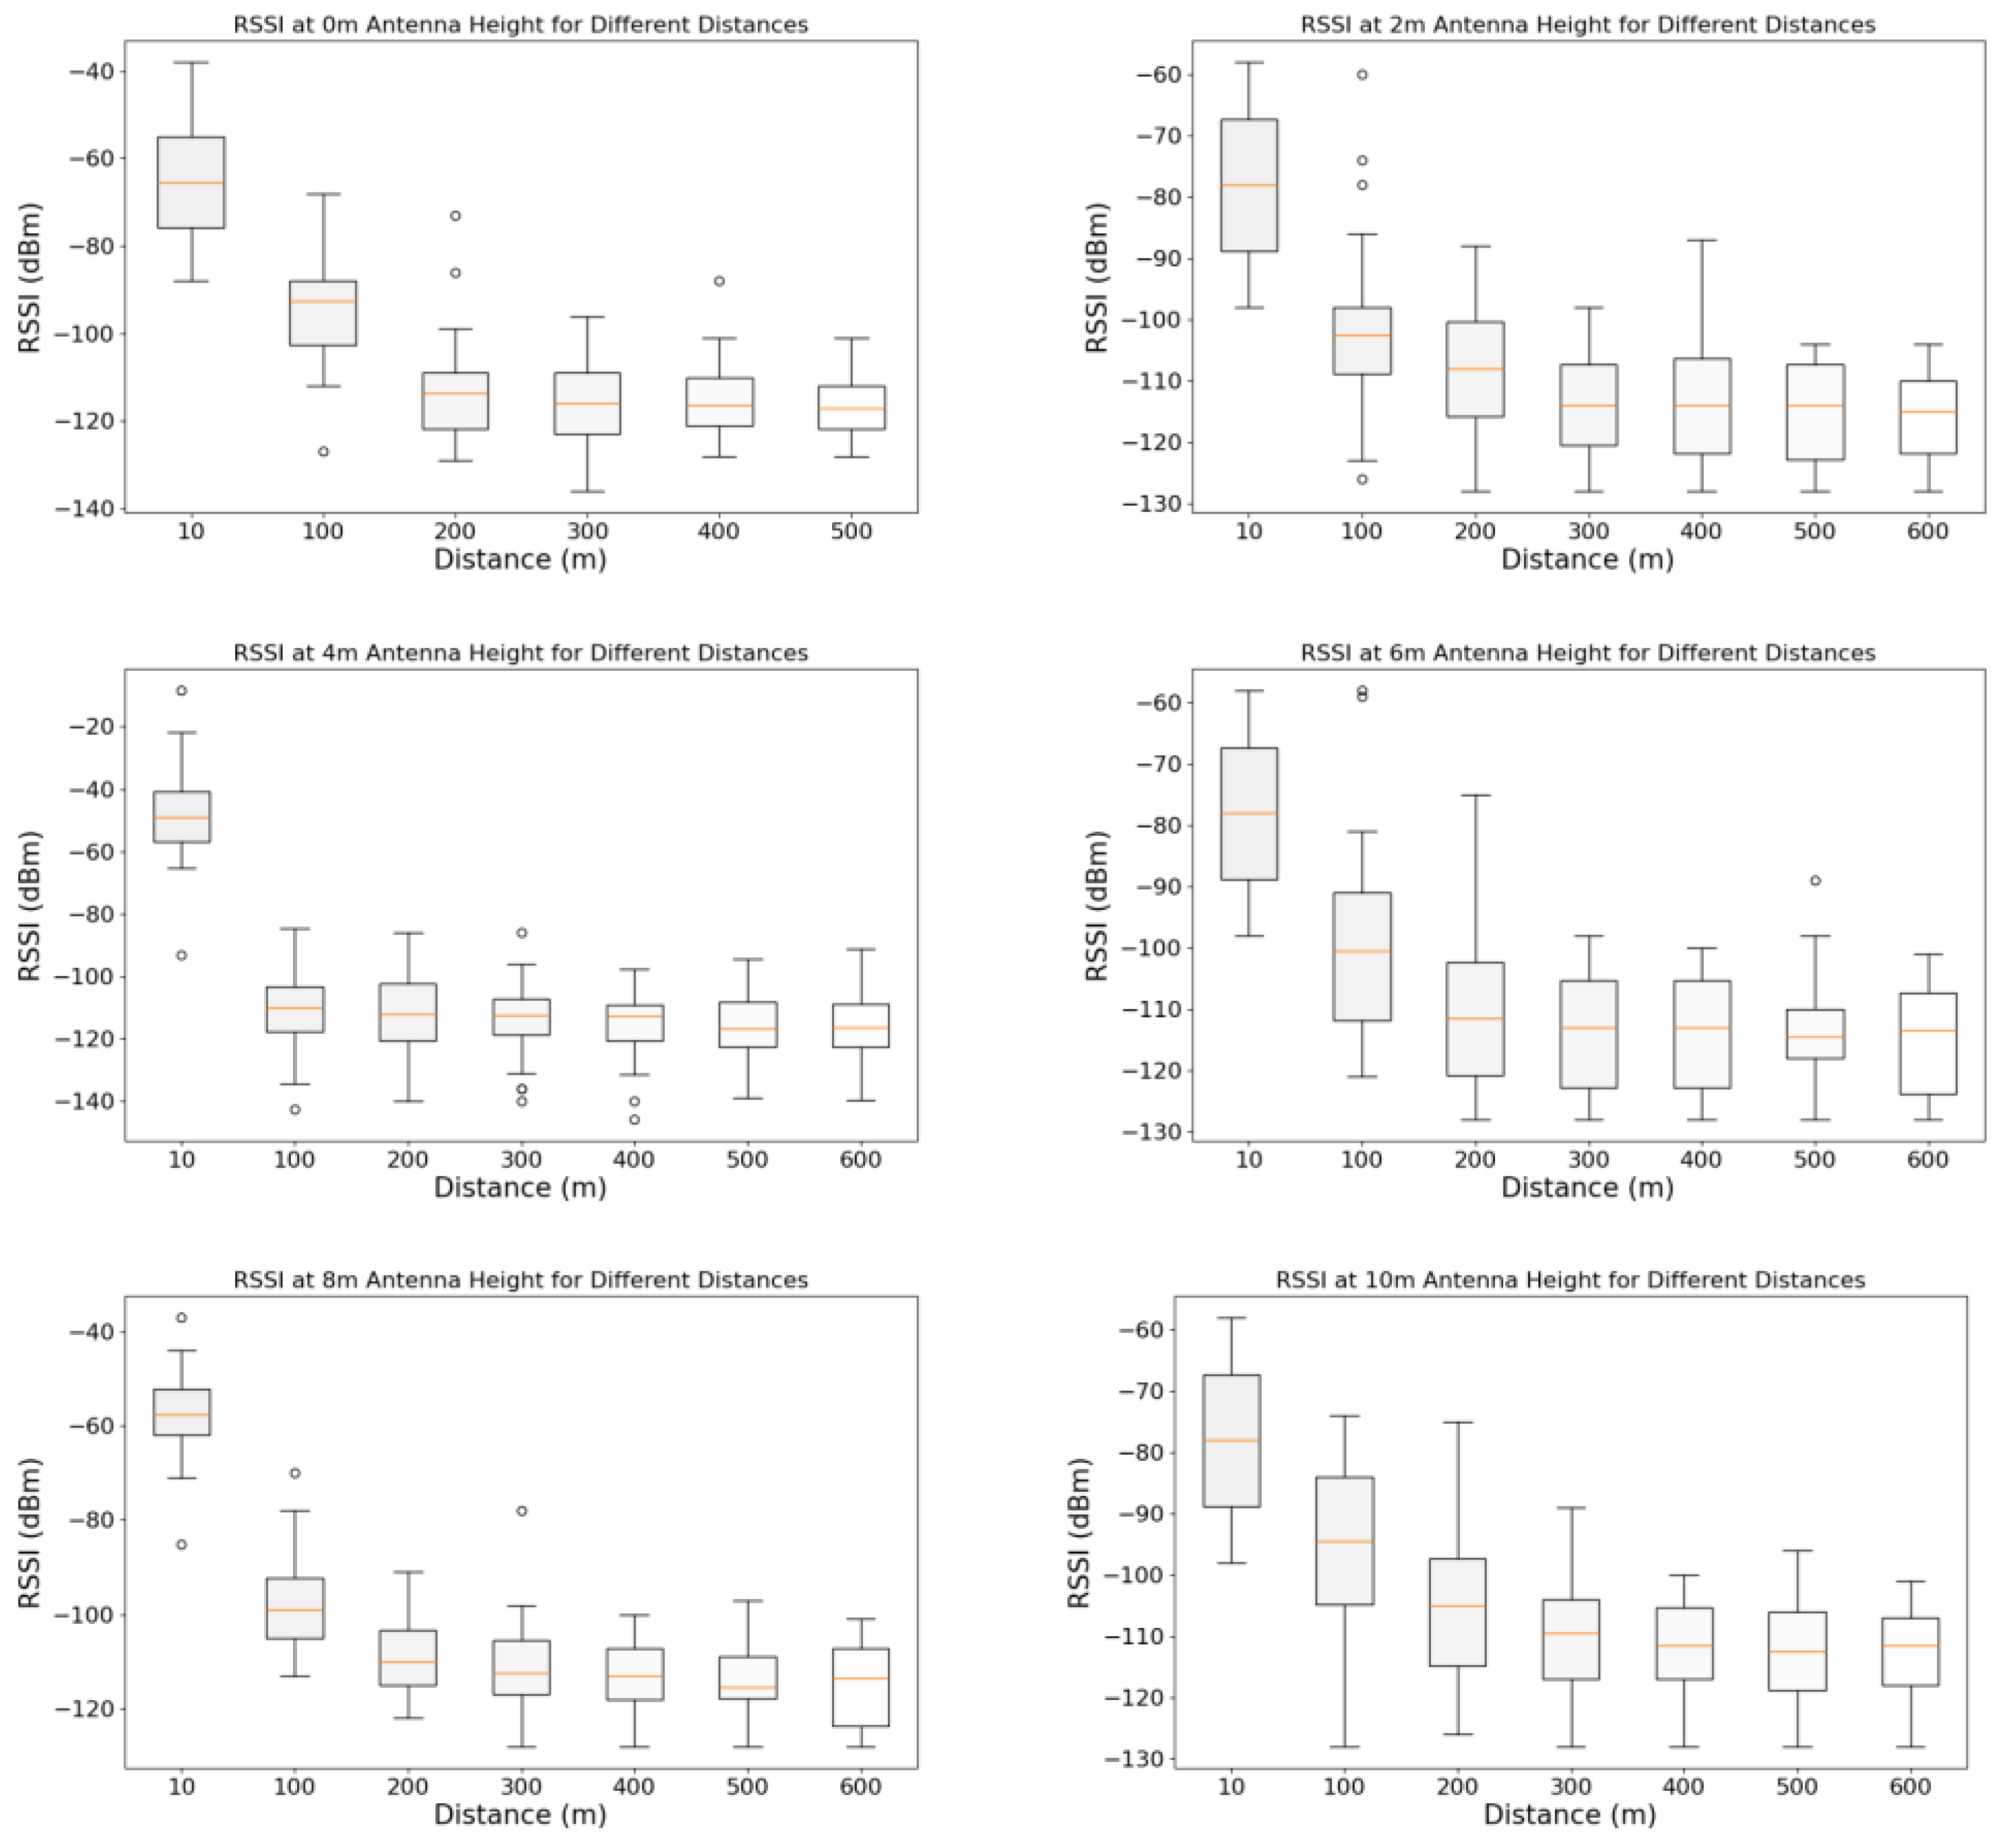
3.2. Effect of Transmitter Antenna Height on RSSI

The Received Signal Strength Indicator (RSSI) represents the power of the received signal, typically measured in dBm, and serves as a critical metric for evaluating wireless network signal strength. Higher RSSI values indicate better signal quality.
Figure 9 depicts box-plots of the Received Signal Strength Indicator (RSSI, unit: dBm) varying with distance (unit: meter) under different antenna heights (0 m, 2 m, 4 m, 6 m, 8 m, 10 m). In each sub-plot, the horizontal axis represents the distance, and the vertical axis represents the RSSI value. The box-plots present the median, interquartile range, and distribution of outliers of the data. Overall, as the distance increases, the median of RSSI generally shows a decreasing trend, indicating that the signal strength weakens with the increase in distance. Meanwhile, the RSSI values at each position have less fluctuation and fewer abnormal data points, which provides a reasonable basis for taking the average of 50 measurements at different positions in the following text.
A clear correlation is observed between RSSI and the transmitter antenna height in Figure 10. As the gateway height increases from 0 m to 10 m, RSSI values at the same distance notably improve, demonstrating a consistent trend of enhanced signal quality.
The overall trend reveals that while higher antenna heights generally yield improved RSSI, the relationship is not strictly linear. The reduction in signal obstruction corresponds to the propagation characteristics defined by the first Fresnel zone. According to radio wave propagation theory, the first Fresnel zone represents the region of minimal obstruction along the signal path, where reduced interference leads to higher signal quality.
The optimal propagation performance is achieved at a transmitter antenna height of 10 m. Within the 0–100 m range, RSSI exhibits significant attenuation, which stabilizes at greater distances, aligning with the typical characteristics of radio signal decay.
Figure 11 indicates a gradual increase in RSSI as the transmitter antenna height rises. Although the overall trend of signal enhancement is evident, the rate of improvement diminishes at greater antenna heights.

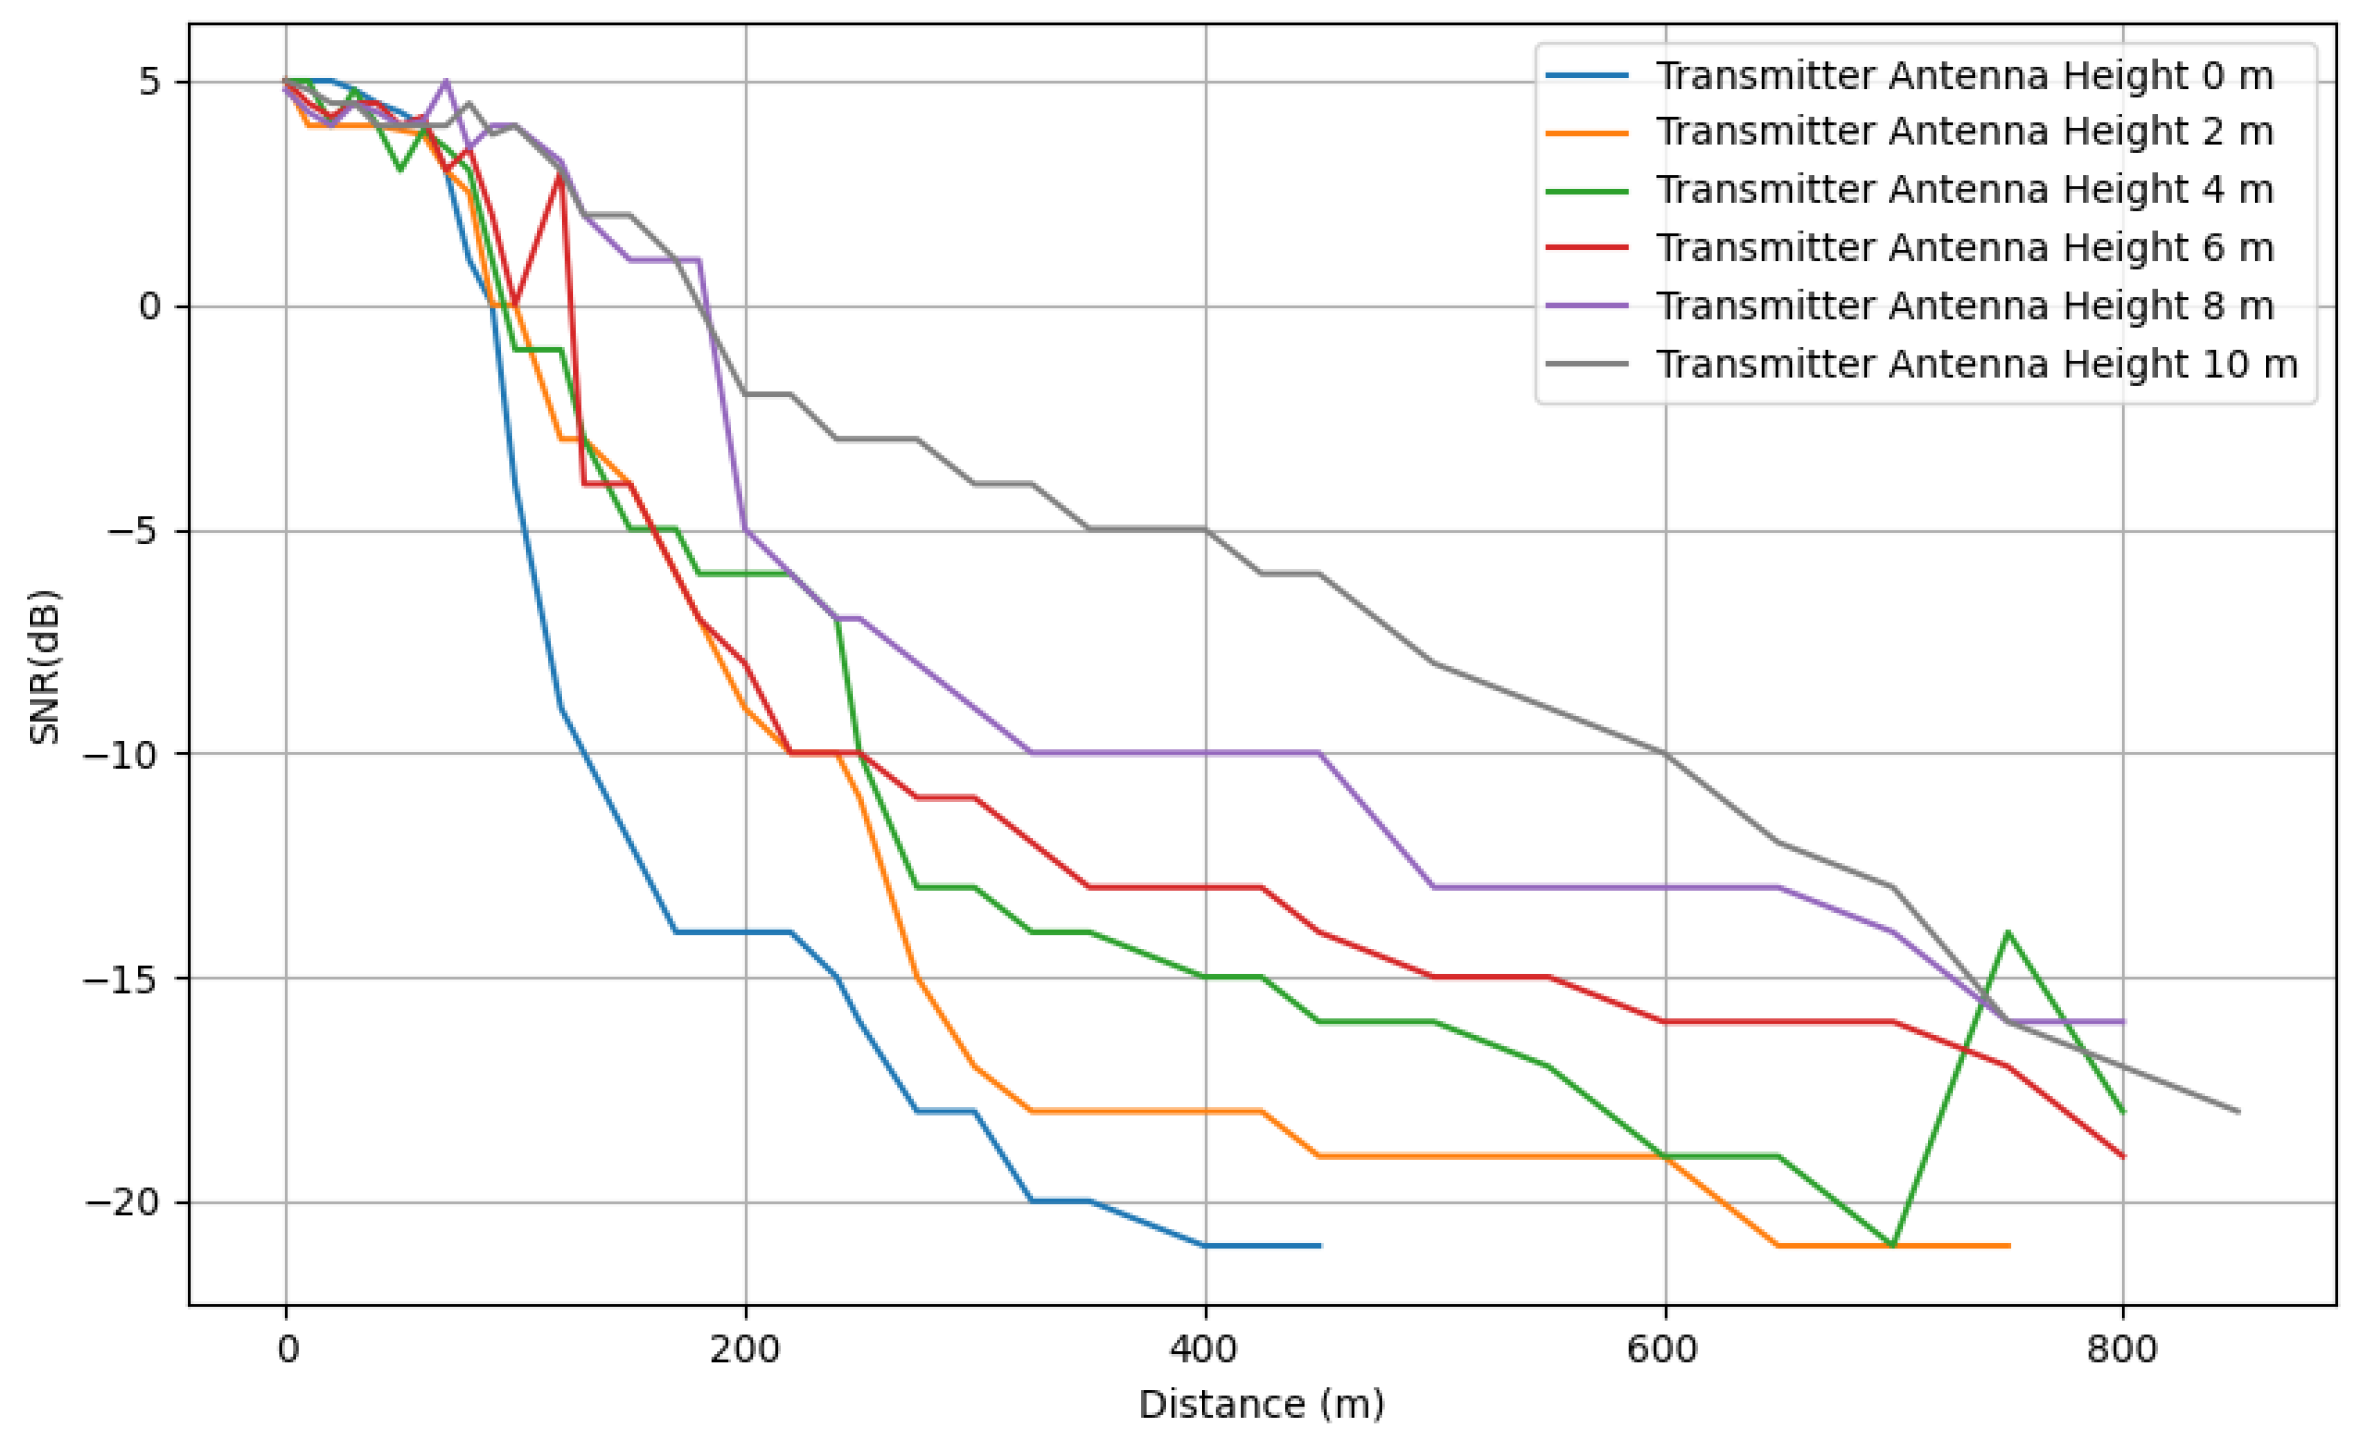
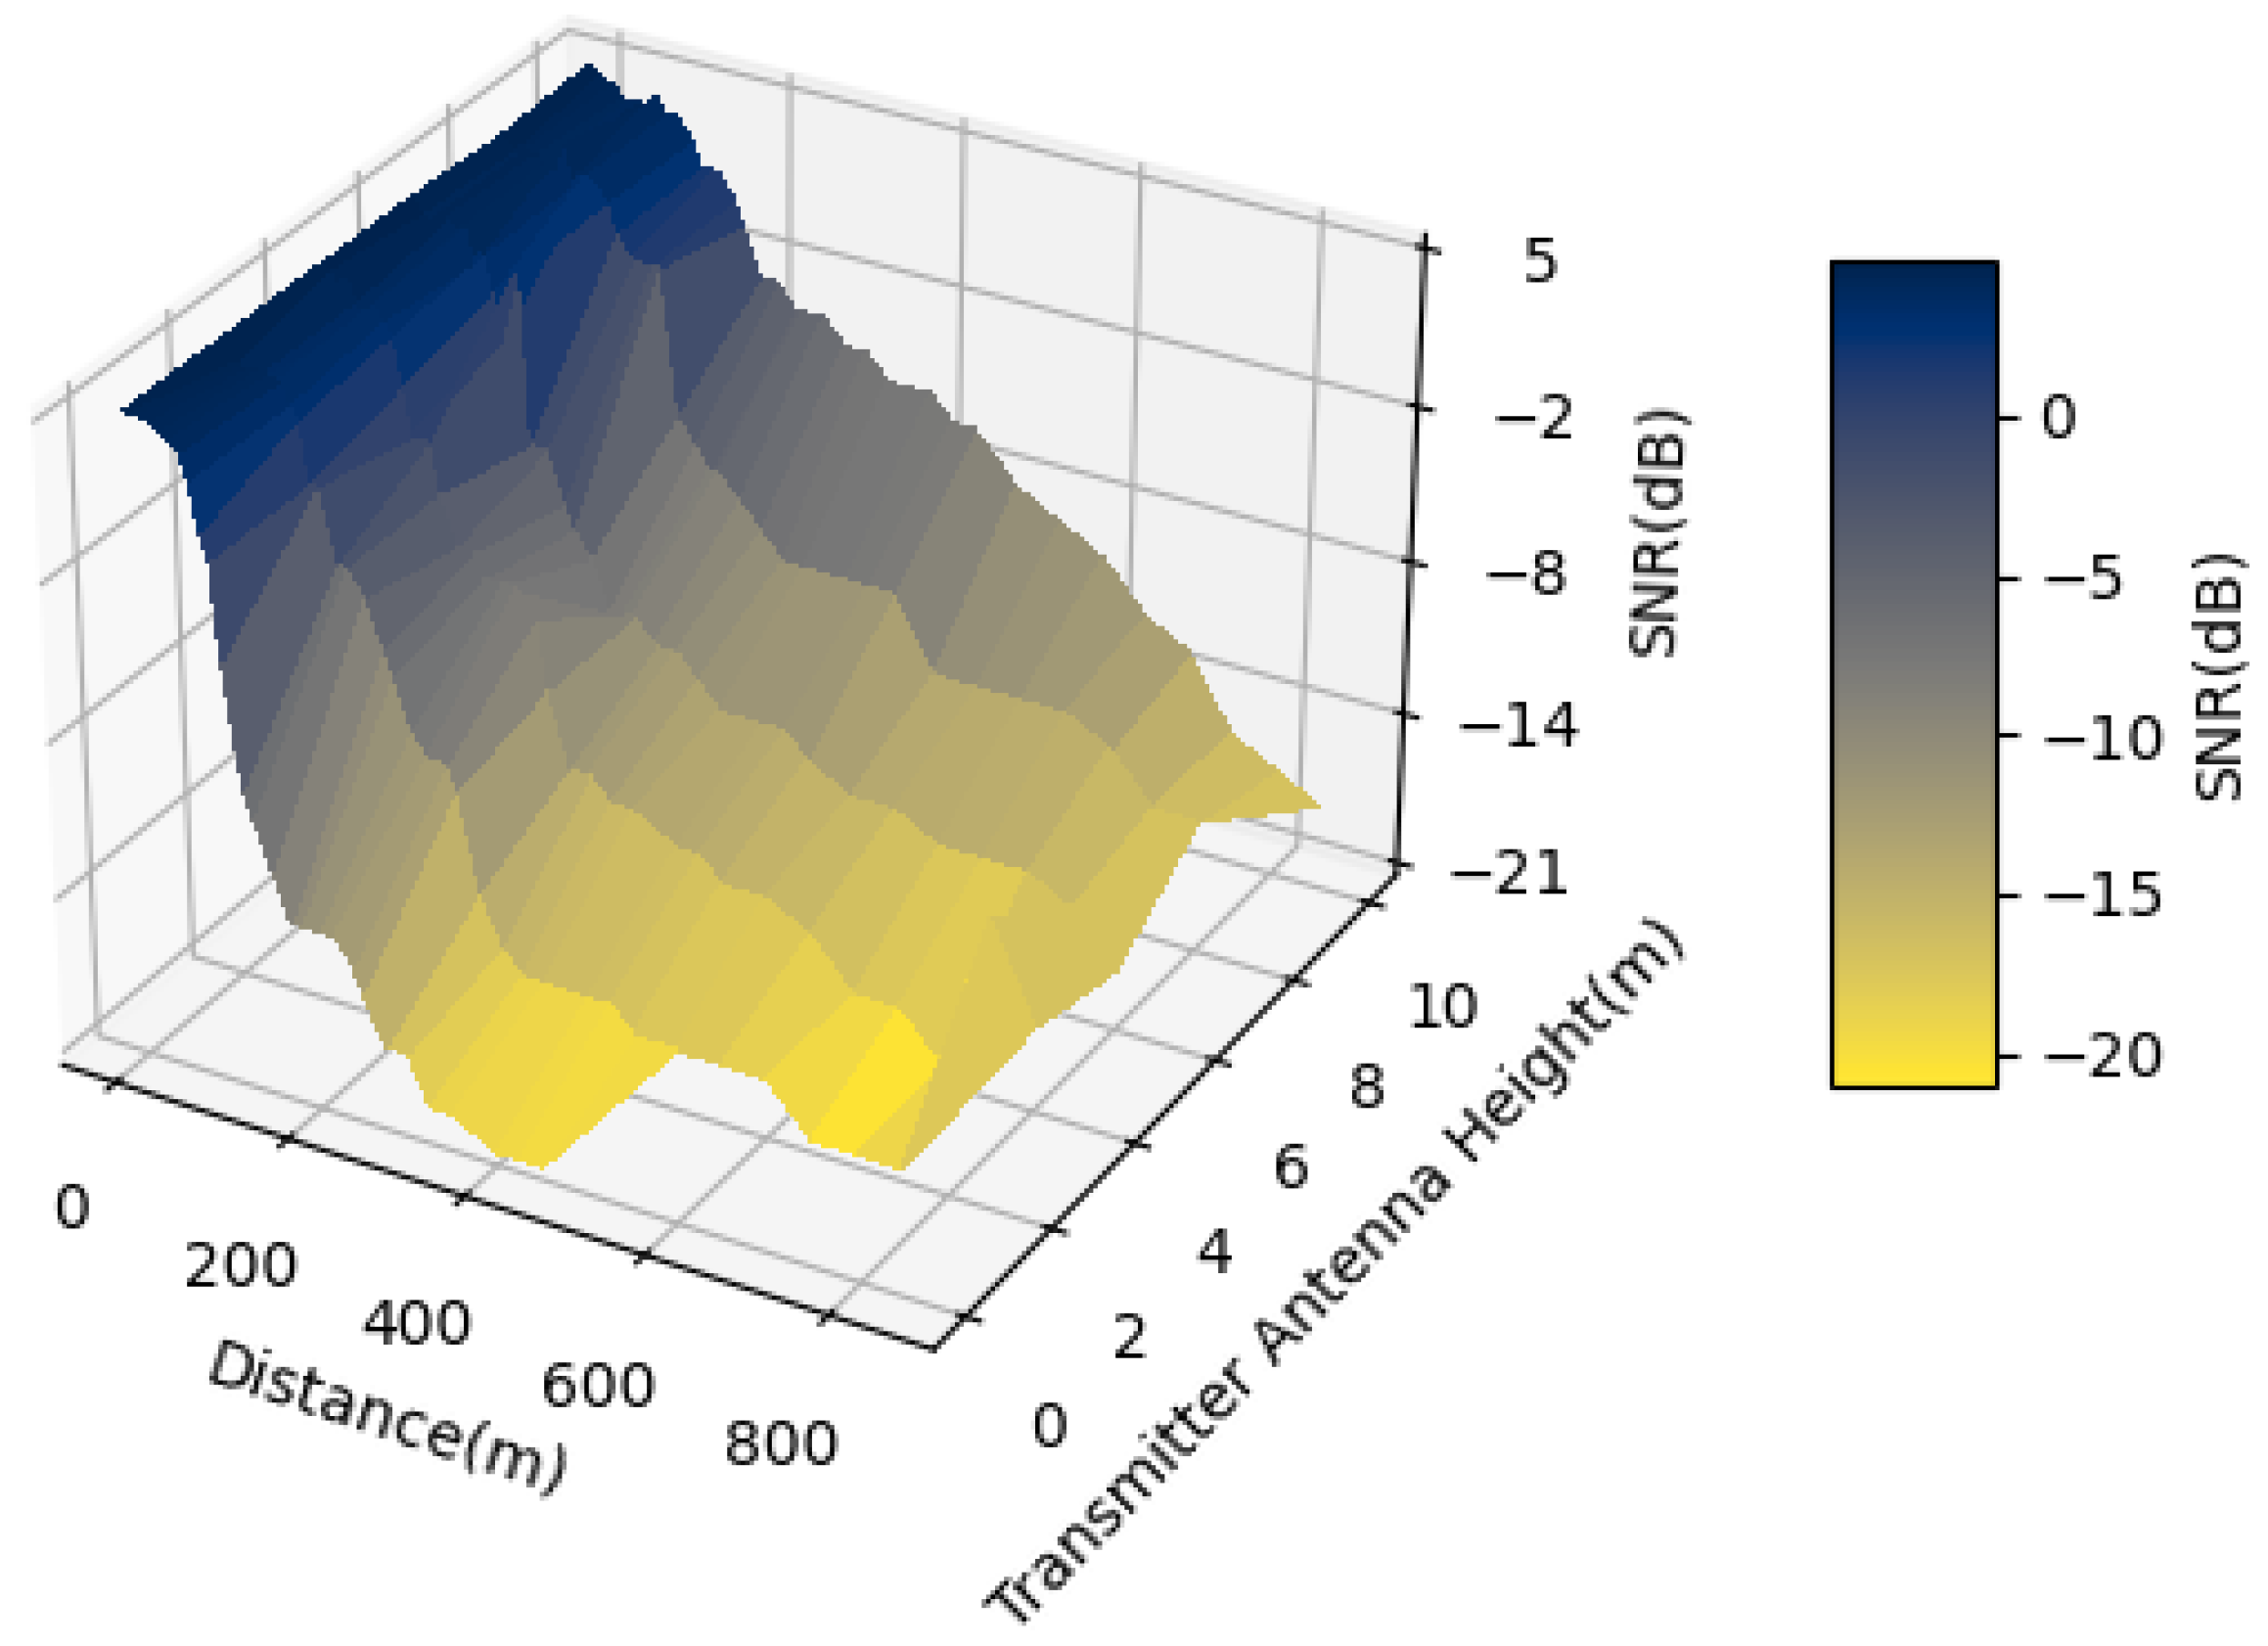
3.3. Impact of Transmitter Antenna Height on SNR

The Signal-to-Noise Ratio (SNR) represents the ratio of the power of the received useful signal to the power of the received interference signal. A higher SNR indicates better signal quality and reduced noise interference.
Figure 12 illustrates the line graph of SNR as a function of distance for different transmitter antenna heights. As shown in Figure 12, within the 0–100 m range, the rate of SNR decline is relatively moderate, and the improvement in SNR with increasing antenna height is not pronounced. This may be attributed to the significant obstructive effect of maize plants on the signal propagation path in this distance range, limiting the influence of antenna height.
Beyond approximately 100 m, antennas with lower heights (0 m, 2 m, 4 m, 6 m) exhibit rapid SNR attenuation, dropping below −10 dB. In contrast, at antenna heights of 8 m and 10 m, the SNR remains at higher levels (approximately −5 dB) for the same distances. This indicates that greater antenna heights significantly enhance signal quality over distances of 0–200 m.
The three-dimensional plot Figure 13 provides a clearer visualization of the trend, showing a marked decline in SNR as the distance between the transmitter and receiver increases. Notably, beyond 200 m, the rate of SNR attenuation accelerates, with SNR values across most areas gradually falling into the negative range.
The results demonstrate that increasing the transmitter antenna height significantly improves signal quality, particularly at 8 m and 10 m heights, where the SNR remains relatively high within the 0–200 m range. This enhancement underscores the antennas’ improved resistance to obstruction and superior propagation performance.

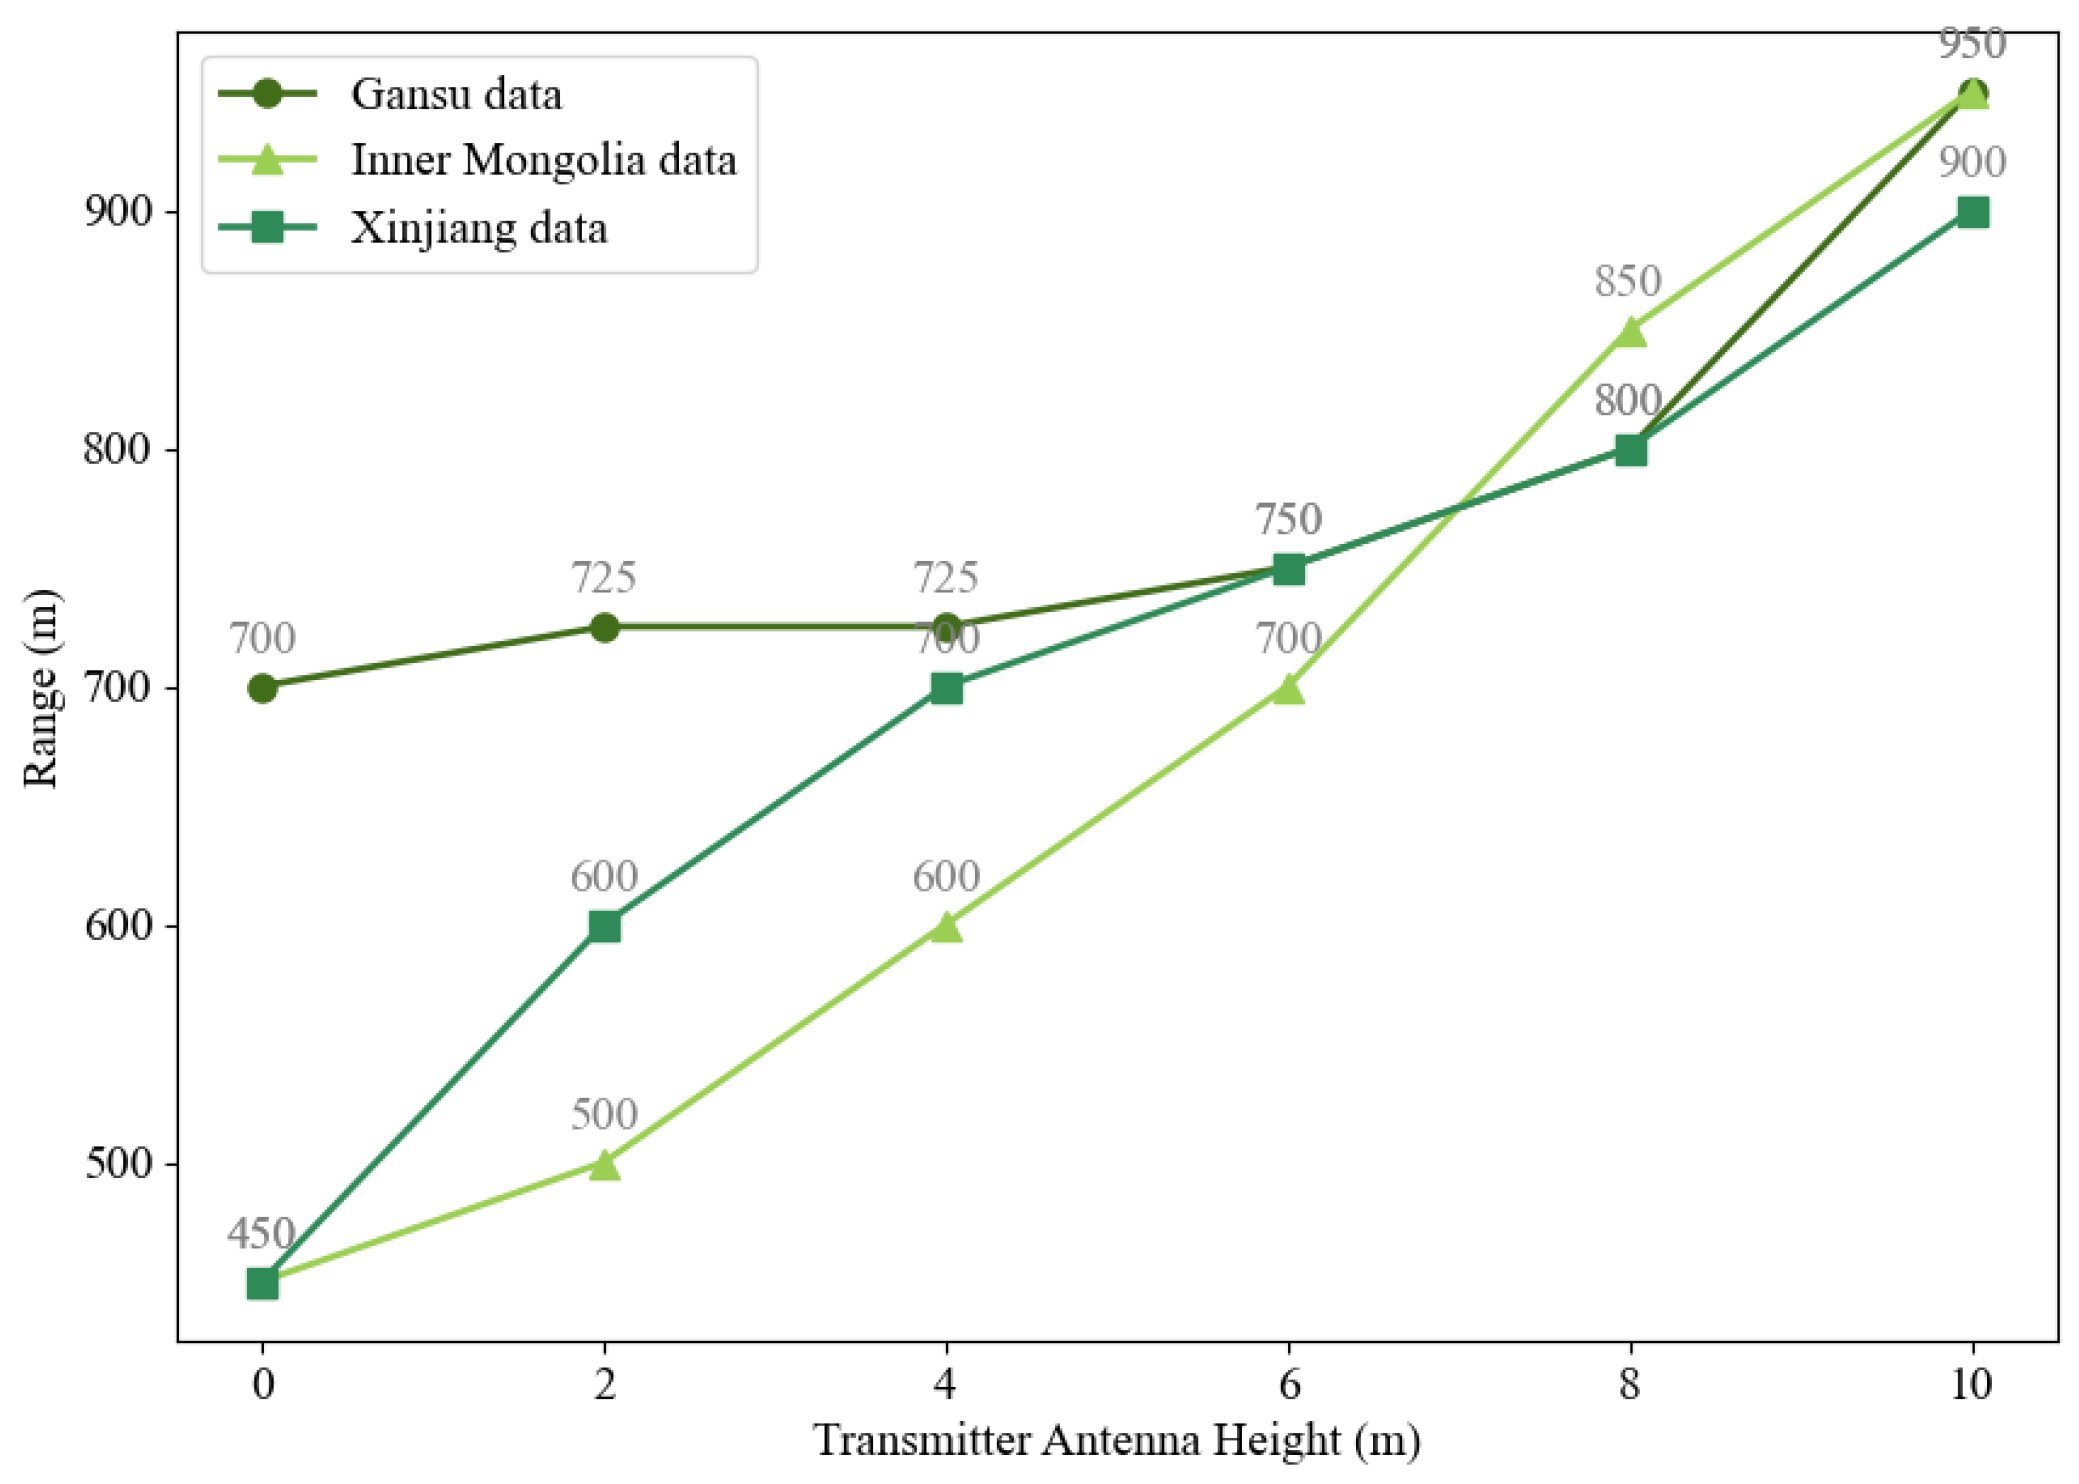
3.4. Impact of Transmitter Antenna Height on Maximum Propagation Distance

In agricultural IoT systems, if the communication success rate falls below 50%, user experience is significantly compromised. When the propagation distance exceeds this range, signal transmission reliability no longer meets application requirements. Therefore, a 50% packet reception rate is used as the standard to define the maximum propagation distance.
Figure 14 illustrates the relationship between the transmitter antenna height (x-axis, in meters) and the maximum propagation distance (y-axis, in meters) for Gansu, Inner Mongolia and Xinjiang, representing experimental data from these two regions, respectively.
Analysis of Gansu, Inner Mongolia, and Xinjiang data shows the receiving-end antenna height strongly affects maximum signal propagation distance, with this influence shaped by regional environments.
In Gansu, as the antenna height rises from 0 to 10 m, propagation distance increases from 700 m to 950 m. The increase is slight at 2–6 m due to signal obstruction, but it is significant above 6 m. Inner Mongolia’s 0–6 m propagation distance is shorter than Gansu’s. Beyond 6 m, the distance grows notably and equals Gansu’s at 10 m. Xinjiang’s 0 m propagation distance matches Inner Mongolia’s. At 2–6 m, it lies between Gansu and Inner Mongolia, likely due to local conditions. At 8 and 10 m, it is lower, suggesting other obstructive factors. The experimental results demonstrate that increasing the transmitter antenna height significantly enhances the maximum propagation distance, particularly under dense vegetation conditions, where higher antenna heights play a more critical role.

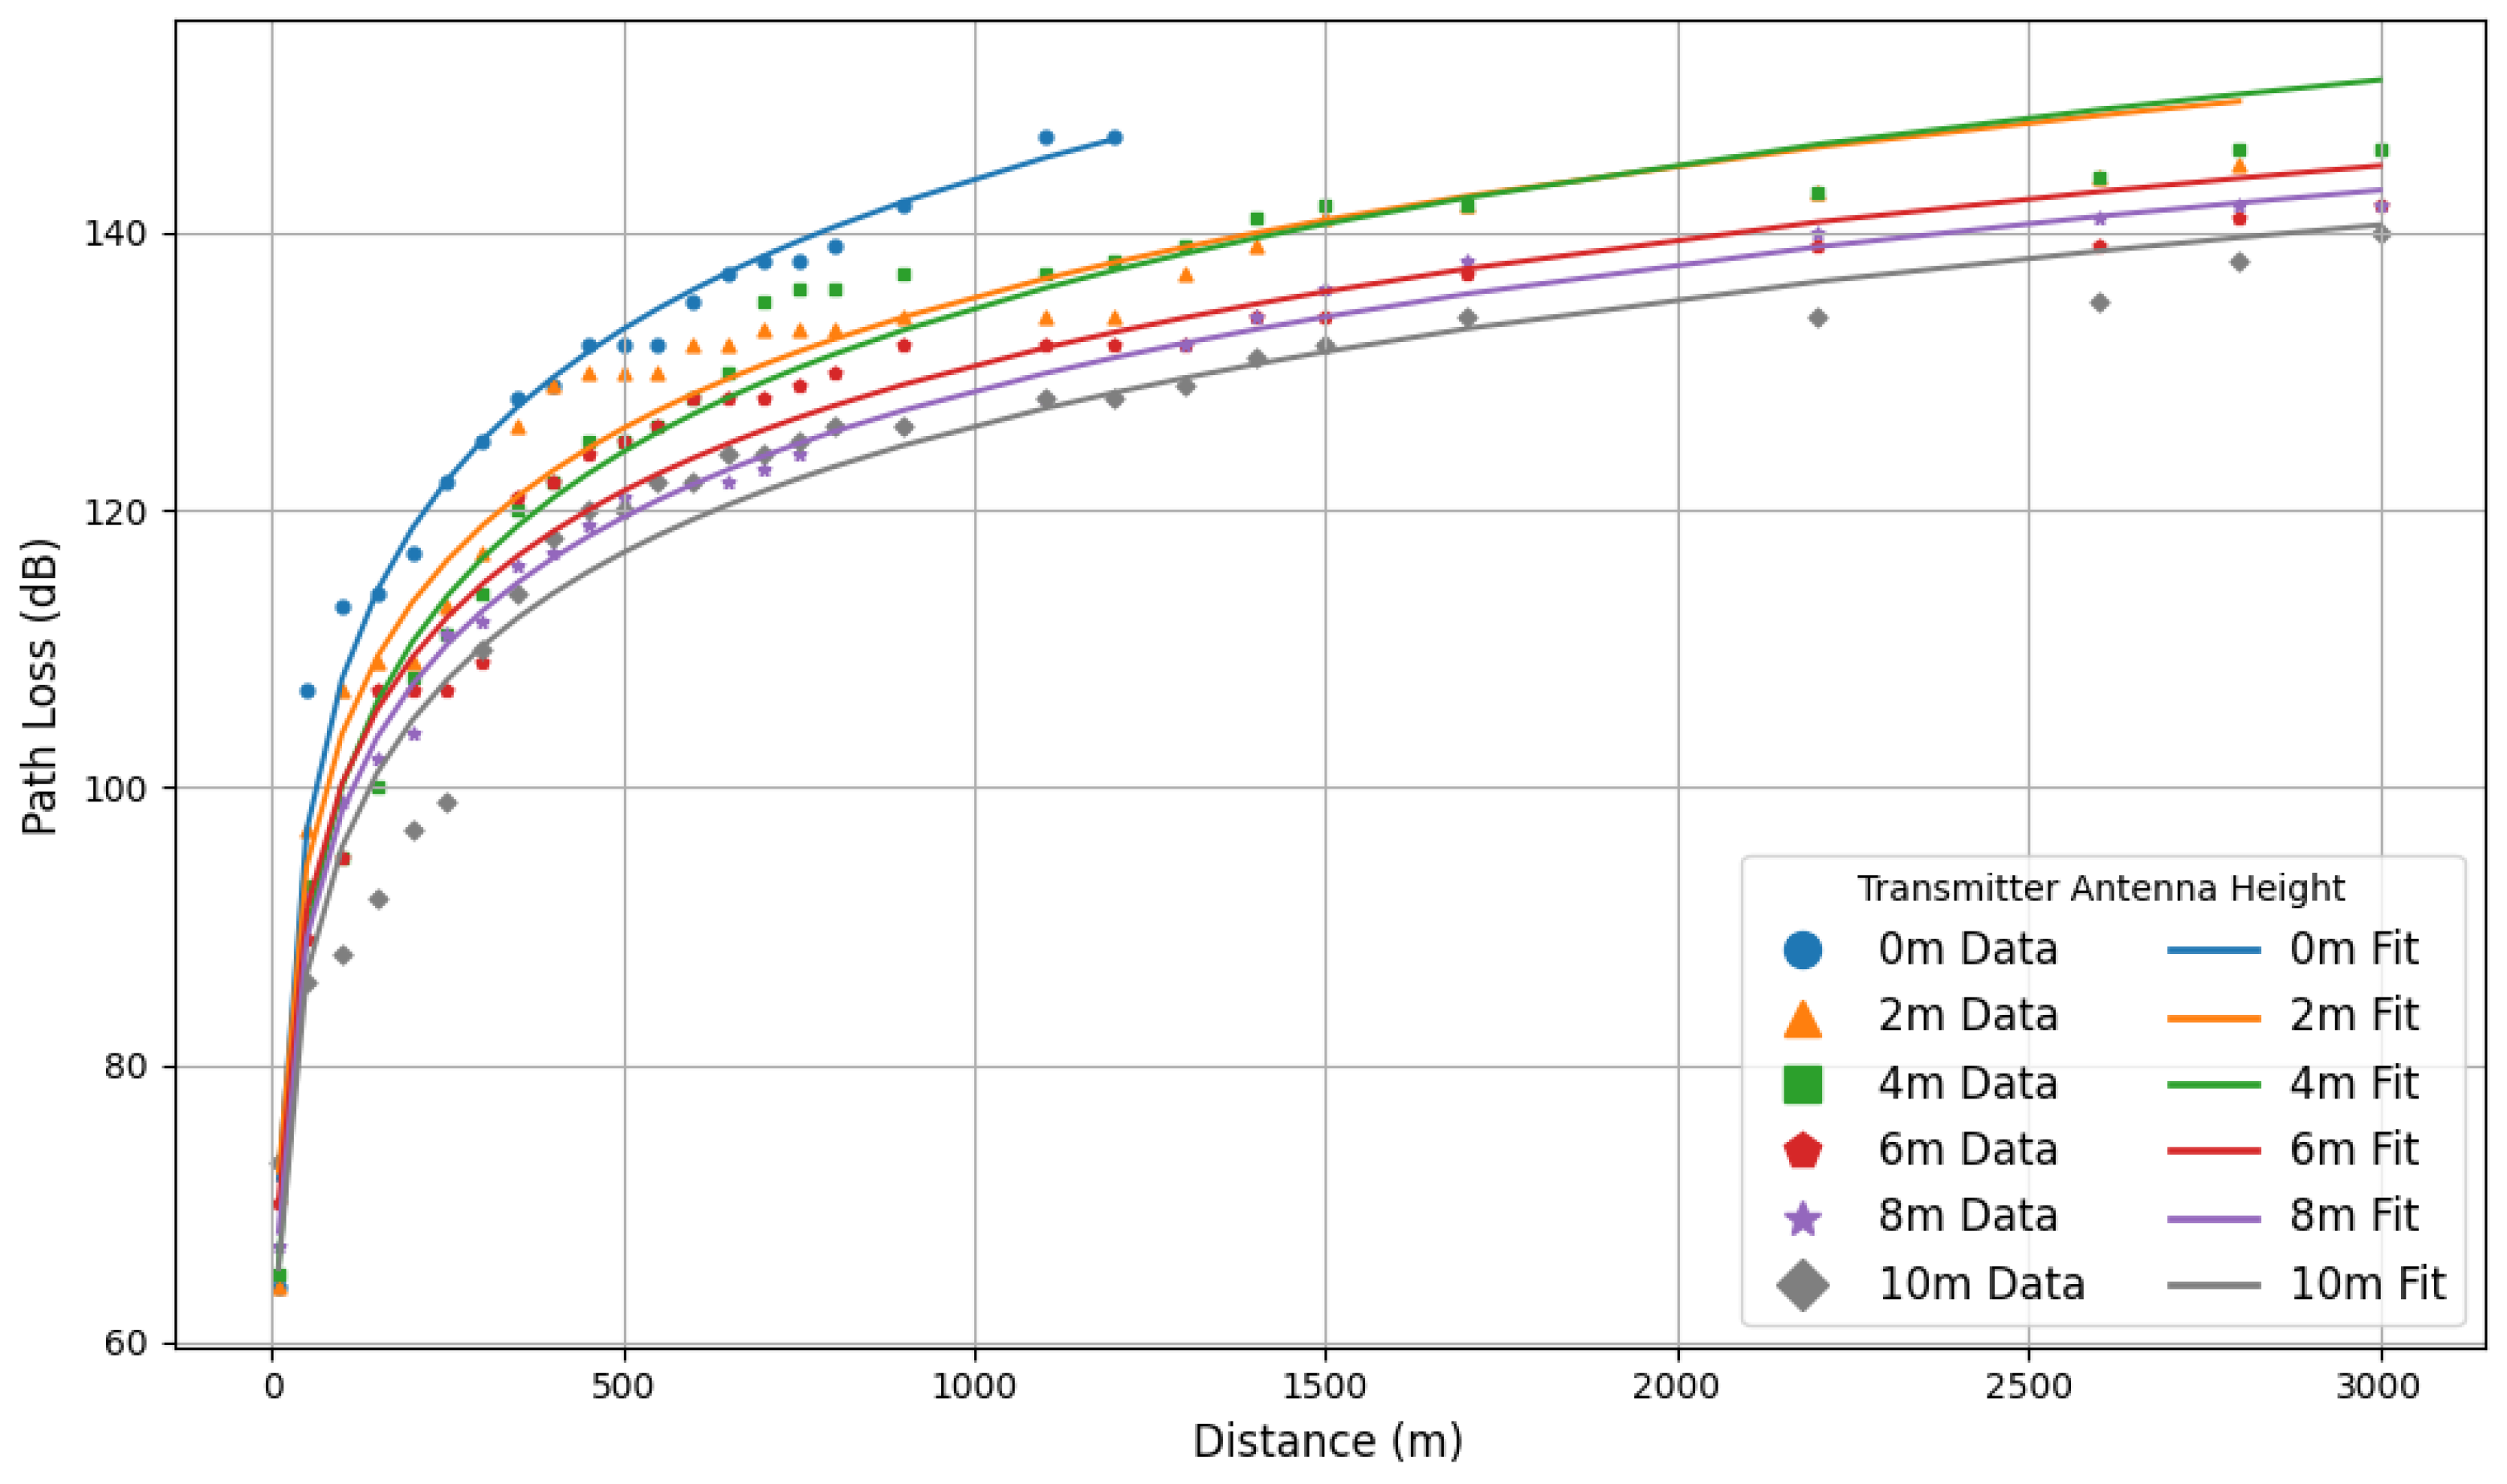
4. Path Loss Model of Different Transmitter Antenna Heights

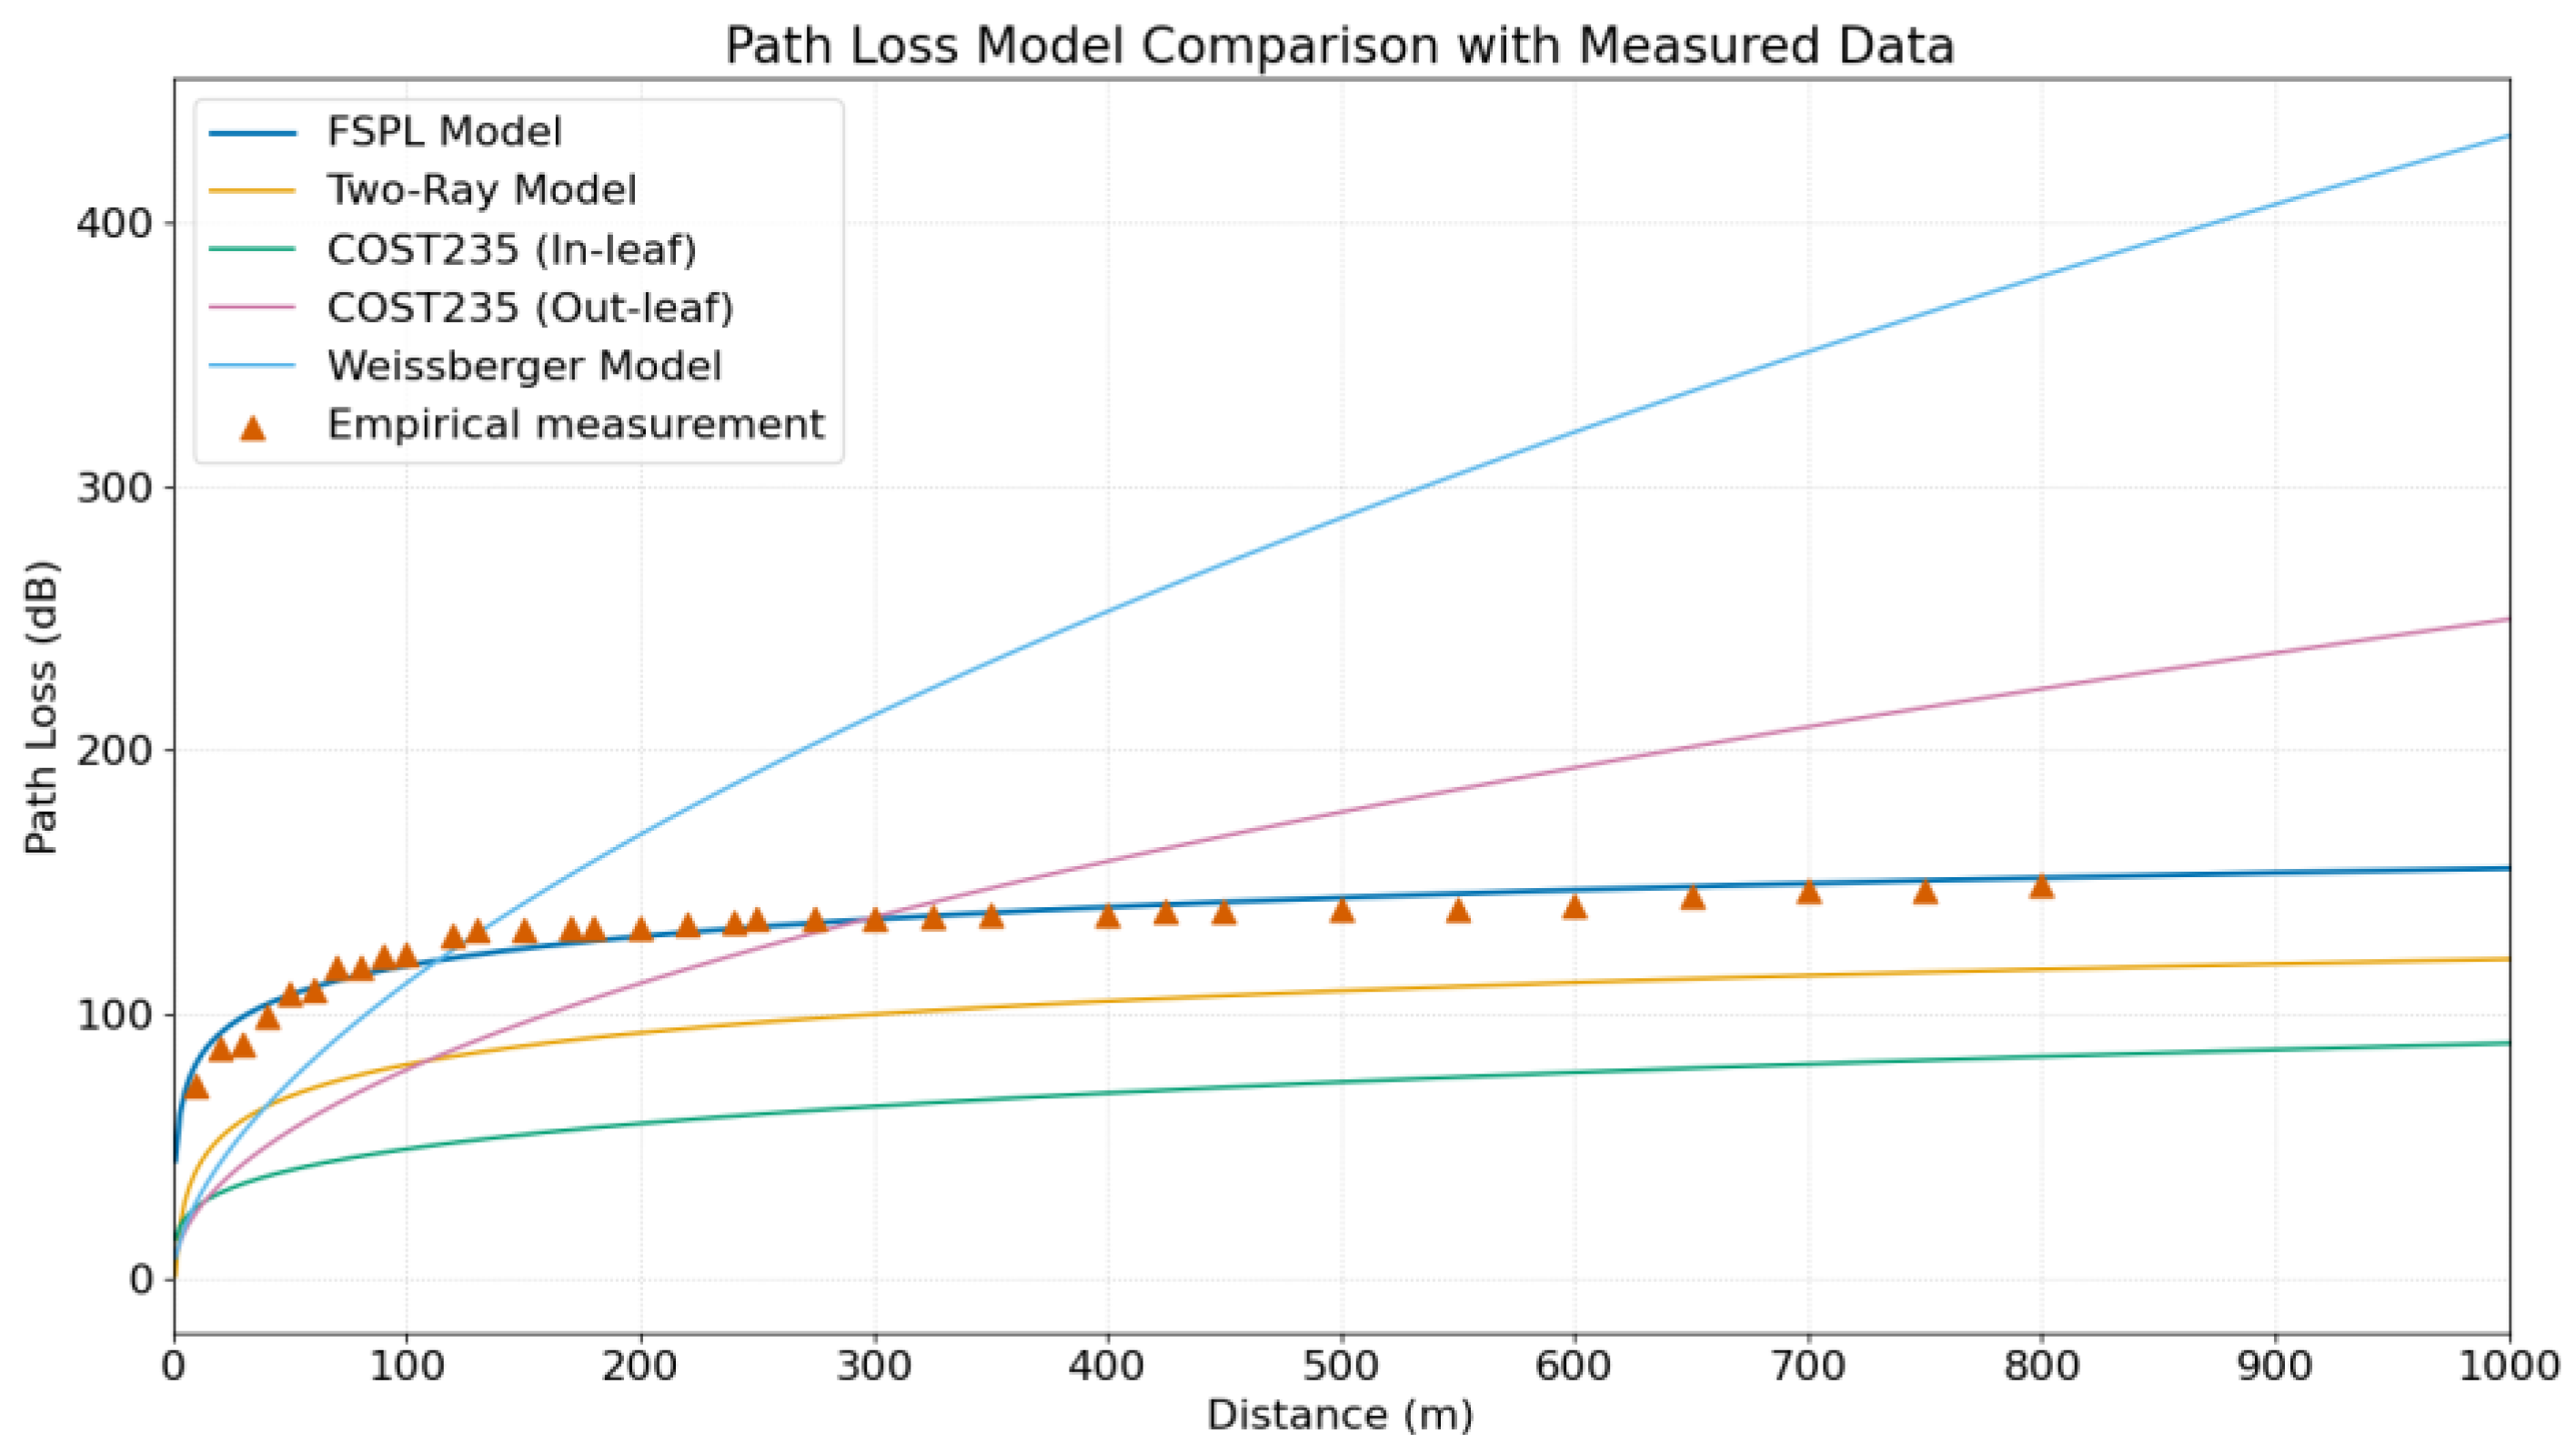
4.1. Path Loss Model Comparison

During the transmission of wireless signals, obstacles between the transmitter and receiver may impede signal propagation. These obstacles can cause absorption, reflection, and scattering of electromagnetic waves, significantly reducing the power of the signal upon reaching the receiver, a phenomenon referred to as shadowing. Additionally, electromagnetic waves can reach the receiver via multiple paths, including direct transmission, reflection, and refraction. Due to differences in path lengths, the waves arrive at the receiver at different times, resulting in multipath effects. These multipath effects introduce phase differences in the waveforms, further degrading signal quality [21,22]. In the following section, we will introduce four distinct propagation models. Subsequently, we will compare their R2 and RMSE values. We aim to identify and select the optimal model that provides the best fit to the data and demonstrates the highest predictive accuracy.
In an ideal free space environment, the Free Space Path Loss (FSPL) of wireless signals depends solely on the signal frequency and transmission distance, without considering multipath effects, obstructions, or other environmental factors. However, in practical applications the actual path loss often exceeds the Free Space Path Loss due to factors such as multipath interference, atmospheric absorption, and antenna gain. Current models for signal propagation characteristics typically employ the Free Space Path Loss model.
Free Space Path Loss model equation [23]:
PLdB = K + 10 nlg ( d )
In the equation, PL represents the Free Space Path Loss, measured in dBm, and d denotes the distance between the transmitting and receiving antennas, measured in meters.
PL calculation formula:
PL = Pt Pr
Here,   Pr is the received power, measured in dBm, and Pt is the transmitter power, also measured in dBm.
The two-ray propagation model postulates that received signals arrive through two distinct paths: a direct wave and a ground-reflected wave. It comprehensively incorporates Free Space Path Loss, Fresnel reflection coefficients, and phase-dependent superposition effects between the two propagation paths. In the equation, d is the distance between the transmitter and receiver antennas in meters, and hT and hR are the elevations of the transceiver antennas in meters [22].
PLdB = 40 lg ( d ) 20 lg ( hT ) 20 lg ( hR )
The COST235 model, developed through European collaborative research, is an empirical vegetation attenuation model for radio wave propagation between 30 MHz and 60 GHz. This model establishes distinct empirical formulas based on vegetation states (foliated/defoliated), with parameters derived from nonlinear regression analysis of extensive field measurement data. In the equation, d is the distance between the transmitter and receiver antennas in meters, f is the frequency in megahertz (MHz) [2]
PLdB = 26.6 f 0.2 d 0.5   out of   leaf
PLdB = 15.6 f 0.009 d 0.26   in   leaf
The Weissberger propagation model provides an empirical approach for estimating excess attenuation caused by vegetation in VHF/UHF bands (30 MHz–3 GHz). Primarily applicable to scenarios involving direct wave penetration through forested areas (non-diffractive propagation), this model quantifies additional path loss through functional relationships between signal attenuation, propagation distance, and vegetation depth. d is the depth of the vegetation in meters. In the equation, d is the distance between the transmitter and receiver antennas in meters, f is the frequency in megahertz (MHz)
PLdB = 0.45 f 0.284 d , 0   m < d < 14   m
PLdB = 1.33 f 0.284 d 0.558 , 14   m < d < 400   m
In order to assess the applicability of different models for the propagation of LoRa in corn fields, data with a conventional antenna height of 6 m at the transmitting end and an antenna height of 0.15 m at the receiving end were employed for analysis.
For the Free Space Path Loss (FSPL) model, the least squares method in Python was first utilized to fit the path loss under the condition of a 6 m transmitting end antenna height, and then the parameters K and n were calculated. Subsequently, the FSPL model was compared with other models. The goodness of fit of these models was evaluated using the coefficient of determination (R2) and the Root Mean Square Error (RMSE).
As shown in the measured data points in Figure 15, the values of the Normalized Standardized Path Loss (NSPL) model, for which the parameters had been calculated through fitting, fluctuated above and below the measured data. In contrast, all other models deviated from the experimental data. As presented in Table 4, the FSPL model exhibited the highest R2 value of 0.928 and the lowest RMSE value of 4.9 among all the models. Therefore, the FSPL model is deemed the most suitable for evaluating the propagation of LoRa in corn fields.

4.2. Principle of the Free Space Path Loss Model

For the propagation characteristics of LoRa signals in maize fields, the experimental data were fitted using Python 3.11 within the PyCharm development environment. The ‘curve_fit’ function from the ‘scipy.optimize’ library was employed to perform nonlinear least squares fitting for the path loss function.
According to Figure 16, path loss increases progressively with distance, exhibiting the characteristics of a logarithmic growth model. In the short-distance range, the path loss rises rapidly, while in the long-distance range, the rate of increase becomes more gradual.
Figure 16 shows that the path loss data points at different antenna heights fluctuate around the fitted curve, which closely aligns with the overall trend of the data. As summarized in Table 2, the model fitting results for all antenna heights demonstrate strong performance R2 > 0.94 and RMSE around 3. Additionally, as the antenna height increases, the path loss decreases for the same propagation distance.
Table 5 indicates that the k value decreases with increasing antenna height. At an antenna height of 2 m, the k value reaches its maximum (61.131), likely due to significant signal obstruction by maize fruits and dense foliage along the propagation path, leading to pronounced initial signal loss. However, the model’s fitting performance at this height is excellent, with an R2 of 0.97 and the lowest RMSE (2.545), suggesting that the model achieves the best predictive accuracy under these conditions.
At antenna heights of 4 m and 6 m, the n value is relatively high, likely because the signal propagation path encounters more maize leaves, intensifying signal obstruction. Conversely, at heights of 6 m, 8 m, and 10 m, the n value gradually decreases, indicating that higher antenna heights effectively reduce the path loss exponent and improve signal propagation performance. Particularly at an antenna height of 10 m, both n and k values are at their lowest, significantly outperforming other antenna heights.

4.3. Path Loss Modeling in Open Environments

The control experiments were conducted in unobstructed open fields in the Gansu region, as shown in Figure 17. When the transmitter antenna height exceeded 2 m, the maximum propagation distance of the LoRa signal reached over 2500 m. Shown in Figure 18. With the antenna height increased to 4 m or above, the propagation distance extended further to 3 km. According to Table 6, the path loss model fitting results exhibited high coefficients of determination (R2 > 0.95) and low root mean square errors (RMSE < 3), indicating the model’s excellent performance in capturing the propagation characteristics. Additionally, data from Table 7 revealed that, under the same antenna height, the path loss exponent n and attenuation factor k in open fields were lower than those observed in maize fields.
The experiments demonstrated that under line-of-sight propagation conditions, the propagation distance of the signal is strongly influenced by the antenna height. Furthermore, the environmental impact on signal propagation was found to be significant: compared to open fields, signal loss in maize fields was substantially greater, further confirming the pronounced effect of vegetation obstruction on signal transmission.

4.4. Validation of the Path Loss Model in Maize Fields

To validate the applicability of the path loss model, experiments were conducted at a maize cultivation base in Tongliao City, Inner Mongolia. The maize planting density in this region is approximately 90,000 per hectare, with an average plant height of around 3 m. At the time of the experiment, the maize was in its densest growth stage, causing significant signal obstruction.
As shown in Figure 19, the scatter plot of experimental data from Inner Mongolia aligns closely with the fitted curve from the Gansu region, indicating a degree of consistency in the path loss characteristics between the two regions.
Table 8 demonstrates that the logarithmic distance model corresponds well with the measured values, with the coefficient of determination R2 ranging from 0.718 to 0.928. Most data points exhibit R2 values exceeding 0.8, reflecting the model’s strong fitting performance. Additionally, the root mean square error (RMSE) falls within the range of 3.118 to 6.421, indicating that the prediction errors of the model are within an acceptable range.
For practical deployments, site-specific conditions, vegetation density, and budget constraints should be taken into account. By utilizing the fitted formulas and model parameters, the optimal antenna height and layout can be calculated to achieve a balance between signal coverage and economic efficiency.

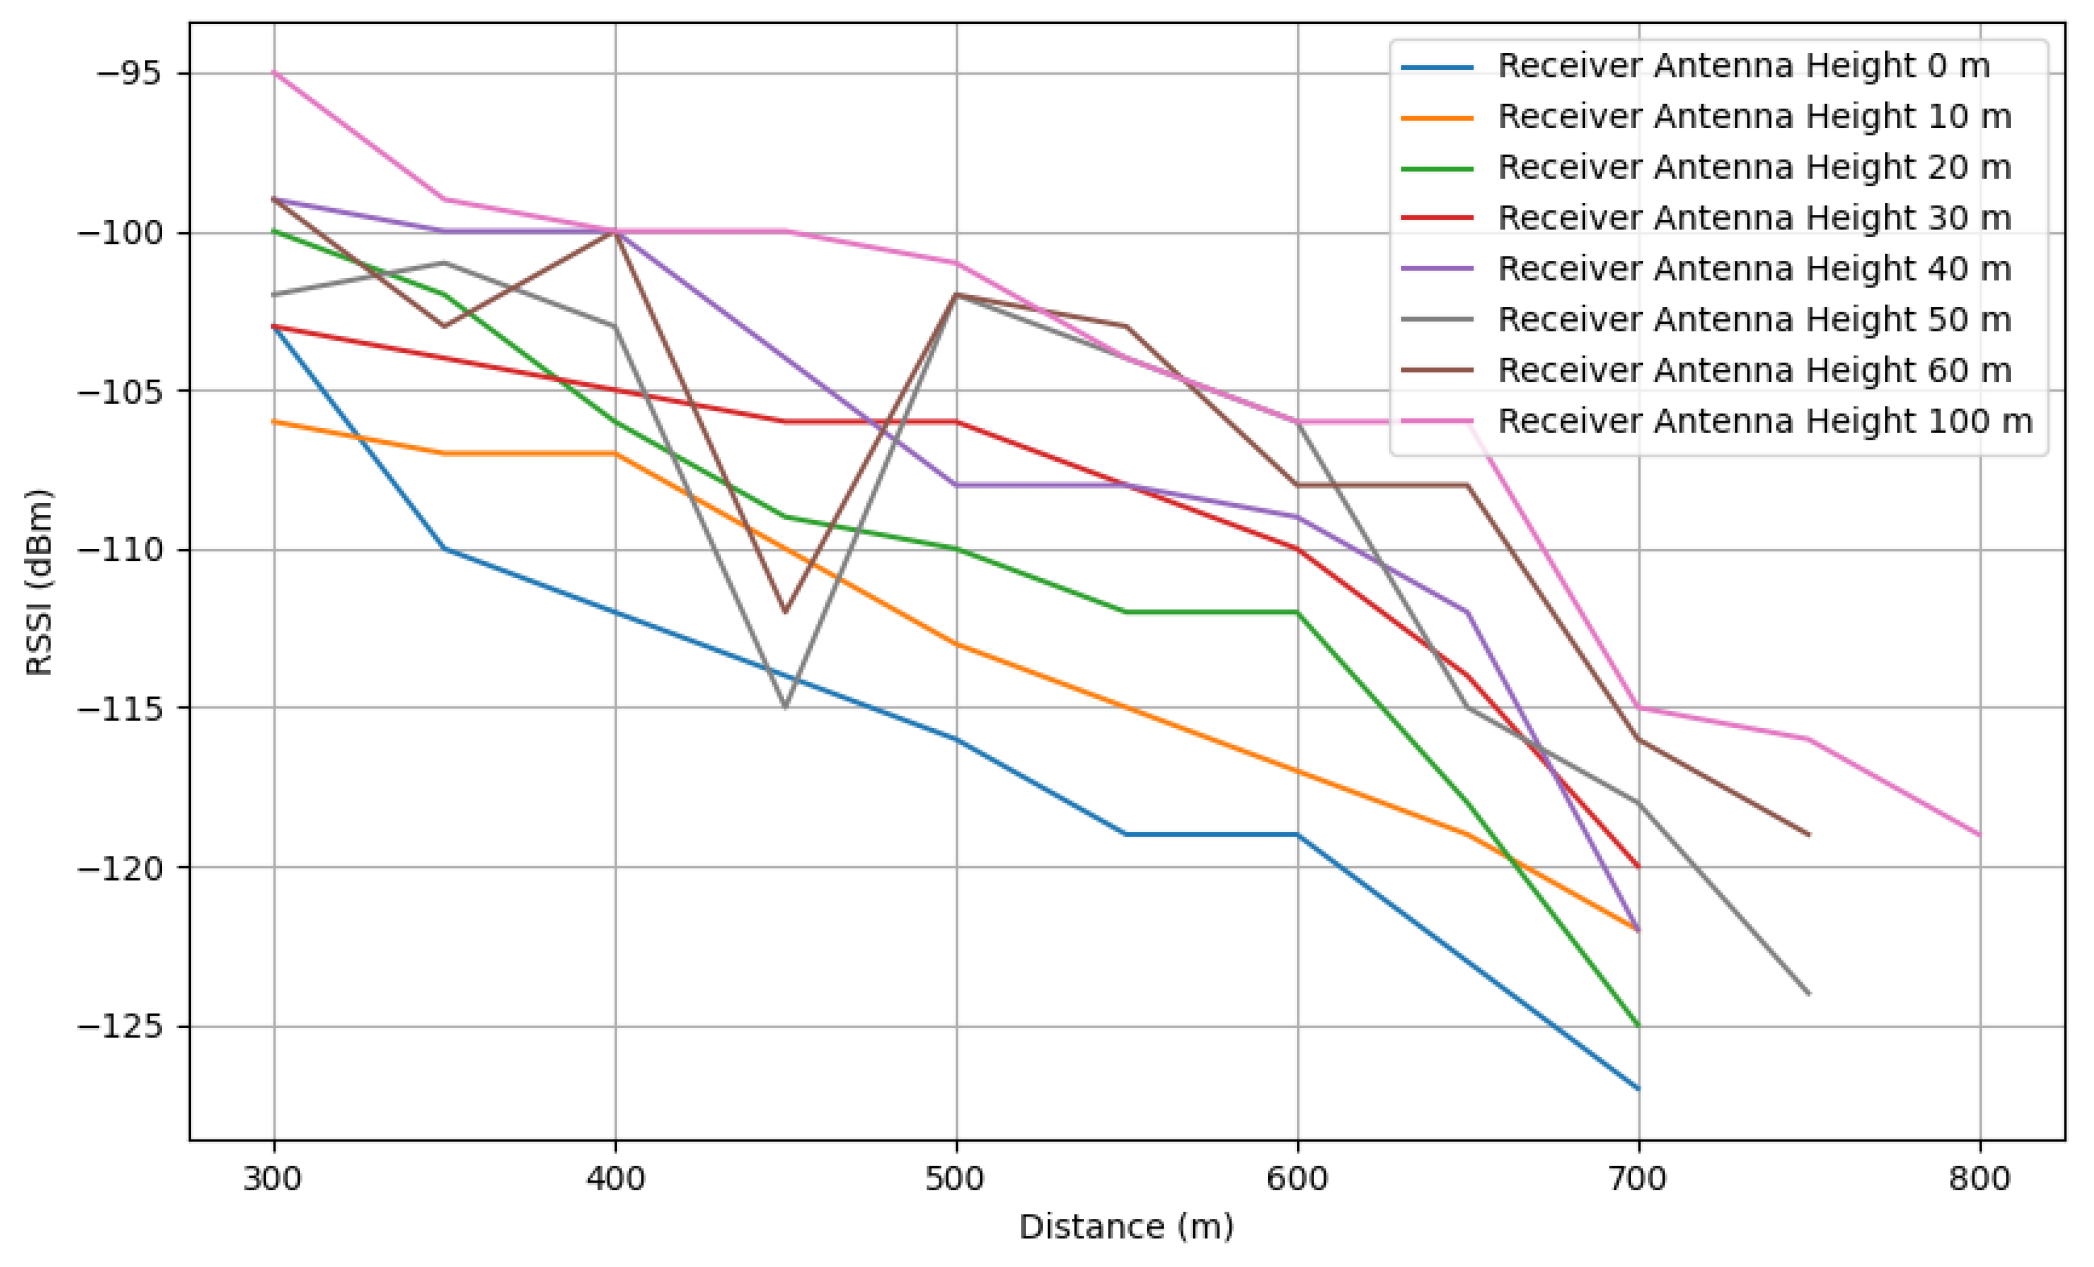
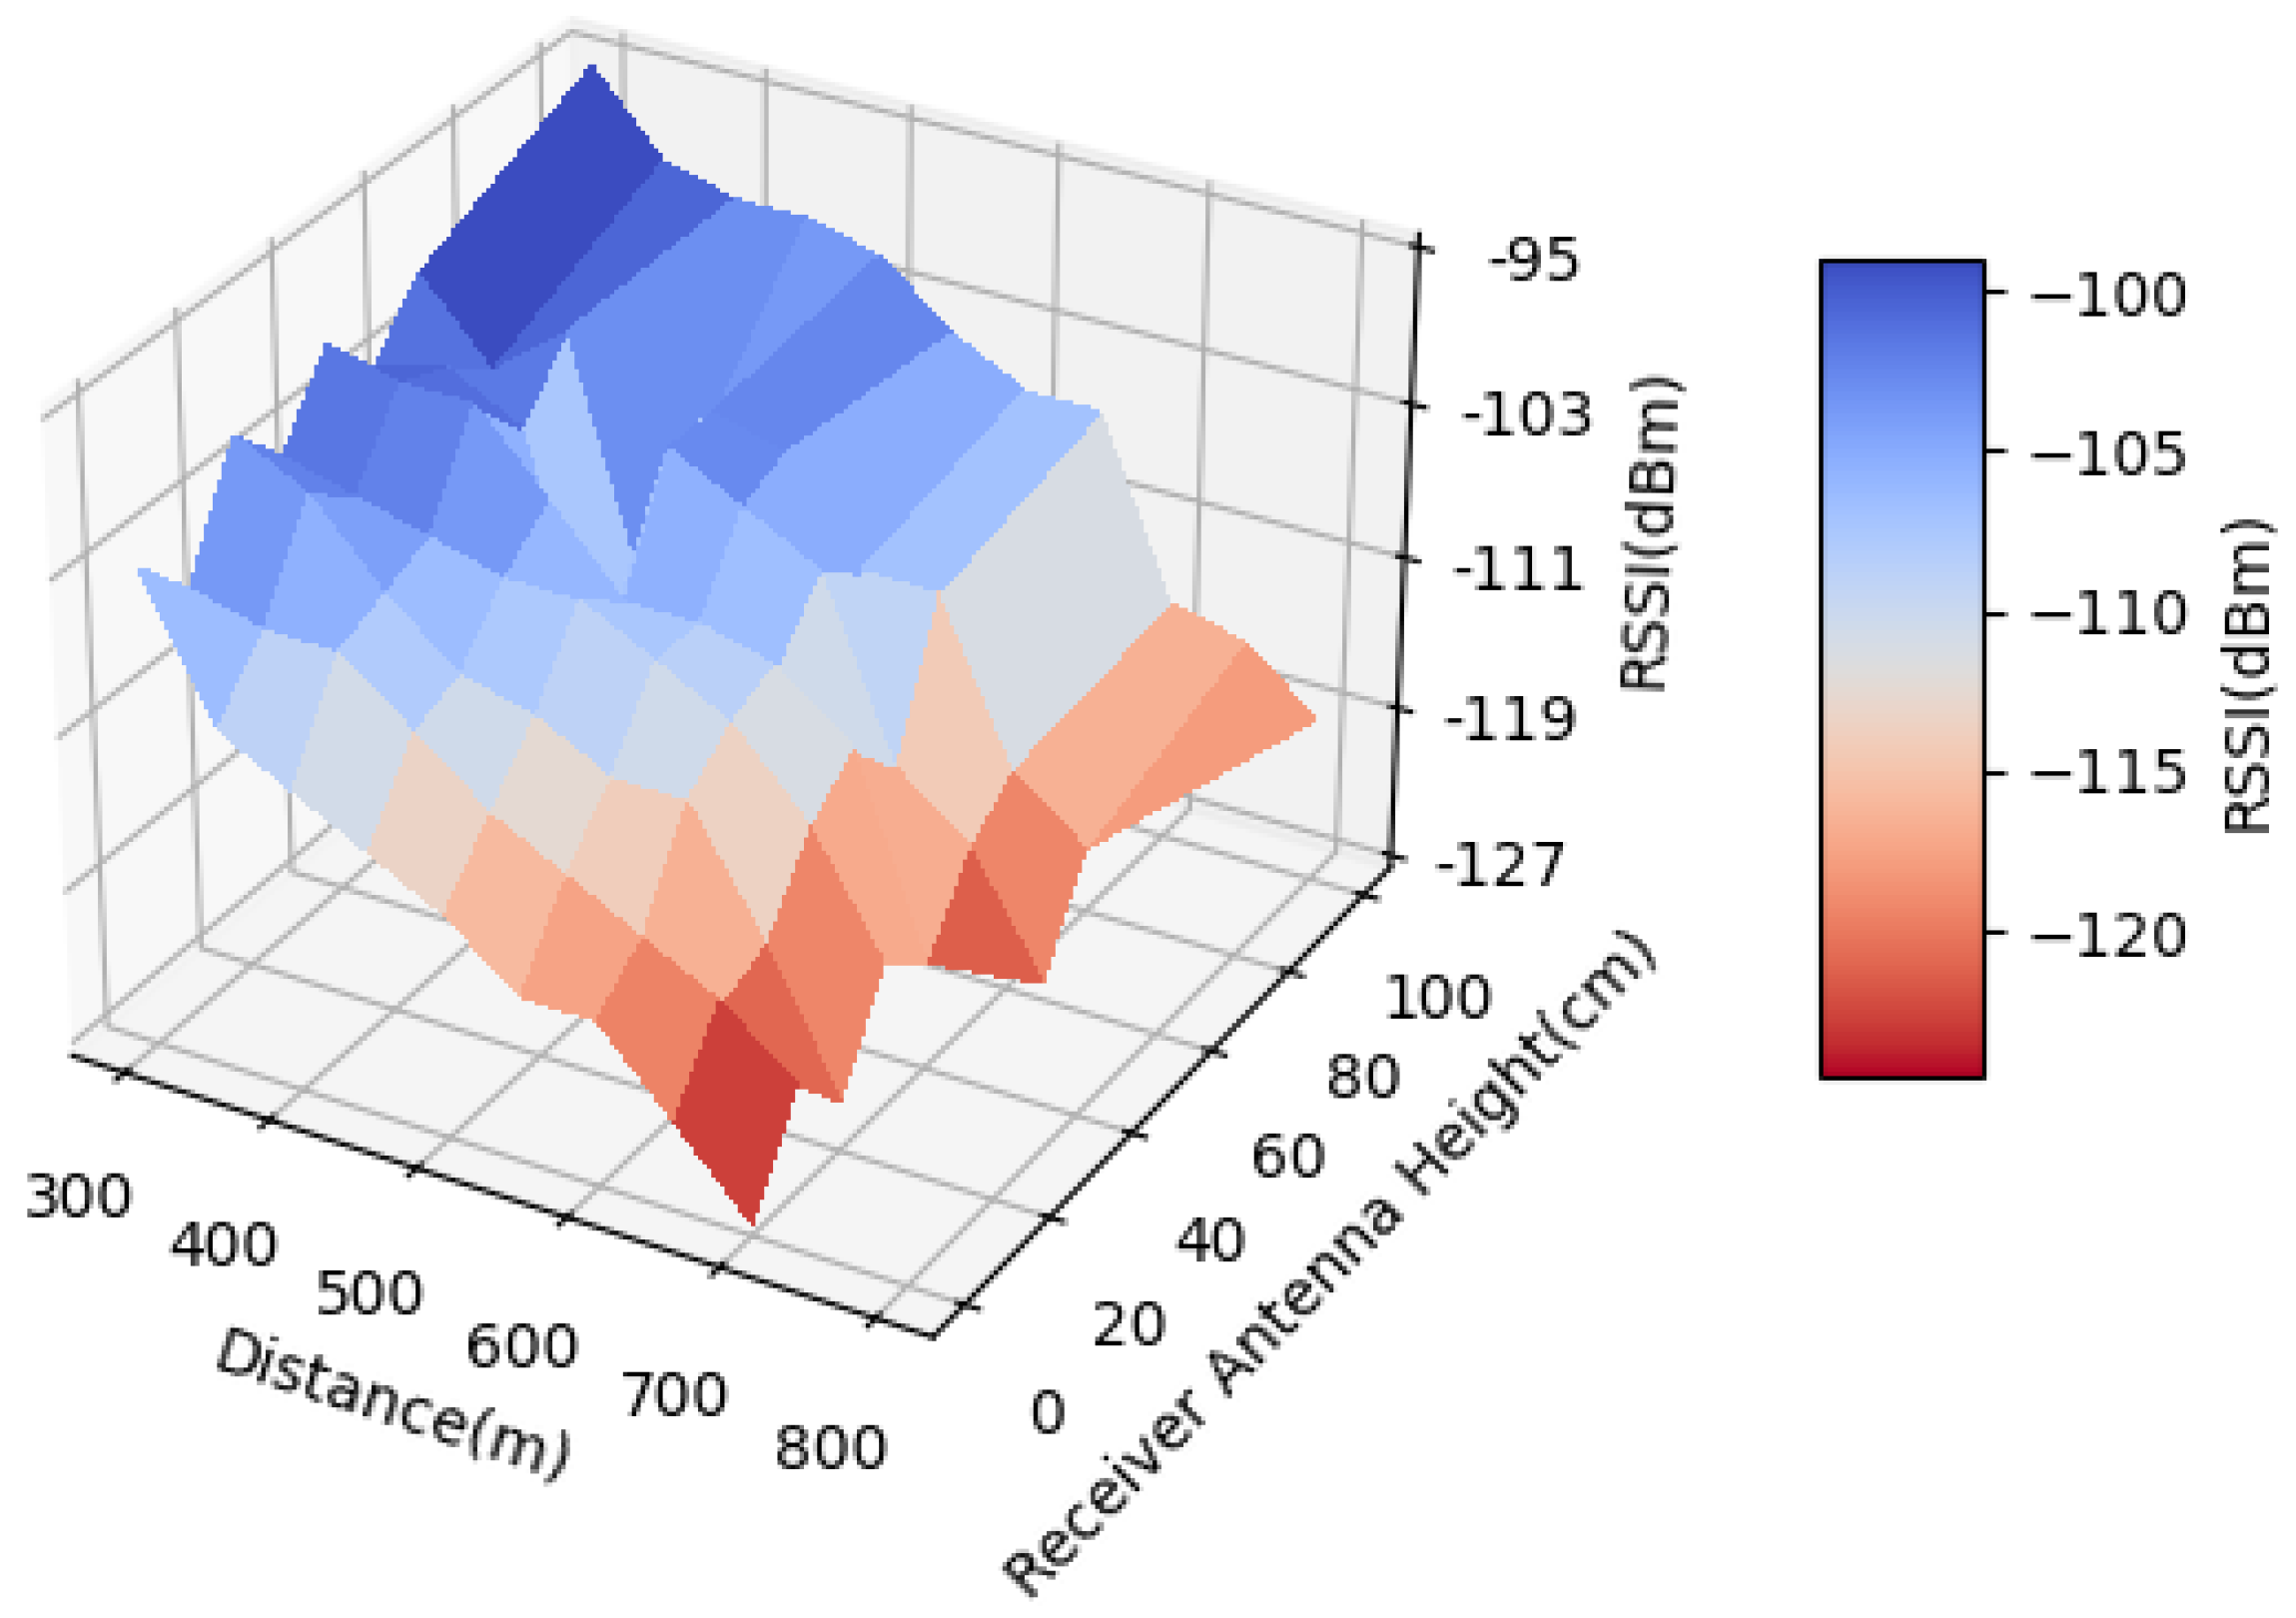
5. Adjusting Receiver Antenna Height Experimental

In the current agricultural outdoor production environments in China, gateway devices are typically installed on 6 m-high poles. This installation height is primarily chosen due to the standard length of steel pipes being 6 m, which facilitates construction and ensures cost efficiency.
Increasing the height of the receiver antenna not only reduces the vertical signal obstruction caused by maize plant growth but also minimizes interference from ground-level obstacles within the first Fresnel zone, thereby improving signal reception efficiency.
The objective of this experiment is to systematically investigate and analyze the impact of varying receiver antenna heights on signal transmission performance, with the transmitter antenna fixed at a height of 6 m. The study aims to provide theoretical support and practical guidance for achieving more efficient and reliable agricultural IoT communications.

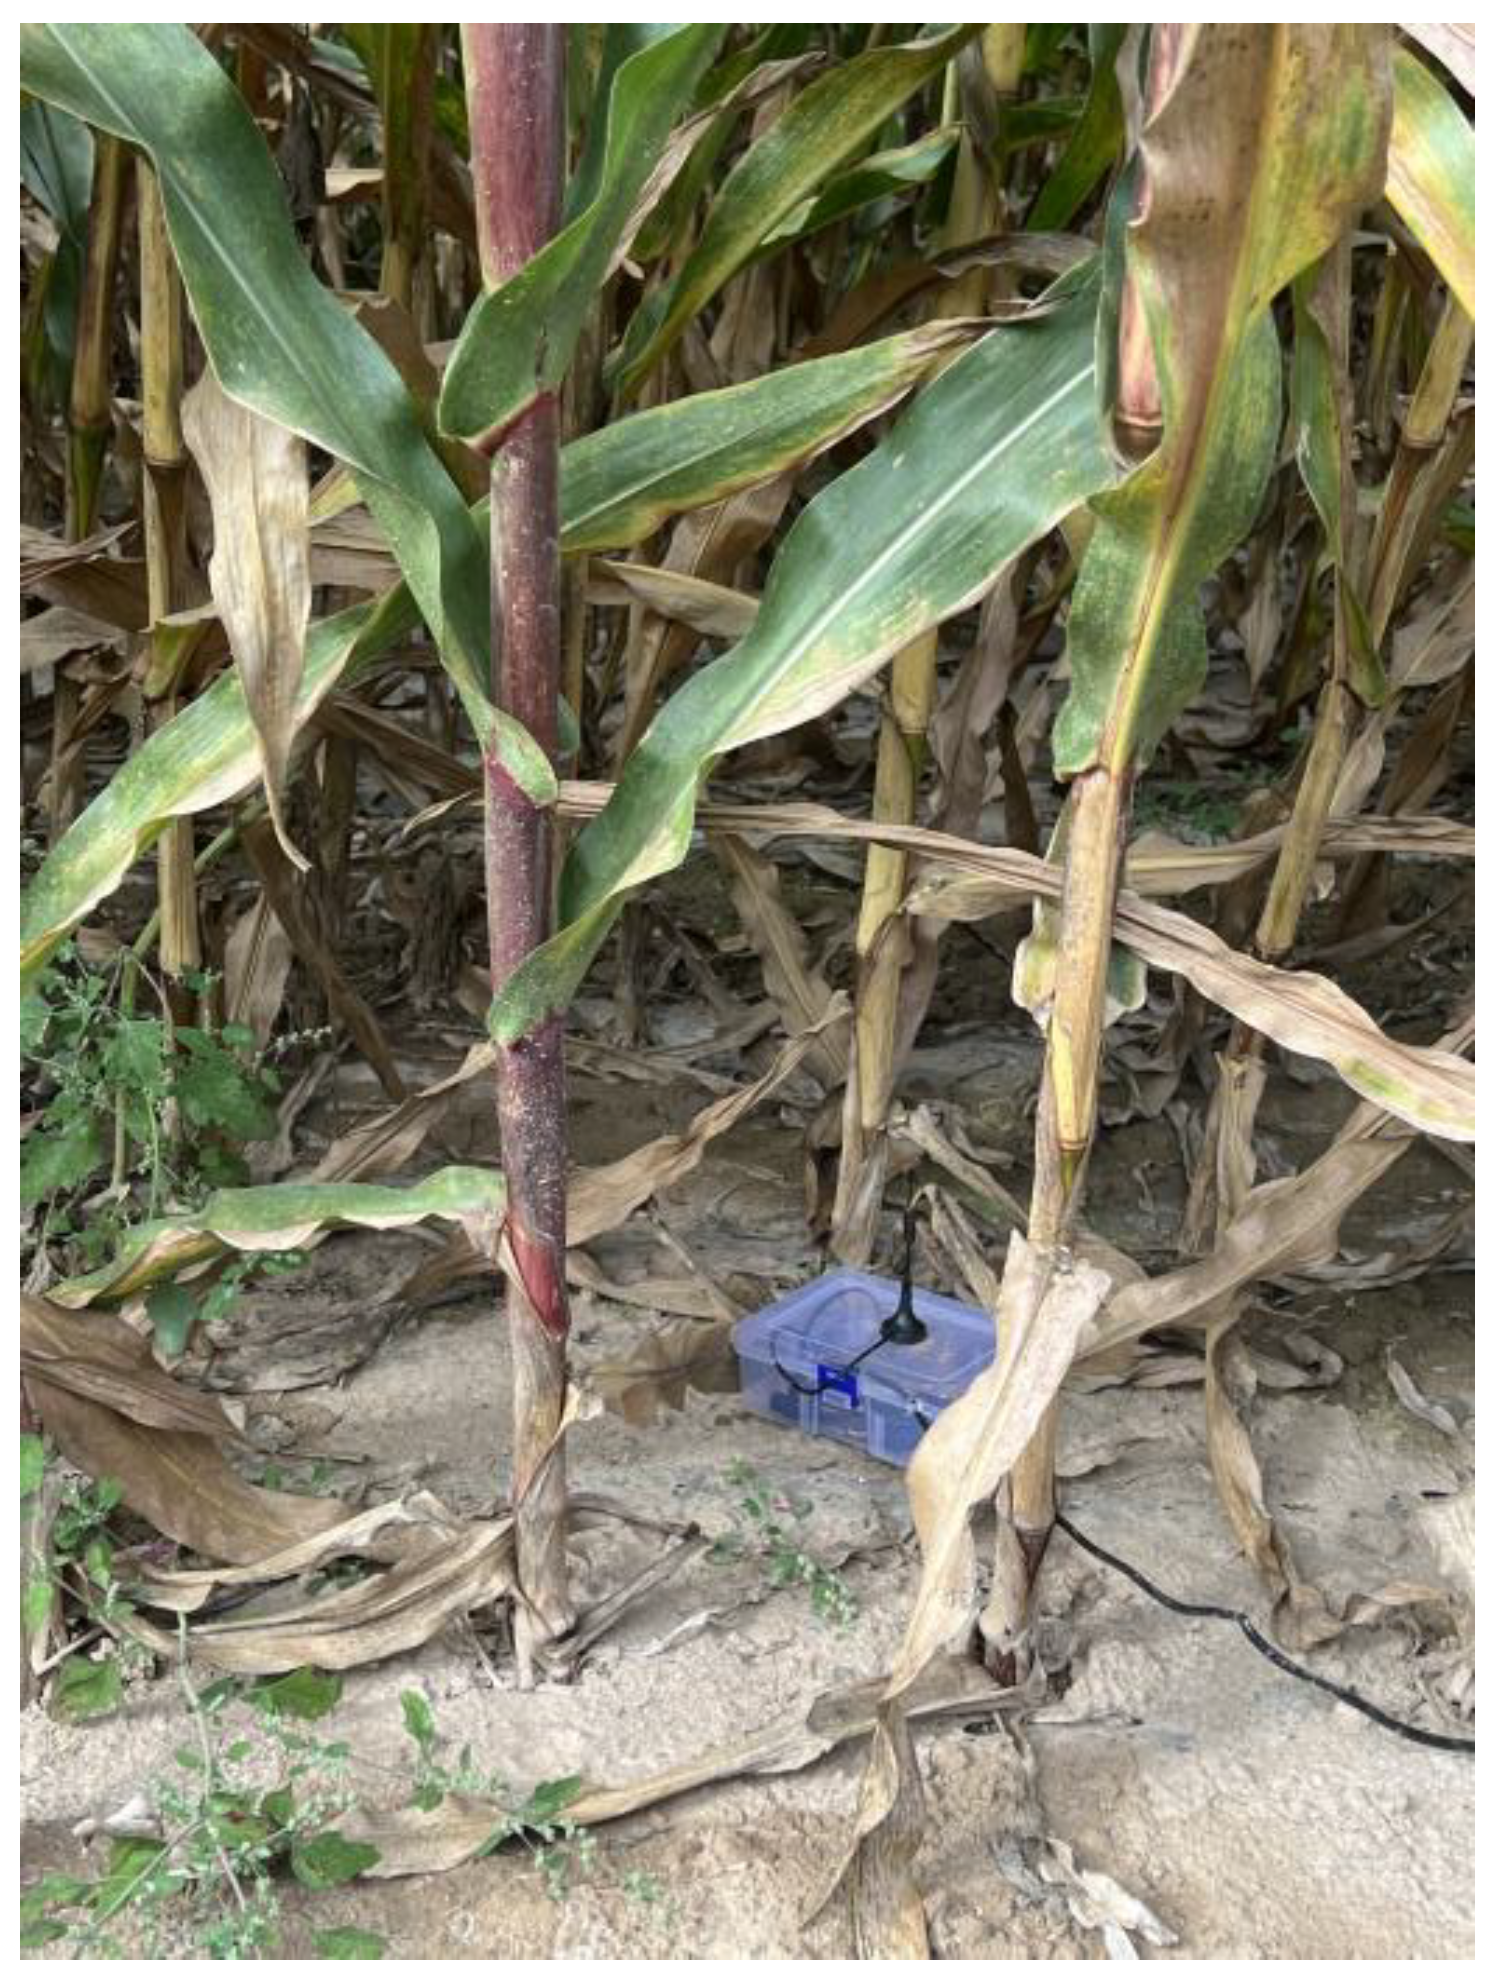
5.1. Adjusting Receiver Antenna Height Experimental Procedure

Fix the gateway on a 6 m-high pole, ensuring the transmitter antenna is oriented vertically downward.
Adjust the receiver antenna height to the following values: 0 cm, 10 cm, 20 cm, 30 cm, 40 cm, 50 cm, 60 cm, and 100 cm. The receiver terminal will be moved within the maize field.
Measure the RSSI, SNR, and maximum propagation distance for each receiver antenna height. Set up measurement points at intervals of 10 m, ranging from 10 m to 200 m from the transmitter. For each antenna height, conduct 50 measurements and calculate the average values.

5.2. Impact of Receiver Antenna Height on RSSI

As illustrated in Figure 20, the antenna height of the receiver exhibits a positive correlation with signal quality. The differences in RSSI between receiver antenna heights of 10 cm and 20 cm are minimal, with their respective curves intersecting at greater distances. This intersection may be attributed to the 30 cm antenna height being located directly beneath the maize leaves at this distance, where the proximity to foliage leads to more pronounced obstruction of the first Fresnel zone.
Figure 21 shows that with increasing distance, RSSI exhibits a significant attenuation trend across all antenna heights. However, the rate of signal decay varies with antenna height. Higher receiver antenna heights (e.g., 100 cm) demonstrate superior signal strength at greater distances (>600 m), with a slower attenuation rate.
At higher antenna heights (60 cm and 100 cm), the signal coverage remains robust across all distance ranges. At an antenna height of 100 cm, even at distances exceeding 700 m, the RSSI remains around −110 dBm, highlighting its significant advantage.
In long-distance communication scenarios, although RSSI attenuation is inevitable even with increased antenna height, the signal quality remains substantially better compared to lower antenna heights. For applications requiring extended communication ranges, higher receiver antenna heights (e.g., 100 cm) are recommended to enhance communication quality and maintain signal stability. When considering the cost of antenna installation, the relationship between antenna height and system performance, as demonstrated by the experimental data, can serve as a reference to determine the optimal cost-performance ratio.

5.3. Impact of Receiver Antenna Height on SNR

As shown in Figure 22 and Figure 23, the difference in SNR between antenna heights of 0 cm and 10 cm is negligible, while the improvement from 10 cm to 20 cm is significant. This improvement will be attributed to the structural characteristics of maize plants exerting a greater impact on signal SNR at this height.
At shorter distances (300 m to 400 m), the SNR across all receiver antenna heights remains relatively high (approaching 0 dB), indicating good signal quality. The effect of receiver antenna height on SNR is particularly pronounced at short to medium distances, partially compensating for the degradation in signal quality caused by distance-induced attenuation.
With increasing transmission distance, the Signal-to-Noise Ratio (SNR) declines significantly. Beyond 600 m, SNR values fall into the negative range, with the lowest dropping below −20 dB, indicating poor signal quality.
When reducing the transmission distance is not feasible, increasing the height of the transmitter antenna serves as an effective measure to enhance SNR and improve communication performance. Particularly in long-distance communication, a higher antenna height can delay the point at which SNR enters the unusable range, thereby enhancing overall network coverage and reliability.

5.4. Impact of Receiver Antenna Height on Maximum Propagation Distance

With the increase in receiver antenna height, the signal transmission range expands progressively, with a particularly notable growth observed when the receiver antenna height reaches 60 cm to 100 cm.
In Figure 24, both Gansu data, Inner Mongolia data, and Xinjiang data demonstrate the positive effect of receiver antenna height on extending the signal transmission range. However, the overall transmission range in Gansu surpasses that in Inner Mongolia, likely due to the relatively lower vegetation density in Gansu, resulting in reduced signal propagation loss.
In summary, within the context of agricultural IoT environments, moderately increasing the receiver antenna height (e.g., above 60 cm) can effectively mitigate signal obstruction and path loss, enhancing the stability and quality of signal transmission while balancing cost and engineering feasibility.

6. Conclusions

This study investigated the propagation characteristics of 433 MHz LoRa signals within maize canopies. Measurements were conducted during the peak growth stage of maize, focusing on LoRa signal performance in terms of Received Signal Strength Indicator (RSSI), Signal-to-Noise Ratio (SNR), and packet loss rate in both maize fields and open environments. Additionally, the influence of transmitter and receiver antenna heights on signal quality was systematically analyzed.
The results revealed a strong monotonic correlation between antenna height and both signal attenuation rate and transmission distance. As antenna height increased, signal quality improved, and the relationship between transmission distance and signal attenuation followed an exponential trend. Under the same crop growth stage conditions, raising the receiver antenna height significantly enhanced signal quality and extended the maximum propagation range.
Using regression analysis for curve fitting, path loss models were constructed for varying antenna heights. The correlation between measured values and fitted values exceeded 0.9. Validation experiments conducted in Inner Mongolia further confirmed the model’s reliability, with a coefficient of determination R2 above 0.85, indicating a high degree of credibility for the proposed path loss models.

7. Discussion

The data and models developed in this study are specifically tailored to the dense-growth stage of maize, providing valuable references for other high-leaf-area crops with analogous canopy structures and dense foliage. These models enable the prediction of received signal strength under specified transmission power, field conditions, and distance parameters, thereby establishing a scientific foundation for optimizing the deployment of wireless sensor network nodes in agricultural environments. The experimental framework is robust, incorporating detailed datasets across diverse antenna heights, geographic locations, and crop growth stages. The comprehensive dataset includes measurements under various antenna heights, geographic settings, analyzed through rigorous scientific methods to ensure high credibility—findings that lay a solid foundation for subsequent research. The study’s holistic approach ensures its results are methodologically sound and practically applicable to real-world agricultural wireless communication systems.
However, several limitations of this study warrant attention: First, these models were primarily validated during the dense growth stage of corn fields, which may restrict their direct applicability to crops with different canopy structures (such as wheat and rice) or other growth stages. Second, since the experiments were conducted in China, the LoRa technology used the 433 MHz frequency band permitted in China, which may exhibit different propagation characteristics compared to other commonly used LoRa bands (e.g., 868 MHz or 915 MHz). Additionally, the transmitter antenna height was tested only up to 10 m, whereas real-world agricultural deployments may require higher installation heights, which were not evaluated in this study.
Future work will focus on the following directions: First, monitor different growth stages of corn (e.g., seedling, flowering, and maturity stages) to obtain the temporal variation relationships between path loss and vegetation density/height, and then perform dynamic modeling. Second, collaborate with research institutions in tropical regions and hilly terrains to test the propagation characteristics of LoRa signals in diverse geographic environments, expand experiments to crops like wheat and rice, and enhance the generalizability of results through multi-environment validation. Third, adjust the LoRa operating frequency within the ISM (Industrial, Scientific, and Medical) band to investigate the relationship between working frequency and propagation performance. Fourth, further increase the LoRa transmitter height beyond 10 m (e.g., installing devices on base stations or fixing them on unmanned aerial vehicles [UAVs]) to study the impact of higher equipment heights on signal transmission. Fifth, leverage deep learning methods in machine learning (ML) [5], such as convolutional neural networks (CNN) and long short-term memory networks (LSTM), combined with traditional machine learning algorithms like random forests, to address complex non-stationary environments, optimize agricultural signal propagation models, and provide data-driven solutions for precision agriculture technologies (encompassing remote sensing, autonomous networks, and other areas) [24,25].

Author Contributions

Conceptualization, T.X. and D.M.; methodology, T.X.; software, W.F.; validation, Y.H. and D.M.: financial support; project management. All authors have read and agreed to the published version of the manuscript.

Funding

This research was funded by Yunbian collaborative high-standard farmland intelligent irrigation control system and equipment research and development, grant number BE2023340.

Data Availability Statement

Data are contained within the article.

Acknowledgments

Thanks to Beijing Lianchuang Siyuan Measurement and Control Technology Co., Ltd. for its hardware support in the release of the microservice.

Conflicts of Interest

The authors declare no conflicts of interest.

References

  1. Saito, Y.; Kishiyama, Y.; Benjebbour, A.; Nakamura, T.; Li, A.; Higuchi, K. Non-Orthogonal Multiple Access (NOMA) for Cellular Future Radio Access. In Proceedings of the 2013 IEEE 77th Vehicular Technology Conference (VTC Spring), Dresden, Germany, 2–5 June 2013; pp. 1–5. [Google Scholar]
  2. Cappelli, I.; Peruzzi, G.; Pozzebon, A.; Scarpel, E. Wireless Sensing in the Woodlands: Preliminary Tests for LoRaWAN Transmission in Vegetated Areas. In Proceedings of the 2023 IEEE Sensors Applications Symposium (SAS), Ottawa, ON, Canada, 18–20 July 2023; pp. 1–6. [Google Scholar]
  3. Haxhibeqiri, J.; De Poorter, E.; Moerman, I.; Hoebeke, J. A Survey of LoRaWAN for IoT: From Technology to Application. Sensors 2018, 18, 3995. [Google Scholar] [CrossRef]
  4. Gkotsiopoulos, P.; Zorbas, D.; Douligeris, C. Performance Determinants in LoRa Networks: A Literature Review. IEEE Commun. Surv. Tutor. 2021, 23, 1721–1758. [Google Scholar] [CrossRef]
  5. Augustin, A.; Yi, J.; Clausen, T.; Townsley, W.M. A Study of LoRa: Long Range & Low Power Networks for the Internet of Things. Sensors 2016, 16, 1466. [Google Scholar] [CrossRef] [PubMed]
  6. Vangelista, L. Frequency Shift Chirp Modulation: The LoRa Modulation. IEEE Signal Process. Lett. 2017, 24, 1818–1821. [Google Scholar] [CrossRef]
  7. Cichoń, K.; Nikiforuk, M.; Kliks, A. Vegetation Loss Measurements for Single Alley Trees in Millimeter-Wave Bands. Sensors 2024, 24, 3190. [Google Scholar] [CrossRef] [PubMed]
  8. Zourmand, A.; Hing, A.L.K.; Hung, C.W.; AbdulRehman, M. Internet of Things (IoT) using LoRa technology. In Proceedings of the 2019 IEEE International Conference on Automatic Control and Intelligent Systems (I2CACIS), Selangor, Malaysia, 29 June 2019; pp. 324–330. [Google Scholar]
  9. Islam, N.; Rashid, M.M.; Pasandideh, F.; Ray, B.; Moore, S.; Kadel, R. A Review of Applications and Communication Technologies for Internet of Things (IoT) and Unmanned Aerial Vehicle (UAV) Based Sustainable Smart Farming. Sustainability 2021, 13, 1821. [Google Scholar] [CrossRef]
  10. Lima, W.G.; Lopes, A.V.R.; Cardoso, C.M.M.; Araújo, J.P.L.; Neto, M.C.A.; Tostes, M.E.L.; Nascimento, A.A.; Rodriguez, M.; Barros, F.J.B. LoRa Technology Propagation Models for IoT Network Planning in the Amazon Regions. Sensors 2024, 24, 1621. [Google Scholar] [CrossRef] [PubMed]
  11. Almalki, F.A.; Soufiene, B.; Alsamhi, S.H.; Sakli, H. A Low-Cost Platform for Environmental Smart Farming Monitoring System Based on IoT and UAVs. Sustainability 2021, 13, 5908. [Google Scholar] [CrossRef]
  12. Erenstein, O.; Jaleta, M.; Sonder, K.; Mottaleb, K.; Prasanna, B.M. Global maize production, consumption and trade: Trends and R&D implications. Food Secur. 2022, 14, 1295–1319. [Google Scholar] [CrossRef]
  13. Myagmardulam, B.; Miura, R.; Ono, F.; Kagawa, T.; Shan, L.; Nakayama, T.; Kojima, F.; Choijil, B. Choijil, Baasandash. Performance Evaluation of LoRa 920 MHz Frequency Band in a Hilly Forested Area. Electronics 2021, 10, 502. [Google Scholar] [CrossRef]
  14. Pensieri, S.; Viti, F.; Moser, G.; Serpico, S.B.; Maggiolo, L.; Pastorino, M.; Solarna, D.; Cambiaso, A.; Carraro, C.; Degano, C.; et al. Evaluating LoRaWAN Connectivity in a Marine Scenario. J. Mar. Sci. Eng. 2021, 9, 1218. [Google Scholar] [CrossRef]
  15. El Chall, R.; Lahoud, S.; El Helou, M. LoRaWAN Network: Radio Propagation Models and Performance Evaluation in Various Environments in Lebanon. IEEE Internet Things J. 2019, 6, 2366–2378. [Google Scholar] [CrossRef]
  16. Wu, B.; Guo, G.; Tian, G.; Liu, W. A Model with Leaf Area Index and Trunk Diameter for LoRaWAN Radio Propagation in Eastern China Mixed Forest. J. Sens. 2020, 2020, 1–16. [Google Scholar] [CrossRef]
  17. Mahjoub, T.; Mnaouer, A.B.; Said, M.B.; Boujemaa, H. LoRa signal propagation and path loss prediction in Tunisian date palm oases. Comput. Electron. Agric. 2024, 222, 109027. [Google Scholar] [CrossRef]
  18. Anzum, R. Factors that affect LoRa Propagation in Foliage Medium. Procedia Comput. Sci. 2021, 194, 149–155. [Google Scholar] [CrossRef]
  19. Aref, M.; Sikora, A. Free space range measurements with Semtech Lora™ technology. In Proceedings of the 2014 2nd International Symposium on Wireless Systems Within the Conferences on Intelligent Data Acquisition and Advanced Computing Systems, Offenburg, Germany, 11–12 September 2014; pp. 19–23. [Google Scholar]
  20. Joo, J.; Han, D.S.; Jeong, H.J. First Fresnel zone analysis in vehicle-to-vehicle communications. In Proceedings of the 2015 International Conference on Connected Vehicles and Expo (ICCVE), Shenzhen, China, 19–23 October 2015; pp. 196–197. [Google Scholar]
  21. Katircioğlu, O.; Isel, H.; Ceylan, O.; Taraktas, F.; Yagci, H.B. Comparing ray tracing, free space path loss and logarithmic distance path loss models in success of indoor localization with RSSI. In Proceedings of the 2011 19th Telecommunications Forum (TELFOR) Proceedings of Papers, Belgrade, Serbia, 22–24 November 2011; pp. 313–316. [Google Scholar]
  22. Cama-Pinto, D.; Damas, M.; Holgado-Terriza, J.A.; Gómez-Mula, F.; Cama-Pinto, A. Path Loss Determination Using Linear and Cubic Regression Inside a Classic Tomato Greenhouse. Int. J. Environ. Res. Public Health 2019, 16, 1744. [Google Scholar] [CrossRef] [PubMed]
  23. Kurt, S.; Tavli, B. Path-Loss Modeling for Wireless Sensor Networks: A review of models and comparative evaluations. IEEE Antennas Propag. Mag. 2017, 59, 18–37. [Google Scholar] [CrossRef]
  24. Joosens, D.; BniLam, N.; Berkvens, R.; Weyn, M. Software-Defined Radio-Based Internet of Things Communication Systems: An Application for the DASH7 Alliance Protocol. Appl. Sci. 2025, 15, 333. [Google Scholar] [CrossRef]
  25. Zhu, G.; Liao, C.H.; Sakdejayont, T.; Lai, I.W.; Narusue, Y.; Morikawa, H. Improving the Capacity of a Mesh LoRa Network by Spreading-Factor-Based Network Clustering. IEEE Access 2019, 7, 21584–21596. [Google Scholar] [CrossRef]
Figure 1. Star topology network.
Electronics 14 02156 g001
Figure 2. First Fresnel zone.
Electronics 14 02156 g002
Figure 3. Geographic location of the experimental station.
Electronics 14 02156 g003
Figure 4. Experimental area.
Electronics 14 02156 g004
Figure 5. LoRa signal propagation path.
Electronics 14 02156 g005
Figure 6. Maize planting method.
Electronics 14 02156 g006
Figure 7. Transmit gateway.
Electronics 14 02156 g007
Figure 8. Receive node.
Electronics 14 02156 g008
Figure 9. Box plots of RSSI under different antenna heights.
Electronics 14 02156 g009
Figure 10. Line chart of RSSI versus distance at different transmitting antenna heights.
Electronics 14 02156 g010
Figure 11. Three-dimensional plot of RSSI versus distance at different transmitting antenna heights.
Electronics 14 02156 g011
Figure 12. Line chart of SNR versus distance at different transmitting antenna heights.
Electronics 14 02156 g012
Figure 13. Three-dimensional plot of SNR versus distance at different transmitting antenna heights.
Electronics 14 02156 g013
Figure 14. Maximum propagation distance at different transmitting antenna heights in Gansu and Inner Mongolia.
Electronics 14 02156 g014
Figure 15. Path loss model comparison.
Electronics 14 02156 g015
Figure 16. Path loss values and fitting curves in maize fields.
Electronics 14 02156 g016
Figure 17. Open environments.
Electronics 14 02156 g017
Figure 18. Path loss values and fitting curves in maize fields.
Electronics 14 02156 g018
Figure 19. The fitted model curve and the validation data points.
Electronics 14 02156 g019
Figure 20. Line chart of RSSI versus distance at different receiving antenna heights.
Electronics 14 02156 g020
Figure 21. Three-dimensional plot of RSSI versus distance at different receiving antenna heights.
Electronics 14 02156 g021
Figure 22. Line chart of SNR versus distance at different receiving antenna heights.
Electronics 14 02156 g022
Figure 23. Three-dimensional plot of SNR versus distance at different receiving antenna heights.
Electronics 14 02156 g023
Figure 24. Maximum propagation distance at different receiving antenna heights in Gansu, Inner Mongolia, and Xinjiang.
Electronics 14 02156 g024
Table 1. Technical characteristics of LoRa.
Key CharacteristicsAdvantages
Reception Sensitivity: Up to −148 dBmLong-Range Communication
Distance: 3–8 km in urban areas; 15 km in suburban areas
Current Consumption: 10 mA in receive mode; <200 nA in sleep modeLow Power Consumption
Battery life is 3–5 times that of other LPWAN technologies
Low infrastructure and operational costsLow Cost
License-free Frequency Bands: 433/470–510 MHz; 868 MHz; 902–928 MHz
Chip costs approximately 1.5–2
Data Rate: 0.3 kb/s–50 kb/sLow Data Rate
The LoRa Alliance has established the standard LoRaWANStandardization:
Table 2. Hardware parameter.
EquipmentMCULoRa ChipPower Supply (v)Antenna Gain (dBi)
GatewayHC32L196SX126855
NodeHC32L196SX126855
Table 3. LoRa setting parameter.
Transmission Power (dBm)SFCoding RateBandwidth(kHz)Payload Length
20124/6125480
20124/6125480
Table 4. Parameters for different models.
Propagation ModelR2RMSE
FSPL0.9284.9
Two-Ray −3.15937.1
COST235-In leaf−13.43169.1
COST235-Out leaf−4.18541.4
Weissberger−31.375103.4
Table 5. Parameters for the fitting model in maize fields.
Transmitter Antenna HeightnkR2RMSE
03.50657.5140.9603.011
23.13361.1310.9702.545
43.56350.0640.9434.168
63.69244.5800.9284.882
83.52745.8190.9583.495
103.25149.9580.9603.179
Table 6. Parameters for the fitting model in open environments.
Transmitter Antenna HeightnkR2RMSE
03.60935.6330.9683.213
23.15340.7890.9573.575
43.44731.1440.9713.254
63.01639.9550.9663.103
83.03337.5910.9921.475
103.03834.9250.9424.105
Table 7. Comparison of fitted model parameters across different environments.
Transmitter Antenna Heightn
Maize
Environments
n
Open Environments
K
Maize
Environments
K
Open Environments
03.5063.60957.51435.633
23.1333.15361.13140.789
43.5633.44750.06431.144
63.6923.01644.58039.955
83.5273.03345.81937.591
103.2513.03849.95834.925
Table 8. Parameters of model fit for validation datasets.
Transmitter Antenna HeightR2RMSE
00.9283.118
20.8763.571
40.7184.687
60.9123.334
80.8634.114
100.8026.421
Disclaimer/Publisher’s Note: The statements, opinions and data contained in all publications are solely those of the individual author(s) and contributor(s) and not of MDPI and/or the editor(s). MDPI and/or the editor(s) disclaim responsibility for any injury to people or property resulting from any ideas, methods, instructions or products referred to in the content.

