Article

Semantic-Guided Multi-Feature Attention Aggregation Network for LiDAR-Based 3D Object Detection

1
School of Electronics and Information Technology, Sun Yat-sen University, Guangzhou 510275, China
2
School of Cyber Science and Technology, Sun Yat-sen University, Shenzhen 518107, China
3
Pazhou Laboratory, Guangzhou 510335, China
*
Author to whom correspondence should be addressed.
Electronics 2025, 14(11), 2154; https://doi.org/10.3390/electronics14112154
Submission received: 7 April 2025 / Revised: 8 May 2025 / Accepted: 10 May 2025 / Published: 26 May 2025

Abstract

:
The sparse and uneven distribution of point clouds in LiDAR-captured outdoor scenes poses significant challenges for 3D object detection in autonomous driving. Specifically, the imbalance between foreground and background points can degrade detection accuracy. While existing approaches attempt to address this issue through sampling or segmentation strategies, effectively retaining informative foreground points and integrating features from multiple sources remains a challenge. To tackle these issues, we propose SMA2, a semantic-guided multi-feature attention aggregation network. It consists of two key components: the Keypoint Attention Enhancement (KAE) module, which refines keypoints by leveraging semantic information through attention-based local aggregation, and the Multi-Feature Attention Aggregation (MFAA) module, which adaptively integrates keypoint, voxel, and BEV features using a keypoint-guided attention mechanism. Compared to existing fusion methods such as PV-RCNN, SMA2 provides a more flexible and context-aware feature integration strategy. Experimental results on the KITTI test set demonstrate consistent performance improvements, especially in detection accuracy for small and distant objects. Additional tests on the Waymo and DAIR-V2X-V datasets further highlight the method’s strong generalization capability across diverse environments.

1. Introduction

As the demand for advanced robotics and autonomous driving technologies increases, precise 3D object detection becomes essential for enabling these systems to function safely and effectively in various environments [1,2,3]. LiDAR, in comparison to RGB images, is particularly suited for 3D object detection under challenging environmental and lighting conditions. It provides high-accuracy point cloud data, offering detailed 3D information about objects, making LiDAR a primary sensor in autonomous driving and robotics applications. Deep learning-based 3D object detection methods can be broadly divided into voxel-based [4,5,6,7] and point-based [8] approaches. Voxel-based methods transform point clouds into 3D voxels or 2D grids, enabling the application of sparse convolutions for feature extraction, which improves computational efficiency. However, the process of voxelization and the use of sparse convolutions can result in a loss of important 3D spatial details, which may reduce detection accuracy [5,9,10]. On the other hand, point-based approaches, such as PointNet [11] and its variants [12,13], directly operate on the original point clouds, preserving fine-grained 3D information and enabling more flexible receptive field selection, leading to improved detection. Despite their advantage in maintaining spatial accuracy, these methods typically use furthest-point sampling (FPS) to select keypoints, which can miss foreground points and produce less effective proposals due to imbalanced point distributions. Since foreground points are essential for accurate detection, their presence in the sampled keypoints directly influences performance. To address this issue, methods like [14,15] have been proposed to capture a larger number of keypoints, improving the distinction between foreground and background.
This paper introduces the semantic-guided multi-feature attention aggregation (SMA2) network, a novel approach that combines the foreground point extraction capability of semantic sampling and the feature representation strength of a sparse convolution backbone. By fusing semantically enhanced keypoints, voxels, and BEV, SMA2 captures both local structures and global information in point cloud data, enhancing object detection accuracy. The network adopts a series of progressive steps for feature fusion, detailed as follows.
To extract more valuable foreground points, Yang et al. [16] utilized point cloud feature information for downsampling and employed Distance-FPS (D-FPS) to retain foreground points, thereby improving classification accuracy. Wu et al. [17] proposed a semantic-based strategy for foreground point extraction, which focuses on acquiring important spatial and positional information while minimizing computational cost. Extracting foreground points from a large pool of background points relies heavily on semantic information. Drawing inspiration from Part A 2 [7], the method uses point cloud semantic segmentation results as prior knowledge to guide the detector in extracting more foreground points. Specifically, each point is assigned a semantic segmentation class label based on its position relative to the 3D ground-truth annotation box.
To achieve this, a novel Keypoint Attention Enhancement (KAE) module is introduced. The semantic segmentation scores are used as weights for semantic-guided sampling, extracting foreground points from raw point clouds. Simultaneously, segmented semantic features are aggregated with the sampled foreground points via cross-attention, forming keypoint semantic enhancement features. Unlike FPS [12], S-FPS [18], and Sectorized-Centric Keypoint Sampling [15], this approach maximizes the retention of keypoint features from foreground points, enhancing attention mechanisms for better detection performance.
After obtaining semantic-enhanced keypoint features, the challenge arises as to how to aggregate keypoint and multi-scale features. We aim to model the relationship between keypoints and multi-scale sparse voxels. Previous works [12,19] in 3D object detection have constructed these relationships by using point–voxel fusion, maximum pooling layers [14,20,21], and graph relationships [19,22]. The advantage is that the context information and dependencies can be captured, which can greatly enhance the ability to identify fine-grained patterns. However, the key challenge is to mine the correlation between key point features and multi-scale voxel features while effectively fusing the two features together. Inspired by the transformer architecture [23,24], a multi-feature attention aggregation (MFAA) module is proposed, which consists of three components: keypoints, BEV, and multi-scale sparse voxel features. By leveraging self-attention mechanisms, the MFAA module adaptively attends to relevant features from each representation, enabling the precise fusion of local and global information. The keypoint query guides attention, focusing on pertinent regions while ensuring efficient communication between features extracted from keypoints, BEV, and voxel grids.
The MFAA module facilitates cross-feature interactions, allowing keypoint features to be enhanced by semantic information and effectively fused with multi-scale voxel representations. This process captures both local and global spatial relationships, improving object detection accuracy, particularly in complex scenes. Additionally, hierarchical feature interactions at different scales help the model to focus on both fine details and broader contextual patterns, resulting in more robust detection performance.
In summary, the main contributions in this work are summarized as follows:
  • A Keypoint Attention Enhancement (KAE) module is introduced to capture more valuable foreground points from the raw point cloud, enabling the model to focus accurately on areas containing small objects;
  • We propose a multi-feature attention aggregation (MFAA) module, designed to aggregate keypoints and their corresponding voxel features to generate a comprehensive feature representation. This method effectively leverages the complementarity between point cloud and voxelized representations;
  • The proposed keypoint query allows for the direct extraction of voxel features near the keypoints, eliminating the need to traverse all voxels and thereby improving computational efficiency.
  • Extensive experiments demonstrate that SMA2 achieves competitive performance on the widely used KITTI 3D object detection benchmark. Furthermore, the method has been validated for robustness on the Waymo and DAIR-V2X-V validation sets.
The structure of this paper is as follows. Section 2 surveys related work on LiDAR-based 3D object detection, covering point-based, voxel-based, and hybrid methods. In Section 3, we introduce the SMA2 network, which integrates semantic-aware modules with multi-feature attention mechanisms. Section 4 details the experimental setup, datasets, and implementation specifics. Section 5 reports quantitative results on the KITTI, Waymo, and DAIR-V2X-V benchmarks. Section 6 presents a comprehensive analysis, including ablation studies and module evaluations. Section 7 compares the inference performance of SMA2 against existing approaches.

2. Related Work

2.1. Overview of LiDAR-Based Methods

Point cloud data, due to its irregular and sparse nature, cannot be directly processed by traditional Convolutional Neural Networks (CNNs) without preprocessing to define a suitable representation. Point cloud representation methods can generally be classified into point-based, voxel-based, and point–voxel-based approaches.
Point-Based Methods: These approaches directly process raw point clouds to extract point-level features for 3D object detection. Key works in this area include PointRCNN [20], which utilizes PointNet++ [12] for bounding box refinement in a two-stage process. The method 3DSSD [16] introduces a fusion sampling strategy that balances the retention of foreground points with computational efficiency. IA-SSD [25] applies progressive downsampling to preserve foreground points while optimizing efficiency. STD [26] uses spherical anchors for high recall in point-based proposal generation, and Point-GNN [27] employs automatic point registration and feature alignment to predict object categories and bounding boxes.
Voxel-Based Methods: These methods convert point clouds into voxel representations for efficient feature extraction using 3D CNNs. VoxelNet [4] pioneered voxel feature encoding but suffered from high computational complexity. SECOND [5] improved on this by using sparse convolutions, exploiting point cloud sparsity to reduce computation. PointPillars [6] further advanced this by encoding point clouds into vertical pillars, generating BEV pseudo-images. Part- A 2 [7] proposed an encoder–decoder structure for non-empty voxel prediction and introduced RoI-grid pooling to refine detection frames. Voxel-RCNN maps initial BEV proposals back to 3D space for enhanced feature representation, while HVNet [28] improves detection across categories by fusing voxel features at different resolutions. CIA-SSD [29] incorporates a lightweight aggregation module for feature correction and confidence enhancement, and VoTr [30] utilizes transformers to better capture contextual dependencies.
Point–Voxel-Based Methods: These approaches combine the strengths of both point-based and voxel-based methods, leveraging the geometric information of points alongside the structured benefits of voxelization. SA-SSD [31] introduces an auxiliary network at the voxel layer for supervised geometric feature learning. PV-RCNN [14] encodes multi-scale voxel features into keypoints via a voxel set abstraction layer, effectively aggregating keypoint features through FPS sampling. CT3D [32] models geometric relationships at the channel level with a transformer network, and Pyramid-RCNN [33] adapts a spherical query radius to progressively expand the RoI region, improving feature extraction across multiple scales.
As shown in Table 1, SMA2 improves upon existing methods in the following key areas. By combining voxelization with point-based processing, SMA2 effectively balances computational efficiency and fine detail preservation. The keypoint-guided multi-feature attention mechanism enables more context-aware feature fusion, enhancing detection accuracy. SMA2 uses semantic keypoint sampling to refine foreground point detection, particularly for small or occluded objects.

2.2. Two-Stage 3D Object Detection Methods

In two-stage 3D object detection frameworks, the first stage generates coarse proposals, while the second stage refines them for accurate localization. The key difference among existing methods lies in how they leverage point and voxel features. STD [26] adopts spherical anchors to sample seed points and constructs dense feature maps within proposals, enhancing contextual understanding and recall. PV-RCNN++ [15] integrates both voxel-wise and point-wise features—extracting voxel features at keypoints in the first stage and aggregating grid-level features for refinement in the second stage—achieving a fine-grained balance between accuracy and efficiency. In contrast, Voxel-RCNN [9] argues that coarse voxel granularity is sufficient and introduces a voxel ROI pooling module to directly extract features from voxel maps, simplifying the pipeline without sacrificing accuracy.

2.3. Multi-Modal 3D Object Detection Methods

Multi-modal 3D object detection plays a vital role in the domains of autonomous driving and robotics by leveraging complementary information from different sensors to improve detection performance [3]. GraphAlign [34] utilizes a graph matching strategy to effectively align semantic features from images with geometric cues from point clouds, enhancing the overall accuracy of multi-modal detection. RoboFusion [35] further improves robustness by incorporating vision-based models to mitigate the impact of real-world noise and environmental disturbances. To ensure consistency between modalities during augmentation, Dyfusion [36] performs joint enhancement on both point clouds and their corresponding image data. These techniques collectively demonstrate that multi-modal approaches are better suited for high-precision applications, particularly in advanced autonomous driving systems and scenarios requiring strong resilience.

2.4. Attention-Based 3D Object Detection Methods

Recently, attention-based methods have gained significant traction in 3D computer vision, particularly for tasks involving sparse and irregular point cloud data [37,38]. The success of self-attention and cross-attention mechanisms in transformer architectures has demonstrated strong capabilities in modeling global context and enhancing feature representation. For example, Pointformer [39] applies a self-attention framework to semantic scene segmentation, highlighting the value of capturing long-range dependencies in 3D space. Similarly, transformer-based models such as PCT [40] and M3DETR [41] leverage attention to aggregate contextual information and capture multi-scale semantics directly from raw point clouds. Compared with traditional voxelization or projection-based approaches, which may suffer from resolution loss or discretization errors, transformer architectures can preserve geometric fidelity while learning richer interactions. VoTr [30] adopts a voxel-based transformer encoder–decoder architecture to model contextual features, but its aggregation remains constrained within voxel partitions. SST [42] improves efficiency by eliminating multi-scale fusion and voxel downsampling, while SAT-GCN [43] combines graph convolution and attention to enhance semantic reasoning via neighborhood aggregation.
In contrast to these methods, our proposed SMA2 introduces a multi-feature attention aggregation (MFAA) module that leverages keypoint-guided attention to dynamically integrate features across multiple representations—keypoints, voxels, and BEV—while retaining fine-grained semantic details. This design differs from methods like Pointformer and VoTr by explicitly combining multi-source features under semantic guidance, enabling more robust detection, particularly for small or occluded objects.

3. Methodology

3.1. The Overview of Our Method
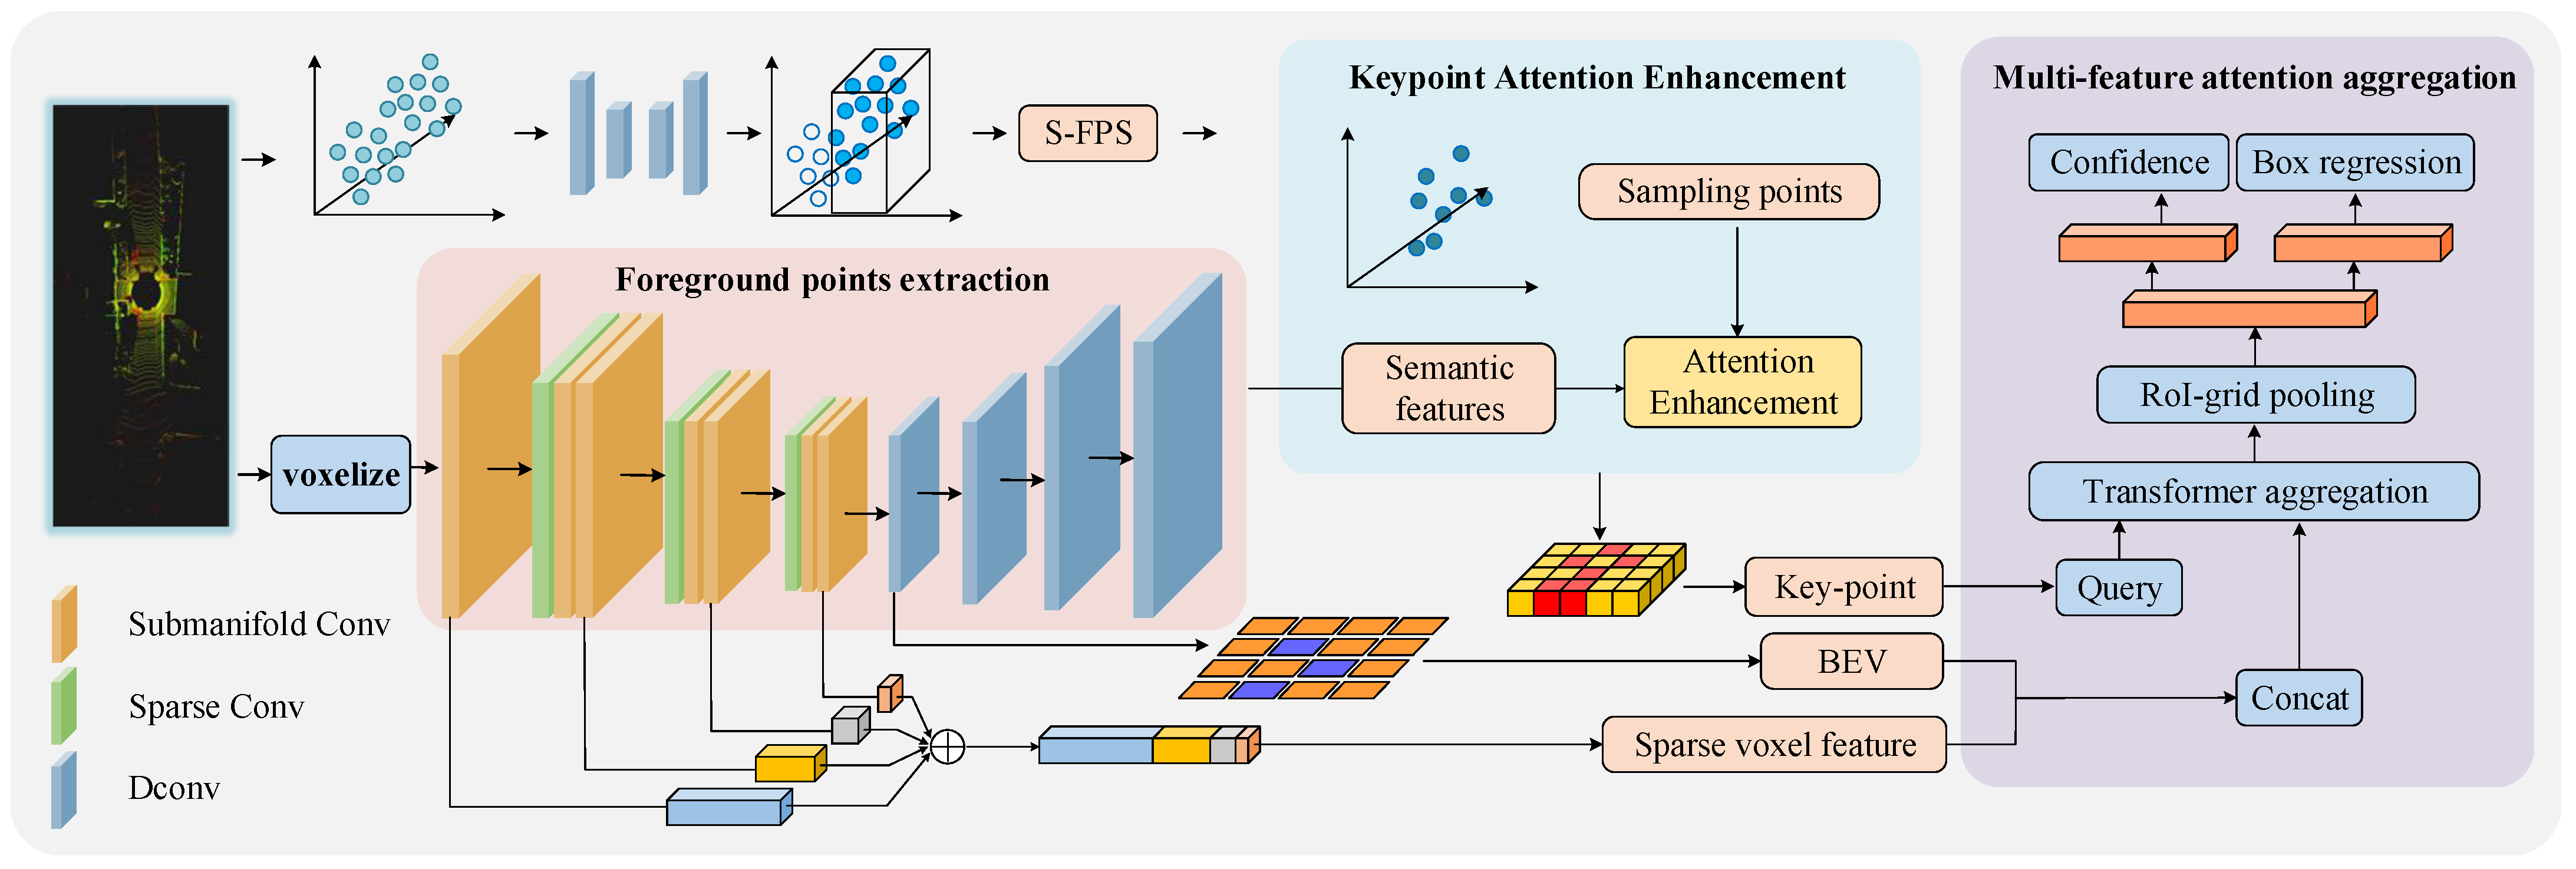
The pipeline of SMA2 is shown in 
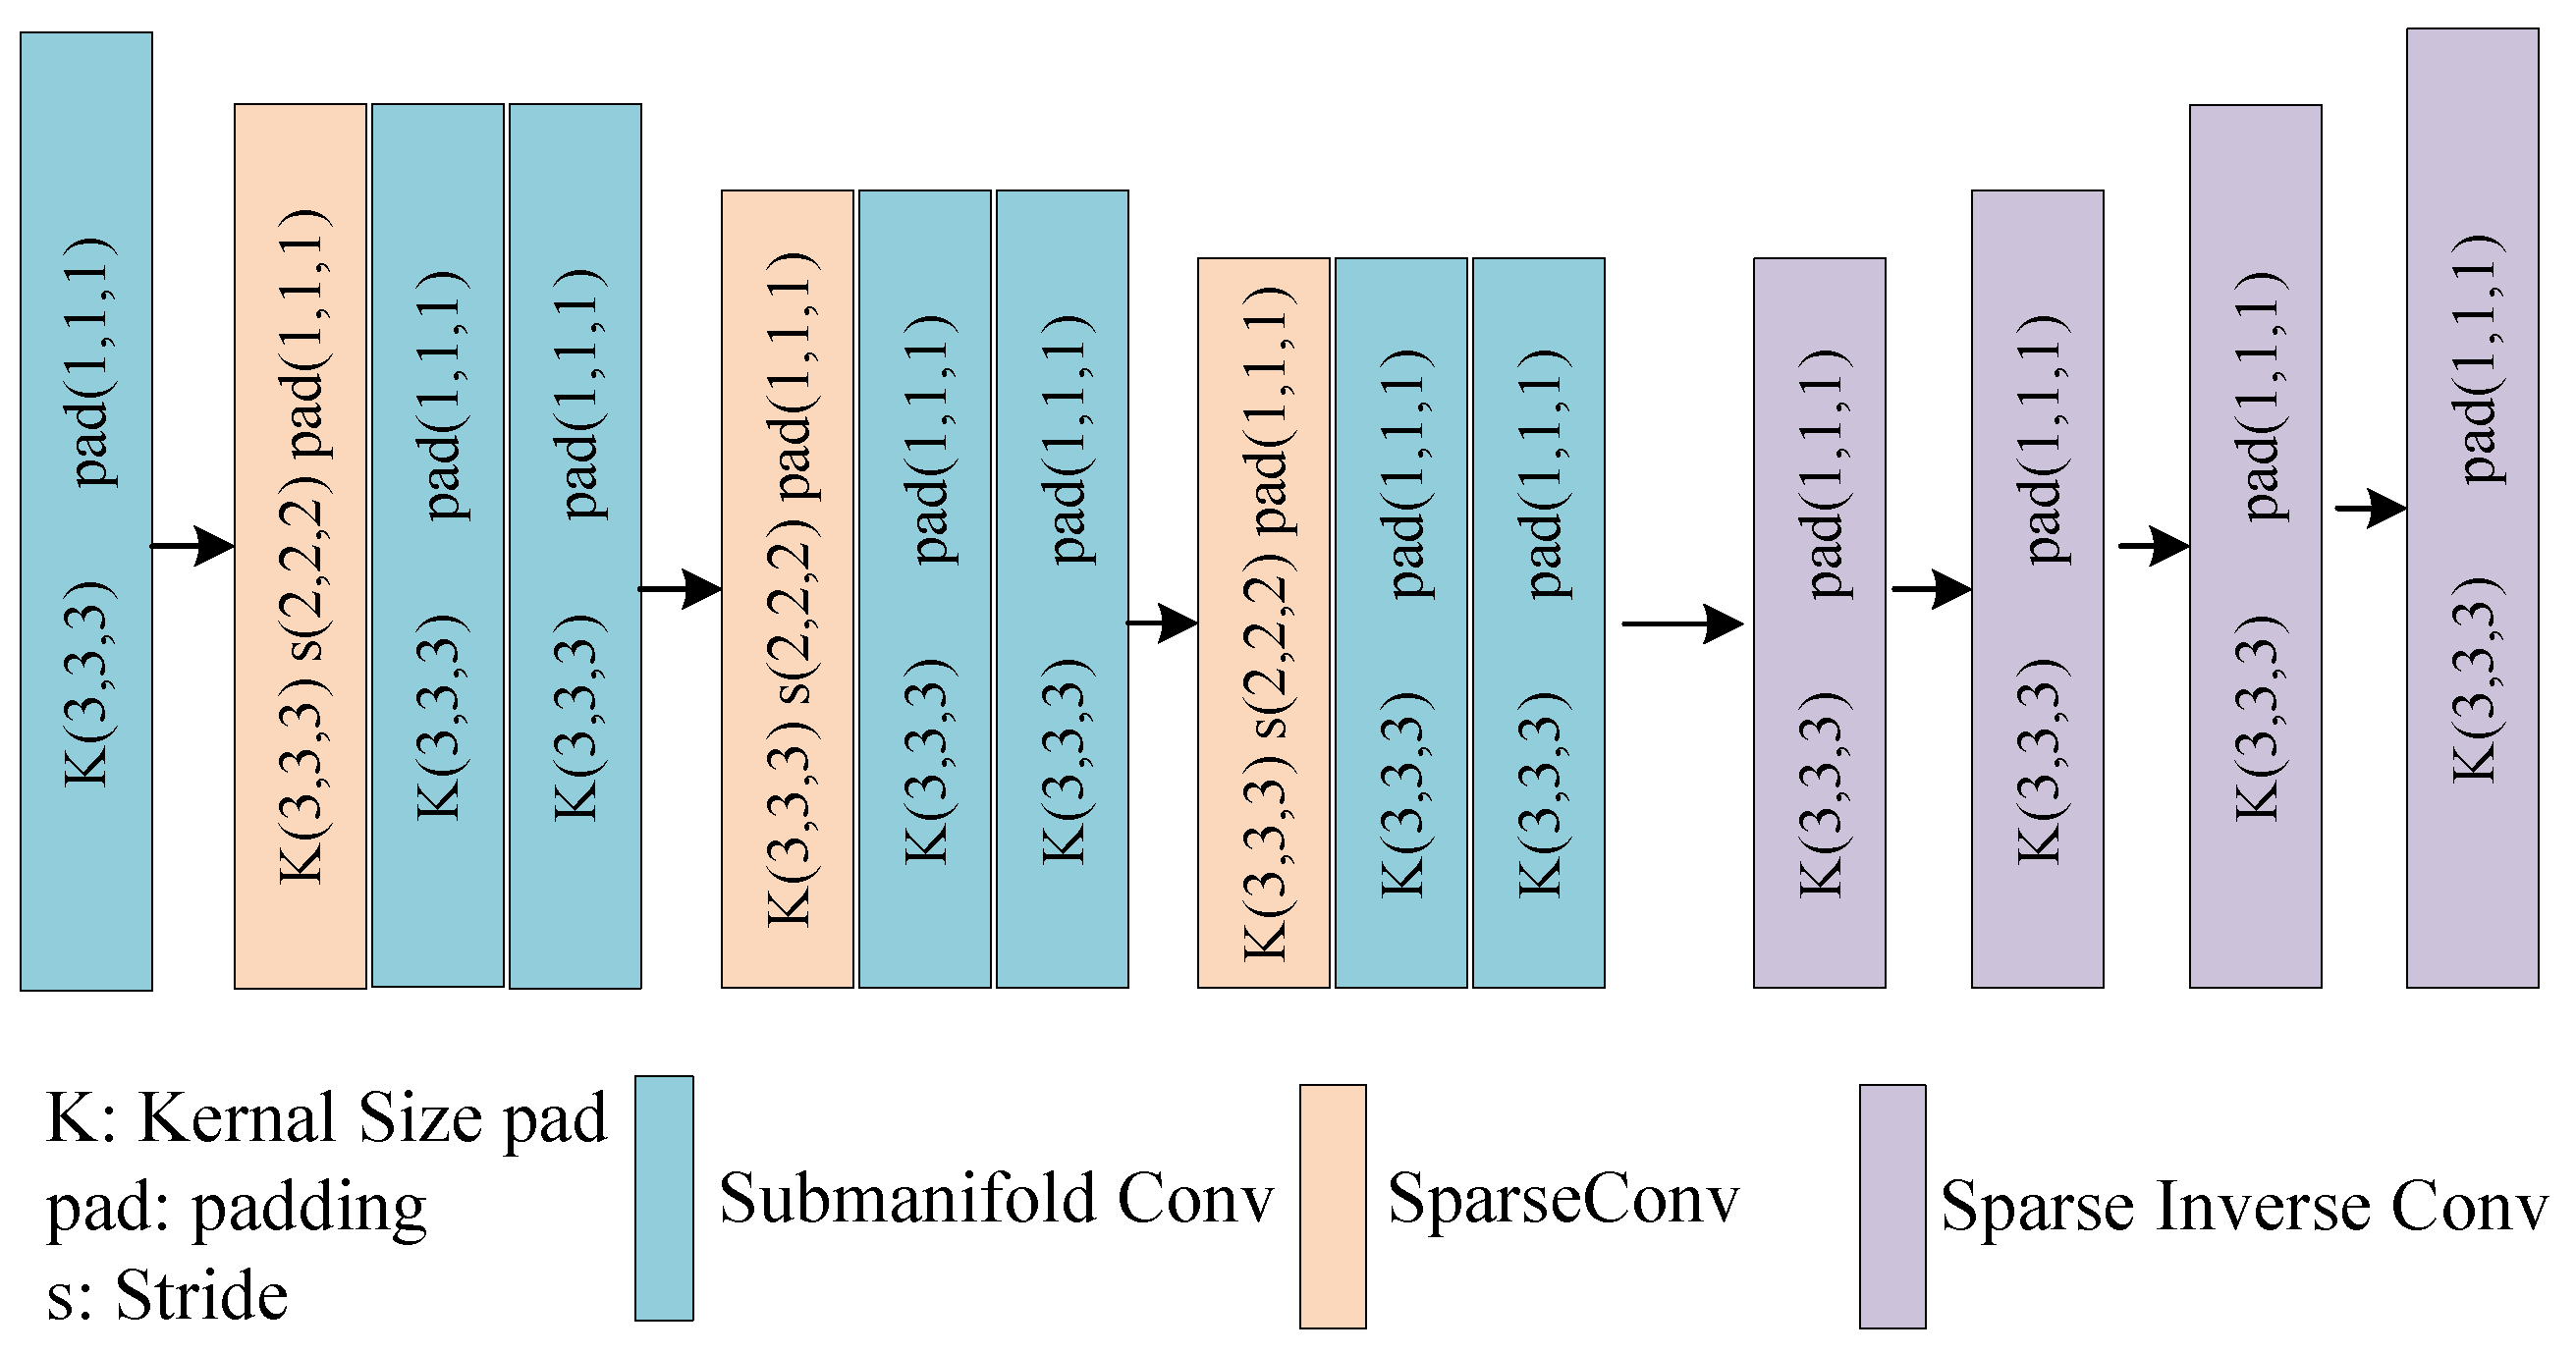
Figure 1. The network is composed of three main components. First, the foreground point extraction module utilizes the Spconv–Unet encoder–decoder architecture, as depicted in Figure 2. This network combines sparse convolution blocks with submanifold convolution blocks to learn discriminative voxel features. The encoder employs three sparse convolution blocks to downsample the input voxel space by a factor of eight, effectively capturing essential feature information. The second component, the Keypoint Attention Enhancement module, samples the raw point clouds based on the detected point categories from the first stage. A self-attention mechanism is then applied between the voxelized sampling points and semantic space features, computing the offsets between location features and input features to refine keypoint selection. Finally, the multi-feature attention aggregation module leverages a 3D sparse CNN to extract voxel features, which are subsequently compressed into 2D BEV features. The keypoints, BEV features, and sparse voxel features are then passed through the transformer aggregation module, where they are integrated to optimize detection performance.

3.2. Foreground Points Extraction

To segment foreground points, an Spconv–Unet encoder–decoder network is used to learn discriminative voxel features through sparse and submanifold convolution blocks. The encoder downsamples the voxel space using three sparse convolution layers followed by two submanifold convolution layers to capture high-level features efficiently. The decoder then restores the original spatial resolution using four upsampling blocks, aiming to recover non-empty voxel features while maintaining computational efficiency. This architecture enables effective segmentation of foreground points by handling sparse point cloud data efficiently.
And then we choose a voxel-based data representation as input and divide the raw point clouds into regular small voxels with spatial resolution L × M × N . Each voxel represents the characteristics of points contained in its grid. The mean of coordinates among points within a non-empty voxel is firstly calculated as the initial value of the voxel feature.
Given the size ( w , l , h ) , orientation θ in the bird’s-eye view, and the center position ( C x , C y , C z ) from the 3D ground-truth boxes, represented as ( C x , C y , C z , w , l , h , θ ) , we compute the relative position of each foreground point using Equation (1). The relative position of the foreground points, denoted as ( q x , q y , q z ) , is expressed as ( f x , f y , f z ) .
u x u y = q x c x q y c y cos ( θ ) sin ( θ ) sin ( θ ) cos ( θ ) , f x = u x w + 0.5 ,   f y = u y l + 0.5 ,   f z = q z c z h + 0.5 ,
where f x ,   f y ,   f z [ 0 , 1 ] and the center of relative position is ( 0.5 , 0.5 , 0.5 ) . It is worth noting that all coordinates follow the LiDAR coordinate system in the KITTI dataset, which is a right-handed coordinate system with the z-axis up, the x-axis forward, and the y-axis left.
For each foreground point ( q x , q y , q z ) within a 3D bounding box, the process begins by shifting the point coordinates relative to the box center ( c x , c y , c z ) , so that the position is described in the object’s local coordinate system. A 2D rotation matrix, with angle θ , is then applied to the point in the xy plane to align the local coordinate frame with the object’s orientation in the bird’s-eye view. This rotation ensures that all objects are standardized to a common heading direction. The resulting offsets ( u x , u y ) , along with the vertical difference ( q z c z ) , are normalized by the bounding box dimensions ( w , l , h ) to map the point’s relative position into a canonical coordinate space within the range of [ 0 , 1 ] 3 . This normalization centers the object at ( 0.5 , 0.5 , 0.5 ) , ensuring a consistent geometric representation regardless of object scale or orientation. It should be noted that this transformation is based on the LiDAR coordinate system defined in the KITTI dataset, a right-handed system where the x-axis points forward, the y-axis points left, and the z-axis points upward.
The 3D ground-truth boxes inherently encode semantic categories for associated foreground points, while a significant imbalance exists between foreground and background point distributions [7]. To alleviate this class imbalance problem, we use focal loss [44], defined by
L seg = 1 N fore i N α t 1 p i γ log p i
where
p i = s , if s = 1 1 s , otherwise .
where p i represents the probability of classifying a point as foreground or background, with hyperparameters set to α t = 0.25 and γ = 2 .

3.3. Semantic FPS

Farthest-point sampling (FPS) [45] is commonly employed for point cloud sampling, aiming to maintain the spatial structure and balance of the original data. It excels at selecting a subset of informative points that reflect the overall geometry of the scene. Nevertheless, in outdoor LiDAR scenarios, where point clouds can be dense and unevenly distributed, FPS may struggle to consistently capture representative points. This limitation can lead to missing critical features, such as small or distant objects, ultimately affecting the accuracy of 3D object detection.
To address this challenge, we propose a foreground-aware distance-weighted sampling strategy, inspired by [17]. The key idea is to incorporate foreground information into the FPS process to prioritize important points that contribute to object detection. Specifically, we leverage a foreground point segmentation module, which classifies each point as either foreground or background. This classification helps in assigning different importance to points, with foreground points receiving higher weights during the sampling process. A two-layer Multi-Layer Perceptron (MLP) is employed to classify points. Given N input points with feature vectors ( f 1 l , f 2 l , , f N l ) , each of dimension L, the MLP predicts a foreground score q [ 0 , 1 ] for each point, representing the probability of being part of the foreground. The foreground score q i for the i-th point is computed as follows:
q i = σ H f i l ,
where H represents the segmentation module, which maps the input point-wise features f i to foreground scores q i , and σ ( · ) is the sigmoid activation function. A score near 1 implies a strong association with the foreground, whereas a value closer to 0 indicates a higher likelihood of being part of the background. Once the foreground scores are obtained, we incorporate these scores into the FPS process to refine the selection of keypoints. Let D = { d 1 , d 2 , , d N } represent the distances from each unselected point to the existing keypoints in the keypoint set. In each iteration, the point with the largest semantically weighted distance is selected as a keypoint. The weight is computed by multiplying the foreground score q i with the distance d i , as follows:
k i = q i · d i ,
where k i represents the weighted score for the i-th point. By incorporating the foreground score, we prioritize points that are both far from the existing keypoints and likely to be part of the foreground, ensuring that informative points are selected. The point with the largest weighted score k i is added to the keypoint set K, which is iteratively updated as
K = { k 1 , k 2 , , k N } .
This process allows us to adaptively select keypoints based on both their spatial distribution and their importance in representing the foreground, resulting in more efficient and effective point cloud sampling.

3.4. Keypoint Attention Enhancement

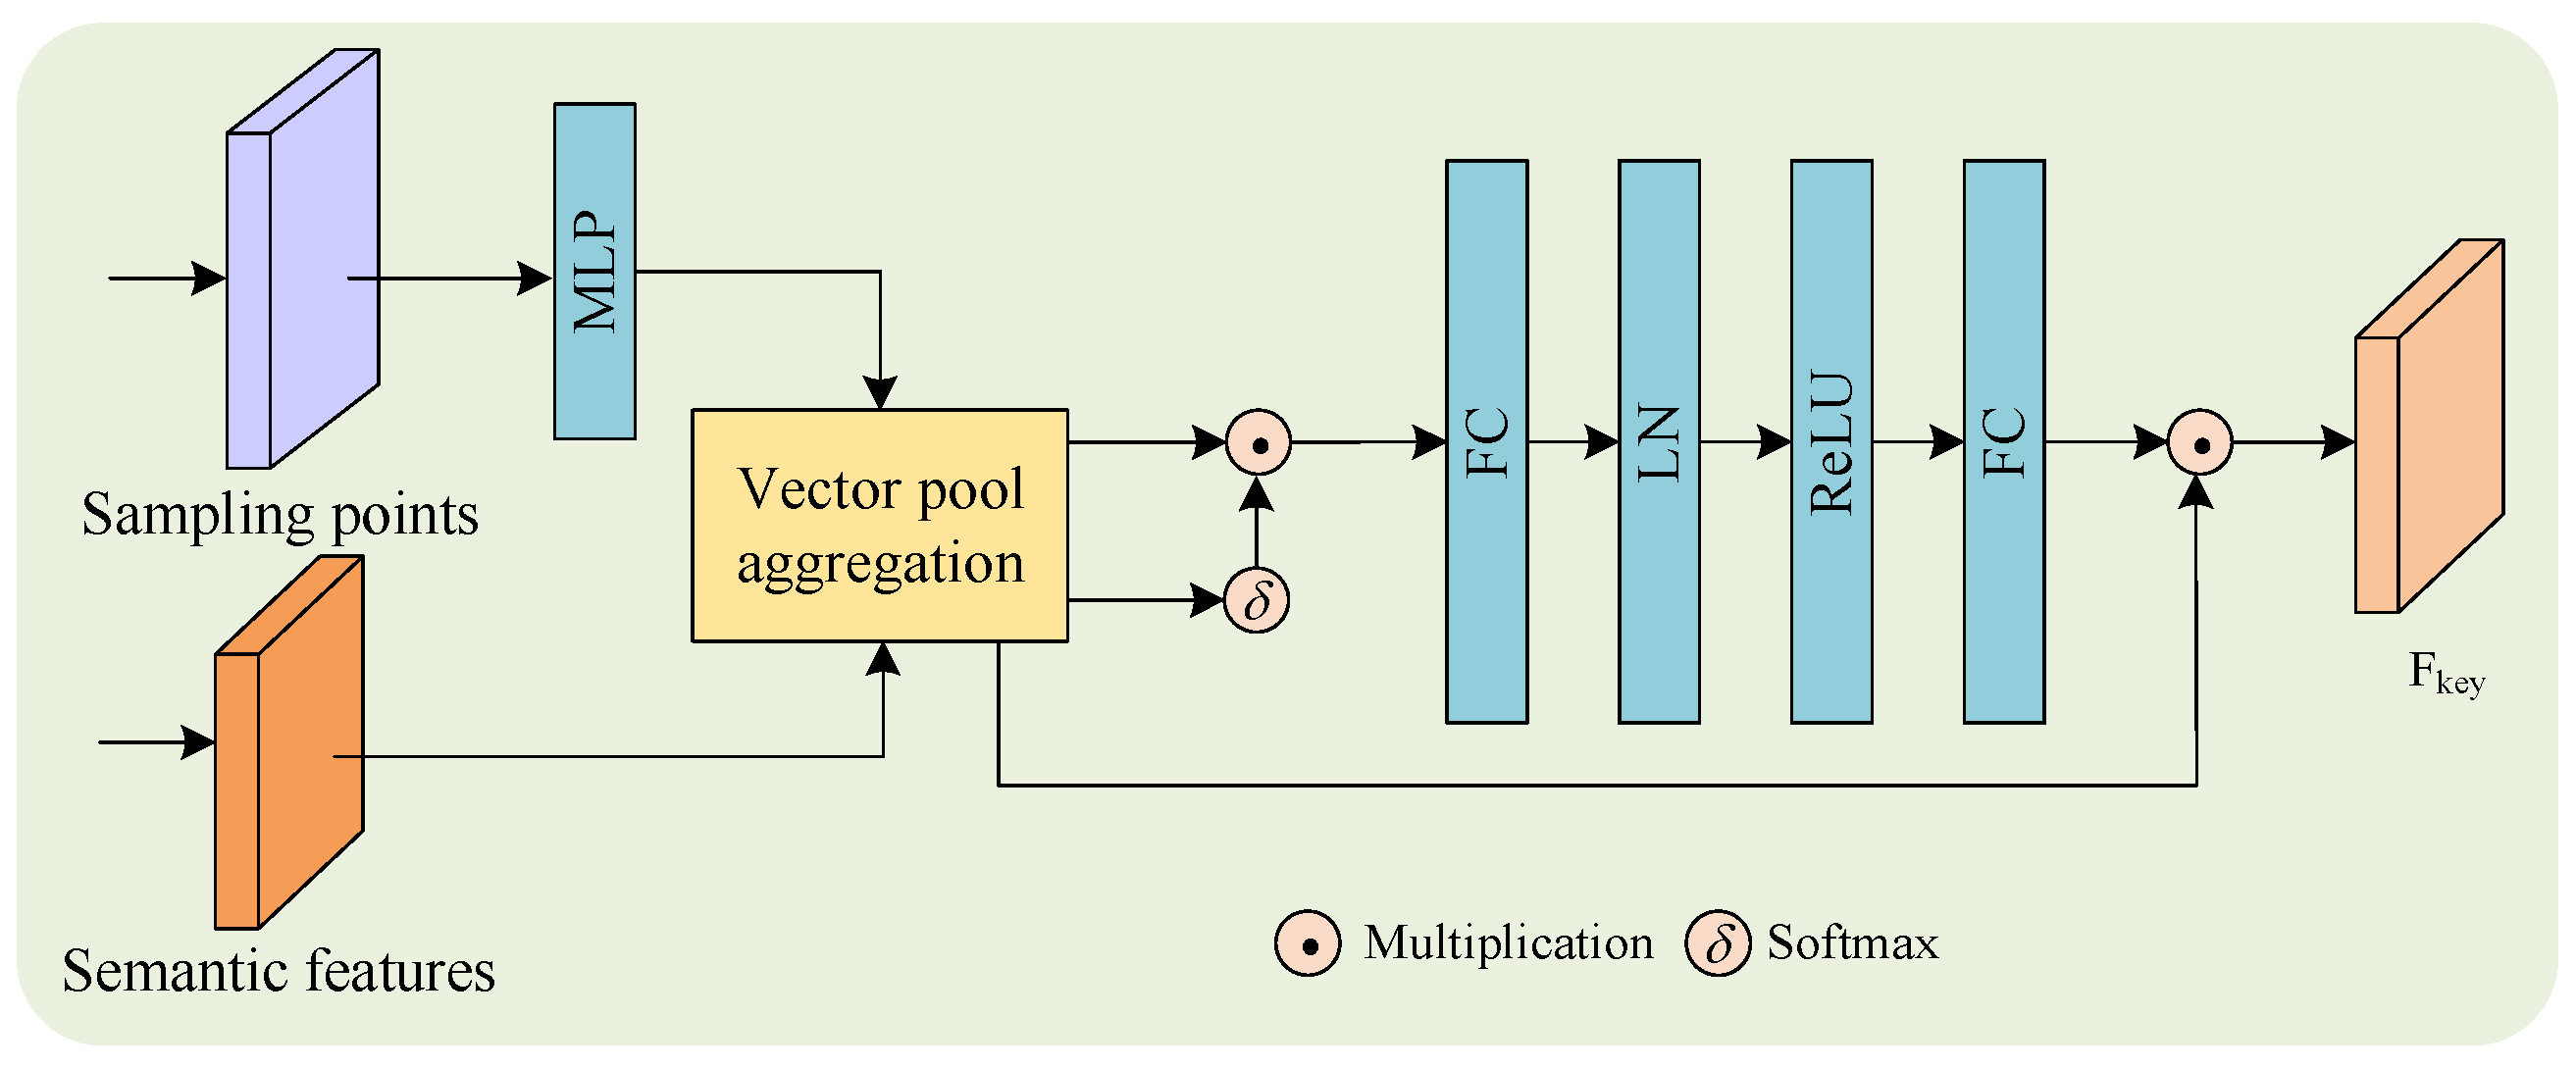
Our proposed Keypoint Attention Enhancement module dynamically enhances 3D keypoint features through the hierarchical fusion of geometric and semantic cues, enabling robust representation learning in complex scenes. As shown in Figure 3, given an input set of 3D keypoints K R N × 3 , where N denotes the number of points and each point k i is represented by its ( x , y , z ) coordinates, the module operates as follows.
The raw keypoints K are encoded into high-dimensional semantic–geometric features using a feature extractor (e.g., MLP or PointNet-based backbone). This yields a feature map:
F = { f 1 , f 2 , , f N } R N × C ,
where C is the feature dimension. Each f i encapsulates local geometric structures and global semantic contexts.
To prioritize discriminative regions, we compute a global attention map b R N by fusing voxel foreground point features and semantic keypoint features using vector pool aggregation [15]. The attention weights are normalized via softmax:
b i = exp MLP ( f i ) j = 1 N exp M L P ( f j ) ,
where b i reflects the global significance of the i-th keypoint. The feature map F is refined through a fully connected (FC) layer with layer normalization (LN):
F = LN FC ( F ) .
The attention map b dynamically weights F via element-wise multiplication:
H = F b .
For each keypoint i, we enhance its representation using a two-layer network with ReLU and LayerNorm:
F k e y i = f i FC 2 ReLU LN FC 1 j = 1 N w j f j ,
where ⊙ denotes element-wise multiplication and w j are learnable weights.
The final output F k e y R N × C consolidates discriminative geometric and semantic features.

3.5. Multi-Feature Attention Aggregation

3.5.1. Multi-Scale Voxel Feature Group

Sparse voxels enable higher spatial resolution by leveraging a smaller number of occupied voxels, thereby preserving fine-grained geometric structures. This characteristic is particularly advantageous for capturing subtle object boundaries and small-scale scene details in 3D perception tasks. However, voxelization inherently introduces quantization artifacts and information loss due to the discretization of irregular point clouds. To mitigate this issue, we adopt a multi-scale voxel feature aggregation strategy that captures point cloud information across multiple spatial resolutions and enriches context representation.
Instead of enhancing the sparse voxel backbone via isolated stages as in [46,47], we construct a hierarchical feature aggregation framework that aligns sparse voxel features with BEV (bird’s-eye view) features at multiple scales. Specifically, we extract downsampled sparse voxel features { f 1 ,   f 2 ,   f 3 ,   f 4 } from four stages with strides { 1 ,   2 ,   4 ,   8 } . These features are progressively aligned to a common BEV resolution and concatenated with coarse-resolution voxel features. This results in a multi-scale hierarchical feature representation that captures both fine and coarse spatial information, which is then used to guide feature propagation to higher scales. The resulting non-empty voxel features { F 1 ,   F 2 ,   F 3 ,   F 4 } , centered around keypoints, are aggregated to enhance semantic richness. To handle discrepancies in feature dimensions across different scales, we apply a channel reduction step using sparse 3D convolution (SparseConv), ensuring consistent feature dimensionality before fusion.
This process not only bridges the resolution gap among features at different levels but also facilitates efficient information flow across scales. Moreover, our design allows for contextual feature enhancement in both dense and sparse regions by adaptively integrating voxel features with varying levels of granularity. This proves particularly beneficial for detecting small or distant objects, where fine-scale features provide critical cues. By fusing multi-scale voxel features into a unified representation, our method achieves a more comprehensive understanding of the scene while maintaining computational efficiency inherent to sparse convolutional networks.

3.5.2. BEV Feature Map Representation

In the 3D voxel CNN branch, we first extract the 8-times downsampled voxel feature map f 4 , with dimensions L 8 × W 8 × H 8 × C , where L, W, and H represent the length, width, and height of the input voxel grid, respectively. To effectively transform the voxel features into a bird’s-eye view (BEV) representation, we stack the features along the z-axis, aggregating the three-dimensional voxel features into two-dimensional BEV feature maps with a size of L 8 × W 8 × H × C 8 . This representation not only preserves the spatial geometry of the scene but also ensures higher computational efficiency. Subsequently, to obtain the semantic embeddings of the downsampled points in the BEV space, we employ bilinear interpolation to extract the corresponding feature vectors from the BEV feature map, denoted as F b e v R N × C , where N is the number of points and C represents the number of channels. This process enhances the contextual information of the point cloud representation, providing more robust features for subsequent fusion and detection tasks.

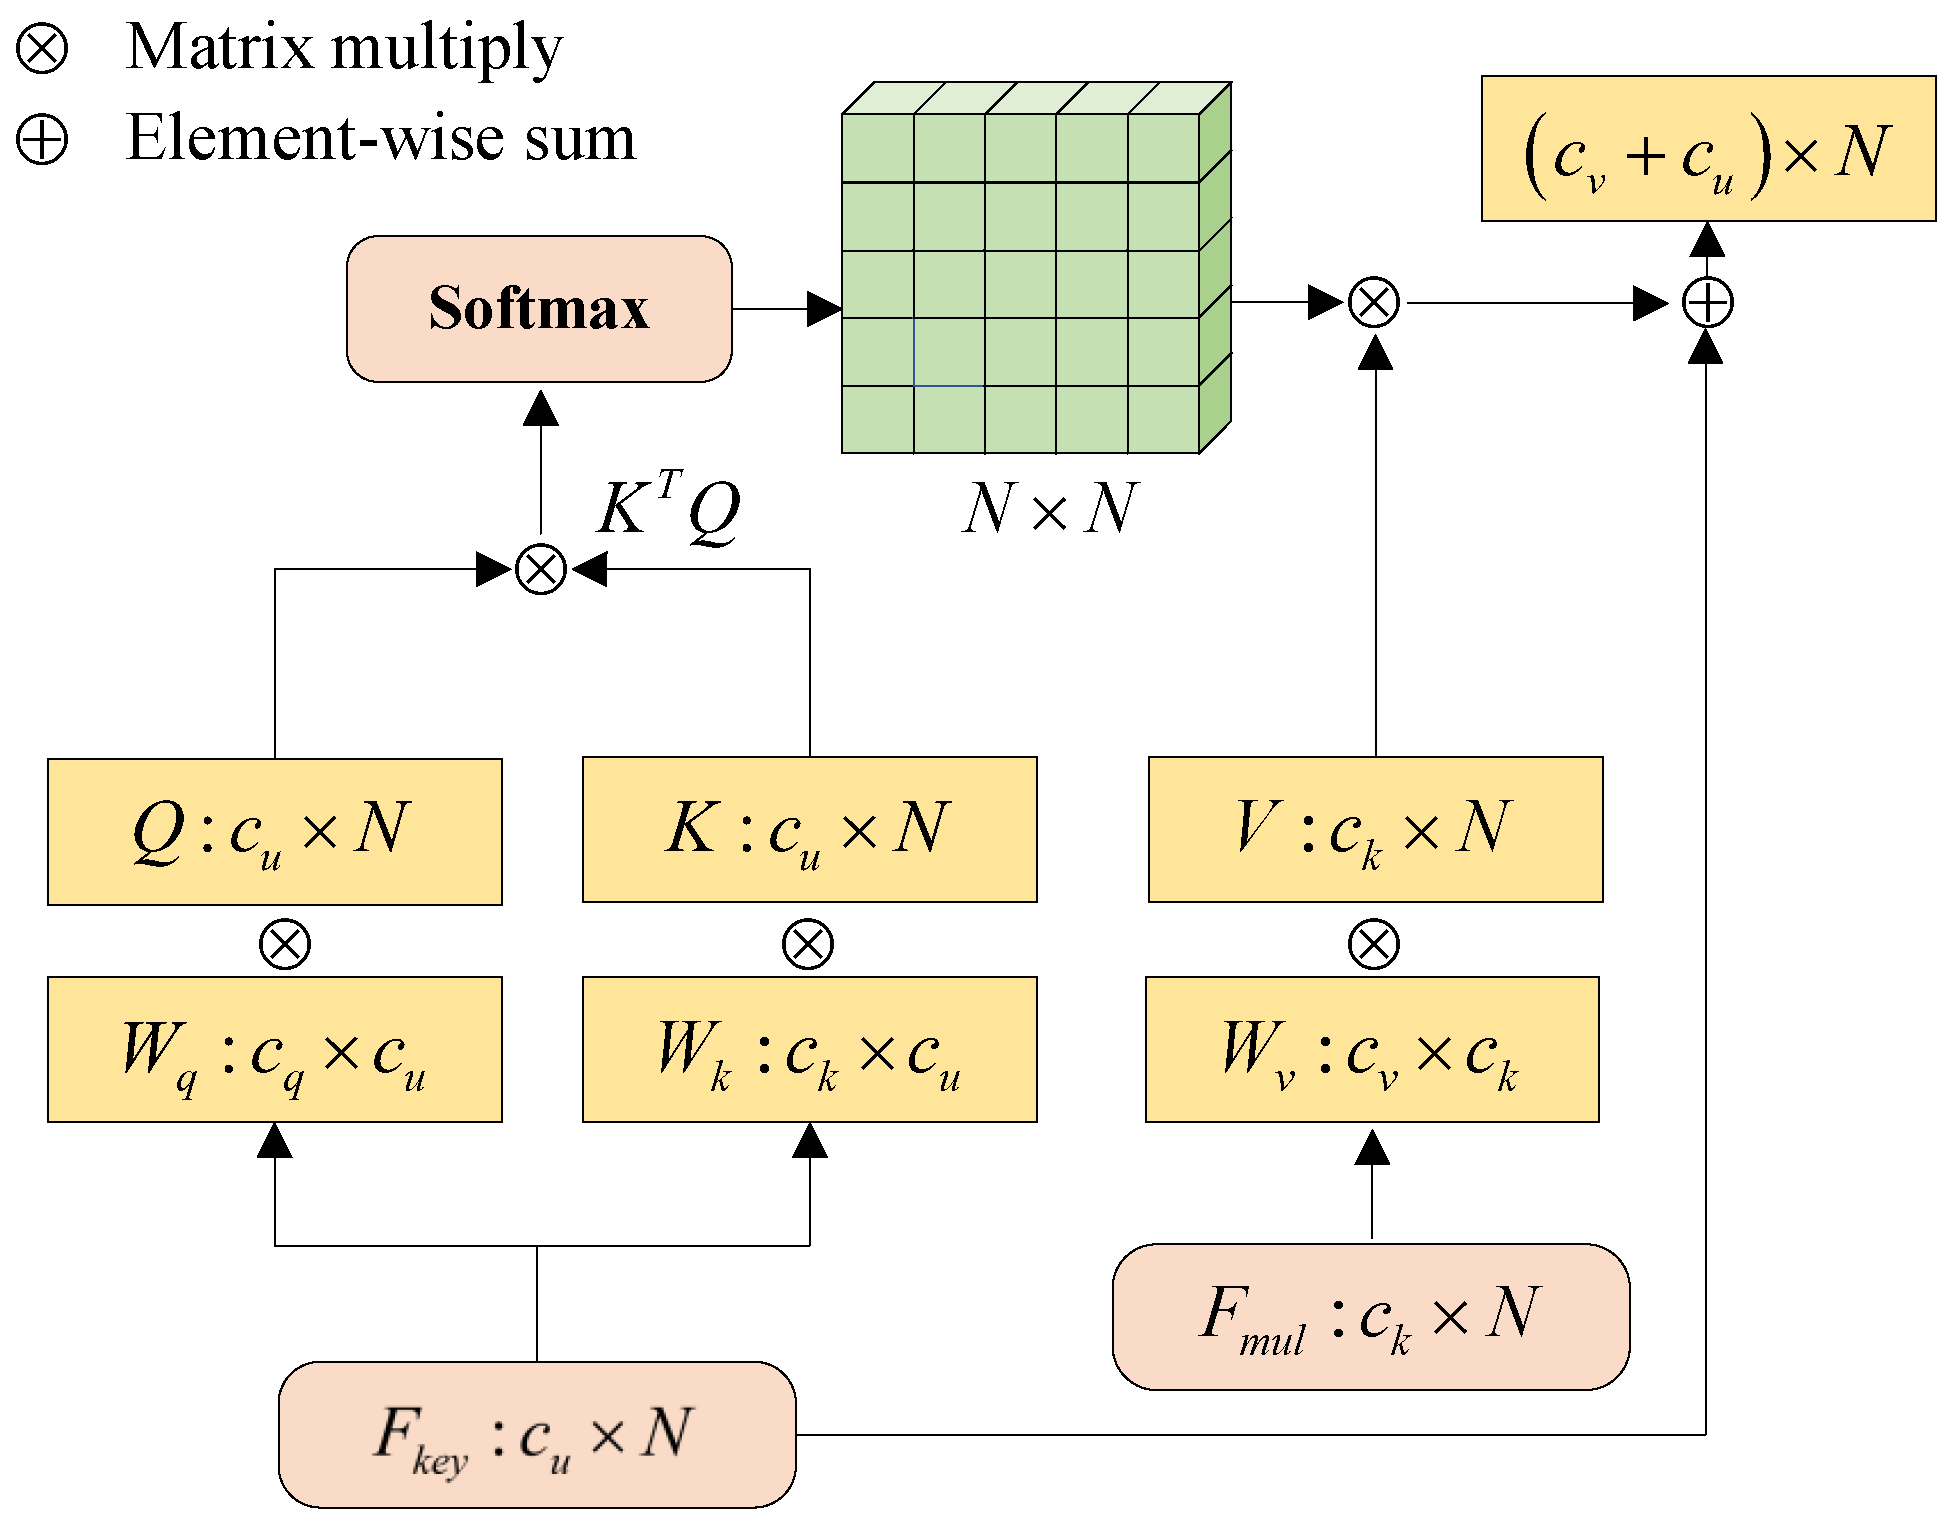
3.5.3. Transformer-Based Multi-Feature Aggregation

We aim to obtain a more accurate and comprehensive data representation by aggregating multi-feature information. The voxel features and BEV features are connected to obtain multi-scale aggregation features F m u l = concat F 1 , F 2 , F 3 , F 4 , F b e v , where the dimension of each class of feature is equal to C. Inspired by the linear combination of inputs using relevant weights in the attention mechanism [48,49], two input matrices F k e y and F m u l are interacted and weighted by correlation scores in the self-attention mechanism. The attention output layer is defined as
Attention ( Q , V , K ) = Softmax Q K T d i n V R l × d out
where Q = F k e y W q , K = F k e y W k and V = F m u l W v .
where the matrices Q, K, and V correspond to the query, key, and value, respectively, while W q , W k , and W v represent their respective linear projections. As illustrated in Figure 4, the multi-feature aggregation method incorporates fused feature maps that combine multi-scale voxel groups and semantic keypoint information, which are then processed through self-attention. The key distinction is that we compute the weight between the semantic keypoint feature F k e y using the query and key feature vector matrices. By applying a weighted sum, we efficiently fuse the resulting outputs, denoted as V R c v × N .

3.6. Loss Functions

Our approach can be trained in an end-to-end manner through the RPN and R-CNN stages, optimized using a multi-task loss function L , defined as follows:
L = L seg + L rpn + L rcnn
The segmentation loss L seg is calculated using binary cross-entropy to extract the semantic features of foreground points. Following the approach in [7], the RPN loss L rpn is composed of three components: object classification loss, box localization regression loss, and corner loss.
L rpn = α 1 L cls + α 2 L reg + α 3 L corner
where α 1 , α 2 , α 3 represent the weight coefficients of the above three sub-tasks. Smooth-L1 loss [15] is adopted for calculating L reg , the regression objective function is calculated by the relative offset between the anchor and the ground truth: x = x g t x a d a , y = y g t y a d a , z = z g t z a d a , Δ h = log h g t h a , Δ w = log w g t w a , θ = θ g t θ a , where d a = w a 2 + l a 2 . And the regression loss L reg can be defined as
L reg = b ( x , y , z , w , l , h , θ ) Smooth-L 1 ( b ) ,
and the classification loss L c l s can be expressed by the focal loss as follows:
L c l s = α 1 p a γ log p a ,
the hyperparameters α and γ require manual tuning, and p a represents the classification predictions. In this study, α is set to 0.25, while γ is set to 2. The corner loss L corner is calculated using sine-error loss [5] for angle regression. In the refinement stage, L r c n n is used as the loss for classification and localization. Its objective is to filter proposals using ground truth during the Region of Interest (ROI) process. This loss consists of three parts: the classification confidence loss L r c l s , location regression loss L r l o c , and box corner loss L r c o r n e r , and is defined as follows:
L r c n n = L r c l s + L r l o c + L r c o r n e r

4. Experiment

In this section, we assess the performance of SMA2 on the KITTI dataset for LiDAR-based 3D object detection through efficiency analysis and ablation studies.

4.1. Datasets and Evaluation Metric

KITTI Dataset: A widely recognized benchmark for 3D object detection. The LiDAR coordinate system range is restricted to [ 0 m ,   10 m ,   3 m ,   70.4 m ,   40 m ,   1 m ] 
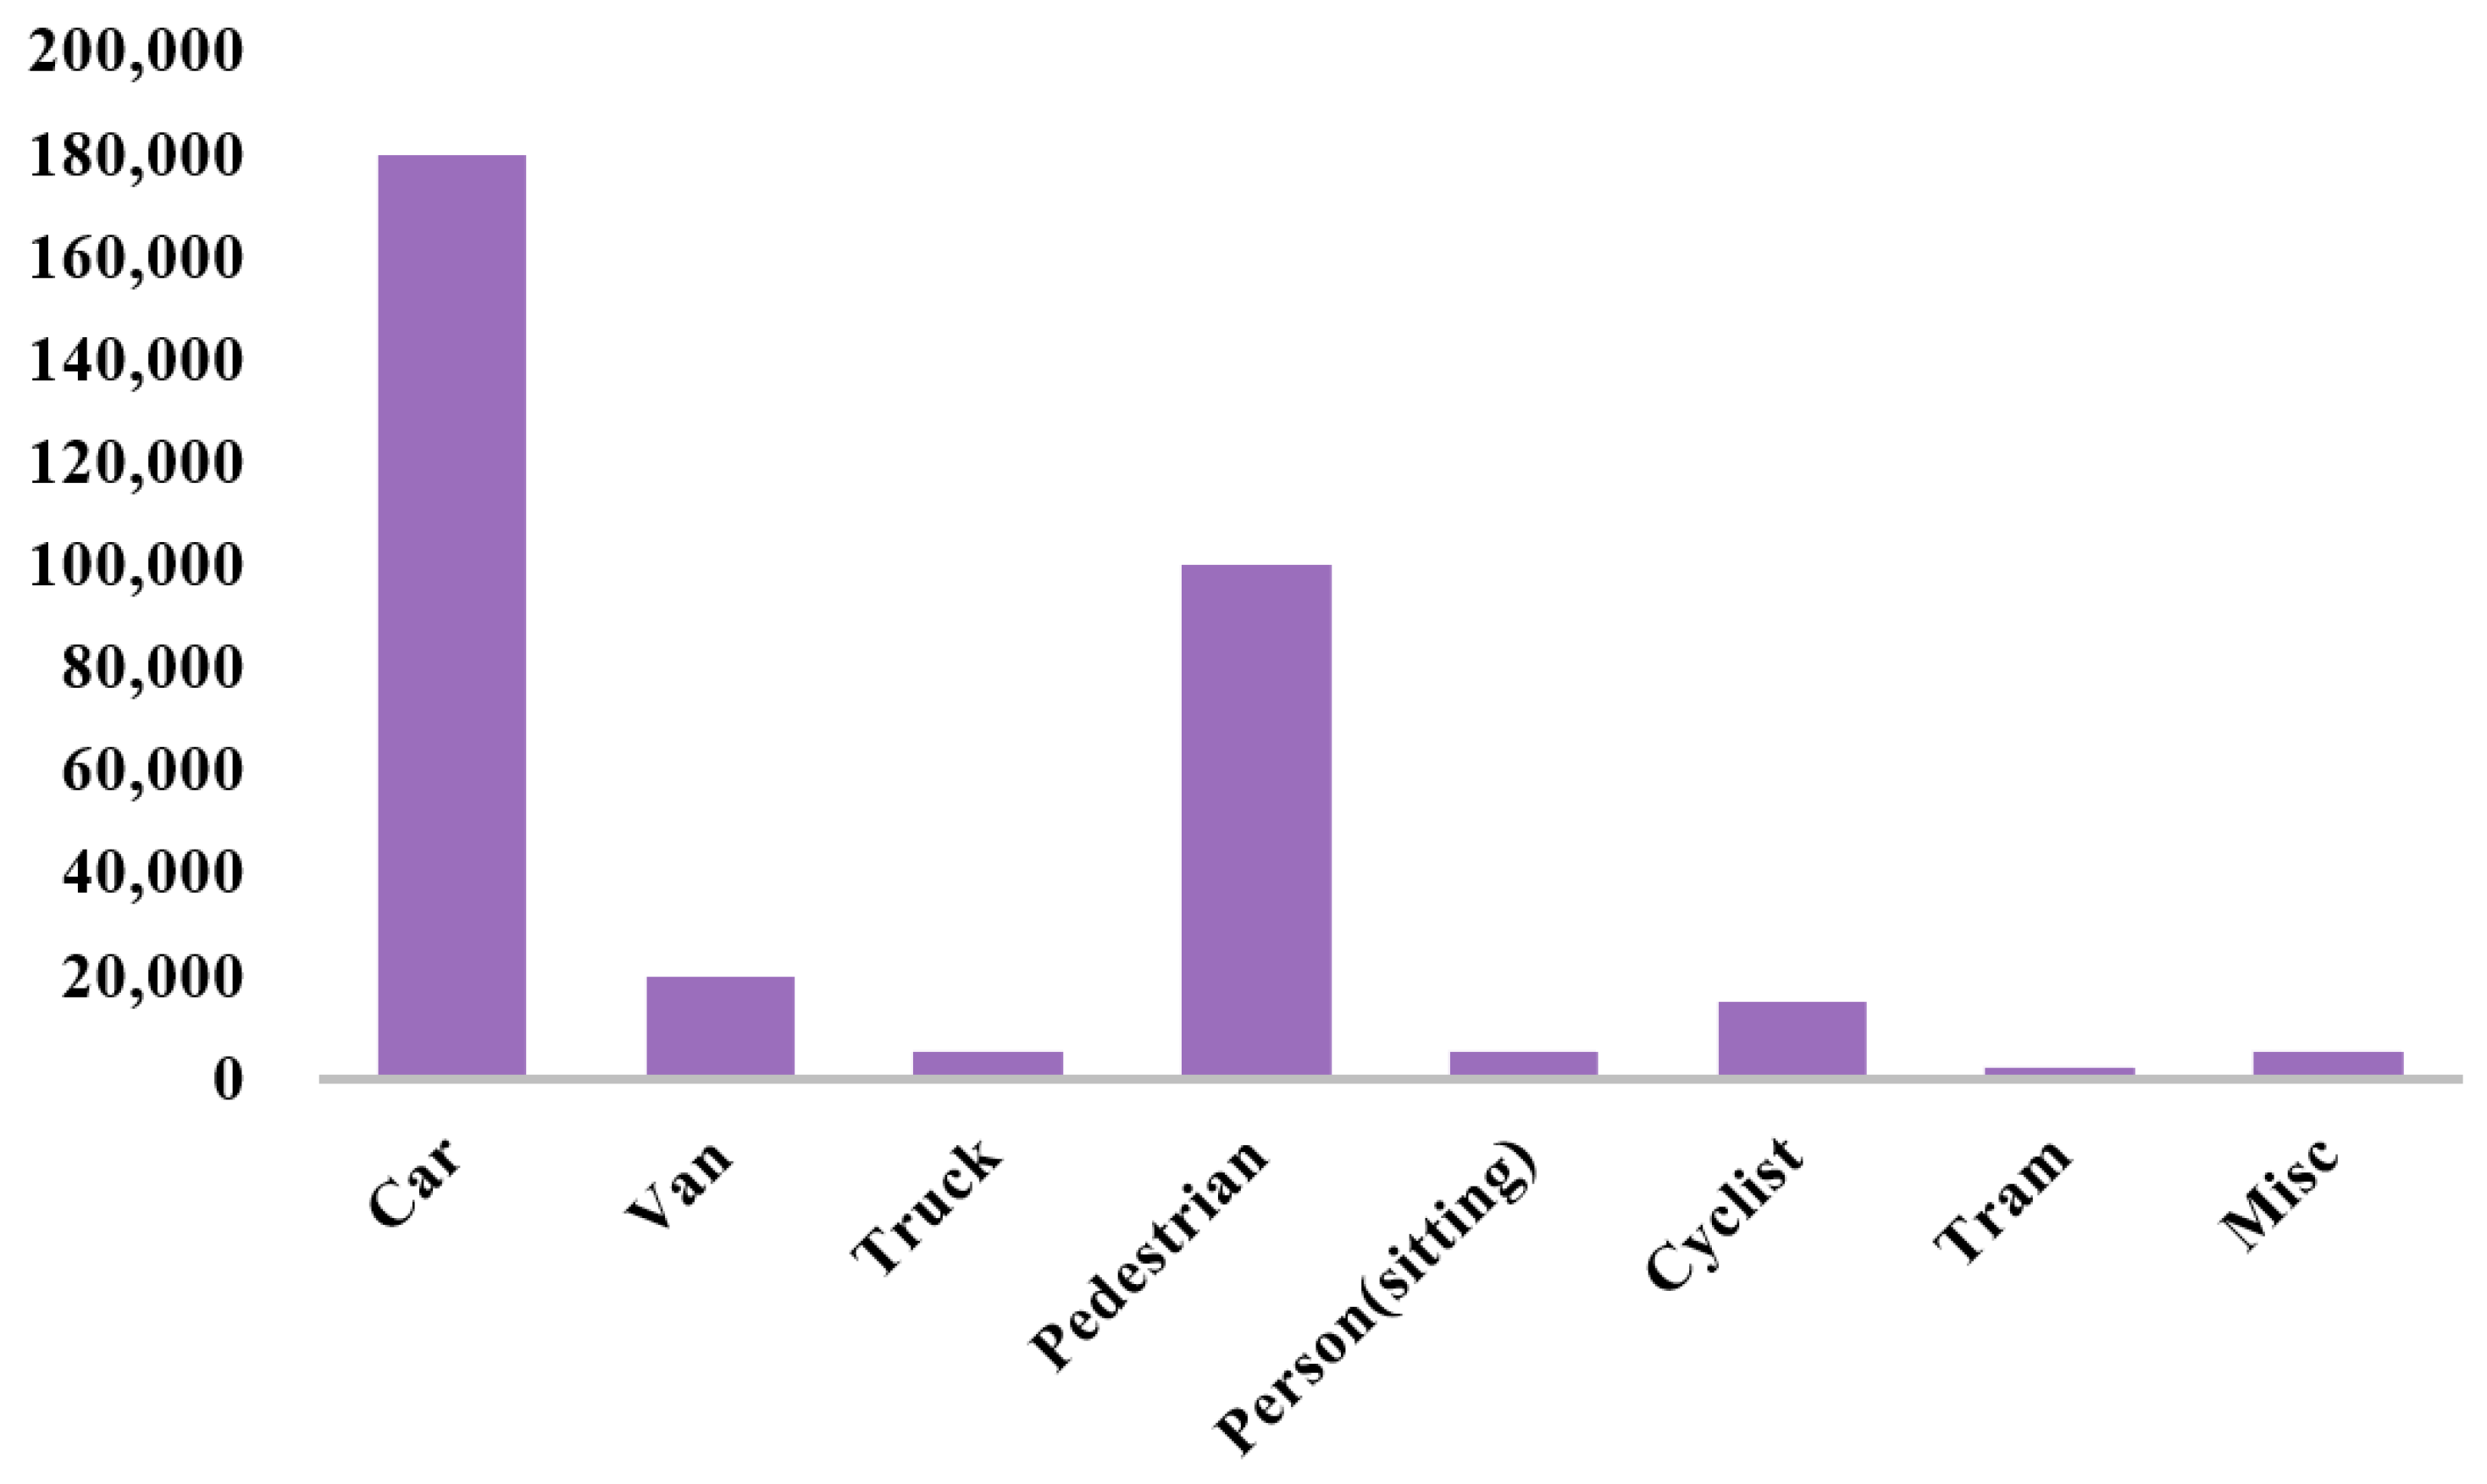
, according to common practice. The dataset contains 7481 training and 7518 testing LiDAR scans. The standard split is used, with 3712 samples for training and 3769 samples for validation. The purpose of such segmentation is to ensure that images of the same sequence are distributed as independently as possible in the training and validation sets. For each object category, the detection results are evaluated based on three standard regimes: easy, moderate, hard, defined according to the object size, occlusion state, and truncation level. As shown in Figure 5, these statistics show the distribution of different object categories in the dataset. The Car and Pedestrian categories contain a large number of samples, while Truck, Person (sitting), Tram, and Misc have relatively fewer instances. However, for comparison with mainstream methods, we only report results for the Car, Pedestrian, and Cyclist categories.
Waymo Dataset: The Waymo Open dataset is one of the most extensive and high-resolution datasets available for autonomous driving research, featuring a diverse set of sensor data and complex traffic scenarios. It consists of 798 training sequences (about 158k point cloud samples) and 202 validation sequences (approximately 40k point cloud samples), each with 360-degree field-of-view annotations. Performance evaluation is carried out using metrics like mean average precision (mAP) and mean average precision with heading angle (mAPH). Predictions are classified into two levels: LEVEL_1, which includes 3D labels with more than five LiDAR points, and LEVEL_2, which includes labels with at least one LiDAR point. The detection range spans [−75.2 m, 75.2 m] along the X and Y axes, and [−2 m, 4 m] along the Z axis. Raw point clouds are voxelized with a resolution of (0.1 m, 0.1 m, 0.15 m).
DAIR-V2X-V Dataset: The DAIR-V2X-V dataset is a pioneering large-scale, multi-modal resource designed for cooperative vehicle–road autonomous driving research. It features data gathered from real-world scenarios and includes both 2D and 3D annotations. The dataset contains 22,325 image frames and an equal number of point cloud frames, with 3D annotations for 15 common road obstacles. The dataset is split into training, validation, and testing sets in a 5:2:3 ratio, with evaluation performed on the validation set. Consistent with KITTI, the evaluation uses average bounding box perception. Vehicle classification is evaluated using intersection-over-union (IoU) thresholds set at [0.7, 0.5, 0.5] to account for varying difficulty levels in the evaluation process.

4.2. Implementation Details

In line with the standard practices adopted by recent works [5,6,14,26], evaluation on the validation set is conducted using 11 recall positions to compute average precision (AP), while the KITTI test benchmark utilizes 40 recall positions. As a result, 11-point AP is used for validation and 40-point AP for testing. For the final test benchmark submission, the complete KITTI training set is employed to train the SMA2 model. The performance is assessed using two key metrics: 3D average precision (3D AP) and bird’s-eye view average precision (BEV AP). The model is trained using the Adam optimizer [50] with a weight decay of 0.01 and a momentum of 0.9. The training process spans 70 epochs, starting with an initial learning rate of 0.003. Specifically, the learning rate is initialized at 0.01 and a step decay strategy is employed, reducing the learning rate by a factor of 0.1 at the 40th and 60th epochs. The batch size is set to eight for all experiments. To generate the final predictions during inference, the process begins by filtering the initial 3D proposals through a non-maximum suppression (NMS) step with an IoU threshold of 0.7, retaining the top-100 candidates. These selected proposals are subsequently refined via RoI Grid Pooling, which integrates detailed keypoint features to enhance spatial representation. After refinement, a second NMS with a stricter threshold of 0.1 is performed to remove duplicate detections and produce the final outputs. In the keypoint semantic enhancement module, the S-FPS module precedes the self-attention (SA) layers, where 16,384 points are sampled from the raw point cloud as input. The initialization stage includes a voxel-based submodule consisting of two 3 × 3 × 3 3D convolutional layers, both with a stride of 1 and a padding of 1.
In our training framework, we adopt Smooth-L1 loss for bounding box regression and focal loss for classification. These losses are applied to both the region proposal network (RPN) and the region-based CNN (RCNN) stages. Empirically, we observe that the RPN loss L rpn stabilizes rapidly during early training, effectively generating high-quality object proposals. This allows the RCNN loss L r c n n to focus on refining detection results with improved precision. The two losses interact in a complementary manner, and no conflicting gradients or training instability were observed. This stable convergence behavior confirms the compatibility and mutual reinforcement between the RPN and RCNN stages in our framework.

5. Results and Analysis

5.1. Comparison on the KITTI Test Set

Table 2 presents the performance of SMA2 on the KITTI test set, evaluated for 3D object detection across three categories: ‘Car’, ‘Pedestrian’, and ’Cyclist’. The detectors are categorized by their input modality: ‘L+C’ represents methods that utilize both LiDAR point clouds and 2D images, while ‘L’ refers to methods using only point clouds. The official KITTI evaluation protocol sets an IoU threshold of 0.7 for the ‘Car’ category and 0.5 for both ‘Pedestrian’ and ‘Cyclist’. Performance is reported at three difficulty levels: easy, moderate, and hard.
The experimental results show that SMA2 outperforms other two-stage detectors on the KITTI test set. Specifically, when compared to the baseline method, PV-RCNN [14], SMA2 achieves notable improvements in detection accuracy across all three difficulty levels. As shown in Table 2, SMA2 surpasses PV-RCNN by 0.41%, 0.37%, and 1.49% in the ‘Car’, ‘Pedestrian’, and ‘Cyclist’ categories, respectively. The improvements are particularly evident in the ‘Car’ and ‘Cyclist’ categories, suggesting that SMA2 is especially effective in detecting larger, more distinct objects. In contrast, the ‘Pedestrian’ category shows a slight performance decline. This can be attributed to the presence of unlabelled objects in the point cloud data—such as fire hydrants and utility poles—which share similar shapes to pedestrians, leading to occasional misclassifications.

5.2. Comparison on Waymo Validation Set

As shown in Table 3, SMA2 exhibits competitive performance across all categories on the KITTI benchmark. On the Car class, it achieves 76.64 mAP/76.41 mAPH at LEVEL_1 and 68.45/68.06 at LEVEL_2, showing a consistent improvement over strong baselines such as PV-RCNN++ and Pyramid-RCNN. Compared to voxel-based methods like Voxel R-CNN and CT3D, SMA2 maintains a slight advantage, which may be attributed to more effective multi-scale feature aggregation. In the Pedestrian category, SMA2 attains 74.27/66.13 at LEVEL_1, offering better handling of small and occluded instances, and outperforming methods such as Part-A2-Net and PV-RCNN. For Cyclists, it reaches 68.43/67.12 at LEVEL_1 and 65.75/64.21 at LEVEL_2, indicating stronger adaptability to sparse and elongated point distributions. These results suggest that SMA2 provides a balanced trade-off between accuracy and generalization across object categories with varying characteristics.

5.3. Comparison on DAIR-V2X-V Dataset

We further compare our method with the competitive approaches on the DAIR-V2X-V dataset. As shown in Table 4, the 3D object detection performance varies significantly across object categories and difficulty levels. For Vehicle3D detection, the proposed SMA2 model achieves the highest performance, with AP scores of 70.12% (easy), 57.39% (moderate), and 56.95% (hard). PV-RCNN also performs competitively, reaching 69.01% in the easy setting. In Pedestrian3D detection, PV-RCNN outperforms other methods with APs of 44.49% (easy), 39.20% (moderate), and 39.81% (hard). SMA2 also shows strong performance, achieving 45.23% AP in the easy setting. For Cyclist3D detection, PV-RCNN leads again with APs of 48.84% (Easy), 43.35% (moderate), and 40.34% (hard), while SMA2 delivers competitive results, including 45.23% in the easy mode. Overall, both PV-RCNN and SMA2 demonstrate robust and accurate performance across diverse categories and difficulty levels. These results highlight their effectiveness in complex scenes and their potential for reliable 3D perception in autonomous driving applications.

5.4. Ablation Studies

In this section, we analyze each component of SMA2 and present the results of the ablation study to demonstrate the effectiveness of our method. We simultaneously explore the impact of the proposed method on cars, cyclists, and pedestrians. All results for average precision across all 3D methods are calculated over 40 recall locations.

5.4.1. Effect of S-FPS

To assess the impact of the S-FPS module, it is initially incorporated into the Spconv–Unet framework. As illustrated in Table 5, the introduction of S-FPS leads to consistent performance enhancements across all object categories, with particularly marked gains for Pedestrian and Cyclist detection—improvements of 0.23%, 0.60%, and 1.64% for Car, Pedestrian, and Cyclist, respectively. This outcome suggests that S-FPS facilitates the selection of discriminative foreground points while suppressing background interference, which is especially beneficial for accurately detecting smaller objects. Further investigations into the influence of point sampling density are presented in Table 6. With an increasing number of sampled points, overall detection accuracy exhibits a rising trend. The optimal performance is observed at 2048 sampled points, where Pedestrian and Cyclist categories achieve 61.95% and 76.54%, respectively. However, extending the point count to 4096 results in a noticeable performance drop, particularly for smaller categories. This degradation likely stems from foreground oversampling, which introduces excessive and redundant information, ultimately impeding feature discrimination. These observations highlight that a careful balance between foreground richness and spatial sparsity is essential. The S-FPS strategy, when applied with 2048 samples, offers a favorable trade-off—retaining semantically meaningful points without introducing noise—thereby supporting robust detection of small-scale instances.
As shown in Table 7, S-FPS consistently outperforms FPS across three aspects: detection accuracy, computational complexity, and inference speed. Specifically, S-FPS improves detection performance by 1.8%, 1.95%, and 2.25% on the Car, Pedestrian, and Cyclist categories, respectively. Meanwhile, it reduces computational cost by 875 MFLOPs and shortens runtime from 143 ms to 21 ms. These results highlight S-FPS as a more accurate and efficient sampling strategy, particularly suitable for real-time applications.
Figure 6 presents a visualization comparing the impact of using 2048 versus 4096 keypoints on object detection. As shown, oversampling with 4096 keypoints results in a significant increase in false positives, especially for small objects. This explains the decline in performance for small object categories at higher sampling rates. The visualization confirms that a sampling rate of 2048 offers a better balance between detection accuracy and computational efficiency.

5.4.2. Effect of KAE

Building upon the S-FPS framework, the incorporation of the Keypoint Attention Enhancement (KAE) module yields notable performance gains, as reported in the third row of Table 5. Specifically, the model attains 3D AP scores of 58.56% for Pedestrian and 68.64% for Cyclist, indicating that the fusion of foreground-aware and semantic-guided sampling effectively facilitates the learning of more discriminative keypoint representations. Across various difficulty levels, average gains of 0.81%, 1.09%, and 0.4% are observed, underscoring the robustness of this integration. To further evaluate the contribution of the attention mechanism, KAE is benchmarked against two alternative aggregation strategies—bilinear interpolation and vector-based pooling. As shown in Table 8, the proposed multi-level feature attention aggregation (MFAA) module consistently delivers superior results, with improvements of 2.0%, 0.3%, and 0.9% on the moderate setting for the Car, Pedestrian, and Cyclist categories, respectively. The Car class, in particular, demonstrates the most pronounced benefit. In addition, we observe that the improvement of KAE over vector-pooling is less pronounced for the pedestrian class. This may be attributed to two factors: (1) The small size and morphological variability of pedestrian instances, which pose challenges for feature representation and alignment; and (2) Label noise in the KITTI dataset, which primarily affects smaller objects like pedestrians and may reduce the effectiveness of kernel-based attention mechanisms.

5.4.3. Effect of MFAA

To evaluate the effectiveness of our MFAA, we perform a comparative analysis of two fusion methods on the KITTI validation dataset. As shown in Table 9, MFAA outperforms the concatenation method (Concat) of features from keypoints, voxels, and BEV, achieving improvements of 2.60%, 1.44%, and 3.32%, respectively. Notably, MFAA demonstrates significant gains, particularly in detecting cyclists. In ablation studies, MFAA enhances performance by 2.43%, 3.6%, and 1.9% on the hard difficulty level across three categories (Table 5). Additionally, the use of keypoints extracted via KAE improves performance in the pedestrian category. These results highlight the effectiveness of MFAA in fusion-based methods.

5.4.4. Effect of Keypoint Query

With the aggregation approach of transformer based on keypoint query, it is worth exploring the importance of keypoint in the query method; we have analyzed the validation experiments for voxel query and keypoint query. From Table 10, it can be seen that the two query approaches show great differences: the keypoint query approach is better in performance compared to the voxel query, from the analysis of the results. It is concluded that the keypoint query strategy itself comes with enhanced semantic information; however, the voxel-based query approach shows a performance degradation due to the fact that the voxel loses a lot of structural information during downsampling and exhibits sparsity in the BEV feature.

6. Inference Analysis

Table 11 summarizes the inference efficiency and detection performance of SMA2 across three benchmark datasets. The model is trained for 70 epochs on KITTI, 60 epochs on 10% of the Waymo training split, and 60 epochs on DAIR-V2X-V. All experiments are conducted using an Intel i7-7820X CPU and a single GTX 1080Ti GPU with a batch size of 1. For consistency, the number of proposals generated by the region proposal network (RPN) is fixed: K = 90 for KITTI and DAIR-V2X-V, and K = 275 for Waymo.
Compared to PV-RCNN, SMA2 achieves faster inference, reducing runtime by 18.1%, 15.5%, and 12.7% on KITTI, Waymo, and DAIR-V2X-V, respectively. In addition, it delivers improved detection accuracy, achieving gains of +2.43% AP on KITTI, +3.55% mAPH on Waymo, and +0.76% Car 3D AP on DAIR-V2X-V.
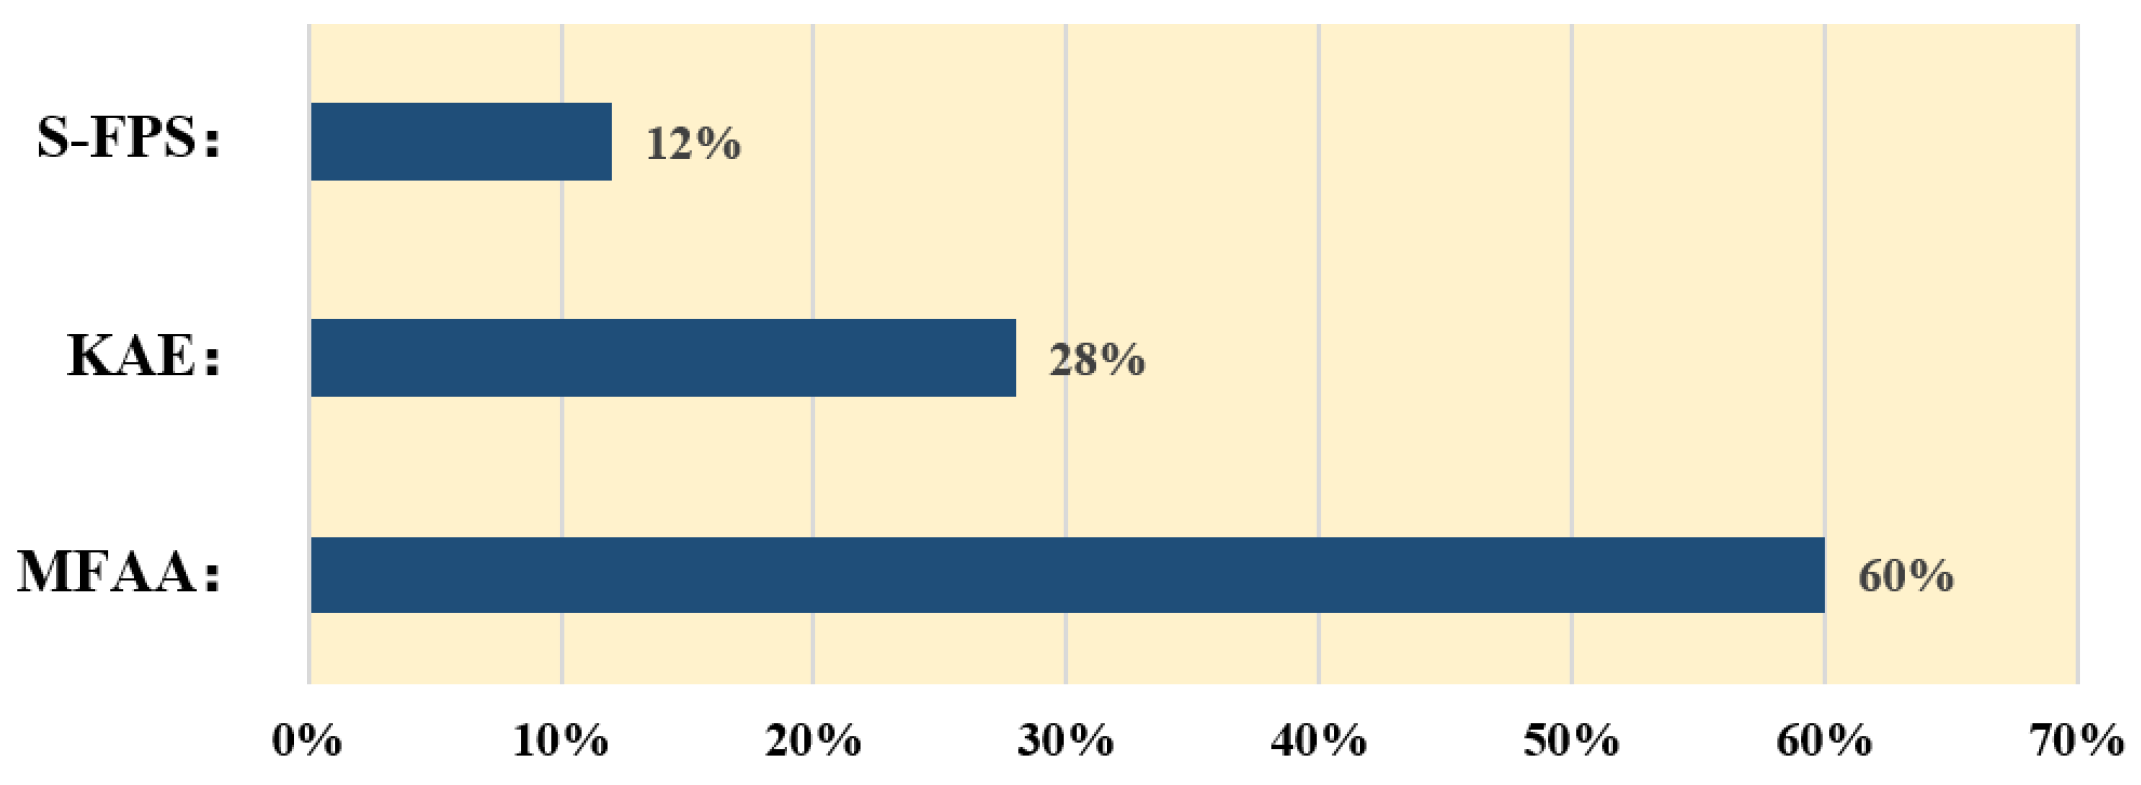
We analyze the runtime overhead of the proposed keypoint-based querying pipeline. As illustrated in Figure 7, MFAA accounts for approximately 60% of the runtime, followed by KAE (28%) and S-FPS (12%). Despite the additional computation introduced by MFAA, the overall increase in runtime is marginal (∼6.7%), which we consider a favorable trade-off for the observed ∼5% AP gain.

7. Visualization and Analysis

Figure 8 shows the qualitative results on the KITTI dataset, highlighting SMA2’s consistent performance in complex environments, with precise object localization. As shown in Table 2, our method achieves higher average precision for cars and cyclists, highlighting its effectiveness. However, for small-scale objects such as pedestrians, the performance is less satisfactory. Some unlabeled instances and cyclist targets are incorrectly detected as pedestrians, indicating a gap compared to several leading methods. One contributing factor is the limited number of semantic keypoints extracted for pedestrian instances. To address this limitation, future work will explore the integration of keypoint semantics with morphological cues to better handle small-object detection.

8. Conclusions and Discussion

In this paper, we present SMA2, a unified framework that fuses keypoint, bird’s-eye view (BEV), and sparse voxel features for enhanced 3D object detection. To begin with, we design a Keypoint Attention Enhancement module that extracts discriminative local keypoints from foreground points by applying semantic-guided sampling and self-attention to segmented foreground features. Then, to capture the interactions between keypoints and non-empty voxels, we propose a multi-feature attention aggregation module that performs keypoint-guided feature fusion across multiple representations. Experimental results on the KITTI dataset show that SMA2 achieves superior performance over existing two-stage detectors. Moreover, it exhibits strong robustness and generalization on the Waymo and DAIR-V2X-V validation sets.
While our method demonstrates strong performance overall, it still struggles with highly occluded pedestrian instances. In future work, we plan to incorporate morphological features, such as human shape priors and skeleton-based keypoints, to enhance the model awareness of structural cues and reduce false positives in complex scenes. Meanwhile, we will explore different representations and fusion methods of point clouds in multi-modal scenes.
Beyond current benchmarks, the proposed SMA2 model can be extended to a wide range of 3D perception tasks. In autonomous driving, it enables the accurate and real-time detection of vehicles, pedestrians, and cyclists. In robotics, it supports fine-grained scene understanding to facilitate safe navigation. In augmented reality (AR) or digital twin systems, SMA2 can contribute to precise environment reconstruction and interactive understanding.
To comprehensively assess the robustness of the method, it is important to consider the impact of varying LiDAR sensors and scanning conditions. Differences in LiDAR sensor configurations, scanning density, and point cloud acquisition conditions can significantly affect detection performance in real-world scenarios. Therefore, incorporating data from different LiDAR setups and evaluating how these variations influence model performance, particularly in spatial information integration during classification decisions, will be essential for improving the method’s applicability in diverse environments.
Furthermore, integrating contextual information, such as semantic context or point cloud density, using Graph Convolution Networks (GCNs) or attention-based mechanisms, could enhance the model’s ability to capture local features and improve classification stability. This is especially important for small object detection. Leveraging these additional features aims to improve detection accuracy, particularly in complex scenarios involving small targets, such as pedestrians or cyclists. These future directions will be further explored in ongoing research.

Author Contributions

Methodology, J.Z.; Validation, Z.H.; Investigation, Z.Z.; Project administration, H.H.; Funding acquisition, Y.L. All authors have read and agreed to the published version of the manuscript.

Funding

This research was funded by Natural Science Foundation of Guangdong Province grant number 2015A030312010.

Data Availability Statement

Data are contained within the article.

Conflicts of Interest

The authors declare no conflicts of interest.

References

  1. Geiger, A.; Lenz, P.; Urtasun, R. Are we ready for autonomous driving? The kitti vision benchmark suite. In Proceedings of the 2012 IEEE Conference on Computer Vision and Pattern Recognition, Providence, RI, USA, 16–21 June 2012; pp. 3354–3361. [Google Scholar]
  2. Song, Z.; Liu, L.; Jia, F.; Luo, Y.; Jia, C.; Zhang, G.; Yang, L.; Wang, L. Robustness-aware 3d object detection in autonomous driving: A review and outlook. IEEE Trans. Intell. Transp. Syst. 2024, 25, 15407–15436. [Google Scholar] [CrossRef]
  3. Zhang, L.; Li, C. PPF-Net: Efficient Multimodal 3D Object Detection with Pillar-Point Fusion. Electronics 2025, 14, 685. [Google Scholar] [CrossRef]
  4. Zhou, Y.; Tuzel, O. Voxelnet: End-to-end learning for point cloud based 3d object detection. In Proceedings of the IEEE Conference on Computer Vision and Pattern Recognition, Salt Lake City, UT, USA, 18–22 June 2018; pp. 4490–4499. [Google Scholar]
  5. Yan, Y.; Mao, Y.; Li, B. Second: Sparsely embedded convolutional detection. Sensors 2018, 18, 3337. [Google Scholar] [CrossRef] [PubMed]
  6. Lang, A.H.; Vora, S.; Caesar, H.; Zhou, L.; Yang, J.; Beijbom, O. Pointpillars: Fast encoders for object detection from point clouds. In Proceedings of the IEEE/CVF Conference on Computer Vision and Pattern Recognition, Long Beach, CA, USA, 15–20 June 2019; pp. 12697–12705. [Google Scholar]
  7. Shi, S.; Wang, Z.; Shi, J.; Wang, X.; Li, H. From points to parts: 3d object detection from point cloud with part-aware and part-aggregation network. IEEE Trans. Pattern Anal. Mach. Intell. 2020, 43, 2647–2664. [Google Scholar] [CrossRef]
  8. Jain, W.H.; Jhong, B.G.; Chen, M.Y. A Social Assistance System for Augmented Reality Technology to Redound Face Blindness with 3D Face Recognition. Electronics 2025, 14, 1244. [Google Scholar] [CrossRef]
  9. Deng, J.; Shi, S.; Li, P.; Zhou, W.; Zhang, Y.; Li, H. Voxel r-cnn: Towards high performance voxel-based 3d object detection. AAAI Conf. Artif. Intell. 2021, 35, 1201–1209. [Google Scholar] [CrossRef]
  10. Kuang, H.; Wang, B.; An, J.; Zhang, M.; Zhang, Z. Voxel-FPN: Multi-scale voxel feature aggregation for 3D object detection from LIDAR point clouds. Sensors 2020, 20, 704. [Google Scholar] [CrossRef]
  11. Qi, C.R.; Su, H.; Mo, K.; Guibas, L.J. Pointnet: Deep learning on point sets for 3d classification and segmentation. In Proceedings of the IEEE Conference on Computer Vision and Pattern Recognition, Honolulu, HI, USA, 21–26 July 2017; pp. 652–660. [Google Scholar]
  12. Qi, C.R.; Yi, L.; Su, H.; Guibas, L.J. Pointnet++: Deep hierarchical feature learning on point sets in a metric space. Adv. Neural Inf. Process. Syst. 2017, 30. [Google Scholar] [CrossRef]
  13. Qi, C.R.; Liu, W.; Wu, C.; Su, H.; Guibas, L.J. Frustum pointnets for 3d object detection from rgb-d data. In Proceedings of the IEEE Conference on Computer Vision and Pattern Recognition, Salt Lake City, UT, USA, 18–22 June 2018; pp. 918–927. [Google Scholar]
  14. Shi, S.; Guo, C.; Jiang, L.; Wang, Z.; Shi, J.; Wang, X.; Li, H. Pv-rcnn: Point-voxel feature set abstraction for 3d object detection. In Proceedings of the IEEE/CVF Conference on Computer Vision and Pattern Recognition, Seattle, WA, USA, 14–19 June 2020; pp. 10529–10538. [Google Scholar]
  15. Shi, S.; Jiang, L.; Deng, J.; Wang, Z.; Guo, C.; Shi, J.; Wang, X.; Li, H. PV-RCNN++: Point-voxel feature set abstraction with local vector representation for 3D object detection. Int. J. Comput. Vis. 2023, 131, 531–551. [Google Scholar] [CrossRef]
  16. Yang, Z.; Sun, Y.; Liu, S.; Jia, J. 3dssd: Point-based 3d single stage object detector. In Proceedings of the IEEE/CVF Conference on Computer Vision and Pattern Recognition, Seattle, WA, USA, 14–19 June 2020; pp. 11040–11048. [Google Scholar]
  17. Wu, P.; Gu, L.; Yan, X.; Xie, H.; Wang, F.L.; Cheng, G.; Wei, M. PV-RCNN++: Semantical point-voxel feature interaction for 3D object detection. Vis. Comput. 2023, 39, 2425–2440. [Google Scholar] [CrossRef]
  18. Chen, C.; Chen, Z.; Zhang, J.; Tao, D. Sasa: Semantics-augmented set abstraction for point-based 3d object detection. AAAI Conf. Artif. Intell. 2022, 36, 221–229. [Google Scholar] [CrossRef]
  19. Wang, Y.; Sun, Y.; Liu, Z.; Sarma, S.E.; Bronstein, M.M.; Solomon, J.M. Dynamic graph cnn for learning on point clouds. ACM Trans. Graph. 2019, 38, 1–12. [Google Scholar] [CrossRef]
  20. Shi, S.; Wang, X.; Li, H. Pointrcnn: 3d object proposal generation and detection from point cloud. In Proceedings of the IEEE/CVF Conference on Computer Vision and Pattern Recognition, Long Beach, CA, USA, 15–20 June 2019; pp. 770–779. [Google Scholar]
  21. Lan, S.; Yu, R.; Yu, G.; Davis, L.S. Modeling local geometric structure of 3d point clouds using geo-cnn. In Proceedings of the IEEE/CVF Conference on Computer Vision and Pattern Recognition, Long Beach, CA, USA, 15–20 June 2019; pp. 998–1008. [Google Scholar]
  22. Xie, Z.; Chen, J.; Peng, B. Point clouds learning with attention-based graph convolution networks. Neurocomputing 2020, 402, 245–255. [Google Scholar] [CrossRef]
  23. Vaswani, A.; Shazeer, N.; Parmar, N.; Uszkoreit, J.; Jones, L.; Gomez, A.N.; Kaiser, Ł.; Polosukhin, I. Attention is all you need. Adv. Neural Inf. Process. Syst. 2017, 30. [Google Scholar] [CrossRef]
  24. Zhu, G.; Zhou, Y.; Yao, R.; Zhu, H.; Zhao, J. Cyclic self-attention for point cloud recognition. ACM Trans. Multimed. Comput. Commun. Appl. 2023, 19, 1–19. [Google Scholar] [CrossRef]
  25. Zhang, Y.; Hu, Q.; Xu, G.; Ma, Y.; Wan, J.; Guo, Y. Not all points are equal: Learning highly efficient point-based detectors for 3d lidar point clouds. In Proceedings of the IEEE/CVF Conference on Computer Vision and Pattern Recognition, New Orleans, LA, USA, 18–24 June 2022; pp. 18953–18962. [Google Scholar]
  26. Yang, Z.; Sun, Y.; Liu, S.; Shen, X.; Jia, J. STD: Sparse-to-Dense 3D Object Detector for Point Cloud. In Proceedings of the 2019 IEEE/CVF International Conference on Computer Vision (ICCV), Long Beach, CA, USA, 15–20 June 2019; pp. 1951–1960. [Google Scholar] [CrossRef]
  27. Shi, W.; Rajkumar, R. Point-gnn: Graph neural network for 3d object detection in a point cloud. In Proceedings of the IEEE/CVF Conference on Computer Vision and Pattern Recognition, Seattle, WA, USA, 14–19 June 2020; pp. 1711–1719. [Google Scholar]
  28. Ye, M.; Xu, S.; Cao, T. Hvnet: Hybrid voxel network for lidar based 3d object detection. In Proceedings of the IEEE/CVF Conference on Computer Vision and Pattern Recognition, Seattle, WA, USA, 14–19 June 2020; pp. 1631–1640. [Google Scholar]
  29. Zheng, W.; Tang, W.; Chen, S.; Jiang, L.; Fu, C.W. Cia-ssd: Confident iou-aware single-stage object detector from point cloud. AAAI Conf. Artif. Intell. 2021, 35, 3555–3562. [Google Scholar] [CrossRef]
  30. Mao, J.; Xue, Y.; Niu, M.; Bai, H.; Feng, J.; Liang, X.; Xu, H.; Xu, C. Voxel transformer for 3d object detection. In Proceedings of the IEEE/CVF International Conference on Computer Vision, Montreal, BC, Canada, 10–17 October 2021; pp. 3164–3173. [Google Scholar]
  31. He, C.; Zeng, H.; Huang, J.; Hua, X.S.; Zhang, L. Structure aware single-stage 3d object detection from point cloud. In Proceedings of the IEEE/CVF Conference on Computer Vision and Pattern Recognition, Seattle, WA, USA, 14–19 June 2020; pp. 11873–11882. [Google Scholar]
  32. Sheng, H.; Cai, S.; Liu, Y.; Deng, B.; Huang, J.; Hua, X.S.; Zhao, M.J. Improving 3d object detection with channel-wise transformer. In Proceedings of the IEEE/CVF International Conference on Computer Vision, Montreal, BC, Canada, 10–17 October 2021; pp. 2743–2752. [Google Scholar]
  33. Mao, J.; Niu, M.; Bai, H.; Liang, X.; Xu, H.; Xu, C. Pyramid r-cnn: Towards better performance and adaptability for 3d object detection. In Proceedings of the IEEE/CVF International Conference on Computer Vision, Montreal, BC, Canada, 10–17 October 2021; pp. 2723–2732. [Google Scholar]
  34. Song, Z.; Jia, C.; Yang, L.; Wei, H.; Liu, L. GraphAlign++: An accurate feature alignment by graph matching for multi-modal 3D object detection. IEEE Trans. Circuits Syst. Video Technol. 2023, 34, 2619–2632. [Google Scholar] [CrossRef]
  35. Song, Z.; Zhang, G.; Liu, L.; Yang, L.; Xu, S.; Jia, C.; Jia, F.; Wang, L. Robofusion: Towards robust multi-modal 3d obiect detection via sam. arXiv 2024, arXiv:2401.03907. [Google Scholar]
  36. Bi, J.; Wei, H.; Zhang, G.; Yang, K.; Song, Z. Dyfusion: Cross-attention 3d object detection with dynamic fusion. IEEE Lat. Am. Trans. 2024, 22, 106–112. [Google Scholar] [CrossRef]
  37. Gong, G.; Wang, X.; Zhang, J.; Shang, X.; Pan, Z.; Li, Z.; Zhang, J. MSFF: A Multi-Scale Feature Fusion Convolutional Neural Network for Hyperspectral Image Classification. Electronics 2025, 14, 797. [Google Scholar] [CrossRef]
  38. Han, L.; Song, B.; Wu, S.; Nie, D.; Chen, Z.; Wang, L. Semantic Segmentation of Distribution Network Point Clouds Based on NF-PTV2. Electronics 2025, 14, 812. [Google Scholar] [CrossRef]
  39. Pan, X.; Xia, Z.; Song, S.; Li, L.E.; Huang, G. 3d object detection with pointformer. In Proceedings of the IEEE/CVF Conference on Computer Vision and Pattern Recognition, Nashville, TN, USA, 20–25 June 2021; pp. 7463–7472. [Google Scholar]
  40. Guo, M.H.; Cai, J.X.; Liu, Z.N.; Mu, T.J.; Martin, R.R.; Hu, S.M. Pct: Point cloud transformer. Comput. Vis. Media 2021, 7, 187–199. [Google Scholar] [CrossRef]
  41. Guan, T.; Wang, J.; Lan, S.; Chandra, R.; Wu, Z.; Davis, L.; Manocha, D. M3detr: Multi-representation, multi-scale, mutual-relation 3d object detection with transformers. In Proceedings of the IEEE/CVF Winter Conference on Applications of Computer Vision, Waikoloa, HI, USA, 3–8 January 2022; pp. 772–782. [Google Scholar]
  42. Fan, L.; Pang, Z.; Zhang, T.; Wang, Y.X.; Zhao, H.; Wang, F.; Wang, N.; Zhang, Z. Embracing single stride 3d object detector with sparse transformer. In Proceedings of the IEEE/CVF conference on computer vision and pattern recognition, New Orleans, LA, USA, 18–24 June 2022; pp. 8458–8468. [Google Scholar]
  43. Wang, L.; Song, Z.; Zhang, X.; Wang, C.; Zhang, G.; Zhu, L.; Li, J.; Liu, H. SAT-GCN: Self-attention graph convolutional network-based 3D object detection for autonomous driving. Knowl.-Based Syst. 2023, 259, 110080. [Google Scholar] [CrossRef]
  44. Lin, T.Y.; Goyal, P.; Girshick, R.; He, K.; Dollár, P. Focal loss for dense object detection. In Proceedings of the IEEE International Conference on Computer Vision, Venice, Italy, 22–29 October 2017; pp. 2980–2988. [Google Scholar]
  45. Yang, J.; Zhang, Q.; Ni, B.; Li, L.; Liu, J.; Zhou, M.; Tian, Q. Modeling point clouds with self-attention and gumbel subset sampling. In Proceedings of the IEEE/CVF Conference on Computer Vision and Pattern Recognition, Long Beach, CA, USA, 15–20 June 2019; pp. 3323–3332. [Google Scholar]
  46. Chen, Y.; Liu, J.; Qi, X.; Zhang, X.; Sun, J.; Jia, J. Scaling up kernels in 3d cnns. arXiv 2022, arXiv:2206.10555. [Google Scholar]
  47. Lai, X.; Chen, Y.; Lu, F.; Liu, J.; Jia, J. Spherical transformer for lidar-based 3d recognition. In Proceedings of the IEEE/CVF Conference on Computer Vision and Pattern Recognition, Vancouver, BC, Canada, 17–24 June 2023; pp. 17545–17555. [Google Scholar]
  48. Yan, Y.; Ni, B.; Yang, X. Fine-grained recognition via attribute-guided attentive feature aggregation. In Proceedings of the 25th ACM international conference on Multimedia, Mountain View, CA, USA, 23–27 October 2017; pp. 1032–1040. [Google Scholar]
  49. Lee, J.; Lee, Y.; Kim, J.; Kosiorek, A.; Choi, S.; Teh, Y.W. Set transformer: A framework for attention-based permutation-invariant neural networks. In Proceedings of the International Conference on Machine Learning, PMLR, Long Beach, CA, USA, 9–15 June 2019; pp. 3744–3753. [Google Scholar]
  50. Kingma, D.P.; Ba, J. Adam: A method for stochastic optimization. arXiv 2014, arXiv:1412.6980. [Google Scholar]
  51. Vora, S.; Lang, A.H.; Helou, B.; Beijbom, O. Pointpainting: Sequential fusion for 3d object detection. In Proceedings of the IEEE/CVF Conference on Computer Vision and Pattern Recognition, Seattle, WA, USA, 14–19 June 2020; pp. 4604–4612. [Google Scholar]
  52. Yoo, J.H.; Kim, Y.; Kim, J.; Choi, J.W. 3d-cvf: Generating joint camera and lidar features using cross-view spatial feature fusion for 3d object detection. In Proceedings of the Computer Vision–ECCV 2020: 16th European Conference, Glasgow, UK, 23–28 August 2020; Proceedings, Part XXVII 16. Springer: Cham, Switzerland, 2020; pp. 720–736. [Google Scholar]
  53. Noh, J.; Lee, S.; Ham, B. Hvpr: Hybrid voxel-point representation for single-stage 3d object detection. In Proceedings of the IEEE/CVF Conference on Computer Vision and Pattern Recognition, Nashville, TN, USA, 20–25 June 2021; pp. 14605–14614. [Google Scholar]
  54. Xie, T.; Wang, L.; Wang, K.; Li, R.; Zhang, X.; Zhang, H.; Yang, L.; Liu, H.; Li, J. FARP-Net: Local-global feature aggregation and relation-aware proposals for 3D object detection. IEEE Trans. Multimed. 2023, 26, 1027–1040. [Google Scholar] [CrossRef]
  55. Yang, H.; Wang, W.; Chen, M.; Lin, B.; He, T.; Chen, H.; He, X.; Ouyang, W. Pvt-ssd: Single-stage 3d object detector with point-voxel transformer. In Proceedings of the IEEE/CVF Conference on Computer Vision and Pattern Recognition, Vancouver, BC, Canada, 17–24 June 2023; pp. 13476–13487. [Google Scholar]
  56. Wang, C.H.; Chen, H.W.; Chen, Y.; Hsiao, P.Y.; Fu, L.C. VoPiFNet: Voxel-Pixel Fusion Network for Multi-Class 3D Object Detection. IEEE Trans. Intell. Transp. Syst. 2024, 25, 8527–8537. [Google Scholar] [CrossRef]
  57. Zhou, Y.; Sun, P.; Zhang, Y.; Anguelov, D.; Gao, J.; Ouyang, T.; Guo, J.; Ngiam, J.; Vasudevan, V. End-to-end multi-view fusion for 3d object detection in lidar point clouds. In Proceedings of the Conference on Robot Learning, PMLR, Virtual, 16–18 November 2020; pp. 923–932. [Google Scholar]
  58. Ge, R.; Ding, Z.; Hu, Y.; Wang, Y.; Chen, S.; Huang, L.; Li, Y. Afdet: Anchor free one stage 3d object detection. arXiv 2020, arXiv:2006.12671. [Google Scholar]
  59. Wang, Y.; Fathi, A.; Kundu, A.; Ross, D.A.; Pantofaru, C.; Funkhouser, T.; Solomon, J. Pillar-based object detection for autonomous driving. In European Conference on Computer Vision; Springer: Cham, Switzerland, 2020; pp. 18–34. [Google Scholar]
  60. Yin, T.; Zhou, X.; Krahenbuhl, P. Center-based 3d object detection and tracking. In Proceedings of the IEEE/CVF Conference on Computer Vision and Pattern Recognition, Nashville, TN, USA, 20–25 June 2021; pp. 11784–11793. [Google Scholar]
  61. Zhu, Z.; Meng, Q.; Wang, X.; Wang, K.; Yan, L.; Yang, J. Curricular object manipulation in lidar-based object detection. In Proceedings of the IEEE/CVF Conference on Computer Vision and Pattern Recognition, Vancouver, BC, Canada, 17–24 June 2023; pp. 1125–1135. [Google Scholar]
  62. Nie, M.; Xue, Y.; Wang, C.; Ye, C.; Xu, H.; Zhu, X.; Huang, Q.; Mi, M.B.; Wang, X.; Zhang, L. Partner: Level up the polar representation for lidar 3d object detection. In Proceedings of the IEEE/CVF International Conference on Computer Vision, Vancouver, BC, Canada, 17–24 June 2023; pp. 3801–3813. [Google Scholar]
Figure 1. The architecture of the semantic-guided multi-feature attention aggregation network. (1) Spconv–Unet architecture is used to extract foreground points and semantic space features. (2) According to the semantic score, the raw point clouds are resampled to obtain as many sampling points as possible, and the keypoint feature with semantic information are obtained through the Keypoint Attention Enhancement module. (3) The keypoint, BEV, and sparse voxel features from the three representations are used as the input of the aggregation module and fused by the keypoint query mechanism. S-FPS stands for semantic farthest-point sampling; Dconv stands for Deconvolution.
Electronics 14 02154 g001
Figure 2. The Spconv–Unet encoder–decoder structure.
Electronics 14 02154 g002
Figure 3. Demonstration of Keypoint Attention Enhancement module. The aggregated features undergo a series of transformations, including fully connected (FC) layers, layer normalization (LN), and ReLU activation, to further refine the feature representations. Finally, the enhanced features are obtained through element-wise multiplication operations, resulting in keypoint semantic enhancement features F k e y .
Electronics 14 02154 g003
Figure 4. Multi-feature attention aggregation module. The fused feature maps with multi-scale voxel group and semantic keypoint query information were fed into self-attention. The input consists of multi-scale voxel groups and semantic keypoint query features. These features are fused through concatenation and channel-wise weighting, forming a unified feature map. The fused map is then processed by a self-attention mechanism to model long-range dependencies and refine spatial–semantic relationships.
Electronics 14 02154 g004
Figure 5. The distribution of different categories within the KITTI dataset.
Electronics 14 02154 g005
Figure 6. Comparison between using 2048 and 4096 keypoints for 3D object detection. The green boxes indicate the detected small objects, while the yellow circles highlight the false positives.
Electronics 14 02154 g006
Figure 7. Runtime distribution of key modules in our keypoint-based querying framework. MFAA dominates computation (∼60%), while S-FPS and KAE contribute ∼12% and ∼28%, respectively.
Electronics 14 02154 g007
Figure 8. Additional qualitative results from the KITTI validation set are presented. We also include the corresponding projected 3D bounding boxes overlaid on image views. Specifically, predicted boxes are highlighted in red, while ground-truth annotations are color-coded as follows: green for cars, cyan for pedestrians, and yellow for cyclists.
Electronics 14 02154 g008
Table 1. Comparison of methods in terms of voxelization, feature aggregation, and semantic segmentation usage.
MethodVoxelizationFeature AggregationSemantic Segmentation
PointRCNN [20] 2-stage point refinement
PV-RCNN [14]Voxel-to-point and RoI pooling
Part-A2 [7]Part-aware RoI pooling
SMA2Multi-feature attention
Table 2. Performance comparison on KITTI official test server.
MethodReferenceModalityCar-3D.AP (IoU = 0.7)Pedestrian-3D.AP (IoU = 0.5)Cyclist-3D.AP (IoU = 0.5)
EasyModHardEasyModHardEasyModHard
F-PointNet [13]CVPR2018L+C82.1969.7960.5950.5342.1538.0872.2756.1249.01
PointPainting [51]CVPR2020L+C88.9378.2777.4850.3240.9737.8777.6363.7855.89
3D-CVF [52]CVPR2020L+C89.2080.0573.11
SECOND [5]SensorsL84.6575.9668.71
PointPillars [6]CVPR2019L82.5874.3168.9951.4541.9238.8977.158.6551.92
PointRCNN [20]SensorsL86.9675.6470.747.9839.3736.0174.9658.8252.53
Point-GNN [27]CVPR2020L88.3379.4672.2951.9243.7740.1478.6063.4857.08
Part- A 2 [7]TPAMIL87.8178.4973.5153.1043.3540.0679.1763.5256.93
SA-SSD [31]CVPR2020L88.7579.7974.16
3DSSD [16]CVPR2020L88.3679.5774.55 54.64 44.2740.2382.4864.156.90
PV-RCNN [14]CVPR2020L90.2581.4376.8252.1743.2940.2978.5763.7157.65
CIA-SSD [29]CVPR2021L89.5980.2872.87
HVPR [53]CVPR2021L86.3877.9273.04 53.47 43.9640.64
IA-SSD [25]CVPR2022L88.3480.1375.0446.5139.0335.6078.3561.9455.70
FARP-Net [54]TOM2023L88.3681.5578.98
PVT-SSD [55]CVPR2023L90.6582.2976.85
VoPiFNet [56]TITS2024L88.5180.9776.7453.07 47.43 45.22 77.6464.1058.00
SMA2L 91.03 81.74 77.08 52.3443.6640.51 80.56 65.20 58.43
Table 3. Comparative results on the Waymo Open dataset on validation set, evaluating 3D object detection performance for vehicles (IoU = 0.7), pedestrians (IoU = 0.5), and cyclists (IoU = 0.5). results marked with † are cited from [15].
MethodVeh. (LEVEL_1)Veh. (LEVEL_2)Ped. (LEVEL_1)Ped. (LEVEL_2)Cyc. (LEVEL_1)Cyc. (LEVEL_2)
mAPmAPHmAPmAPHmAPmAPHmAPmAPHmAPmAPHmAPmAPH
PointPillars [6]56.6259.25
SECOND [5]72.2771.6963.8563.3368.758.1860.7251.3160.6259.2858.3457.05
MVF [57]62.9365.33
AFDet [58]63.6965.33
Pillar-based [59]69.8072.51
Part-A2-Net  [7]74.8274.3265.8865.4271.7663.6462.5355.367.3566.1565.0563.89
Voxel-RCNN [9]75.5966.5972.51
CT3D [32]76.3069.0465.33
Pyramid-RCNN [33]76.375.6867.2366.68
CenterPoint [60]76.776.268.868.379.072.971.065.3
Curricular [61]72.1571.0464.6464.2973.6264.4765.8460.39
VoTr-TSD [30]74.9574.2565.9165.29
CenterFormer [5]72.2771.6963.8563.3368.758.1860.7251.3160.6259.2858.3457.05
PV-RCNN  [14]75.1774.666.3565.8472.6563.5263.4255.2967.2665.8264.8863.48
PARTNER [62]76.0575.5268.5868.11
PV-RCNN++ [15]76.1475.6268.0567.5673.9765.4365.6457.8268.3867.0665.9264.65
SMA276.6476.4168.4568.0674.2766.1364.2957.7168.4367.1265.7564.21
Table 4. Quantitative comparison of 3D object detection methods on the DAIR-V2X-V validation set. All results are evaluated locally using the mean average precision (mAP) metric computed over 40 recall positions.
ModelVehicle3D (IoU = 0.5)Pedestrian3D (IoU = 0.25)Cyclist3D (IoU = 0.25)
EasyModHardEasyModHardEasyModHard
PointPillars [6]61.7649.0243.4533.4024.6822.3938.2433.8032.35
SECOND [5]69.4459.6357.6343.4539.0638.7844.2139.0337.74
Voxel-RCNN [9]69.1156.7356.7643.4938.2537.2843.2436.2336.45
PointRCNN [20]64.0654.0854.1241.3636.8736.4737.2632.1932.56
IA-SSD [25]69.1656.7756.8045.1139.5638.6944.8639.4638.11
PV-RCNN [14]69.0156.6356.6744.6939.2039.8144.3538.0937.17
SMA270.1257.3956.9545.2339.4339.2145.2339.4338.21
Table 5. Effects of SP-FPS module, KAE, and MFAA for SMA2 network. Results on the KITTI val set for Car, Pedestrian, and Cyclist classes.
S-FPSKAEMFAACar-3D.AP (IoU = 0.7)Pedestrian-3D.AP (IoU = 0.5)Cyclist-3D.AP (IoU = 0.5)
EasyModHardEasyModHardEasyModHard
89.4679.2377.8368.4261.6155.0688.3174.1367.64
90.1379.4678.6068.5861.6855.4788.5475.7768.23
94.6181.3379.1269.2662.8558.5689.1276.6868.64
95.5482.680.2668.7663.1458.6189.3377.469.51
Table 6. Performance comparison on the KITTI validation set based on the number of foreground keypoints.
The Number of Foreground KeypointsCar-3D.APPedestrian-3D.APCyclist-3D.AP
Mod (IoU = 0.7)Mod (IoU = 0.5)Mod (IoU = 0.5)
51278.4560.5772.56
102479.2661.7975.48
204879.1461.9576.54
409679.8761.4676.43
Table 7. Performance comparison of FPS and S-FPS sampling strategies.
StrategyCarPed.Cyc.FLOPS (M)Running Time
FPS77.5659.6974.35−0143 ms
S-FPS79.3661.6476.60−87521 ms
Table 8. Evaluation of keypoint enhancement strategies on KITTI validation set.
Enhancement MethodCar.APPedestrian.APCyclist.AP
Mod (IoU = 0.7)Mod (IoU = 0.5)Mod (IoU = 0.5)
Bilinear interpolation77.4659.8774.21
Vector pool aggregation79.2561.3575.68
KAE 81.26 61.64 76.59
Table 9. Performance comparison of different fusion strategies on the KITTI validation set.
Fusion MethodCar.APPedestrian.APCyclist.AP
Mod (IoU = 0.7)Mod (IoU = 0.5)Mod (IoU = 0.5)
Concat79.4661.5474.13
MFAA82.0562.9877.45
Table 10. Performance comparison of different keypoint query strategies on the KITTI validation set.
ModuleCar.APPedestrian.APCyclist.AP
Mod (IoU = 0.7)Mod (IoU = 0.5)Mod (IoU = 0.5)
Voxel query77.4158.1370.12
Keypoint query82.4563.2377.35
Table 11. Runtime and detection performance are compared on the KITTI, Waymo, and DAIR-V2X-V validation sets. Reported metrics include average 3D AP under moderate difficulty for KITTI, LEVEL_2 3D mAPH for Waymo, and moderate 3D AP for the Car class on DAIR-V2X-V.
MethodKITTIWaymoDAIR-V2X-V
Speed (ms)3D.APSpeed (ms)mAPHSpeed (ms)Car-3D.AP
PV-RCNN [14]15471.7141361.5419756.63
SMA212674.1434965.0917257.39
Disclaimer/Publisher’s Note: The statements, opinions and data contained in all publications are solely those of the individual author(s) and contributor(s) and not of MDPI and/or the editor(s). MDPI and/or the editor(s) disclaim responsibility for any injury to people or property resulting from any ideas, methods, instructions or products referred to in the content.

