In this section, several criteria for improving the performance of the sensor are simulated based on the initial model. Additionally, the effectiveness of the proposed enhancements is evaluated and discussed in terms of sensitivity, linearity, accuracy, and the range of applied gas flow velocities. The performance of the proposed MEMS thermal flow sensor was analyzed through simulations, focusing on key parameters, such as sensitivity, linearity, accuracy, and flow velocity range. The results highlight the significant impact of thermal obstacles and sensor positioning on optimizing heat transfer and improving measurement accuracy.
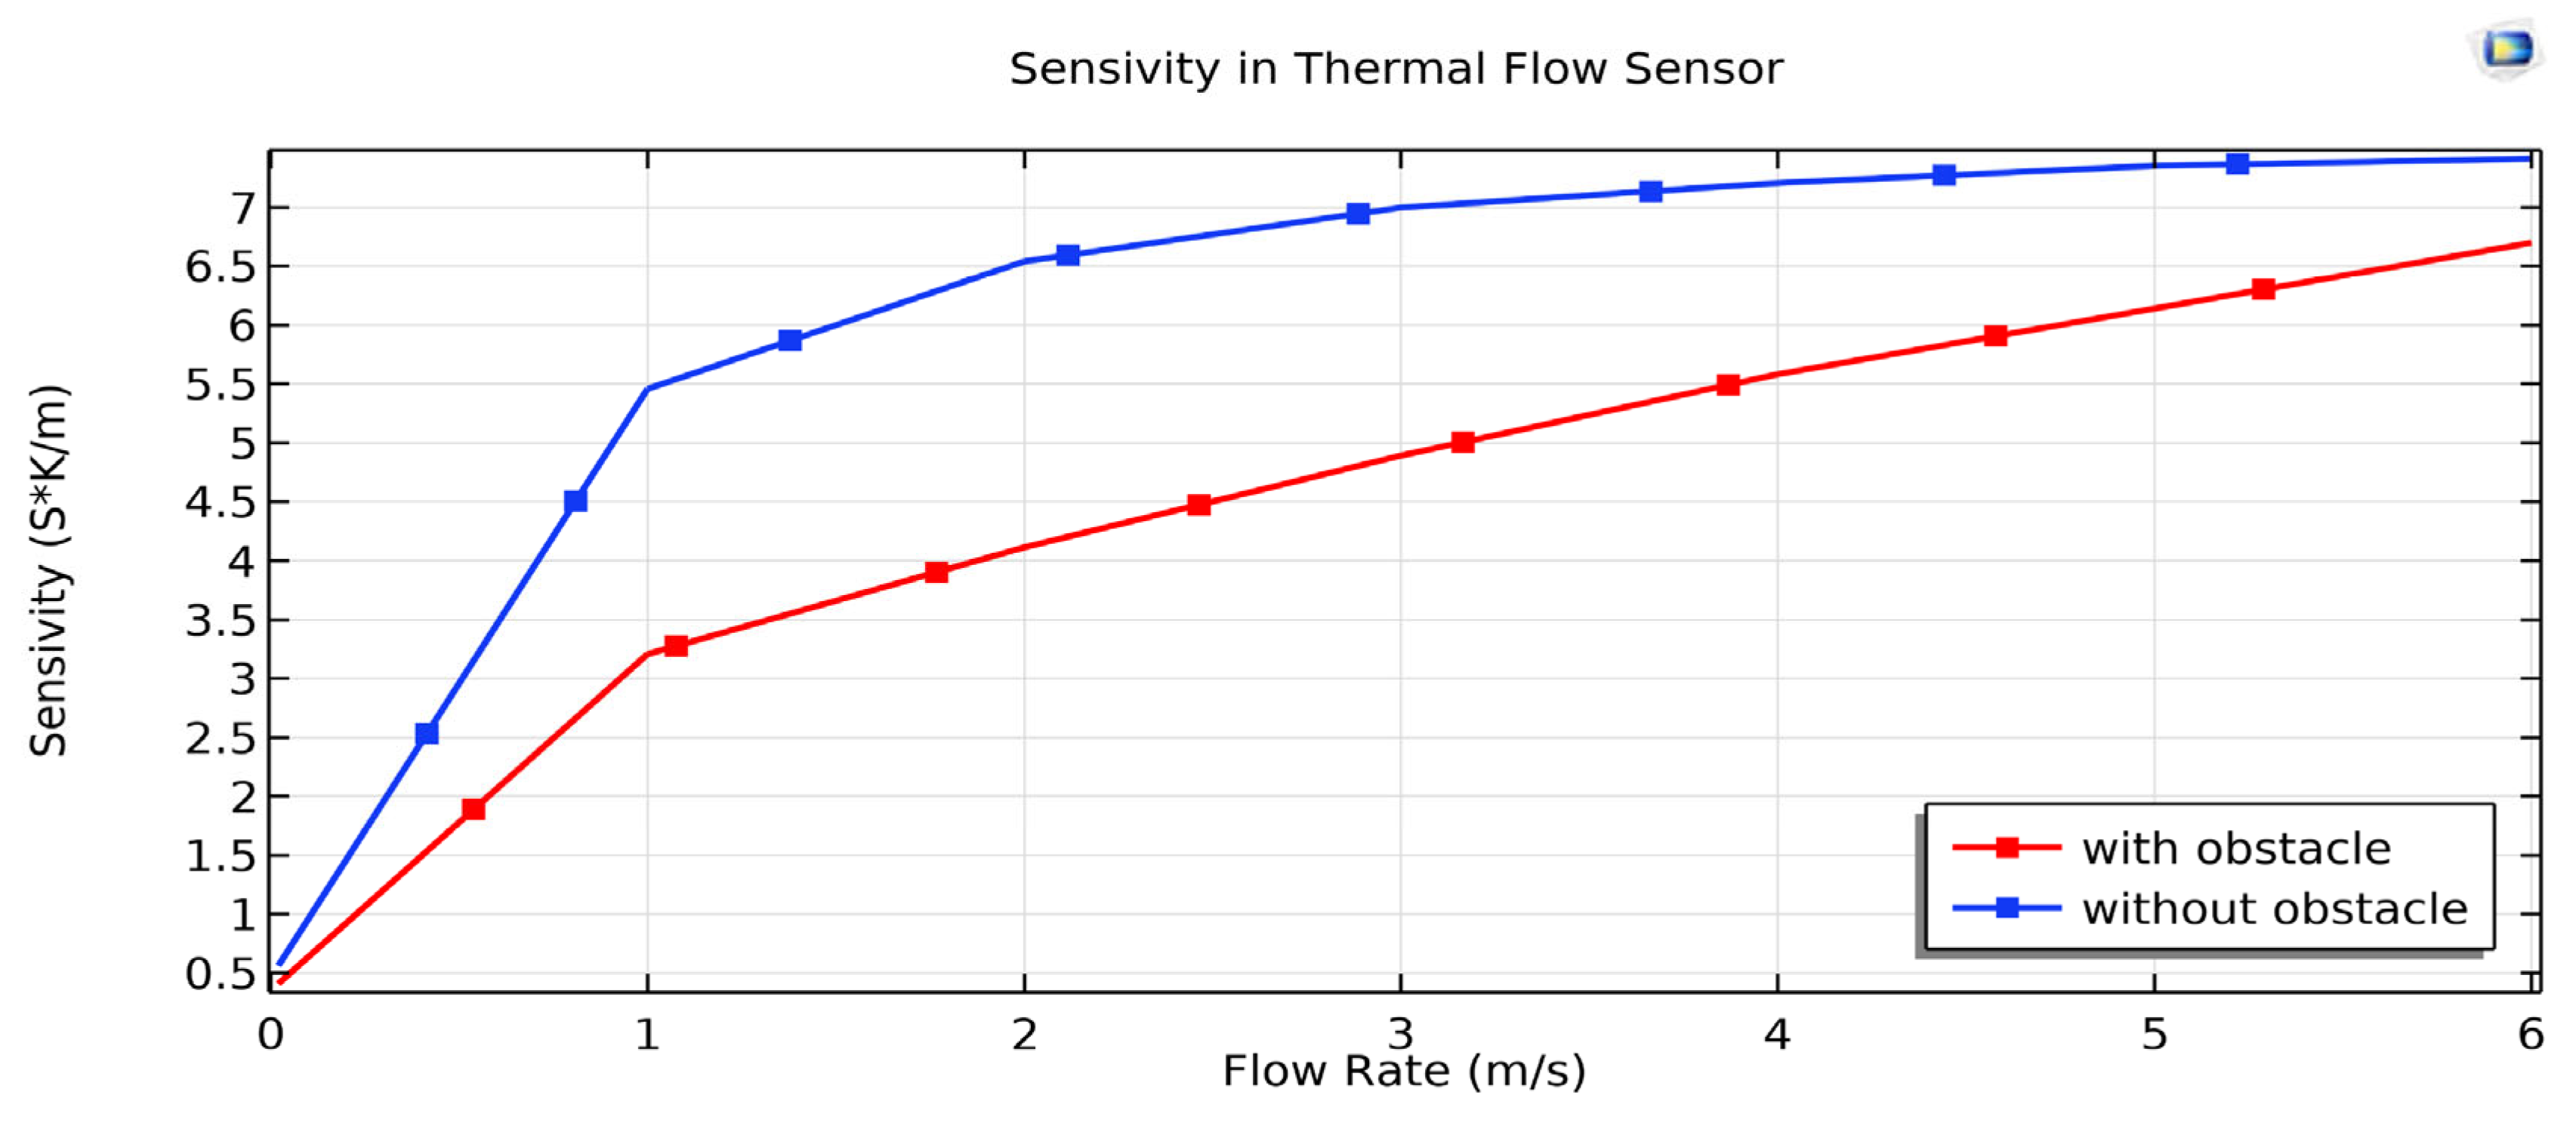
The sensor’s sensitivity was determined by measuring the temperature difference (ΔT) between the upstream and downstream thermistors. Simulation results indicate that the presence of thermal obstacles enhances heat transfer, resulting in increased sensitivity at higher flow rates. Specifically, in the low-flow region (0–1 m/s), the sensor achieved a sensitivity of 2.5 SK/m, while in the high-flow region (1–6 m/s), sensitivity increased to 6.5 SK/m. Furthermore, the sensor exhibited an exceptionally high linearity of approximately 91%, ensuring accurate and repeatable flow measurements. Under high-velocity conditions, the obstacle effectively reduced flow speed near the heater, increasing the interaction time between the gas and the heated surface, thereby enhancing heat transfer efficiency. In low-velocity conditions, the presence of obstacles induced flow disturbances that reduced the thermal boundary layer thickness, improving the sensor’s sensitivity to minor flow variations. Additionally, temperature distribution analysis provided valuable insights into sensor performance. The results reveal that at higher flow velocities, the temperature difference (ΔT) between the upstream and downstream sensors increases, confirming the sensor’s ability to accurately estimate flow rates.
Comparative results demonstrate that the proposed design outperforms previous MEMS flow sensors, particularly in terms of sensitivity, accuracy, and adaptability across a wider range of flow conditions. These findings establish the proposed MEMS thermal flow sensor as a reliable and robust solution for high-precision flow measurement applications.
3.2. The Effects of an Obstacle on Sensor Performance
In the proposed structure, the sensors, heater, and obstacle are integrated on a single substrate, each designed with specific dimensions and characteristics to enhance performance and increase sensitivity. Two sensors are positioned on either side of the heater, with each sensor measuring 240 µm in length and 150 µm in width. The sensors are placed 10 µm away from the heater to enable a rapid response to temperature changes caused by gas flow.
Since temperature is influenced by changes in flow rate, the relationship between temperature and flow velocity can be expressed as shown in Equation (13). Based on Equation (5), the temperature difference (Δ
T) can be written as a function of flow velocity (
u):
Here,
q is indirectly dependent on the flow velocity, as changes in flow velocity influence the convective heat transfer coefficient (
h). Based on gas dynamics principles, it can be assumed that
Therefore, the relationship for temperature variations can be expressed as Equation (15):
According to Equation (15), which represents temperature variations, the parameters are defined as follows: A, which represents the surface area of contact between the gas flow and the heated surface, directly affecting heat transfer; K, the thermal conductivity coefficient of the heated surface material, indicating the material’s ability to conduct heat; and L, the length of the heat transfer path, typically the distance the gas flow travels over the heated surface. These parameters combine to influence the temperature changes and the system’s sensitivity to changes in flow velocity.
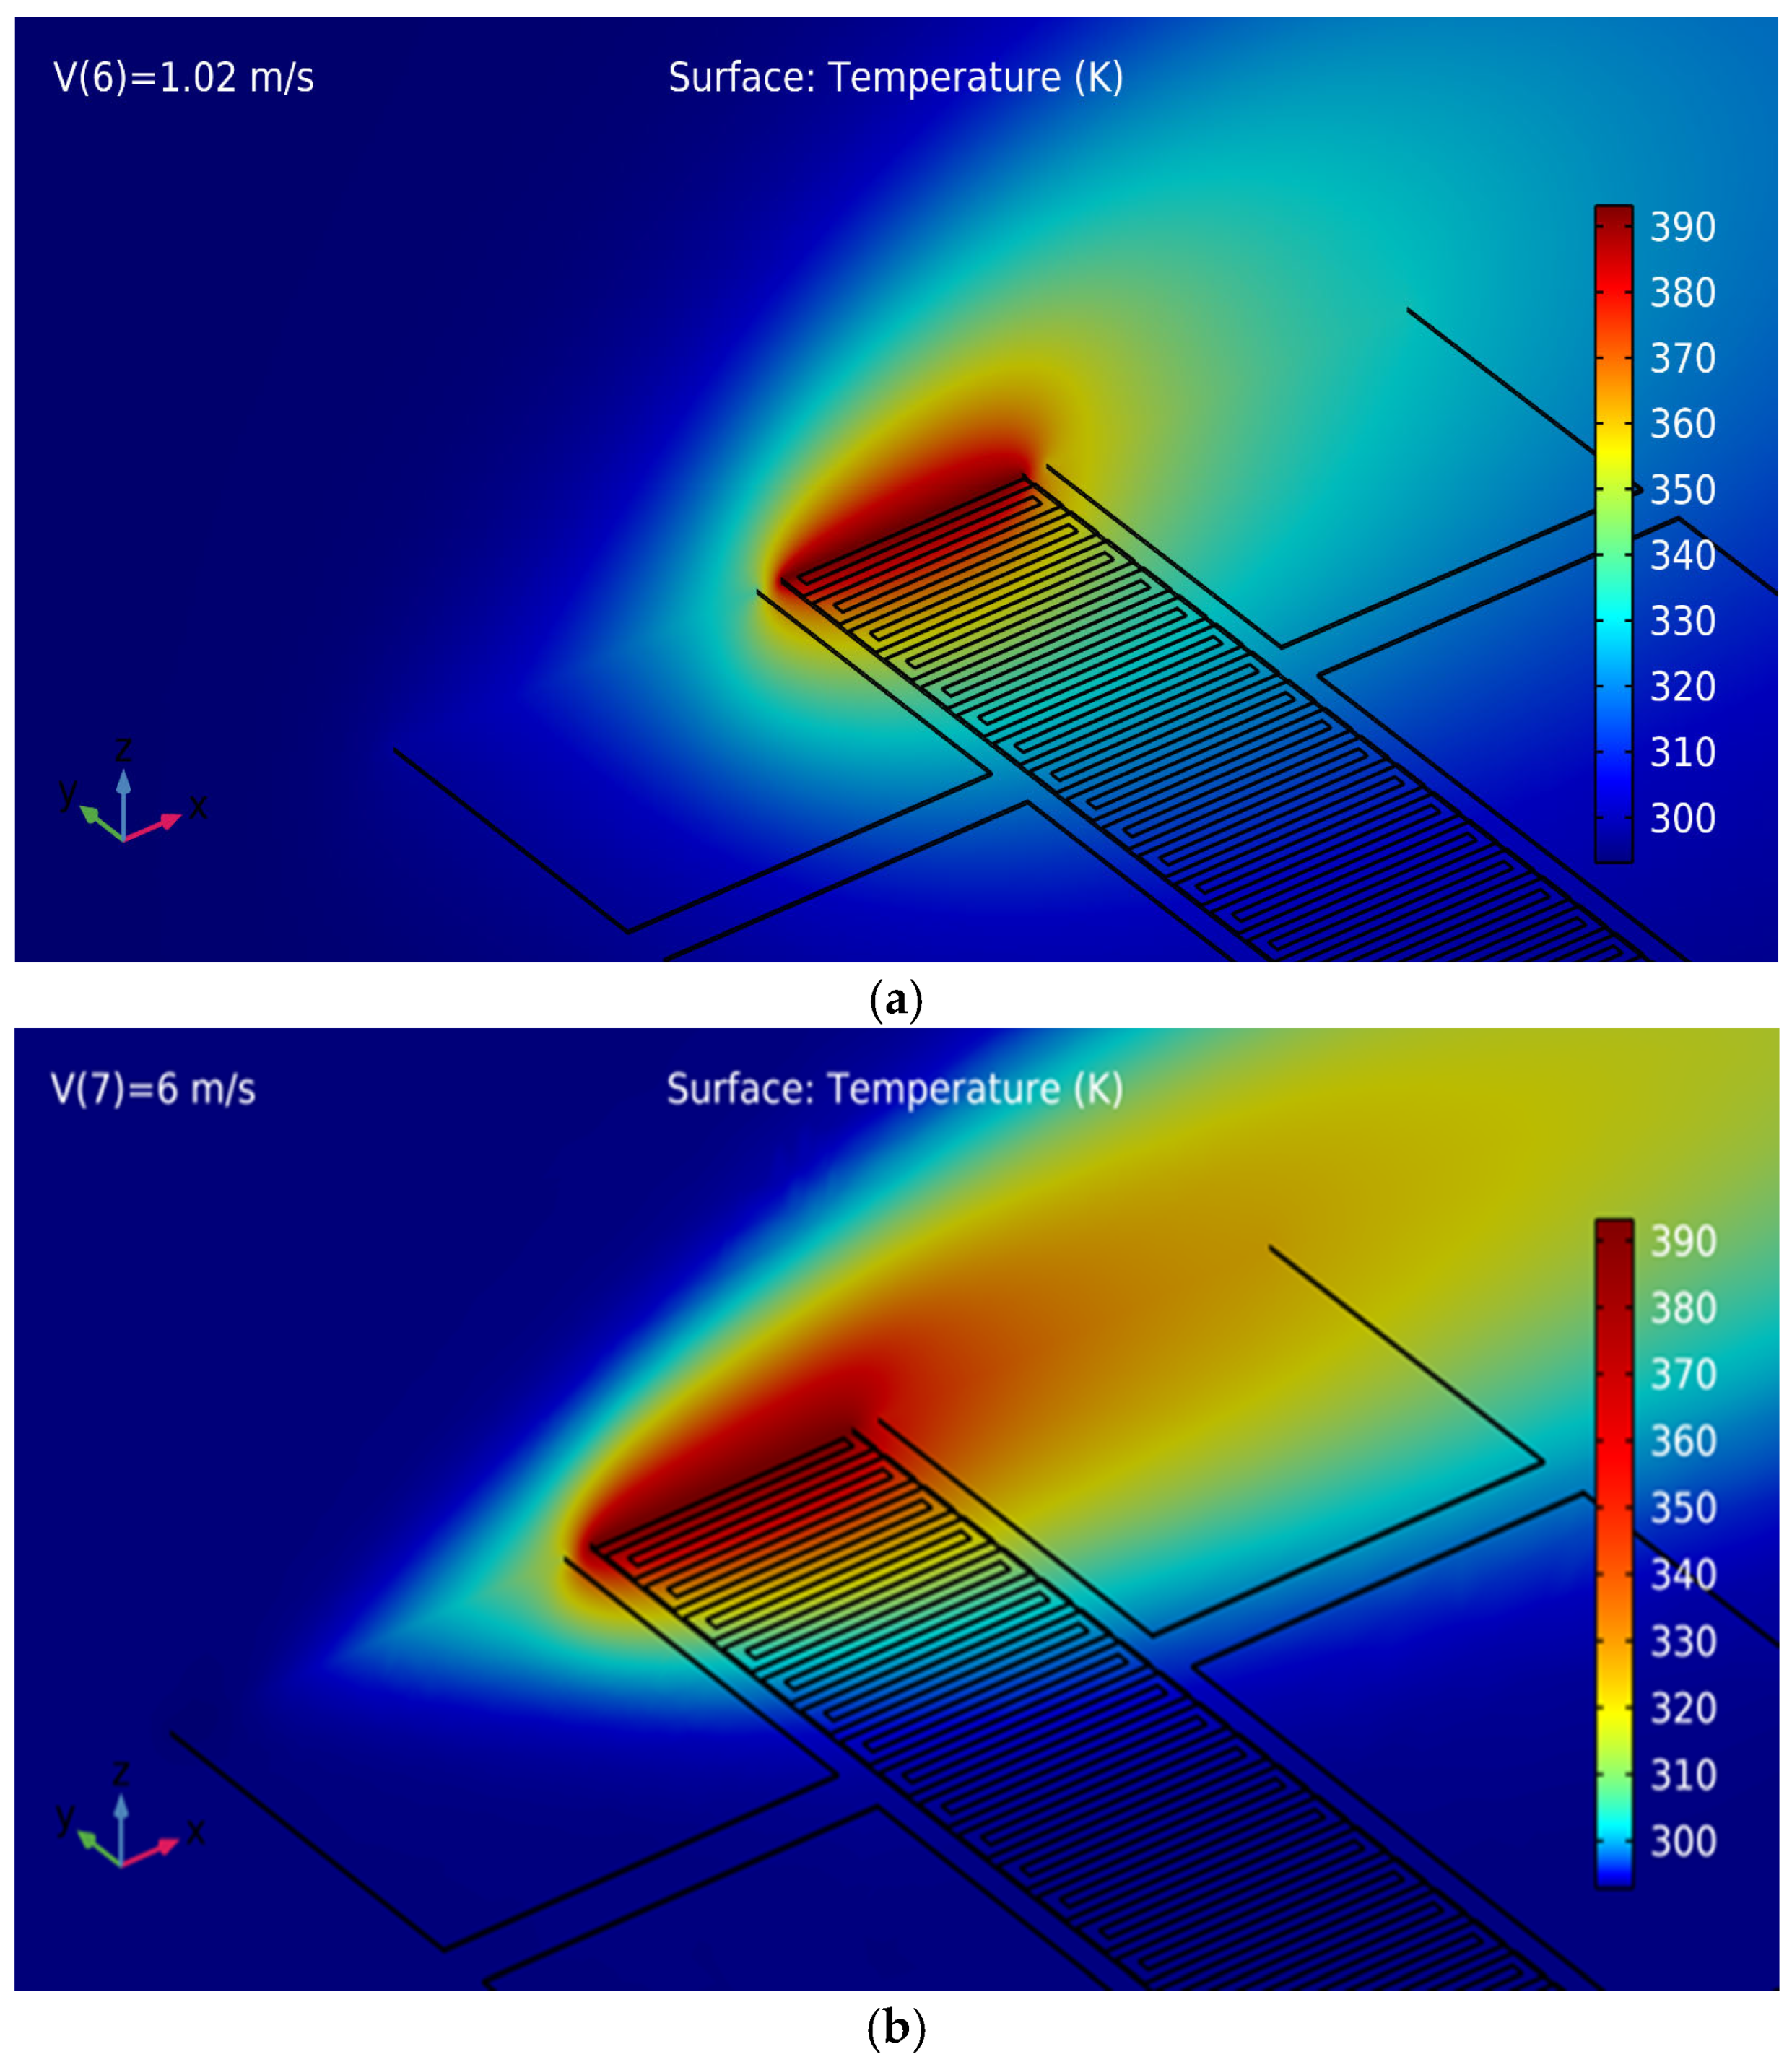
Figure 6 illustrates the temperature distribution as a function of flow velocity and demonstrates the heat transfer from the heater to the sensors. In this configuration, air is selected as the working gas due to its low viscosity, low density, and appropriate heat capacity, which directly influence heat transfer and sensor performance. Air’s ability to generate a significant temperature gradient between the heater and the passing flow is critical for enhancing the measurement accuracy of MEMS thermal flow sensors. Additionally, its thermal stability, widespread availability, and non-corrosive nature make it an ideal choice for precise flow rate sensing applications. At low flow velocities (0–1 m/s), air moves more slowly, resulting in a longer contact time with the heater surface. This leads to a greater temperature difference between the upstream and downstream sensors, thereby enhancing the sensor’s sensitivity. In this range, heat transfer is primarily governed by natural convection, allowing the airflow to absorb sufficient thermal energy from the sensor surface. At higher flow velocities (1–6 m/s), the air passes over the heater more rapidly, reducing its contact time with the heated surface. Under these conditions, forced convection becomes dominant, leading to an increased heat transfer rate. The use of thermal obstacles in this configuration significantly impacts sensor performance. At high flow velocities, obstacles reduce the local flow velocity near the heater, prolonging the interaction time between the gas and the heated surface. This mechanism enhances sensor sensitivity at higher flow rates and improves the linearity of the sensor’s response, as shown in
Figure 6b. At low flow velocities, obstacles induce flow complexity by creating static or low-flow regions, which reduce the thermal boundary layer thickness. This improves heat exchange and enhances sensitivity to small changes in flow velocity, as depicted in
Figure 6a. In this figure, a lower obstacle is used for high flow velocities, while an upper obstacle is employed for low flow velocities.
Thermal obstacles play a crucial role in optimizing the sensitivity and linearity of thermal flow sensors. In the absence of obstacles, gas flows at higher velocities, reducing heat transfer and consequently lowering sensitivity. By introducing an obstacle, the flow velocity decreases, increasing the gas’s contact time with the sensor surface and enhancing sensitivity. Additionally, obstacles optimize the flow pattern, ensuring more uniform heat distribution, which further improves sensitivity and enhances the linearity of the sensor’s response. At low flow velocities, obstacles create flow disturbances and reduce the thermal boundary layer thickness, resulting in increased sensitivity to small variations in flow velocity. At higher flow velocities, obstacles slow down the flow and improve heat transfer, preventing thermal saturation effects and making the temperature–velocity relationship more linear. However, optimal obstacle design is essential to avoid excessive flow disturbances while maintaining both sensitivity and linearity in the sensor’s response. Overall, the use of air as the working gas, combined with an optimized geometric design incorporating thermal obstacles, significantly improves heat transfer efficiency, sensor sensitivity, and measurement accuracy across a broad range of flow velocities. The careful placement and design of obstacles enhance sensor performance, ensuring high accuracy and sensitivity for diverse flow conditions.
The temperature variations in the upstream and downstream detectors of the sensor show that as the gas flow velocity increases, the temperature difference between the detectors becomes more pronounced. Specifically, at higher flow velocities, the temperature at the downstream detector exceeds that at the upstream detector. This occurs because the gas passing over the heater absorbs heat and transfers it downstream, creating a measurable thermal gradient. These temperature differences are crucial for assessing the sensor’s sensitivity to gas flow variations and optimizing its performance, particularly in applications requiring precise flow measurements, such as environmental monitoring and industrial process control. Additionally, as shown in
Figure 3, which illustrates the sensitivity curve, the variations in temperature and sensitivity with respect to flow velocity follow a similar pattern. This alignment indicates the direct dependence of these two parameters on the heat transfer rate and the interaction time between the gas flow and the heated surface.
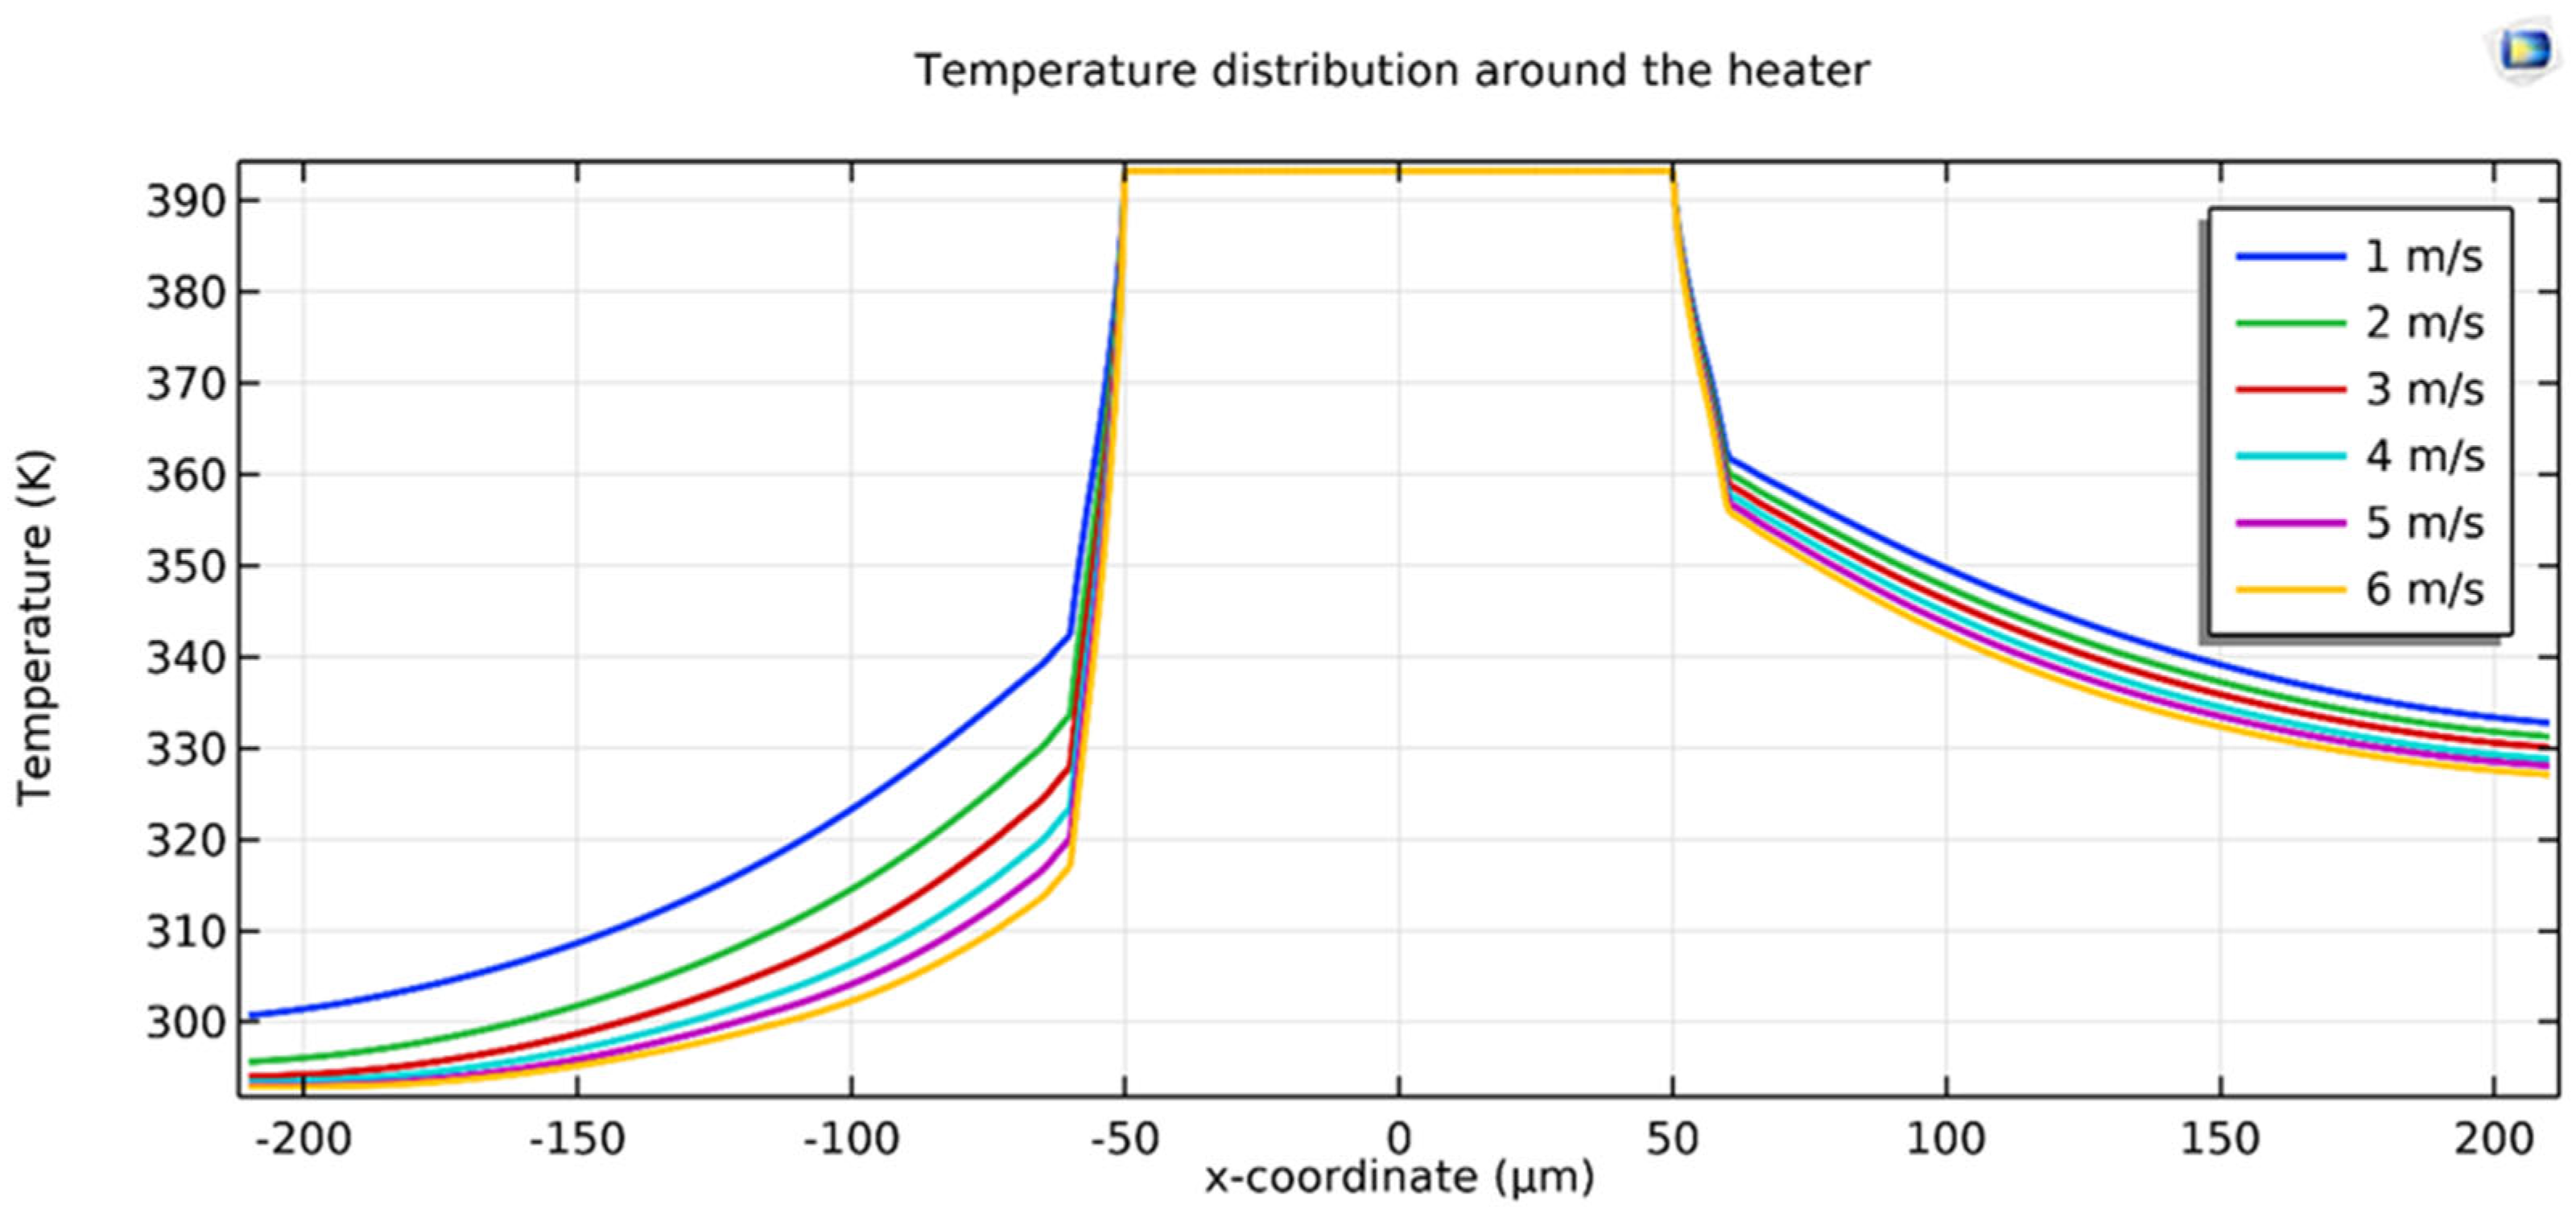
Figure 7 presents the temperature distribution around the heater for flow velocities ranging from 1 to 6 m/s. The diagram highlights how temperature patterns evolve across different regions surrounding the heater under varying flow conditions. This visualization provides valuable insights into the heat transfer dynamics and the sensor’s performance under different flow rates.
The observed temperature differences between the upstream and downstream detectors result from the interaction between the convective heat transfer caused by the gas flow and the thermal energy generated by the heater. The uniformity or asymmetry in the temperature distribution provides valuable insights into the effects of flow dynamics, such as turbulence and boundary layer formation, on sensor behaviour. Additionally, key material properties, including the thermal conductivity and heat capacity of the detector elements, significantly influence the sensor’s sensitivity and response time. The heater design, including its geometry and power input, also plays a crucial role in defining the temperature field and determining the overall performance of the sensor. Furthermore, the flow regime—laminar or turbulent—affects heat transfer efficiency and the accuracy of flow detection. These results provide a deeper understanding of the sensor’s thermal behaviour and serve as a foundation for optimizing its design.
Figure 7 also illustrates the temperature distribution around the heater, under conditions with and without obstacles. The obstacle used in this structure has a length of 240 µm, a width of 50 µm, and a height of 1 µm. In the presence of obstacles, the reduction in gas flow velocity near the sensor increases the interaction time between the gas and the heater, resulting in enhanced heat transfer. This improvement leads to greater sensitivity and better linearity in the sensor’s response. The inclusion of obstacles in the sensor structure demonstrates that, compared to the structure without obstacles, linearity is significantly improved at higher flow velocities, while sensitivity is enhanced at lower flow velocities.
In contrast, under conditions without obstacles, the gas flow velocity is higher, but the interaction time between the gas and the sensor is reduced. This reduction in interaction time limits heat transfer, leading to decreased sensitivity and reduced linearity in the sensor’s response, particularly at higher flow velocities. These findings underscore the positive impact of incorporating obstacles into the sensor design to improve its performance across various gas flow velocity conditions.
In
Figure 8, the simulation results indicate that the obstacle is designed in such a way that it does not induce turbulence or flow disturbance in the sensor’s operating region. The gas flow remains smooth and stable, while the obstacle primarily enhances the thermal interaction between the gas and the heated surface. This design improves the sensor’s sensitivity in measuring flow rates without compromising its accuracy.
As the distance between the obstacle and the sensor increases, both the temperature variation and the sensitivity of the sensor typically decrease. This is because a greater distance reduces the interaction time between the gas flow and the heated surface of the sensor. The shorter interaction time results in decreased convective heat transfer between the sensor surface and the gas, leading to smaller temperature changes at the sensor. Consequently, the sensitivity of the sensor, which strongly depends on temperature variations, is also reduced. Therefore, when the obstacle is placed closer to the sensor, the interaction time between the gas and the heated surface increases. This leads to enhanced heat transfer and, ultimately, the improved sensitivity of the sensor. Additionally, in this closer configuration, the linearity of the sensor’s response is also better maintained, which is crucial for ensuring accurate and stable performance in various applications.
Additionally, the length of the obstacle is adjusted to match the length of the sensor, ensuring optimal alignment. The width of the obstacle is determined based on the characteristics of the gas flow and the need for maximum thermal interaction between the flow and the heated surface, ensuring efficient heat transfer and an optimal system response.
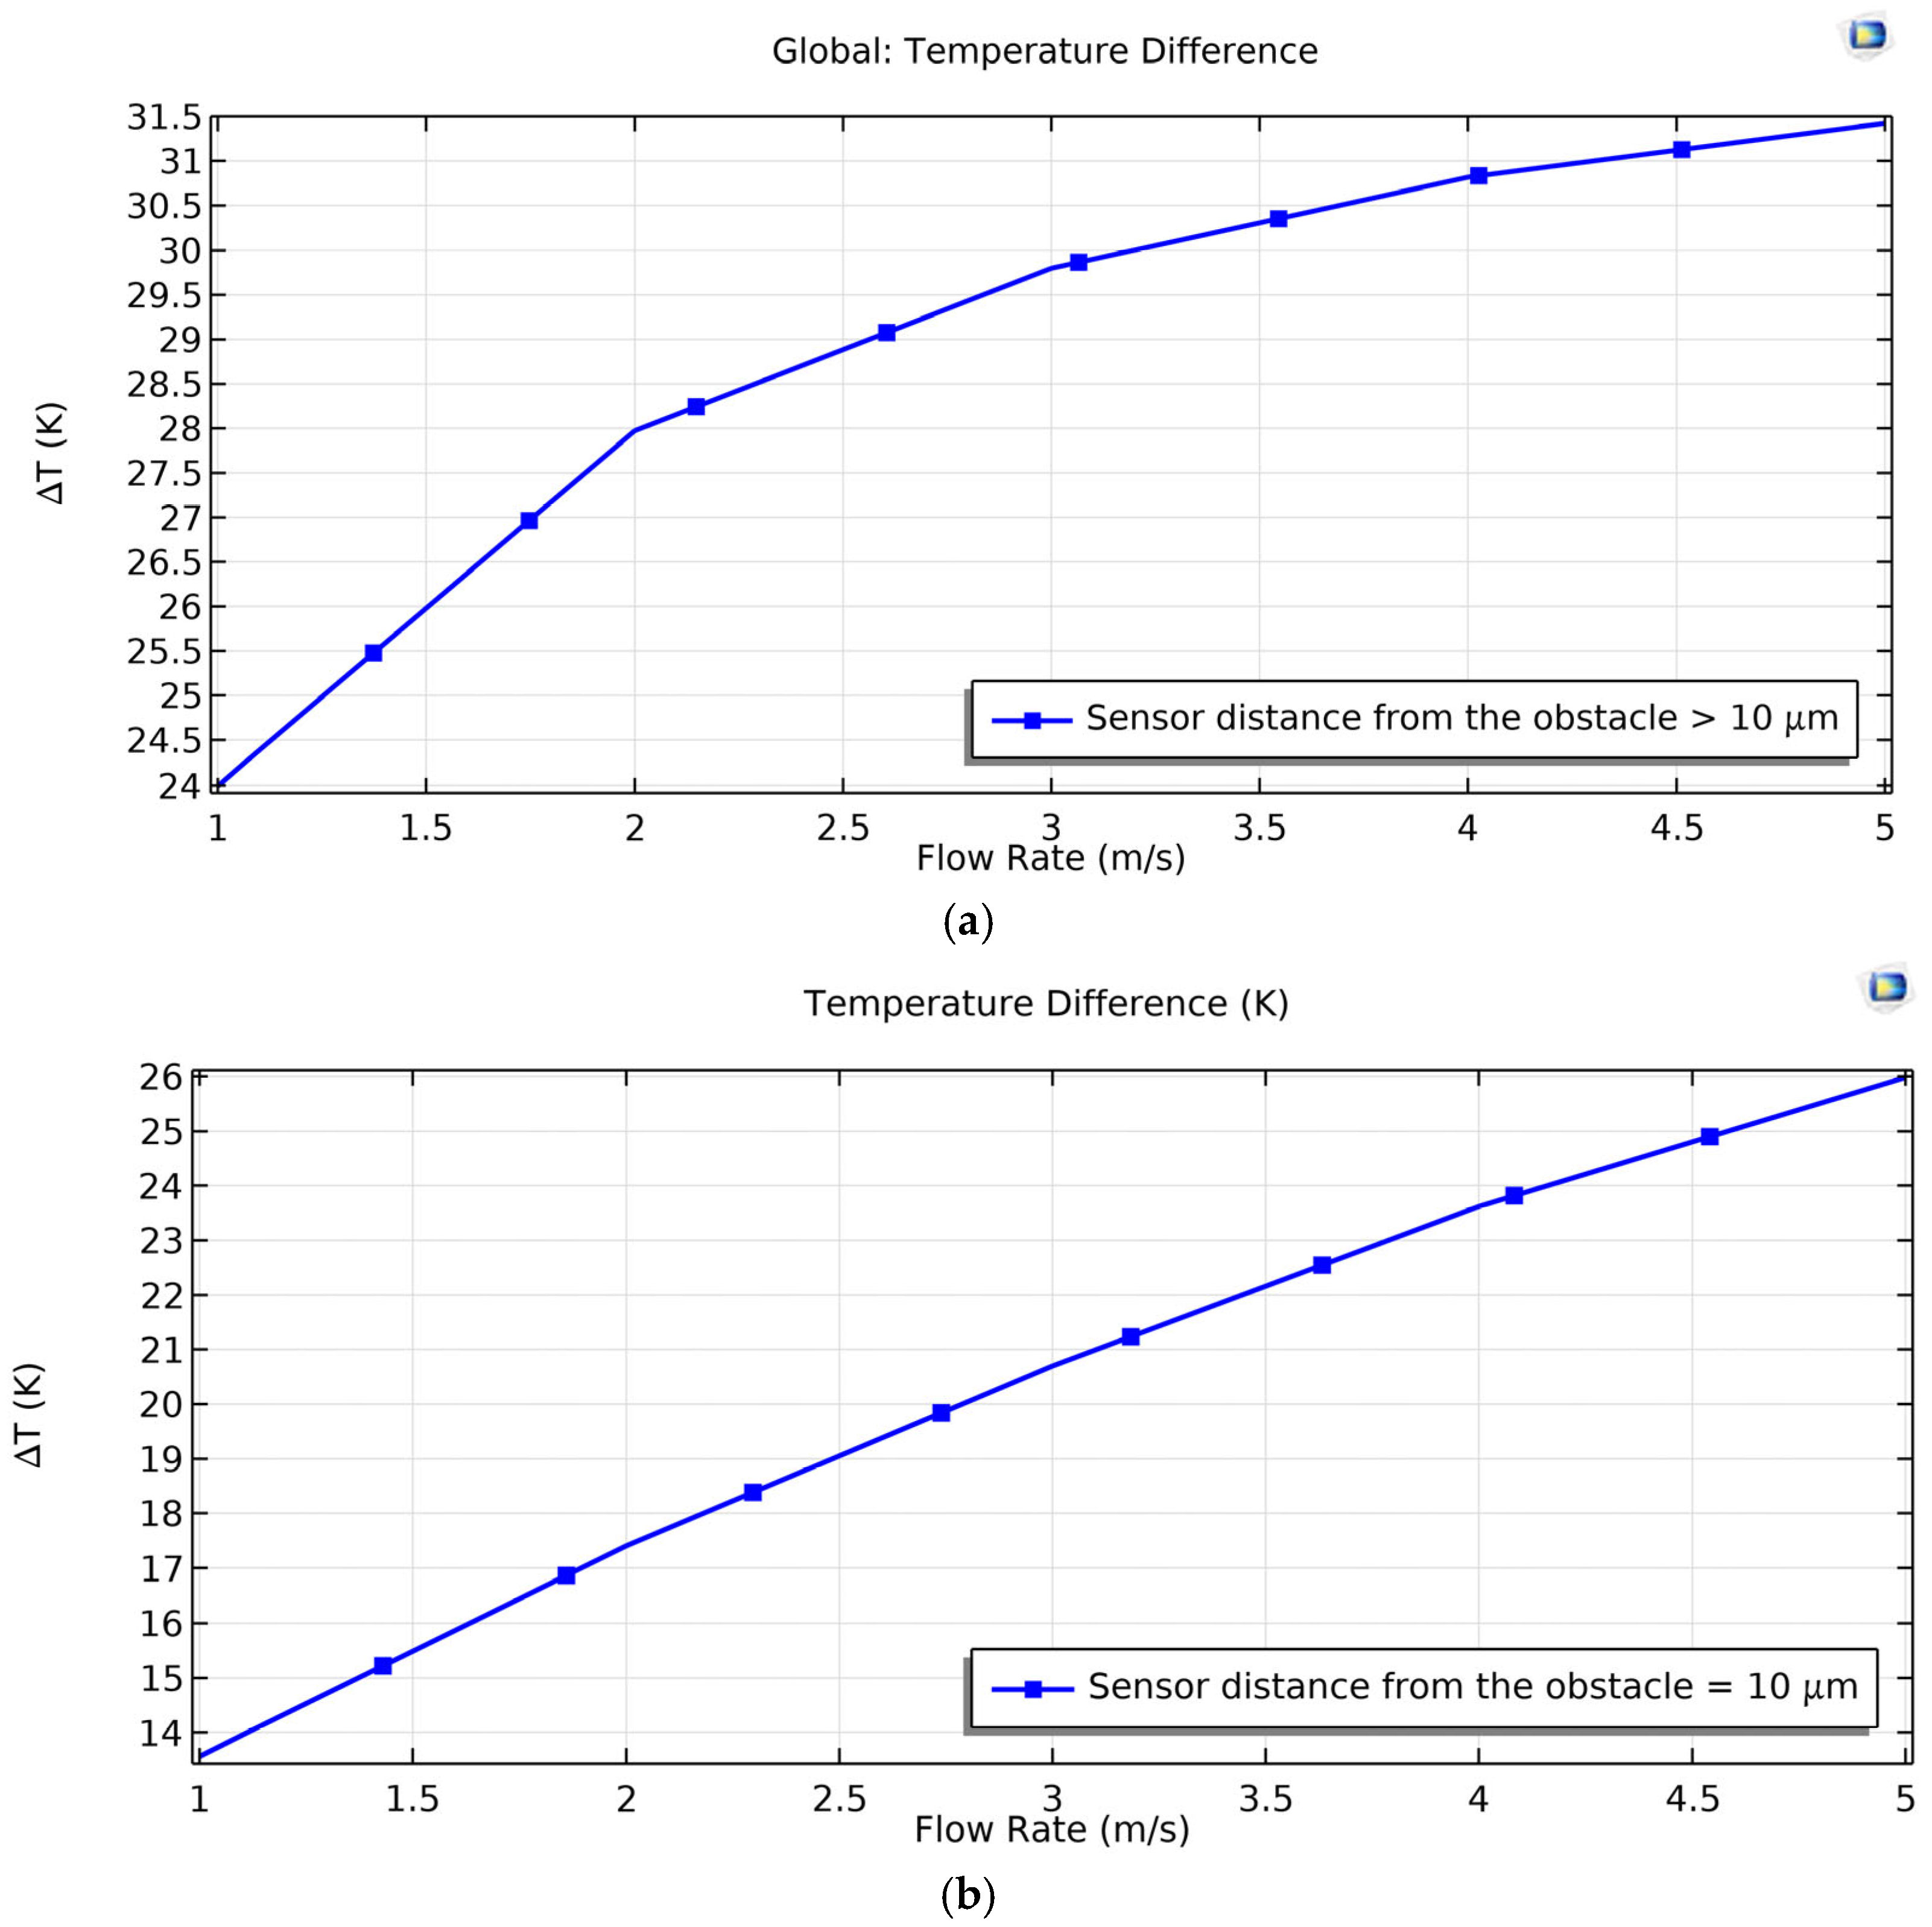
According to the simulation results,
Figure 9a illustrates the temperature changes with respect to flow velocity when the sensor–obstacle distance is greater than 10 μm. In this case, the temperature variation is noticeably smaller, resulting in reduced sensitivity. In contrast,
Figure 9b shows the temperature distribution at a 10-micrometre distance, where the proximity of the obstacle enhances heat transfer and temperature variation, thus improving the sensor’s sensitivity.
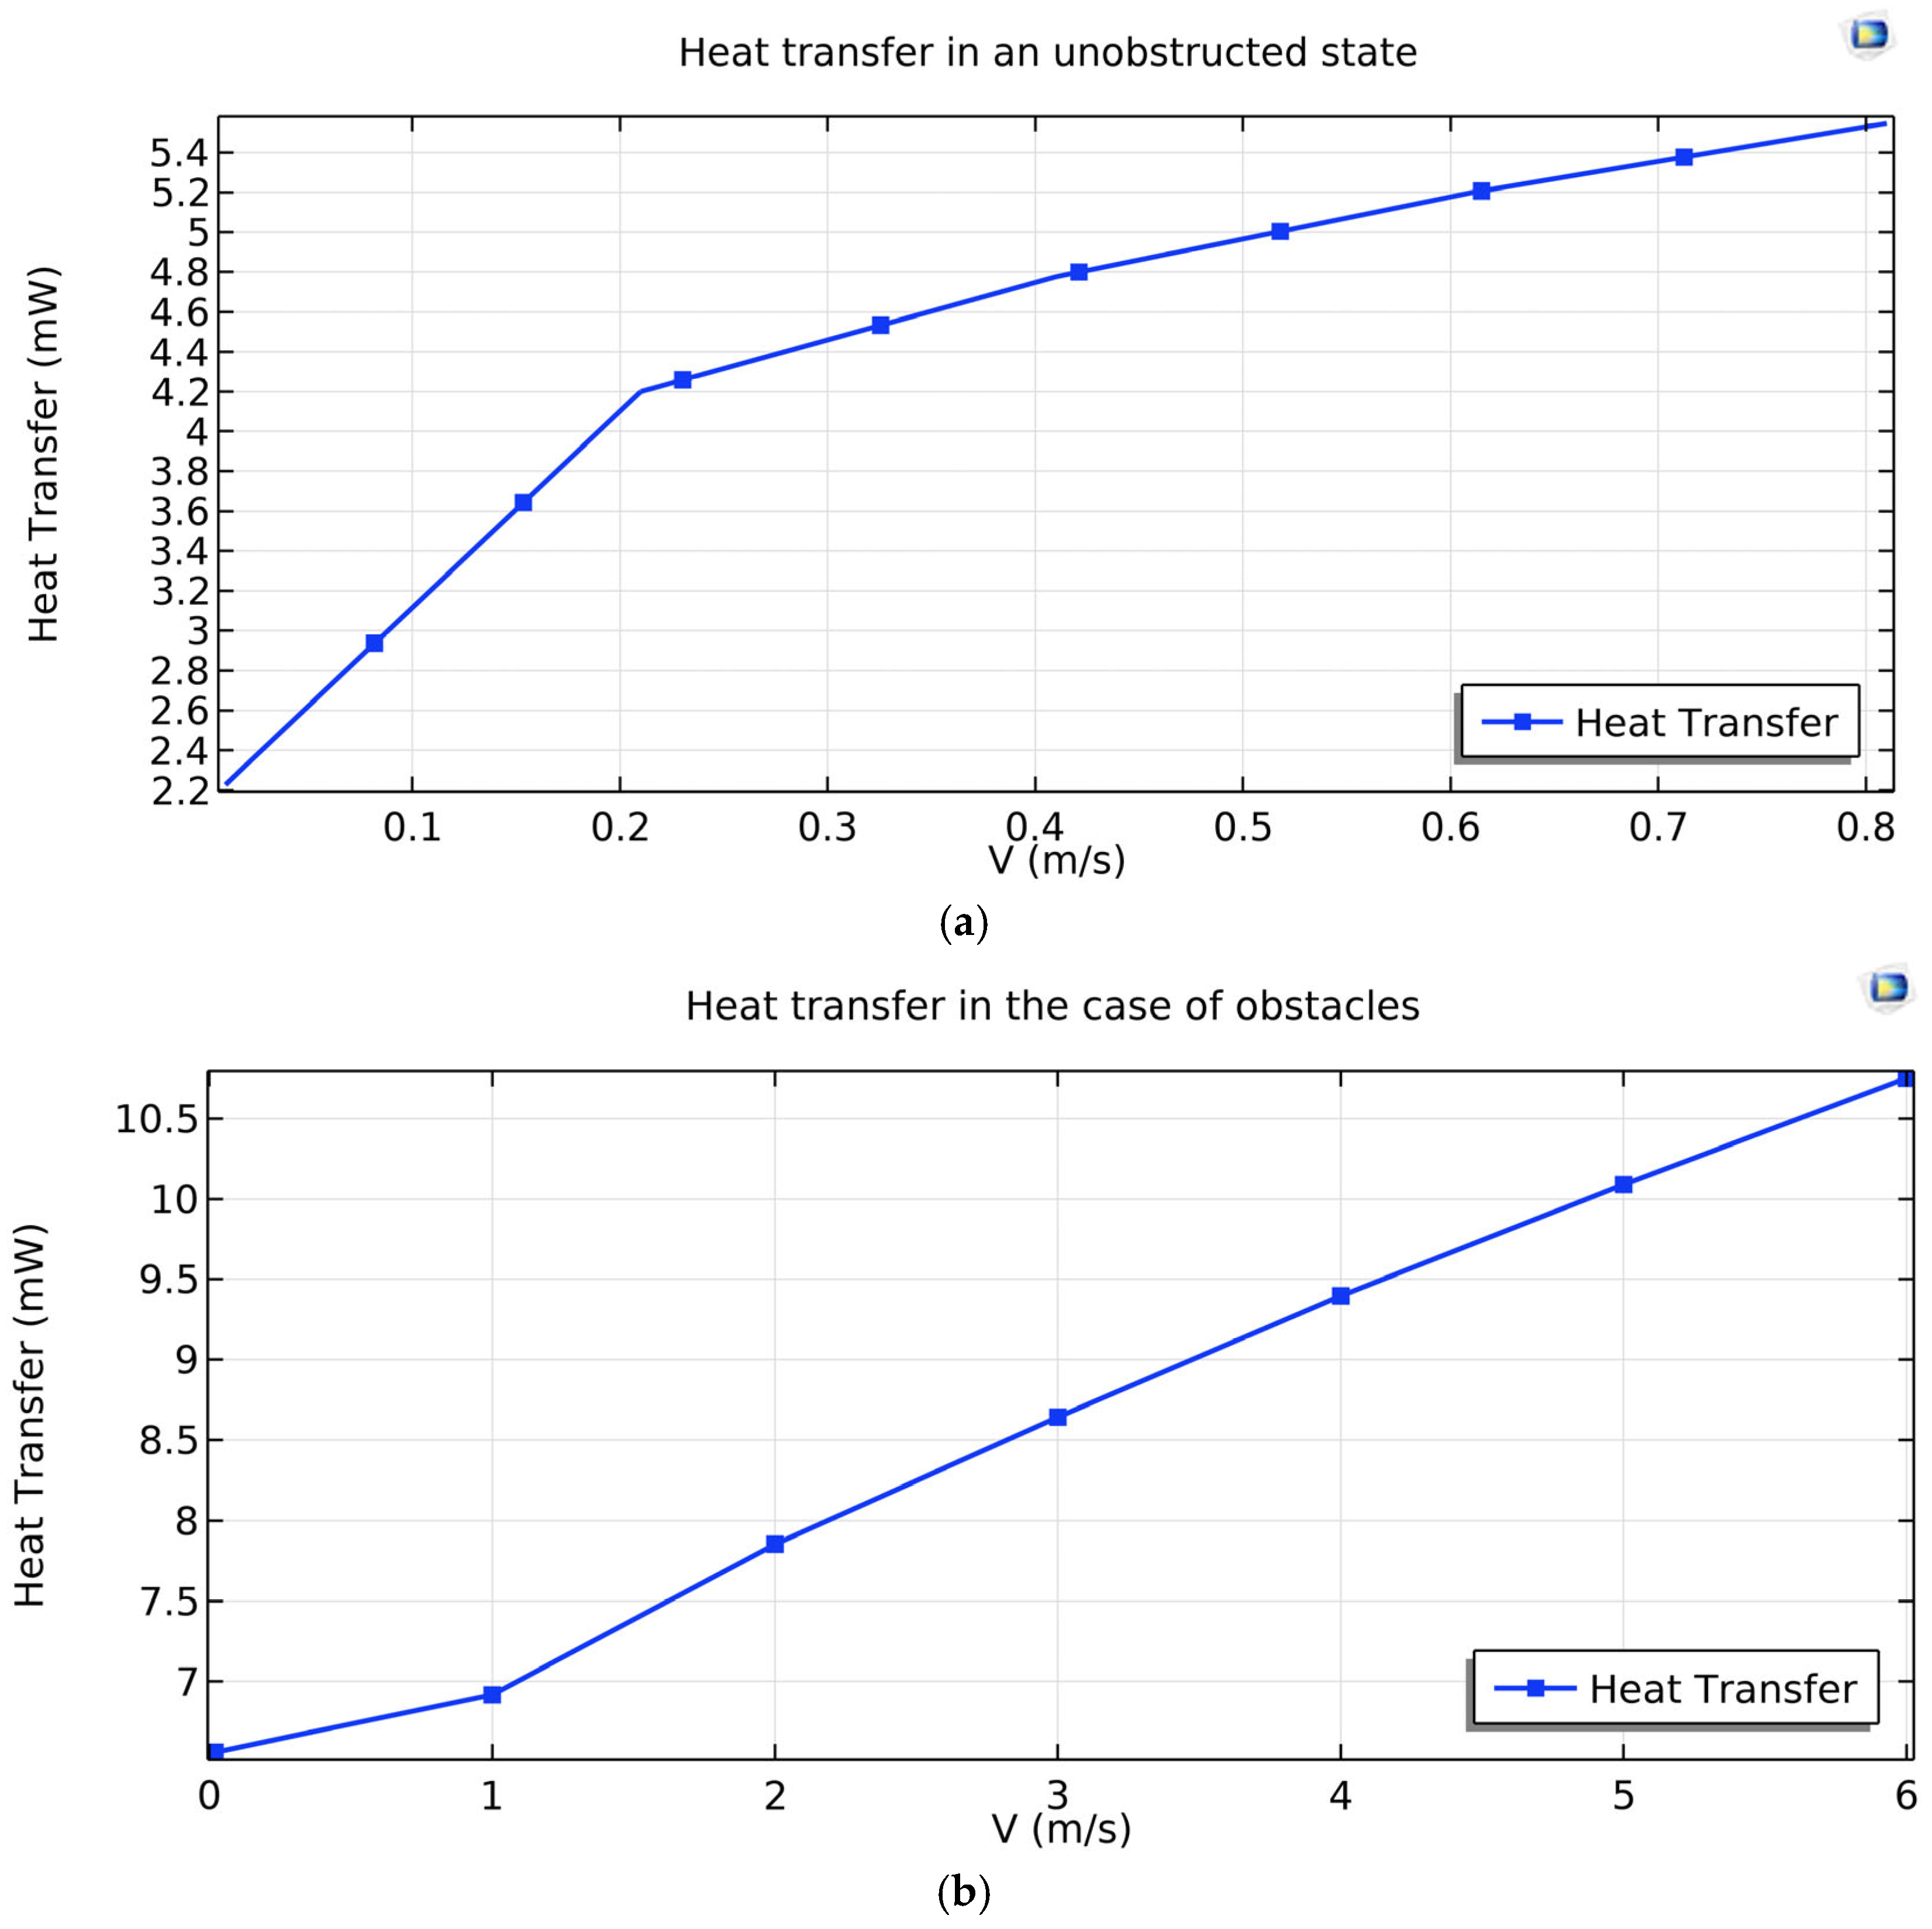
In
Figure 10, the heat transfer versus flow velocity for different cases with and without an obstacle is examined. In
Figure 10a, in the case with an obstacle, especially at higher velocities, it is observed that heat transfer increases significantly due to the increased interaction time of the gas flow with the heated surface. This improvement in heat transfer results in enhanced sensor sensitivity and accuracy in flow measurement at higher speeds. In contrast, in
Figure 10b, in the case without an obstacle and at lower velocities, the heat transfer to the gas flow is lower because the interaction time between the flow and the heated surface is reduced, resulting in smaller temperature variations at the sensor. These differences clearly demonstrate the impact of the obstacle on improving the sensor’s performance, particularly at higher flow velocities.
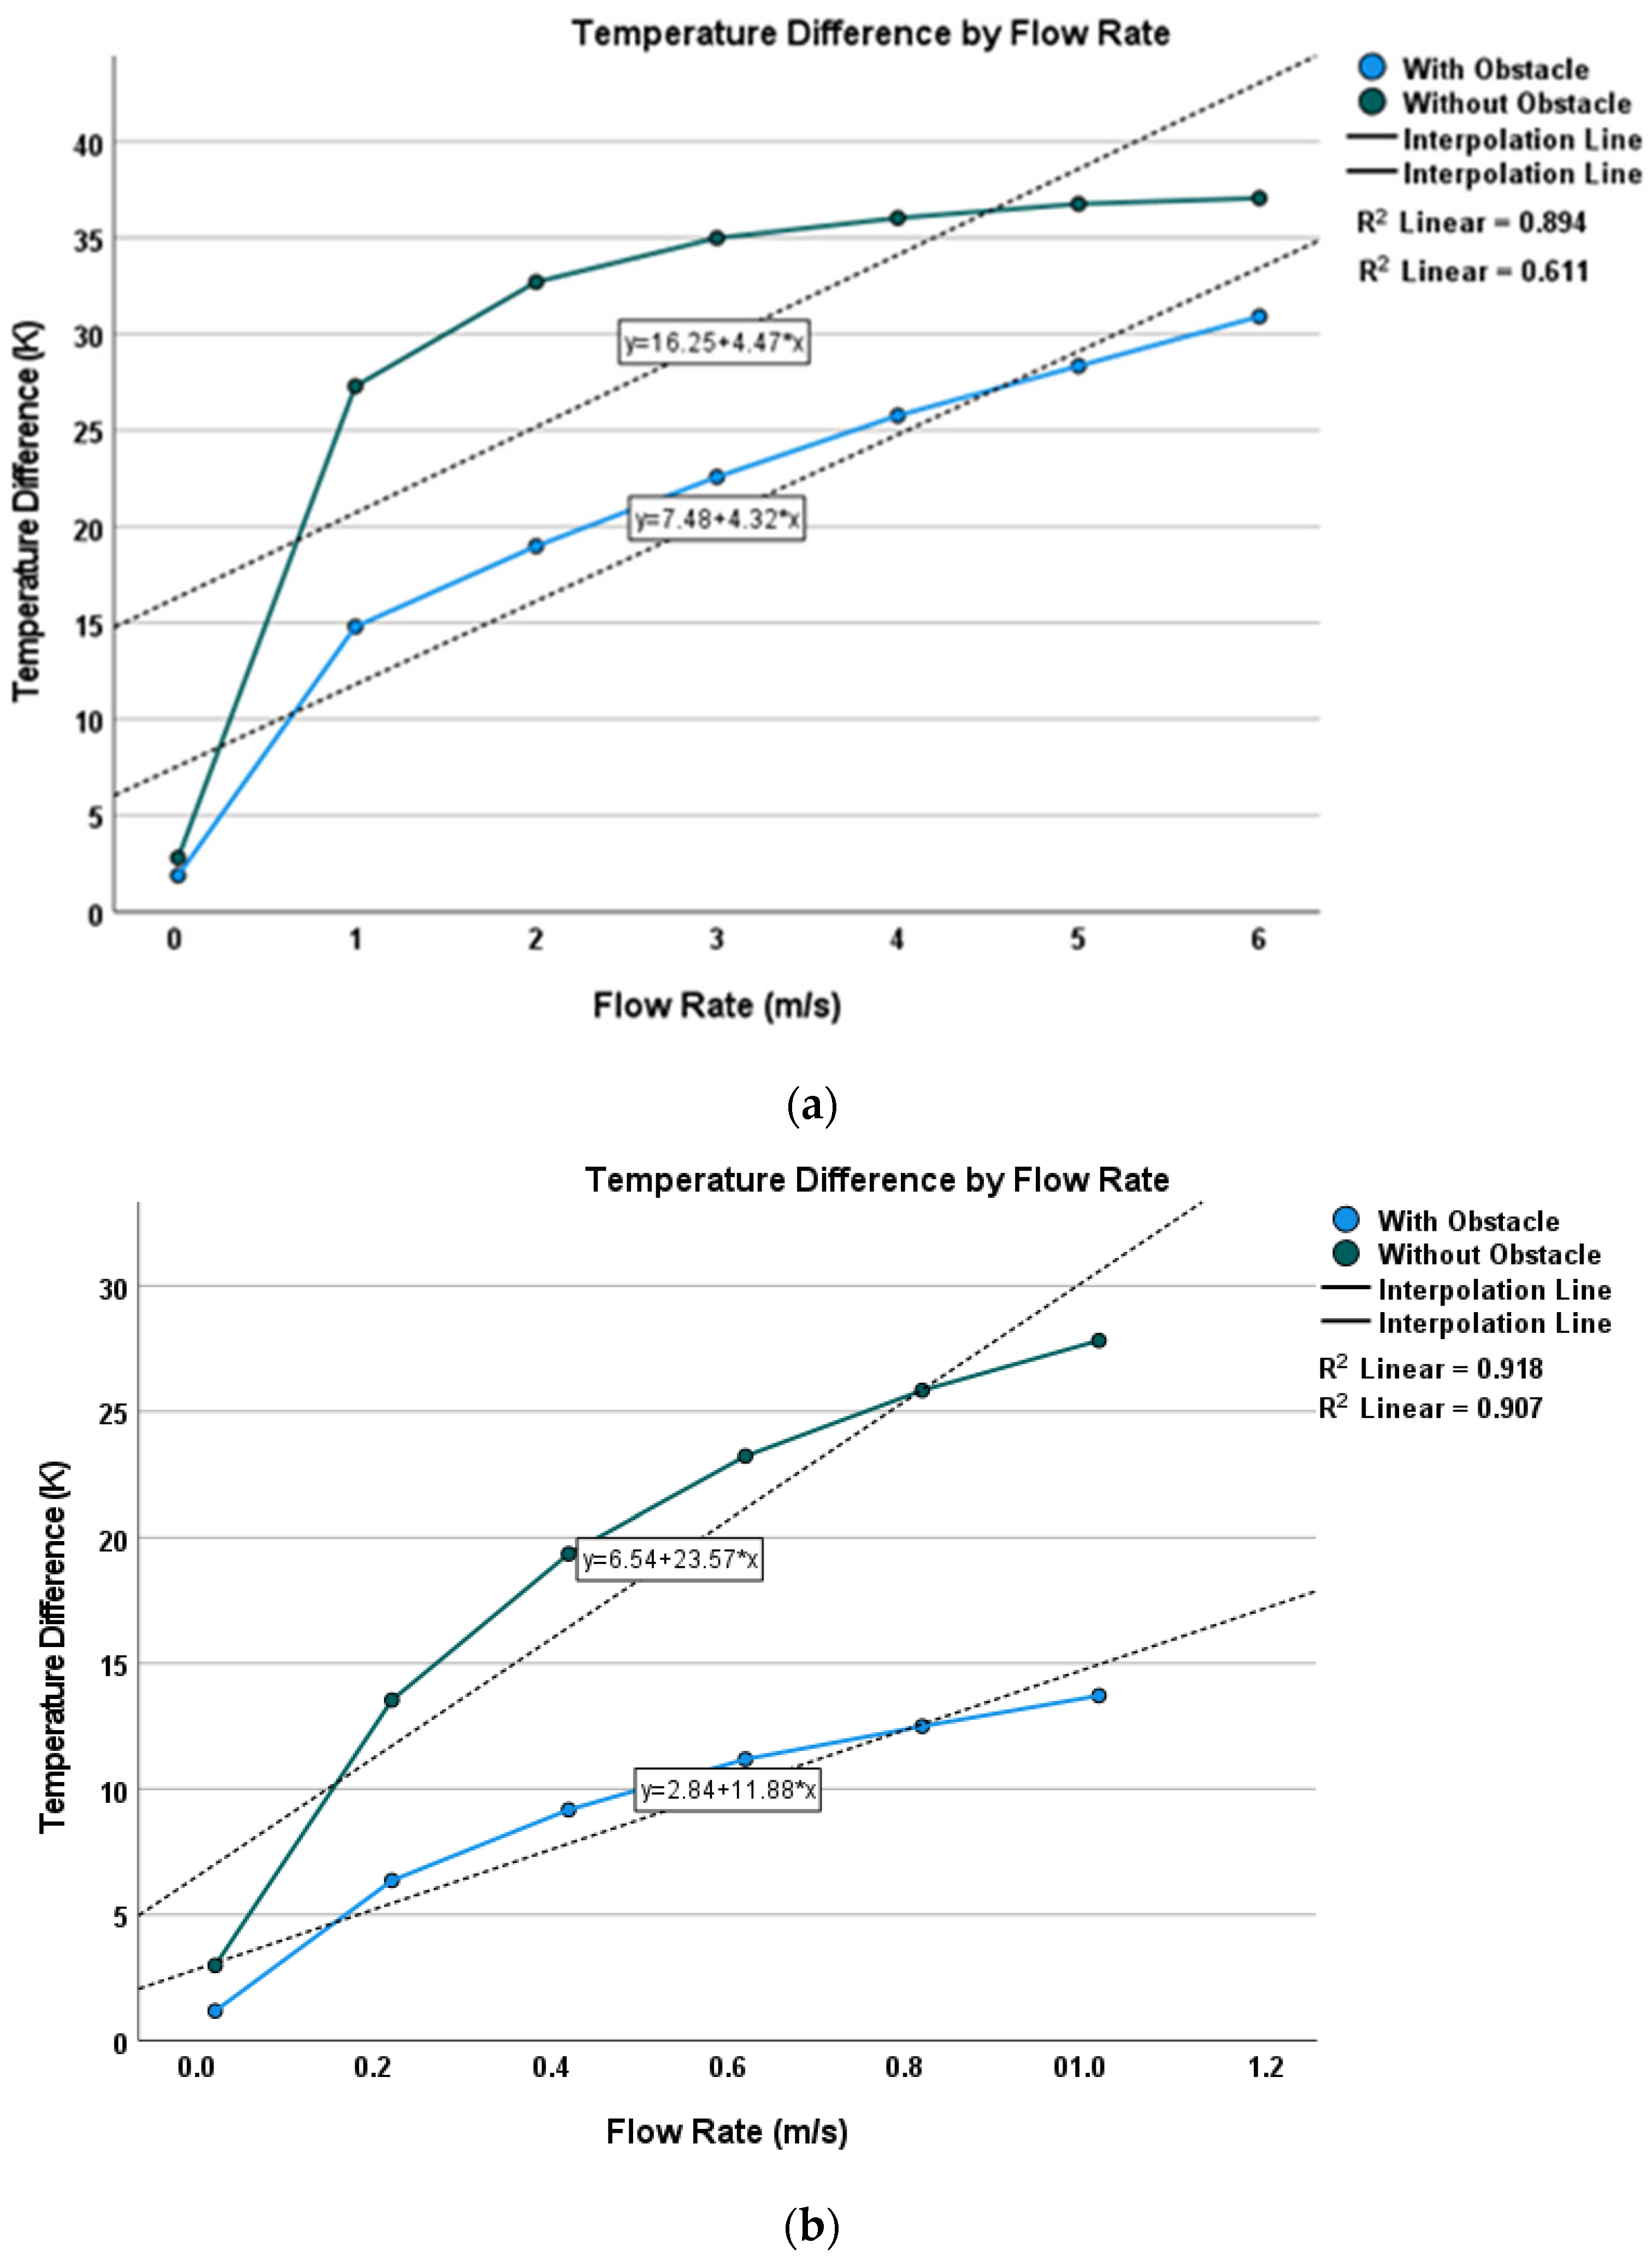
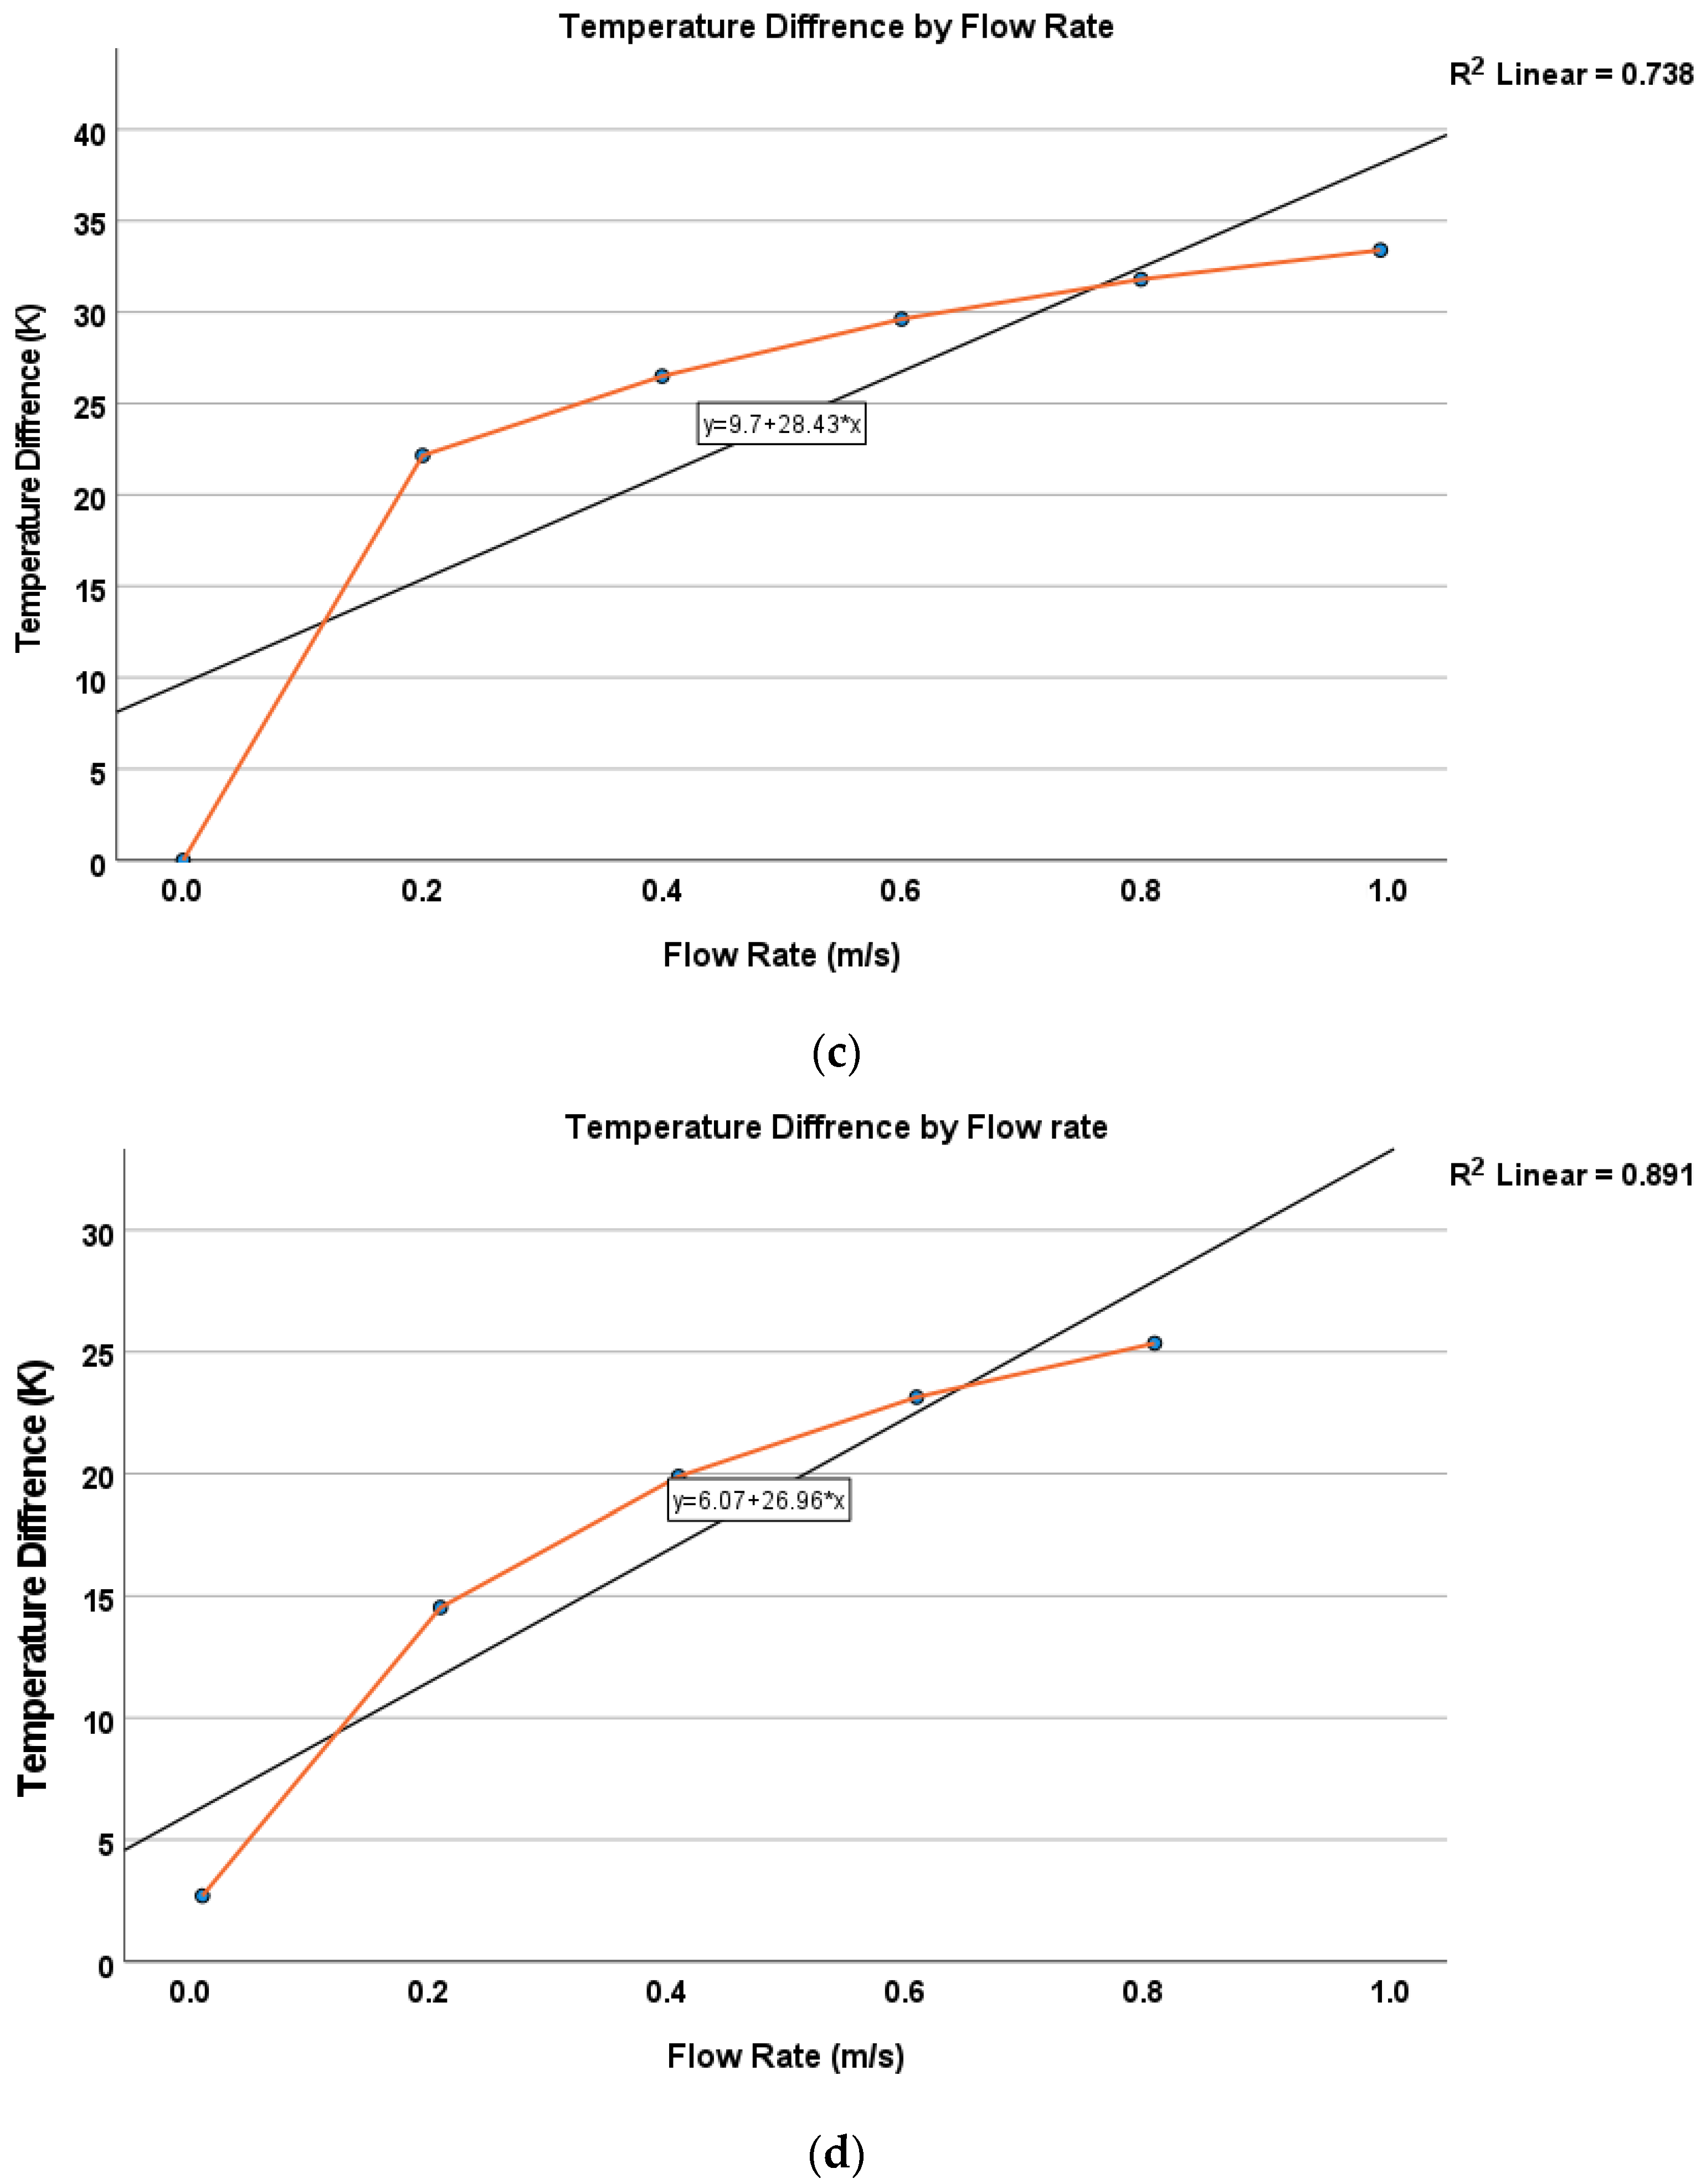
Figure 11 presents the simulated temperature variations for the proposed structure compared to prior designs. Chart (a) demonstrates the improved linearity and sensitivity of the proposed structure in response to changes in flow velocity. In contrast, chart (b) shows the temperature variations for the Valizadeh (2016) [
9] structure, which exhibits lower linearity compared to the proposed design. Similarly, chart (c) illustrates the temperature variations for the Takashi Kasai (2021) [
8] structure, further highlighting the performance advantages of the proposed design over previous approaches.
The comparisons indicate that the proposed structure outperforms previous designs in maintaining accuracy and sensitivity over a broader range of flow velocities [
8,
9]. In earlier structures, the sensitivity of the sensor was constrained by the design of its components, and the temperature–flow velocity relationship often exhibited nonlinearity, particularly at high speeds or under uneven flow conditions. In contrast, the proposed structure demonstrates significant improvements in both sensitivity and linearity, primarily due to the incorporation of obstacles in the sensor design. These obstacles reduce the gas velocity near the sensor, increasing the interaction time between the gas and the sensor, which enhances heat transfer and improves sensitivity.
The inclusion of obstacles has a positive impact on heat transfer and helps maintain the linearity of the sensor’s response even at higher flow velocities. These features enable the sensor to operate more accurately and linearly across a wide range of flow velocities, representing a substantial advancement over previous designs. Higher sensitivity allows the sensor to detect smaller changes in flow velocity, while improved accuracy ensures consistent and reliable measurements. Unlike earlier designs, the proposed structure maintains both sensitivity and linearity across a wide range of low and high flow velocities.
As shown in
Table 3, the sensitivity and linearity of the proposed structure are significantly improved compared to the three most recent studies. This demonstrates the sensor’s ability to operate effectively over a broader range of flow velocities with high accuracy and repeatability. These advancements underline the sensor’s applicability in more complex environments, such as HVAC systems and various industrial applications, where precise and reliable flow measurements are critical.


