Abstract
The accuracy of object detection is crucial for the safety and efficiency of traffic management in monitoring systems. Existing detectors, however, struggle significantly within complex urban scenarios where high-density occlusions among the targets occur, as well as extreme scale variations resulting from the size differences of vehicles and distance variations to the camera. To remedy these issues, we introduce DFE-YOLO, an enhanced multi-scale detection framework built upon YOLOv8 that fuses features from various layers at different scales through our ‘four adaptive spatial feature fusion’ module, which performs adaptive spatial fusion via learnable weights normalized by softmax and thereby allows effective feature aggregation across scales. The second contribution is DySample, which uses a lightweight, content-aware, point-based upsampling method to improve multi-scale feature representation as well as reduce imbalance across different object scales. The experiments conducted on the VisDrone-2019 and BDD100K benchmarks showed significantly superior performance against state-of-the-art detectors. Specifically, DFE-YOLO achieved a +4% and +5.1% boost over YOLOv10 in AP and APsmall. This study offers a useful fix for smart transport systems.
1. Introduction
The primary aim of object detection is to identify specific instances present within an image [1]. The rapid advancement of deep learning has led to considerable improvements in object detection technology. However, this field encounters numerous challenges when applied to traffic surveillance. The features of the detection task for driving monitoring are different from the general detection task, with the following factors making it more complicated: 1. Complex and dynamic scenes require monitoring systems to work in different types of streets, like urban roads, highways, intersections, and less populated paths. 2. The sizes of the objects vary greatly. Because the camera is usually mounted high up, the second point is that the objects appear small, and, thus, the actual size of the object varies greatly. Furthermore, variations in object scale are influenced by their semantic categories, such as vehicles or human subjects. 3. Objects are usually closely packed, especially on downtown roads and when traffic is heavy. On urban roads, in traffic jams, and with fewer visible distances, vehicles and people converge into one spot; this would be termed as occlusion or overlap. A high density of objects not only makes the problem more complex for detection but also can create false positives and missed detections. 4. Targets at far distances—where visibility is poor and occlusion is likely (for example, distant vehicles, pedestrians, or traffic lights)— have low resolution and various feature details, making it difficult for conventional target detection algorithms to identify them effectively. Thus, advancing algorithms for traffic surveillance by recognizing targets and augmenting their accuracy and reliability constitutes a crucial field of study.
Within the field of deep learning, object detectors are generally divided into two major types, namely, two-stage frameworks and one-stage models [2]. Two-stage models typically perform detection through a coarse-to-fine pipeline, while one-stage models predict object locations and classes in a unified step without intermediate proposals. Following the introduction of Fast R-CNN [3] in 2016, Ren et al. proposed Faster R-CNN [4], a significant advancement in two-stage detection. It was the first deep learning detector to operate in near real-time, and it introduced the region proposal network (RPN). Since then, numerous enhancements have been introduced to improve the performance and efficiency of Faster R-CNN-based architectures. One such improvement is RFCN, which was proposed by Jifeng Dai et al. [5] in 2016; it is faster than Faster RCNN. However, traditional CNN object detection networks usually only use the features of the last layer of the backbone for detection. Although the features in the deeper layers of the CNN are conducive to category recognition, they are not conducive to locating objects. To overcome the limitations of standard CNNs, the feature pyramid network (FPN) was introduced in 2017, combining high-level semantics with detailed low-level features via a top-down structure and lateral connections [6]. It refines multi-scale object detection by bridging semantic information at several scales and has a considerable improvement in object detection accuracy. Therefore, adding FPN to Faster R-CNN can drastically improve the detection accuracy of Faster R-CNN. Cascade R-CNN, proposed by Cai et al. [7] in 2018, introduces a Cascade R-CNN network with iterative bounding box (bbox) regression for the R-CNN part of Faster R-CNN, enhancing bbox quality and leading to high-quality detection results. Despite their accuracy, two-stage detectors tend to be structurally complex and exhibit slower inference speeds, which limits their practicality. Compared to two-stage frameworks, one-stage models produce class predictions and bounding box coordinates in a single pass from the input image, without the need for proposal generation [8]. This reduction in computational overhead leads to enhanced inference speed. Lin et al. introduced RetinaNet [9] in 2017, proposing the “Focal Loss” function to address the problem of extreme foreground–background class imbalance in dense detection. As a result of this innovation, one-stage detectors can attain accuracy levels that are comparable to those of two-stage detectors while preserving high detection speeds.
While general object detection tasks aim to localize and classify a wide range of object categories under diverse environments, traffic object detection focuses specifically on identifying road users and traffic-related targets in structured and often constrained environments such as streets, intersections, and highways. This domain-specific nature makes it essential to adapt detection models for challenges like occlusion, dense distributions, fixed viewpoints, and the prevalence of small-scale targets.
Despite the above successes achieved in object detection, current algorithms for object detection have their drawbacks when used in road traffic. For example, two-stage detection networks incur high deployment costs. Equally, the one-stage detection network fails to respond effectively to multi-scale and dense scenes. In this background, many scholars have improved existing object detection algorithms. Yang et al. introduced QueryDet, aiming to boost both the precision and processing speeds for detecting small-scale objects through methods such as the cascade sparse query (CSQ) mechanism [10]. To improve sample distribution issues like severe misalignment and imbalanced data due to the smallness of the target and the limitation of feature maps, Chang et al. proposed DCFL [11], a dynamic learning framework that progresses from coarse to fine levels in detecting small targets. Another significant area of research involves enhancing YOLO for traffic scenarios. BGS-YOLO [12], which was introduced in 2024, incorporates BiFPN to enable multi-level feature fusion and enhance the feature extraction capabilities for key targets. In YOLO-SGC [13], which was introduced in 2024, spatial channel information is captured better through SCConv and GAM to improve the driver’s dangerous behavior detection accuracy. In 2024, FU et al. proposed SNCE-YOLO [14]. SNCE-YOLO introduced SPD-Conv to make sure feature information survives training at low resolutions. Therefore, the methodologies have led to very notable gains in both detection precision and processing efficiency. BGS-YOLO has enhanced the precision and accuracy of multi-scale object detection through the integration of weighted bidirectional pyramid (WBiFPN). Furthermore, the model presents a novel SimC2f framework designed to improve the responsiveness of detection systems in real-time applications, resulting in BGS-YOLO demonstrating greater accuracy compared to YOLOv8. Nonetheless, it is important to acknowledge that BiFPN continues to exhibit shortcomings in both detection accuracy and speed concerning small objects. Despite these limitations, the optimization of multi-scale feature fusion to improve accuracy is a useful idea. In SNCE-YOLO, SPD-Conv effectively reduces the feature loss problem of traditional CNNs in small target detection through spatial-to-channel information reorganization and a 1-step convolution kernel. On the KITTI dataset, the MAP50 of YOLOv5s and YOLOv8s—both using SPD-Conv—has improved [14]. Although it may lead to increased computational complexity, feature blurring, and sensitivity to scale factor selection, it also provides a way to optimize the convolutional layer in order to mitigate feature degradation and enhance overall model detection capability.
This paper introduces DFE-YOLO, aimed at increasing detection precision in traffic-surveillance-related contexts. DFE-YOLO offers the following key innovations:
- (1)
- FASFF (a four-detection-head structure): To handle scale variation challenges in traffic object detection scenarios, this paper introduces the FASFF architecture. This structure incorporates an extra detection head alongside the original YOLO detection head and implements a feature fusion mechanism aimed at enhancing feature extraction across diverse scales.
- (2)
- DySample sampling strategy: In dense scenes, high similarity between background and target areas causes the model to be affected by background noise, which affects the extraction of target features. To address this issue, this paper uses the DySample sampling strategy to select feature points through a dynamic point sampling method, reducing the impact of background information on target features.
- (3)
- Introducing EIoU loss to optimize target box regression: The CIoU in YOLOv8 takes into account the IoU, center point distance, and aspect ratio. However, in scenes with a high density of objects, objects tend to overlap, and CIoU may not be able to accurately adjust the dimensions and position of the bounding box. This paper uses EIoU (Efficient IoU) as an optimization solution. It addresses the limitations of CIoU by adding explicit constraints on the width and height of the bounding box.
The paper begins by reviewing prior studies relevant to object detection. The Section 2 discusses related work, which includes YOLO and the model designed for traffic backgrounds in recent years. The Section 3 presents the method. It contains an overall description of the design of DFE-YOLO and a deeper consideration of the design principles of enhanced modules, like FASFF. The Section 4, which is the experimental section, describes all experimental specifics, including the setup, datasets, and training outcomes. In this section, ablation and comparison experiments provide empirical validation of the proposed improvements, supported by a comprehensive analysis of the results achieved in the experiments. These findings support a more thorough evaluation of DFE-YOLO’s performance across diverse datasets. In the Section 5, we summarize the work in this paper and discuss the contributions and possible future improvements.
2. Related Work
2.1. YOLO Network
YOLOv8 was officially presented by Ultralytics in 2023 [15]. During its development, YOLOv8 incorporated elements from the backbones and blocks of various object detection algorithms to a certain degree while making substantial modifications across its core components, including the backbone, neck, and heads. Compared to its earlier iterations—namely, YOLOv1 [16], YOLOv3 [17], YOLOv4 [18], and YOLOv5 [19]—there have been marked improvements in terms of detection precision and processing efficiency. The illustration of the YOLOv8 structure is shown in Figure 1.
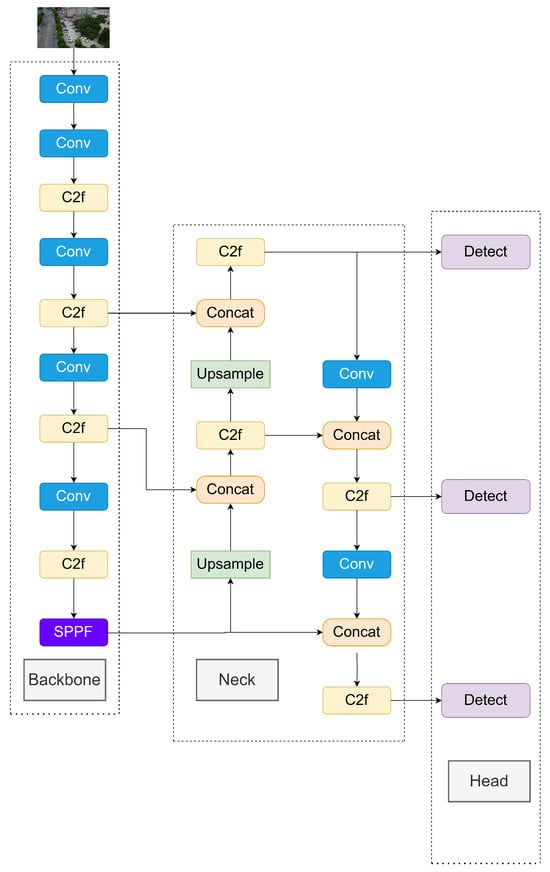
Figure 1.
YOLOv8 network structure.
YOLOv8 represents a significant advancement over previous YOLO models, characterized by its anchor-free design in the head and the integration of techniques such as decoupled head structures and DFL [20]. In the preprocessing phase, a range of data augmentation methods is integrated in order to enhance the model’s generalization ability. The backbone part uses an optimized CSPDarkNet53. In contrast to YOLOv5, YOLOv8 substitutes the C3 module with the C2f module, which facilitates a more robust gradient flow, as illustrated in Figure 2. The P3, P4, and P5 layers supply key features passed on to the neck for further processing. Within the neck module, YOLOv8 incorporates FAN [21] and PAN [22] structures to fuse multi-resolution representations derived from earlier layers. YOLOv8 still uses the C2f module in place of the original C3 module within the neck component and removes two upsampling convolutions. This structural design not only better implements multi-scale fusion, but also streamlines the model structure.
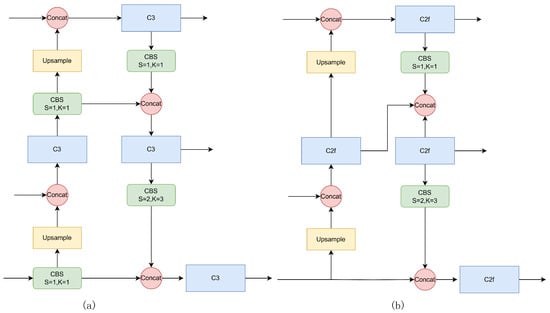
Figure 2.
(a) The structure of YOLOv5, and (b) the structure of YOLOv8.
At the same time, an anchor-free approach is implemented for the augmentation of the precision as well as the efficiency of the detection process. With these enhancements, YOLOv8 has delivered good results in tasks related to the detection of general objects. According to the official documentation, it has achieved high accuracy on datasets such as COCO and Open Images V7.
However, the YOLOv8 model can only detect predefined object categories. To overcome this constraint, T. Cheng et al. introduced YOLO-World [23] based on YOLOv8 in 2024, proposing a novel RepVL-PAN framework that can be re-parameterized, which enables efficient object detection beyond fixed category vocabularies while ensuring accuracy. YOLOv10 [24] was proposed in 2024 by Wang Ao of Tsinghua University. It not only achieves real-time end-to-end object detection, but also uses NMS-free training to improve inference speed. Integrating these two innovations allows YOLOv10 to balance speed and accuracy.
2.2. Improved Detection Networks in Traffic Surveillance
Some researchers have optimized detection algorithms for traffic monitoring scenarios to better handle specific variations, such as illumination changes, object scale differences, and targets of the same scale that vary over time. For example, CSIM was proposed by Lu et al. [25] in 2023 as a target detection model designed to handle different scales and illumination invariability; it serves as a modality for coping with large deformations and illumination changes in outdoor scenes. The application of ASFF and an illumination-invariant chrominance space module has been shown to boost the model’s ability to cope with illumination changes and learn features across multiple scales; hence, this will also enhance its features at several scales. Meanwhile, in traffic surveillance detection, owing to the alteration of the target’s location, the same target’s structure and scale will be changed as well. To deal with the issue of target deformation, the proposed Bi-STN-YOLO [26] is a modification of the above method. In Bi-STN-YOLO, CSP-BiFPN is used for cross-stage feature fusion, and an enhanced spatial transform network (ESTN) is used for better detection performance of the detector on deformed targets. Guo Keyou et al. [27] made the SSD object detection algorithm more accurate and improved model generalization capabilities by increasing training data; this was achieved by adjusting color spaces and adding spatial coordinate transformation through affine methods. In another approach, Cao Jinghao et al. [28] adopted HRNet as part of the Faster R-CNN model. This approach enhanced feature map quality by iteratively fusing features at multiple scales. The latest work presented in 2023 by Ning Jia et al. is referred to as TFGNet [29]. It has a lightly designed LMIF module that overcomes the real, demanding difficulty of vast object size changes due to traffic. Its functions utilize various convolutional receptive fields to extract multi-scale representations from the object features. In 2024, Wang Tong et al. proposed MMW-YOLOv5 [30]. This work significantly improves the model of the YOLO algorithm. An improved path aggregation feature pyramid network (PAFPN) has been built to make the model better at combining multi-scale information to find multi-scale targets. This allows the network to fuse information from different scales better, thus teaching the model how to spot small-sized objects while increasing the accuracy of detection.
Building upon the aforementioned studies, this work proposes a target detection network based on YOLOv8 for traffic monitoring scenarios with multiple target scales to achieve improved accuracy. It is compared with existing excellent YOLO models, such as YOLO-World and YOLOv10, to verify its effectiveness.
3. Method
YOLOv8 performs well in terms of detection precision and inference efficiency, yet opportunities for further enhancement remain when faced with difficulties stemming from densely packed targets and inconsistencies in object scales in traffic monitoring scenarios. At the final detection head stage, the relative independence of the three detection heads may lead to the underutilization of multi-scale information. In addition, the neck part of YOLOv8 adopts the nearest neighbors upsampling method, potentially resulting in information degradation during the extraction phase due to the detection environment. In relation to the loss function, identifying a more appropriate loss function tailored to the traffic monitoring context represents a significant method for enhancing both the convergence rate and the ultimate accuracy of the model. To tackle the challenges present in the traffic monitoring context and in light of the previously outlined improvement strategies, this study presents a newly developed detection framework derived from YOLOv8L, referred to as DFE-YOLO. Specifically, the detection head and feature fusion are integrated to enrich multi-scale feature representation; a dynamic sampling strategy is adopted to improve the accuracy of feature extraction; and the limitations of CIoU [31] in the traffic monitoring scenario are explored, highlighting the importance of loss function optimization in boosting model performance. The experimental findings indicate that the detection accuracy of DFE-YOLO across various traffic datasets surpasses that of the original YOLOv8, demonstrating competitive performance relative to general detectors at this point in time. The DFE-YOLO structure and corresponding improved modules will be described in detail below.
3.1. Overall Structure of DFE-YOLO
The DFE-YOLO architecture builds upon the core framework of YOLOv8 and the requirements of the object detection task in traffic monitoring scenarios. DFE-YOLO is illustrated in Figure 3. There are four parts in DFE-YOLO, as follows: 1. Backbone: Uses the backbone structure of YOLOv8 but also transmits the feature map of P2 to the neck part. 2. Neck: Following the design ideas of YOLOv8’s neck (FAN+PAN), a sampling module, a convolution module, and a concatenation module are added to fuse the features, and the original upsampling layer is replaced with DySample [32]. 3. Head: Design a FASFF structure detection head and introduce an adaptive feature fusion mechanism. 4. Modify the loss function CIoU to EIoU [33].
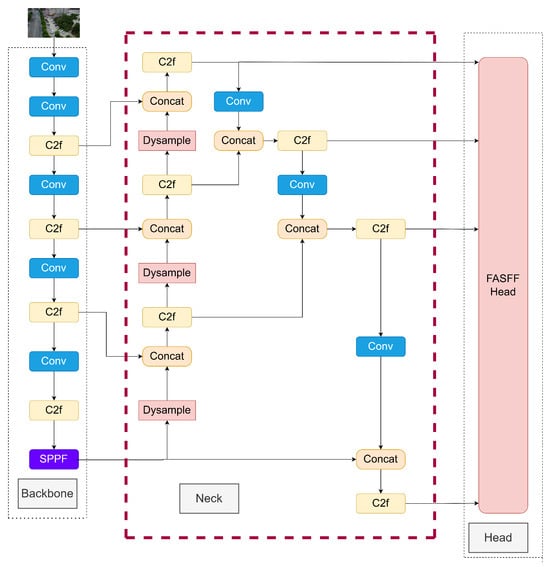
Figure 3.
DFE-YOLO network structure.
3.2. FASFF
In the head part, the decoupled-head mechanism separates the classification and localization tasks. This design reduces the conflict between the classification task and the detection task. In detail, to boost YOLOv8’s detection capabilities for objects of different scales, the head part designs a separate detection layer for P3, P4, and P5 from the neck. The input features will then enter different branches according to the task requirements. In the detection branch, the input feature map will first enter two CBS modules for feature extraction and then enter a convolutional layer to output prediction results, as illustrated in Figure 4.
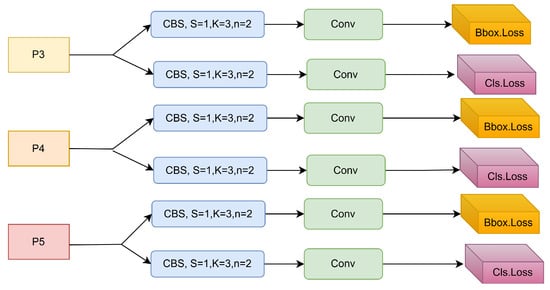
Figure 4.
YOLOv8 head structure.
The three detection heads of YOLOv8 are independent of one another and do not take into account multi-scale feature fusion. Within the neck, YOLOv8’s PANet structure concatenates the feature maps through the concat layer, without considering the problem that different levels of features contribute differently to the final detection result. At the same time, because feature maps of different scales are directly concatenated, high-level features may have a greater impact on small targets. In the traffic monitoring scenario, there exists an uneven distribution of target scales, with a considerable proportion of small targets. Therefore, adding more scale features is an effective strategy to enhance detection performance.
To address the limitations mentioned above, we extend the original three-head YOLOv8 architecture by introducing an additional P2-level detection head. This fourth detection branch targets low-level, high-resolution feature maps, which are crucial for improving the detection of tiny objects that frequently appear in traffic monitoring scenarios. By incorporating the output from an earlier backbone layer, we provide more detailed spatial information for the subsequent detection stages. The inclusion of the P2 head not only enhances granularity but also complements the FASFF module’s ability to adaptively fuse features across four different scales (P2P5). This design forms a complete multi-scale detection framework, offering improved detection precision across a wider range of object sizes.
The outputs from the second, fourth, sixth, and ninth layers of the backbone are utilized as inputs for the neck component, with the addition of the detection layer specifically designed for tiny objects. With reference to the adaptive feature fusion module (ASFF) [34], the feature output from the neck is weighted and fused across scales. Different weights are assigned to features of different scales to increase the semantic richness of crucial feature representations. After feature aggregation, the result is passed into the original detection head of YOLOv8. Figure 5 shows the FASFF mechanism.
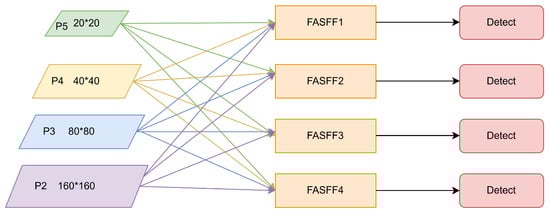
Figure 5.
FASFF mechanism.
The feature maps at different scales come from different layers, which causes the channel numbers and dimensions to be different. Hence, in FASFF, it is paramount to make the output feature channel numbers and spatial dimensions of the four detection layers equal to each other so that these feature maps are well fused. FASFF resizes (up or down) feature layers of different scales, and the number of channels and dimensions is also defined for convolution operations, as illustrated in Figure 6.
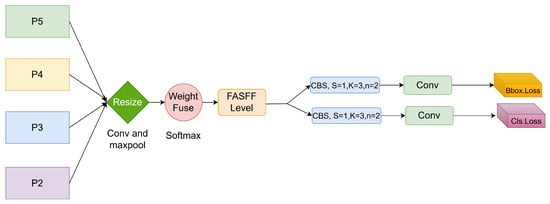
Figure 6.
FASFF structure. Inputs of different sizes are weighted and fused after adjustment to obtain new feature information, which is then input to the detection head.
If the feature map resolution of a layer is low, it needs to be upsampled, and the number of channels and dimensions need to be matched. Specifically, the channels are adjusted through a convolution, and then nearest neighbor interpolation is used to match the dimensions [34]. When the feature map resolution is high, downsampling is required. In the downsampling process, when the downsampling ratio is 1/2, FASFF employs a 3 × 3 convolution with a step size of 2 to reduce the dimension. When the downsampling ratio is 1/4, it needs to be combined with maximum pooling [34]. To illustrate this process, consider the FASFF3 layer configuration. For the feature map of the P2 layer, a 3 × 3 convolution is used to keep the channels and resolution consistent with the feature map output by P3. For P4, the number of channels is first reduced from 512 to 256 using a convolution, and then interpolation is used to enlarge the size of P4 to match P3. In the FASFF1 layer, P3 needs to go through a max pooling layer with a stride of 2 first, and then a 3 × 3 convolution is used to make the channels and resolution of P3 consistent with P5.
After adjusting the number of feature channels and the size of the feature map, FASFF utilizes adaptive weighted fusion. The representation transformed between layer n and layer l is denoted as , where specifies its location within the corresponding feature map. represents the final fused feature vector on the feature map. , , , and are learnable weighting parameters that indicate the contribution of each scale of the feature. The final fused feature vector is expressed as follows:
where , , , and are the weight parameters calculated by the convolution layer. All weight parameters are between , and softmax normalization ensures that the sum of the weight parameters is 1. That is, the following equation is satisfied:
The weight parameters can all be learned using backpropagation [34]. The gradient propagation formula is as follows:
To prevent negative samples from interfering with the calculation, the weight parameters with low contribution can be set to 0, thereby reducing the redundancy of the calculation.
3.3. DySample
The original YOLOv8 uses nearest neighbor interpolation for upsampling. Nearest neighbor interpolation simply fills in the image with the nearest pixels to enlarge the image size [35]. However, this method exhibits certain drawbacks. Firstly, it does not take into account the changes in features that occur in adjacent pixels. Secondly, it is susceptible to sudden changes in the interpolation results, which can lead to the appearance of jaggedness and blurring of boundaries in the sampled image. In traffic monitoring scenarios such as heavy traffic and highway monitoring, the background is complex, and the targets are dense. In this case, nearest neighbor interpolation is prone to upsampling the low-resolution feature layer, which easily causes small target features to be covered by surrounding pixels, thus affecting the detection results. In consideration of the characteristics of traffic monitoring scenarios and the limitations of nearest neighbor interpolation, a dynamic upsampling strategy, termed DySample, is introduced to substitute the traditional upsampling module in YOLO. Unlike fixed interpolation, DySample determines the specific location of upsampling by learning the offset of each pixel, enhancing the ability to retain features. Figure 7 illustrates the design process of DySample [32].
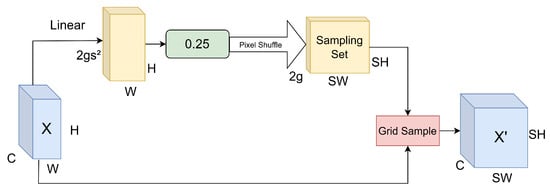
Figure 7.
DySample module.
Given an input feature map X, a linear transformation produces an offset tensor with shape (2gs²) × H × W. To avoid a situation where the offset range of the sampling points overlaps, resulting in artifacts, the offset range is constrained by multiplying the offset by 0.25 (static range factor). Then, the offset is reorganized via the pixel shuffle into a shape of 2 × sH × sW, corresponding to the target resolution. This offset is subsequently added to the coordinates of the initial sampling grid, generating the final sampling locations. In high-density scenes, like areas with many pedestrians and vehicles, DySample can adaptively adjust the sampling points, making the upsampled target boundaries clearer and reducing the problem of feature blurring. During the FASFF fusion process, DySample provides more accurate upsampling results, which improves feature consistency and the quality of the fusion. In the task of traffic monitoring, the dynamic point sampling strategy employed by DySample proves to be effective at minimizing the loss of detail concerning small objects during the upsampling phase. When combined with FASFF for multi-scale information fusion, the final detection results are more stable, the false detection rate drops significantly, and the model maintains higher stability under challenging conditions.
3.4. Improving the Loss Function
A suitable loss function can facilitate a quicker convergence of the model, thus enhancing its final performance. The default bounding box loss function utilized by YOLOv8 is CIoU. The CIoU [31] loss function is represented in the following equation:
Compared with the previous DIoU, CIoU takes into account the disparity in aspect ratios between the predicted and actual bounding boxes. Specifically, in the CIoU [31] formula, v quantifies the disparity in shape proportions between boxes, while a serves as a coefficient to regulate its impact. The expression for v is defined as follows:
and refer to the width and height that define the size of the target box, while w and h represent the actual box’s corresponding width and height.
However, there may be numerous small-scale objects frequently appearing in traffic surveillance environments. As a result, CIoU exhibits poor performance in detecting objects under traffic surveillance conditions. Firstly, it is evident from the Formula (4) for determining v based on CIoU that v is solely able to evaluate the similarity between the ratio of width to height between the real and expected bounding boxes. However, because the sizes of tiny objects are small, even if the aspect ratios are similar, the predicted box may still have a large error.
In this paper, the EIoU [33] is employed in place of CIoU. The following presents the EIoU loss function:
In the EIoU formula, denotes the variation between the estimated box width and the ground truth box width, while signifies the deviation in height between the predicted and true bounding boxes [33]. and indicate the width and height of the smallest enclosing region covering both the predicted and actual boxes [33].
EIoU logarithmically varies the width and height so that the errors of targets of different scales are within the same numerical range. And unlike CIoU, which does not take into account the numerical differences in true width and height, EIoU introduces a logarithmic scale error for width and height to better align the predicted bounding box with its corresponding ground truth, reducing false positives.
Recently, advancements to the loss function have been made, including the introduction of SIoU [36] and WIoU [37]. This paper also combines traditional loss functions, such as DIoU [38] and GIoU [39], to compare their performance with that of the EIoU loss function. The evaluation outcomes on the VisDrone-2019 test set are as Table 1:

Table 1.
The results of DFE-YOLO with different loss functions. Bold numbers indicate the best performance in each column.
Comparing the results of the experiments, it is found that the model achieves better accuracy when EIoU is improved in conjunction with DySample and FASFF.
4. Methodology
4.1. Dataset Description, Evaluation Metrics, and Experiment Setting
In the experiment, VisDrone-2019 [40] and BDD100K [41] were utilized as benchmark datasets. The VisDrone-2019 images were captured by a drone camera flying at different heights above various cities. The dataset consists of 8629 photographs and 10 separate annotations. These categories include people, pedestrians, tricycles, bicycles, cars, vans, trucks, awning tricycles, motorcycles, and buses. For the purposes of this experiment, 6471 images were designated as the training set, 548 images were allocated for testing, and 1610 images were for the validation set. In accordance with the evaluation protocol of the MS COCO dataset, the target sizes are classified as follows: small targets have an area of less than , medium targets have an area of < area < , and large targets have an area of more than . The VisDrone dataset was examined in accordance with the previously stated criteria to ascertain the distribution of targets of varying sizes.
As shown in Figure 8, small targets constitute a large share of the VisDrone dataset compared to large and medium targets. The images presented in Figure 9 further illustrate that the VisDrone dataset encompasses characteristics such as changing backgrounds (night and day), dense detection targets, and targets of varied dimensions.
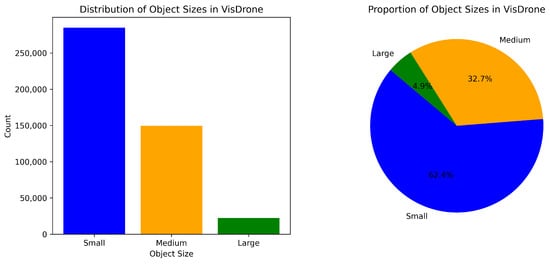
Figure 8.
Distribution of annotated objects in the VisDrone dataset.
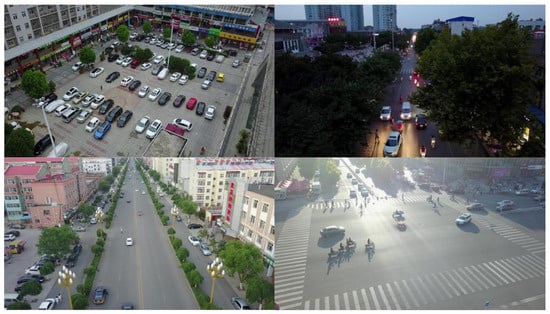
Figure 9.
Some example images from VisDrone.
In contrast to the VisDrone dataset, the BDD100K dataset encompasses 10 distinct categories. Nevertheless, the BDD100K dataset boasts a significantly larger number of images. From the 100,000 images, 80,000 labeled images were chosen, with 70,000 allocated to the training sets and 10,000 to the validation sets.
In regard to the selection of evaluation metrics, this study utilizes AP, AP50, and AP75 to assess how accurately each object class is detected, in accordance with the evaluation protocol of the MS COCO dataset. This method enables a comparison between the results of this YOLO model and those of other models. The term ‘AP’ refers to average precision over all the categories, while ‘AP50’ and ‘AP75’ refer to average precision values at 0.5 IoU and 0.75 IoU, respectively, for all categories. In the study, the sizing of targets formed the basis of the performance evaluation. ‘APsmall’ is the average accuracy of small targets, which is of area size < . Other metrics include precision and recall.
In this experiment, the model was trained on an NVIDIA A100 graphics card with CUDA 12.1, cuDNN 8.9.1, and Python 3.12. The batch size was 8, and 200 rounds of training were carried out. The other hyperparameter settings are shown in the Table 2.
Table 2.
Hyperparameter settings.
4.2. Ablation Studies
This section will discuss the speedups brought about by the changes implemented in the DFE-YOLO model. The ablation experiments were carried out using YOLOv8L to see the contribution of each model to the overall performance. The VisDrone-DET 2019 test set was used to check how well each module of DFE-YOLO improved the network YOLOv8L. The design of the ablation experiment is as follows:
- (1)
- Ablation A1: substitute the head with the FASFF four-detector head.
- (2)
- Ablation A2: use DySample instead of the original YOLO upsampling layer.
- (3)
- Ablation A3: modify the loss function from CIoU to EIoU.
To ensure fairness, the same experimental environment and training settings were employed in all ablation experiments. The ensuing table presents the experimental results.
From Table 3, the following conclusions were drawn:
- Overall performance has improved. On the VisDrone-DET2019 dataset, DFE-YOLO outperforms YOLOv8L in terms of AP, AP50, and AP75.
- FASFF contributes more. In the VisDrone-2019 dataset, small objects account for a large proportion, and the object density is high. Therefore, adding detection heads, especially small target detection heads, has the most obvious improvement. The results of the ablation experiment A1 indicate that the incorporation of the enhanced small target detection head leads to an increase in the average precision at IoU = 0.50 (AP50) from 34.8% to 37.1%, while the average precision for small objects (APsmall) rises from 9.6% to 12%.
- The DySample sampling strategy combined with FASFF results in enhanced detection performance. In the A2 experiment, the integration of DySample as the upsampling strategy results in an additional improvement in AP, building upon the gains achieved through FASFF. It is confirmed that the DySample strategy can help the model better learn multi-scale target features through its dynamic sampling and balanced sample distribution, especially when dealing with complex scenes. FASFF can abstract informative features from feature maps at different scales and adjust fusion weights dynamically according to the target characteristics. When DySample works together with FASFF, in that case, DySample gives good samples, enabling FASFF to do more precise and efficient feature fusion.
- When DySample is integrated with FASFF, the performance of EIoU loss shows significant improvement. This combination enhances target box localization and increases precision for detecting small-scale objects and bounding box regression. Consequently, the general detection accuracy of the model experiences further enhancement, as reflected by a 0.2% increase in both AP and AP50. Meanwhile, its ability to identify small-sized targets also improves, leading to a 0.2% increase in APsmall.
Table 3.
Ablation study results. Bold numbers indicate the best performance in each column. ✓ indicates the inclusion of the corresponding module.
Table 3.
Ablation study results. Bold numbers indicate the best performance in each column. ✓ indicates the inclusion of the corresponding module.
| A1 | A2 | A3 | AP (%) | AP50 (%) | AP75 (%) | APsmall (%) | |
|---|---|---|---|---|---|---|---|
| YOLOv8L | 20.3 | 34.8 | 20.9 | 9.6 | |||
| DFE-YOLO | ✓ | 21.4 | 37.1 | 21.9 | 12.0 | ||
| ✓ | ✓ | 22.0 | 38.4 | 22.2 | 12.3 | ||
| ✓ | ✓ | ✓ | 22.2 | 38.6 | 22.5 | 12.5 |
To validate the effectiveness of the proposed FASFF module, we compare it with several widely adopted multi-scale feature fusion strategies, including BiFPN [42], RepGFPN [43], and a customized PANet variant implemented in PaddleDetection [44]. As shown in Table 4, FASFF consistently outperforms these alternatives on the VisDrone test set. Notably, it achieves a 2.1% improvement in APsmall over the YOLOv8L baseline and a 1.6% gain over BiFPN. These results demonstrate the advantage of FASFF, particularly in enhancing small-object detection performance under complex urban surveillance scenes characterized by dense and multi-scale targets.
Table 4.
Performance comparison of different feature fusion and upsampling strategies on the VisDrone-2019-DET-test dataset.
We also explore the effects of various upsampling techniques integrated within the FASFF module. As shown in Table 4, bilinear interpolation, transposed convolution, and our DySample-based strategy all provide performance improvements over the YOLOv8L baseline. Among them, DySample achieves the best overall performance, reaching 22.0% AP and 12.3% APsmall, while maintaining a high inference speed of 65.7 FPS. This balance between detection accuracy and runtime efficiency makes DySample particularly suitable for real-time traffic surveillance tasks on edge devices.
4.3. Comparative Experiments
To assess the progress of the DFE-YOLO network, this study conducts a comparison of its performance against several notable object detection networks.
The data illustrated in Table 5 demonstrate that DFE-YOLO surpasses other target detection techniques in performance. At the high IoU threshold (AP75), the accuracy of DFE-YOLO (30.7%) is higher than CenterNet [45] (27.6%), QueryDet (28.8%), and Faster R-CNN (20.1%), combining FPN and ResNet-101. At an IoU of 0.5, DFE-YOLO attains an accuracy of 48.4%, exceeding the performance of Cascade R-CNN (38.5%), DMNET [46] (48.1%), and RetinaNet (29.2%). These results show that DFE-YOLO has better target recognition capabilities than these classic networks.
Table 5.
Comparisons between the DFE-YOLO network and some networks [11,47,48] on the VisDrone-2019-DET-Val dataset. Bold indicates the best performance in each column.
Although our proposed model outperforms other models in overall AP and AP50/ 75 metrics, CenterNet demonstrates strong performance in the APsmall metric. As shown in Table 5, CenterNet achieves an APsmall score that is 0.3% higher than that of our model. This indicates that CenterNet has a relative advantage in capturing fine-grained spatial details. APsmall is a critical metric in dense traffic environments where small-scale targets, such as pedestrians and distant vehicles, frequently appear. Despite its lower overall AP, CenterNet’s superior APsmall highlights its competitiveness in specific detection scenarios.
The improved performance is due to several key factors. Compared with the classic network, DFE-YOLO not only inherits the backbone network of YOLOv8 but also adopts a four-detection-head architecture. The addition of a supplementary object detection head enhances the model’s effectiveness in recognizing small objects. Additionally, DFE-YOLO adopts the adaptive spatial feature fusion (ASFF), which improves multi-scale object detection by dynamically fusing features across different resolutions. Moreover, in the feature upsampling stage, DySample selects more effective feature points through a point sampling strategy instead of the former kernel-based one. This leads to more accurate feature upsampling inputs and improves the input quality for the FASFF detection head, thus boosting detection accuracy.
However, DFE-YOLO remains a constituent of the YOLO series; thus, a comparison with the conventional detector alone does not provide a comprehensive evaluation of its performance advantages. Consequently, further research is necessary to assess the performance of DFE-YOLO within the YOLO series, thereby substantiating its continued competitiveness within the YOLO framework. Within the same experimental environment, this study selected YOLOv5L, YOLOv8x (the version with the highest accuracy in the YOLOv8 series), YOLOv10, and DFE-YOLO for comparative experiments, given that DFE-YOLO is based on YOLOv8L.
To better highlight the advantages of the DFE-YOLO architecture in complex target detection scenarios, Figure 10 shows a detection comparison result in a typical complex scene. It is a very cluttered scene with many small objects, and some of the items are occluded by other objects, for example, trees. In addition, objects also come in various sizes and shapes. As shown in Figure 10, the DFE-YOLO network has lower missed detection and higher detection rates compared to other YOLO networks.
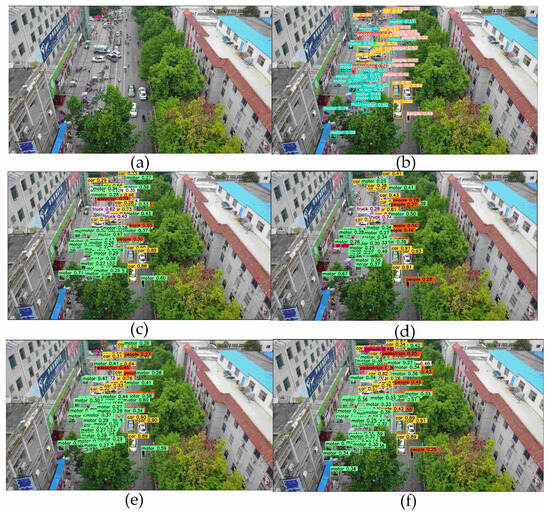
Figure 10.
(a) and (b) YOLOv5L, (c) YOLOv8L, (d) YOLOv10L, (e) YOLO-World, (f) DFE-YOLO implementation of the original image and object detection results.
From the results in Table 5, in comparison with YOLOv5L, YOLOv8x, and YOLOv10L, DFE-YOLO achieves higher accuracy on the VisDrone-2019 dataset than the compared networks. The VisDrone-2019 dataset is predominantly composed of aerial imagery obtained from drones, with a considerable emphasis on small targets within the dataset. As a large-scale autonomous driving dataset, BDD100K contains complex environments such as rainy days, daytime, and nighttime. At the same time, compared with the 8692 images of VisDrone-2019, BDD100K has a larger amount of data. Moreover, 80K labeled images in the dataset are used for experiments. The complexity of the dataset and the larger sample size provide a more rigorous test for the scalability of the network and for handling different target scales and environmental conditions.
From the results presented in Table 6, DFE-YOLO achieves higher accuracy than YOLO models such as YOLOv8L on the BDD100K dataset. In real applications, small- and long-range target detection in autonomous driving is crucial. In terms of small target detection accuracy, DFE-YOLO’s APsmall is 13.8%, which is 3% higher than YOLOv8L (10.8%) and higher than other YOLO networks compared. This result shows that DFE-YOLO has certain advantages in small target detection.
Table 6.
Comparisons between the DFE-YOLO network and other YOLO networks on the BDD100K validation dataset. Bold indicates the best performance in each column.
Beyond excelling in detecting small targets, DFE-YOLO shows strong capability in medium and large target detection. From the data presented in Table 6, it can be inferred that DFE-YOLO attains high accuracy across all target sizes when compared to alternative YOLO models. In terms of small target detection accuracy, DFE-YOLO’s APmedium is 36.5%, which is 1.8% higher than YOLOv8L (34.7%). This improvement is due to the innovative application of the FASFF strategy. FASFF not only adds a detection head to increase the input of the feature scale of small targets, but also adopts adaptive feature space fusion. Adaptive feature space fusion enables the DFE-YOLO to fuse different feature maps. This approach enables the network to integrate information from multiple resolutions more effectively, thereby enhancing the detection accuracy of diverse targets. At the same time, the experimental results also indicate that the improvement of the combination of DySample and FASFF strategies is generalizable. In autonomous driving scenarios. This dual enhancement approach not only increases the precision of small target detection but also guarantees that the model can sustain consistently high performance across all target sizes.
Although DFE-YOLO and YOLOv8L have the same accuracy in large target detection, the improvement in detection capabilities for small and medium targets has significantly improved the overall accuracy of DFE-YOLO. This is reflected in the higher overall average precision (AP) of DFE-YOLO compared to other networks.
The PR curve is employed in this work to evaluate DFE-YOLO, with experiments conducted on the BDD100K. The value of precision is depicted in the PR curve shown in Figure 11 and stands for mPrecision, or mean precision over all the categories. The calculation procedure can be written in detail as described below:
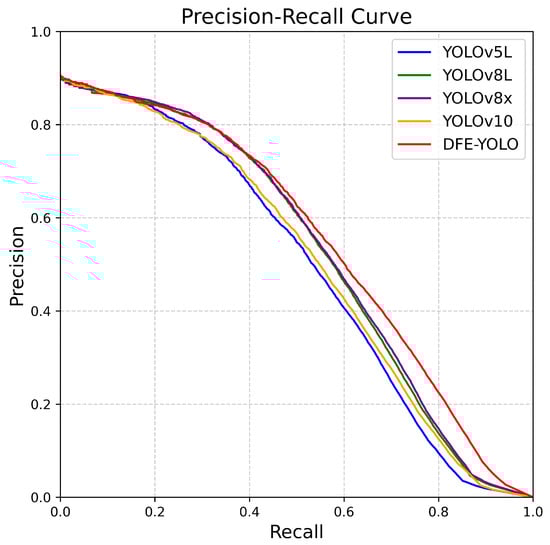
Figure 11.
PR curve (mean precision over all classes).
In this context, “N” refers to the number of all classes, and “” indicates the precision for the i-th class.
The PR curve is indicative of the average precision trend of disparate models at varying recall rates. As depicted in Figure 11, DFE-YOLO exhibits enhanced performance in comparison to other YOLO models. Notably, at recall > 0.6, DFE-YOLO exhibits a commendable precision, suggesting a minimal false detection rate and optimal detection stability at high recall rates.
The results from experiments on various datasets prove conclusively that DFE-YOLO has the ability to tackle the difficulties faced in detecting objects in traffic monitoring scenes. With advanced feature fusion methods, highly specialized small target detection heads, and dynamic sampling strategies, DFE-YOLO performs very well in detecting targets across various sizes. More specifically, outcomes on the BDD100K dataset further prove that the model holds adequate potential in increasingly complex settings and can find wide application in real-life applications.
4.4. Deployment Feasibility Analysis
We analyze the computational cost and runtime efficiency of the proposed DFE-YOLO model to evaluate its practical deployability in real-world traffic monitoring scenarios. Specifically, DFE-YOLO achieves an inference speed of 65.7 FPS, with 53.93 million parameters and 242.7 GFLOPs. These figures indicate that although the model introduces additional modules for performance enhancement, it still maintains a reasonable computational profile suitable for real-time applications.
Further evidence supporting the deployability of DFE-YOLO can be derived from publicly available benchmarks. For instance, according to publicly available performance benchmarks on NVIDIA Jetson [49], YOLOv8x, with a higher computational cost than DFE-YOLO (258.2 GFLOPs and 68.16M parameters), achieves 46 FPS on the Jetson Orin NX 16GB device and 75 FPS on the Jetson AGX Orin 32GB using TensorRT acceleration.
Given that DFE-YOLO is lighter than YOLOv8x in terms of both FLOPs and parameter size and achieves comparable FPS under similar testing conditions, we infer that DFE-YOLO is deployable on mainstream edge devices commonly used in traffic surveillance infrastructure.
4.5. Effect of Input Resolution on Detection Accuracy
To investigate the influence of input resolution on detection performance, we further evaluated DFE-YOLO at three resolutions: 320 × 320, 640 × 640 (default), and 768 × 768. The results are summarized in Table 7.
Table 7.
Detection performance of DFE-YOLO under different input resolutions on the VisDrone-2019-DET test set. Bold numbers indicate the best performance in each column.
As shown in Table 7, increasing the input resolution improves detection performance across all metrics. When the resolution is significantly reduced to 320 × 320, the model’s APsmall score drops dramatically from 0.125 to 0.042. This suggests that lower resolutions impair the model’s detection accuracy.
Although higher resolutions such as 960 × 960 or 1280 × 1280 could theoretically provide further refinements by capturing finer spatial details, training at such scales requires over 40 GB of GPU memory, which exceeds our current hardware resources. These results reveal an inherent trade-off between detection performance, input resolution, and computational cost, which should be carefully considered in practical deployments.
5. Conclusions
In order to resolve issues associated with target detection in traffic monitoring environments, this paper presents a modified detection model, DFE-YOLO, which is actually based on YOLOv8 and demonstrates notable robustness under complex road conditions. It also greatly enhances the detection accuracy of multi-scale targets, particularly small ones. Comparative experiments carried out with two major datasets, VisDrone-2019 and BDD100K, show an elevated mean average precision (mAP) with object detection for DFE-YOLO, where detectability outperforms mainstream object detection algorithms. Furthermore, ablation experiments described in this paper prove the advantageous synergistic effects of the FASFF module, the DySample strategy, and the improved loss function on overall performance improvement. In summary, DFE-YOLO has been found to improve the perception of small targets in complex traffic as well as keep the general target detection accuracy, which shows it has application potential. The next steps in the research will be to integrate lightweight structures and real-time optimization, which will serve to enhance the efficiency of model deployment and its effectiveness in practical deployment scenarios.
Despite the effectiveness of DFE-YOLO in traffic-oriented object detection, there remain certain limitations to address. The introduction of the FASFF module, while beneficial for multi-scale feature fusion, moderately increases the network’s structural complexity and computational demands. Additionally, although the model performs reliably on datasets such as VisDrone and BDD100K, further refinement and adaptation of specific modules may be required to maintain robustness across other visual domains, such as maritime surveillance or adverse weather conditions. These limitations will guide future research directions focused on improving the model’s generalization and deployment efficiency.
Author Contributions
Conceptualization, Q.L. and Y.L. (Yi Li); methodology, Y.L. (Yi Li); software, Q.L.; validation, Q.L.; formal analysis, Y.L. (Yanfeng Lu); investigation, Q.L.; resources, Q.L.; data curation, Q.L.; writing—original draft preparation, Q.L.; writing—review and editing, Y.L. (Yanfeng Lu) and Y.L. (Yi Li); visualization, Q.L.; supervision, Y.L. (Yanfeng Lu) and Y.L. (Yi Li); project administration, Y.L. (Yanfeng Lu); funding acquisition, Y.L. (Yanfeng Lu). All authors have read and agreed to the published version of the manuscript.
Funding
Strategic Priority Research Program of the Chinese Academy of Sciences under grant nos. XDA0450200, XDA0450202, Fundamental Research Funds for the China Central Universities of Beijing University of Chemical Technology (BH202530), and the Open Projects Program of State Key Laboratory of Multimodal Artificial Intelligence Systems.
Data Availability Statement
The VisDrone-2019 dataset is available at https://github.com/VisDrone/VisDrone-Dataset (accessed on 7 May 2025), and the BDD100K dataset is available at https://github.com/bdd100k/bdd100k (accessed on 7 May 2025).
Conflicts of Interest
The authors declare no conflicts of interest.
References
- Liu, Y.; Sun, P.; Wergeles, N.; Shang, Y. A Survey and Performance Evaluation of Deep Learning Methods for Small Object Detection. Expert Syst. Appl. 2021, 172, 114602. [Google Scholar] [CrossRef]
- Carranza-García, M.; Torres-Mateo, J.; Lara-Benítez, P.; García-Gutiérrez, J. On the Performance of One-Stage and Two-Stage Object Detectors in Autonomous Vehicles Using Camera Data. Remote Sens. 2021, 13, 89. [Google Scholar] [CrossRef]
- Girshick, R. Fast R-CNN. In Proceedings of the IEEE International Conference on Computer Vision (ICCV), Santiago, Chile, 7–13 December 2015; pp. 1440–1448. [Google Scholar] [CrossRef]
- Ren, S.; He, K.; Girshick, R.; Sun, J. Faster R-CNN: Towards Real-Time Object Detection with Region Proposal Networks. IEEE Trans. Pattern Anal. Mach. Intell. 2016, 39, 1137–1149. [Google Scholar] [CrossRef]
- Dai, J.; Li, Y.; He, K.; Sun, J. R-FCN: Object Detection via Region-Based Fully Convolutional Networks. In Proceedings of the Advances in Neural Information Processing Systems, Barcelona, Spain, 5–10 December 2016; pp. 379–387. [Google Scholar]
- Lin, T.Y.; Dollár, P.; Girshick, R.; He, K.; Hariharan, B.; Belongie, S. Feature Pyramid Networks for Object Detection. In Proceedings of the IEEE Conference on Computer Vision and Pattern Recognition (CVPR), Honolulu, HI, USA, 21–26 July 2017; pp. 2117–2125. [Google Scholar] [CrossRef]
- Cai, Z.; Vasconcelos, N. Cascade R-CNN: Delving into High Quality Object Detection. In Proceedings of the IEEE Conference on Computer Vision and Pattern Recognition (CVPR), Salt Lake City, UT, USA, 18–23 June 2018; pp. 6154–6162. [Google Scholar] [CrossRef]
- Malagoli, E.; Di Persio, L. 2D Object Detection: A Survey. Mathematics 2025, 13, 893. [Google Scholar] [CrossRef]
- Lin, T.Y.; Goyal, P.; Girshick, R.; He, K.; Dollár, P. Focal Loss for Dense Object Detection. In Proceedings of the IEEE International Conference on Computer Vision (ICCV), Venice, Italy, 22–29 October 2017; pp. 2980–2988. [Google Scholar] [CrossRef]
- Yang, C.; Huang, Z.; Wang, N. QueryDet: Cascaded Sparse Query for Accelerating High-Resolution Small Object Detection. In Proceedings of the IEEE/CVF Conference on Computer Vision and Pattern Recognition (CVPR), New Orleans, LA, USA, 18–24 June 2022; pp. 13668–13677. [Google Scholar] [CrossRef]
- Xu, C.; Ding, J.; Wang, J.; Yang, W.; Yu, H.; Yu, L.; Xia, G.S. Dynamic Coarse-to-Fine Learning for Oriented Tiny Object Detection. In Proceedings of the IEEE/CVF Conference on Computer Vision and Pattern Recognition (CVPR), Vancouver, BC, Canada, 17–24 June 2023; pp. 7318–7328. [Google Scholar] [CrossRef]
- Liu, X.; Chu, Y.; Hu, Y.; Zhao, N. Enhancing Intelligent Road Target Monitoring: A Novel BGS YOLO Approach Based on the YOLOv8 Algorithm. IEEE Open J. Intell. Transp. Syst. 2024, 5, 47–60. [Google Scholar] [CrossRef]
- Li, R.; Yu, C.; Qin, X.; An, X.; Zhao, J.; Chuai, W.; Liu, B. YOLO-SGC: A Dangerous Driving Behavior Detection Method With Multiscale Spatial-Channel Feature Aggregation. IEEE Sens. J. 2024, 24, 11721–11731. [Google Scholar] [CrossRef]
- Li, F.; Zhao, Y.; Wei, J.; Li, S.; Shan, Y. SNCE-YOLO: An Improved Target Detection Algorithm in Complex Road Scenes. IEEE Access 2024, 12, 26294–26307. [Google Scholar] [CrossRef]
- Varghese, R.; Sambath, M. YOLOv8: A Novel Object Detection Algorithm with Enhanced Performance and Robustness. In Proceedings of the IEEE International Conference on Advanced Data Engineering and Intelligent Computing Systems (ADICS), Chennai, India, 18–19 April 2024; pp. 1–6. [Google Scholar] [CrossRef]
- Redmon, J.; Divvala, S.; Girshick, R.; Farhadi, A. You Only Look Once: Unified, Real-Time Object Detection. In Proceedings of the IEEE Conference on Computer Vision and Pattern Recognition (CVPR), Las Vegas, NV, USA, 27–30 June 2016; pp. 779–788. [Google Scholar] [CrossRef]
- Redmon, J.; Farhadi, A. YOLOv3: An Incremental Improvement. arXiv 2018, arXiv:1804.02767. [Google Scholar]
- Bochkovskiy, A.; Wang, C.Y.; Liao, H.Y.M. YOLOv4: Optimal Speed and Accuracy of Object Detection. arXiv 2020, arXiv:2004.10934. [Google Scholar]
- Jocher, G.; Stoken, A.; Borovec, J.; Liu, C.; Hogan, A.; Diaconu, L.; Poznanski, J.; Yu, L.; Rai, P.; Ferriday, R.; et al. Ultralytics/yolov5: V3.0. Zenodo. 2020. Available online: https://zenodo.org/records/7347926 (accessed on 7 May 2025).
- Li, X.; Wang, W.; Wu, L.; Chen, S.; Hu, X.; Li, J.; Tang, J.; Yang, J. Generalized Focal Loss: Learning Qualified and Distributed Bounding Boxes for Dense Object Detection. In Proceedings of the Advances in Neural Information Processing Systems (NeurIPS), Vancouver, BC, Canada, 6–12 December 2020; pp. 21002–21012. [Google Scholar]
- Yin, X.; Tai, Y.; Huang, Y.; Liu, X. FAN: Feature Adaptation Network for Surveillance Face Recognition and Normalization. In Proceedings of the Asian Conference on Computer Vision (ACCV), Kyoto, Japan, 30 November–4 December 2020; pp. 301–319. [Google Scholar] [CrossRef]
- Li, H.; Xiong, P.; An, J.; Wang, L. Pyramid Attention Network for Semantic Segmentation. arXiv 2018, arXiv:1805.10180. [Google Scholar]
- Cheng, T.; Song, L.; Ge, Y.; Liu, W.; Wang, X.; Shan, Y. YOLO-World: Real-Time Open-Vocabulary Object Detection. In Proceedings of the IEEE/CVF Conference on Computer Vision and Pattern Recognition (CVPR), Seattle, WA, USA, 16–22 June 2024; pp. 16901–16911. [Google Scholar] [CrossRef]
- Wang, A.; Chen, H.; Liu, L.; Chen, K.; Lin, Z.; Han, J.; Ding, G. YOLOv10: Real-Time End-to-End Object Detection. arXiv 2024, arXiv:2405.14458. [Google Scholar]
- Lu, Y.F.; Gao, J.W.; Yu, Q.; Li, Y.; Lv, Y.S.; Qiao, H. A Cross-Scale and Illumination Invariance-Based Model for Robust Object Detection in Traffic Surveillance Scenarios. IEEE Trans. Intell. Transp. Syst. 2023, 24, 6989–6999. [Google Scholar] [CrossRef]
- Lu, Y.F.; Yu, Q.; Gao, J.W.; Li, Y.; Zou, J.C.; Qiao, H. Cross Stage Partial Connections Based Weighted Bi-Directional Feature Pyramid and Enhanced Spatial Transformation Network for Robust Object Detection. Neurocomput. 2022, 513, 70–82. [Google Scholar] [CrossRef]
- Guo, K.; Li, X.; Zhang, M.; Bao, Q.; Yang, M. Real-Time Vehicle Object Detection Method Based on Multi-Scale Feature Fusion. IEEE Access 2021, 9, 115126–115134. [Google Scholar] [CrossRef]
- Cao, J.; Zhang, J.; Jin, X. A Traffic-Sign Detection Algorithm Based on Improved Sparse R-CNN. IEEE Access 2021, 9, 122774–122788. [Google Scholar] [CrossRef]
- Jia, N.; Sun, Y.; Liu, X. TFGNet: Traffic Salient Object Detection Using a Feature Deep Interaction and Guidance Fusion. IEEE Trans. Intell. Transp. Syst. 2023, 25, 3020–3030. [Google Scholar] [CrossRef]
- Wang, T.; Zhang, J.; Ren, B.; Liu, B. MMW-YOLOv5: A Multi-Scale Enhanced Traffic Sign Detection Algorithm. IEEE Access 2024, 12, 148880–148892. [Google Scholar] [CrossRef]
- Zheng, Z.; Wang, P.; Ren, D.; Liu, W.; Ye, R.; Hu, Q.; Zuo, W. Enhancing Geometric Factors in Model Learning and Inference for Object Detection and Instance Segmentation. IEEE Trans. Cybern. 2022, 52, 8574–8586. [Google Scholar] [CrossRef]
- Liu, W.; Lu, H.; Fu, H.; Cao, Z. Learning to Upsample by Learning to Sample. In Proceedings of the IEEE/CVF International Conference on Computer Vision (ICCV), Paris, France, 1–6 October 2023; pp. 6027–6037. [Google Scholar] [CrossRef]
- Zhang, Y.F.; Ren, W.; Zhang, Z.; Jia, Z.; Wang, L.; Tan, T. Focal and Efficient IOU Loss for Accurate Bounding Box Regression. Neurocomputing 2022, 506, 146–157. [Google Scholar] [CrossRef]
- Liu, S.; Huang, D.; Wang, Y. Learning Spatial Fusion for Single-Shot Object Detection. arXiv 2019, arXiv:1911.09516. [Google Scholar]
- Rukundo, O.; Cao, H. Nearest Neighbor Value Interpolation. arXiv 2012, arXiv:1211.1768. [Google Scholar]
- Gevorgyan, Z. SIoU Loss: More Powerful Learning for Bounding Box Regression. arXiv 2022, arXiv:2205.12740. [Google Scholar]
- Tong, Z.; Chen, Y.; Xu, Z.; Yu, R. Wise-IoU: Bounding Box Regression Loss with Dynamic Focusing Mechanism. arXiv 2023, arXiv:2301.10051. [Google Scholar]
- Zheng, Z.; Wang, P.; Liu, W.; Li, J.; Ye, R.; Ren, D. Distance-IoU Loss: Faster and Better Learning for Bounding Box Regression. In Proceedings of the AAAI Conference on Artificial Intelligence, New York, NY, USA, 7–12 February 2020; Volume 34, pp. 12993–13000. [Google Scholar] [CrossRef]
- Rezatofighi, H.; Tsoi, N.; Gwak, J.; Sadeghian, A.; Reid, I.; Savarese, S. Generalized Intersection over Union: A Metric and a Loss for Bounding Box Regression. In Proceedings of the IEEE/CVF Conference on Computer Vision and Pattern Recognition (CVPR), Long Beach, CA, USA, 15–20 June 2019; pp. 658–666. [Google Scholar] [CrossRef]
- Du, D.; Zhu, P.; Wen, L.; Bian, X.; Lin, H.; Hu, Q.; Peng, T.; Zheng, J.; Wang, X.; Zhang, Y.; et al. VisDrone-DET2019: The Vision Meets Drone Object Detection in Image Challenge Results. In Proceedings of the IEEE/CVF International Conference on Computer Vision Workshops (ICCVW), Seoul, Republic of Korea, 27–28 October 2019. [Google Scholar] [CrossRef]
- Yu, F.; Chen, H.; Wang, X.; Xian, W.; Chen, Y.; Liu, F.; Madhavan, V.; Darrell, T. BDD100K: A Diverse Driving Dataset for Heterogeneous Multitask Learning. In Proceedings of the IEEE/CVF Conference on Computer Vision and Pattern Recognition (CVPR), Seattle, WA, USA, 13–19 June 2020; pp. 2636–2645. [Google Scholar] [CrossRef]
- Tan, M.; Pang, R.; Le, Q.V. EfficientDet: Scalable and Efficient Object Detection. In Proceedings of the IEEE/CVF Conference on Computer Vision and Pattern Recognition (CVPR), Seattle, WA, USA, 13–19 June 2020; pp. 10778–10787. [Google Scholar] [CrossRef]
- Xu, X.; Jiang, Y.; Chen, W.; Huang, Y.L.; Zhang, Y.; Sun, X. DAMO-YOLO: A Report on Real-Time Object Detection Design. arXiv 2022, arXiv:2211.15444. [Google Scholar]
- PaddleDetection: Object Detection and Instance Segmentation Toolkit Based on PaddlePaddle. 2019. Available online: https://github.com/PaddlePaddle/PaddleDetection (accessed on 7 May 2025).
- Duan, K.; Bai, S.; Xie, L.; Qi, H.; Huang, Q.; Tian, Q. CenterNet: Keypoint Triplets for Object Detection. In Proceedings of the IEEE/CVF International Conference on Computer Vision (ICCV), Seoul, Republic of Korea, 27 October–2 November 2019; pp. 6569–6578. [Google Scholar] [CrossRef]
- Li, W.; Zhang, X.; Peng, Y.; Dong, M. DMNet: A Network Architecture Using Dilated Convolution and Multiscale Mechanisms for Spatiotemporal Fusion of Remote Sensing Images. IEEE Sens. J. 2020, 20, 12190–12202. [Google Scholar] [CrossRef]
- Wang, J.; Xu, C.; Yang, W.; Yu, L. A Normalized Gaussian Wasserstein Distance for Tiny Object Detection. arXiv 2021, arXiv:2110.13389. [Google Scholar]
- Liu, C.; Gao, G.; Huang, Z.; Hu, Z.; Liu, Q.; Wang, Y. YOLO-C: You Only Look Clusters for Tiny Object Detection in Aerial Images. IEEE Trans. Intell. Transp. Syst. 2024, 25, 13863–13875. [Google Scholar] [CrossRef]
- Lakshan. YOLOv8 Performance Benchmarks on NVIDIA Jetson Devices. 2023. Available online: https://www.seeedstudio.com/blog/2023/03/30/yolov8-performance-benchmarks-on-nvidia-jetson-devices (accessed on 7 May 2025).
Disclaimer/Publisher’s Note: The statements, opinions and data contained in all publications are solely those of the individual author(s) and contributor(s) and not of MDPI and/or the editor(s). MDPI and/or the editor(s) disclaim responsibility for any injury to people or property resulting from any ideas, methods, instructions or products referred to in the content. |
© 2025 by the authors. Licensee MDPI, Basel, Switzerland. This article is an open access article distributed under the terms and conditions of the Creative Commons Attribution (CC BY) license (https://creativecommons.org/licenses/by/4.0/).