Article

Effect of Titanium Mandible Implant on the Electric Field and SAR Distribution Caused by Mobile Phone Within the User’s Head

by
Dejan Jovanović
1,*,
Dragan Krasić
2,
Nenad Cvetković
1,
Vladimir Stanković
3,
Dragana Živaljević
1 and
Bojana Petković
4
1
Faculty of Electronic Engineering, University of Nis, 18000 Nis, Serbia
2
Faculty of Medicine, University of Nis, 18000 Nis, Serbia
3
Faculty of Occupational Safety, University of Nis, 18000 Nis, Serbia
4
Advanced Electromagnetics Group, Technische Universität Ilmenau, 98693 Ilmenau, Germany
*
Author to whom correspondence should be addressed.
Electronics 2025, 14(11), 2096; https://doi.org/10.3390/electronics14112096
Submission received: 7 April 2025 / Revised: 2 May 2025 / Accepted: 15 May 2025 / Published: 22 May 2025
(This article belongs to the Section Microwave and Wireless Communications)

Abstract

:
The primary objective of this investigation is to assess the influence of a mandible implant on the electric field distribution and the specific absorption rate (SAR) within the cell phone user’s head. The procedure is based on numerically solving the electromagnetic propagation equation. This is an effective technique for the assessment of electric field distribution and the energy levels absorbed by the organs inside the head. In order to accomplish this, realistic three-dimensional head, implant, and mobile phone models are developed. The frequency applied in the simulations is 2600 MHz. Electric field strength and SAR distributions within the head are presented and examined. A comparative analysis was performed on both models, with and without a titanium mandible implant, to assess the influence of the implant on neighboring biological tissues. The results indicate that both values rise inside biological tissues close to the mandible implant. Face-to-phone safe distances are identified when the values of the electric field and SAR are under the allowable levels set by regulations.

1. Introduction

Mandible fractures often occur as a result of accidents. Some types of these fractures require invasive surgical procedures. These methods involve the placement of plates and screws for fastening mandibular parts. The implants are usually made of titanium due to its biocompatibility and the elasticity modulus similar to that of bone [1,2,3,4,5].
Due to their metal feature, the implants affect the SAR values inside the head during exposure to electromagnetic radiation from cell phones [6,7,8]. They can even lead to allergic and other harmful reactions [9,10]. Previous studies focused on identifying the determination of electromagnetic field distributions inside a head containing an implant, but mainly in the case of an RF far-field exposure [11,12,13,14,15,16].
Near-field exposure to the radiation emitted by a cell phone is thoroughly discussed in the literature. An examination of SAR in head tissues in the case of an implant-free scenario is presented in [17]. Studies on SAR values involving induced heating are presented in [18]. Active implants, like deep brain stimulation or the brain pacemaker, modeled using COMSOL Multiphysics, were investigated in [19]. The study [20] discusses SAR assessment inside models of the human head featuring cochlear implants in the vicinity of PIFA antennas in a railway vehicle. The effect of different passive metallic implants (conductive implants) on the SAR distribution of the head exposed to a near-field of a dipole antenna is given in [21]. The impact of orthodontic braces, dental implants, and implants for cranial reconstruction on the electric field and SAR distribution is analyzed in [7,8,22], respectively. Detailed safety and uncertainty assessment of radiation from mobile phones is given in [23]. SAR reduction can be achieved using newly developed polarization-dependent metamaterials [24].
In this paper, we consider titanium implants, used for mandible reconstructions, and determine their effect on electromagnetic radiation induced by mobile phones. We assess this effect through the penetrated electric field and the quantity of energy absorbed by tissues surrounding an implant. We consider the extreme worst-case scenario when the smartphone’s antenna is positioned on the side of an implant, at the height of the mouth, and tilted towards the face. We investigate various distances between the antenna and the head while considering the presence of a mandible implant. This enables the identification of the safe face-to-phone distance when the electric field intensity and SAR values are below the permitted levels established by standards.
A highly effective method to evaluate these parameters is numerical simulations with high-resolution three-dimensional numerical models of the head, titanium plate, and smartphone. Section 2 presents the methodology we use for investigating the influence of a mandible implant on the electric field and SAR distribution within the head. It involves numerical methods, 3D models of the head, titanium plates and screws, and mobile phone and detailed information on the source of electromagnetic field radiation. Results are presented in Section 3, followed by a conclusion in Section 4.

2. Methodology

2.1. Numerical Method

The CST Studio Suite software package (version 2012) [25] is utilized to model the electromagnetic wave propagation through biological organs, both with and without medical implants. A Finite Integral Technique (FIT) [26] within the software is used for simulation of the 4G antenna radiation and examination of the electromagnetic field distribution and the SAR in a human head model. Before performing the simulation, it is essential to create 3D representations of the biological tissues and organs that will be analyzed numerically. Every biological tissue and organ is individually created, imported into CST, and subsequently combined into a cohesive unit with other components. Based on CT scans, the locations of biological tissues and organs, including the interfaces separating different compartments, are accurately determined.
The next step is a special discretization using a proper mesh of elements. The total number of elements is a crucial factor influencing both the speed and precision of the numerical calculation, and this number will increase when the model size is larger and the wavelength is shorter. When the number of elements is large, the simulation could be very memory- and time-consuming (it might take several days). Therefore, maintaining a balance between result accuracy and calculation time is crucial. This could be reached by performing convergence tests that determine the necessary number of cells for acceptable accuracy. In this case, the simulation uses roughly 46 million mesh elements. A discrete port is designed to power the mobile phone’s antenna that emits EM waves. The excitation signal is time-dependent and is typically a Gaussian (sinusoidal) pulse.

2.2. 3D Head Model

A 3D representation of the head was designed so that the model faithfully represents the actual structure of a typical adult’s head (Figure 1). This is a crucial requirement for precisely assessing the distribution of the electric field and SAR.
The biological tissues and organs (1—skin; 2—adipose tissue; 3—muscle tissue; 4—skull bone; 5—mandible; 6—tongue; 7—teeth; 8—cervical vertebrae; 9—cartilage; 10—thyroid gland; 11—eyes; 12—cerebrospinal fluid; 13—cerebrum; 14—cerebellum; 15—brainstem; and 16—hypophysis) are presented in the sagittal a), coronal b), and transverse cross-sections in Figure 2a, Figure 2b, and Figure 2c, respectively.
Given the inhomogeneous, nonlinear, and dispersive nature of biological tissues, it is crucial to determine their electromagnetic properties precisely to ensure the high accuracy of the simulations. We assign the values of relative permittivity (εr), relative magnetic permeability (µr), specific conductivity (σ), and tissue density (ρ) to every tissue or organ. These factors play a crucial role in how electromagnetic waves propagate, reflect, and attenuate within the head. The electromagnetic properties of the tissues and organs used in the simulation are given in [22].

2.3. 3D Models of Titanium Plates and Screws

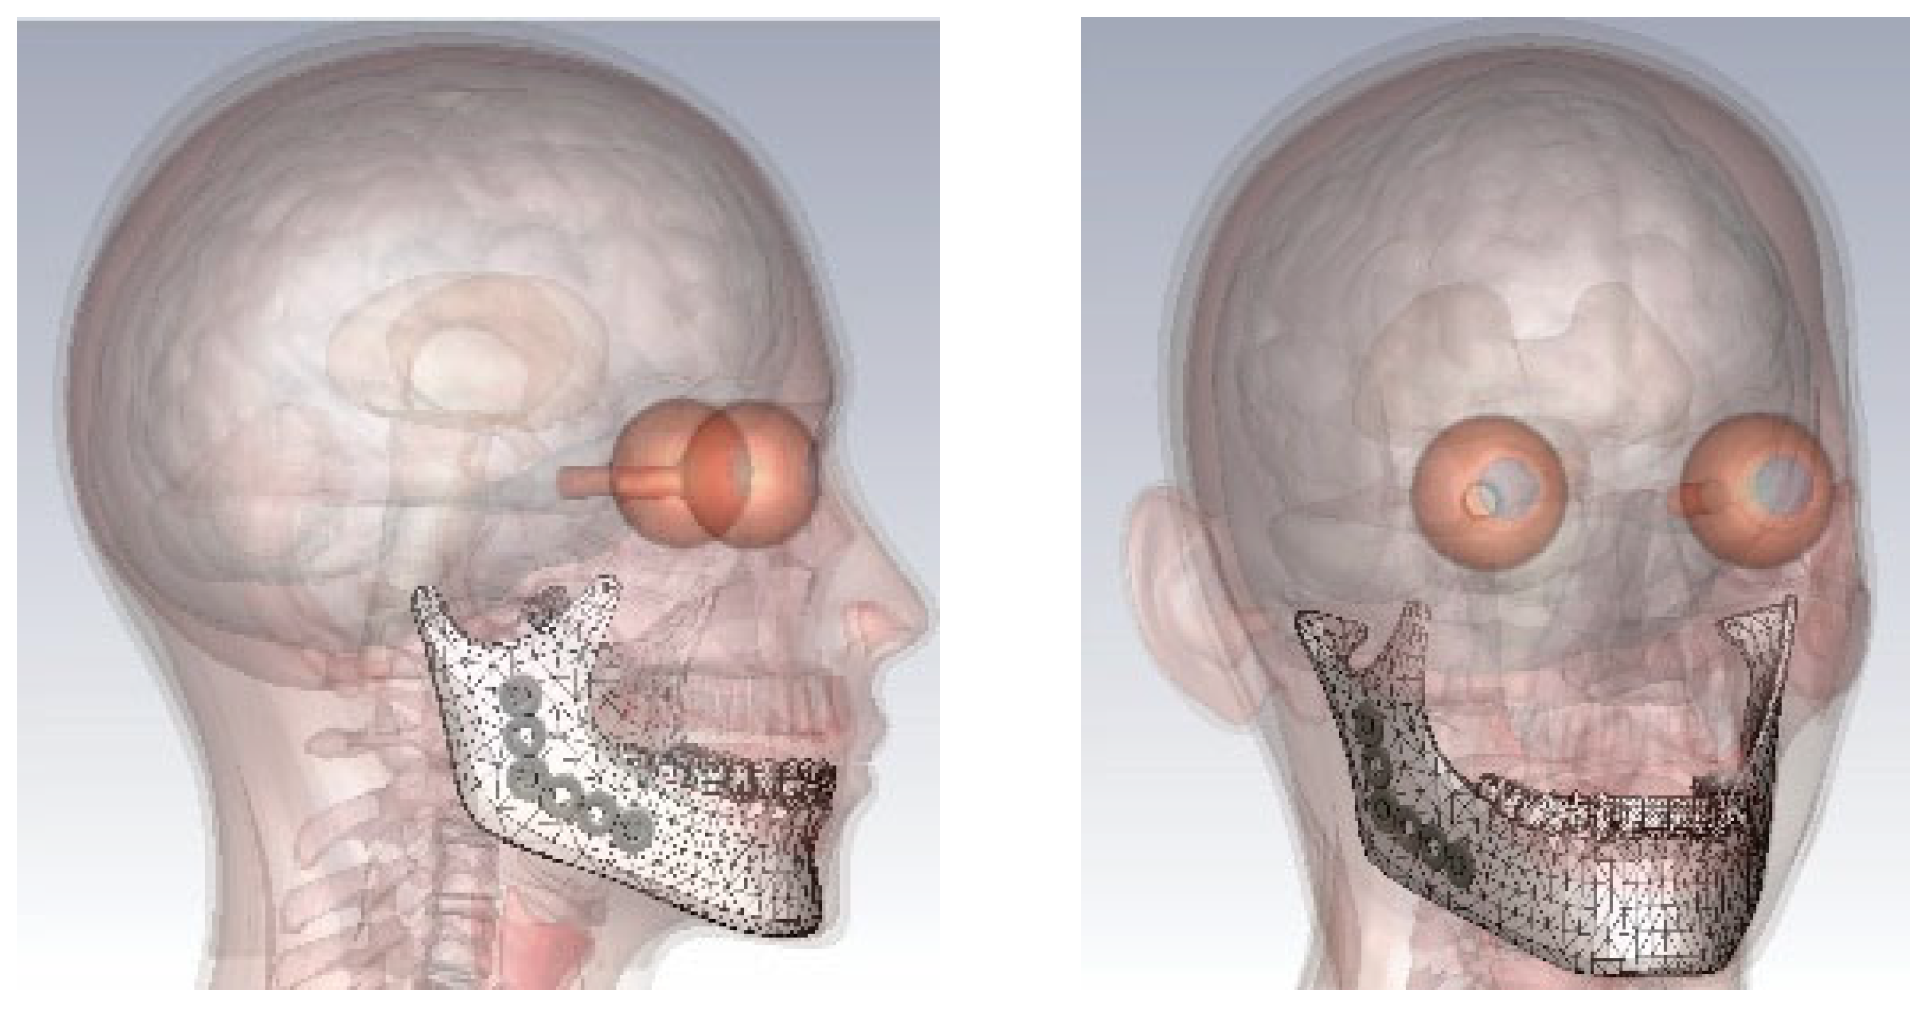
First, computer tomography (CT) or magnetic resonance imaging (MRI) are used to provide a precise image of an injured or broken jaw. This gives information on the size and shape of an implant, which can be personalized in the case of severe injury or can be standard in emergencies. One standard implant used in maxillofacial surgery and its CT scan are presented in Figure 3. Its geometry and properties are integrated into a 3D model (Figure 4), which is included in a numerical simulation.
The mandible implant is positioned on the same side of the head as the mobile phone emitting electromagnetic field radiation (Figure 4).

2.4. 3D Model of a Mobile Phone

As the source of electromagnetic radiation, a current smartphone was used, with its appearance and placement in relation to the user’s head model depicted in Figure 5. The three-dimensional representation of the cell phone includes several components: casing, camera, screen, battery, printed circuit board, and appropriate antenna for 4G mobile network.
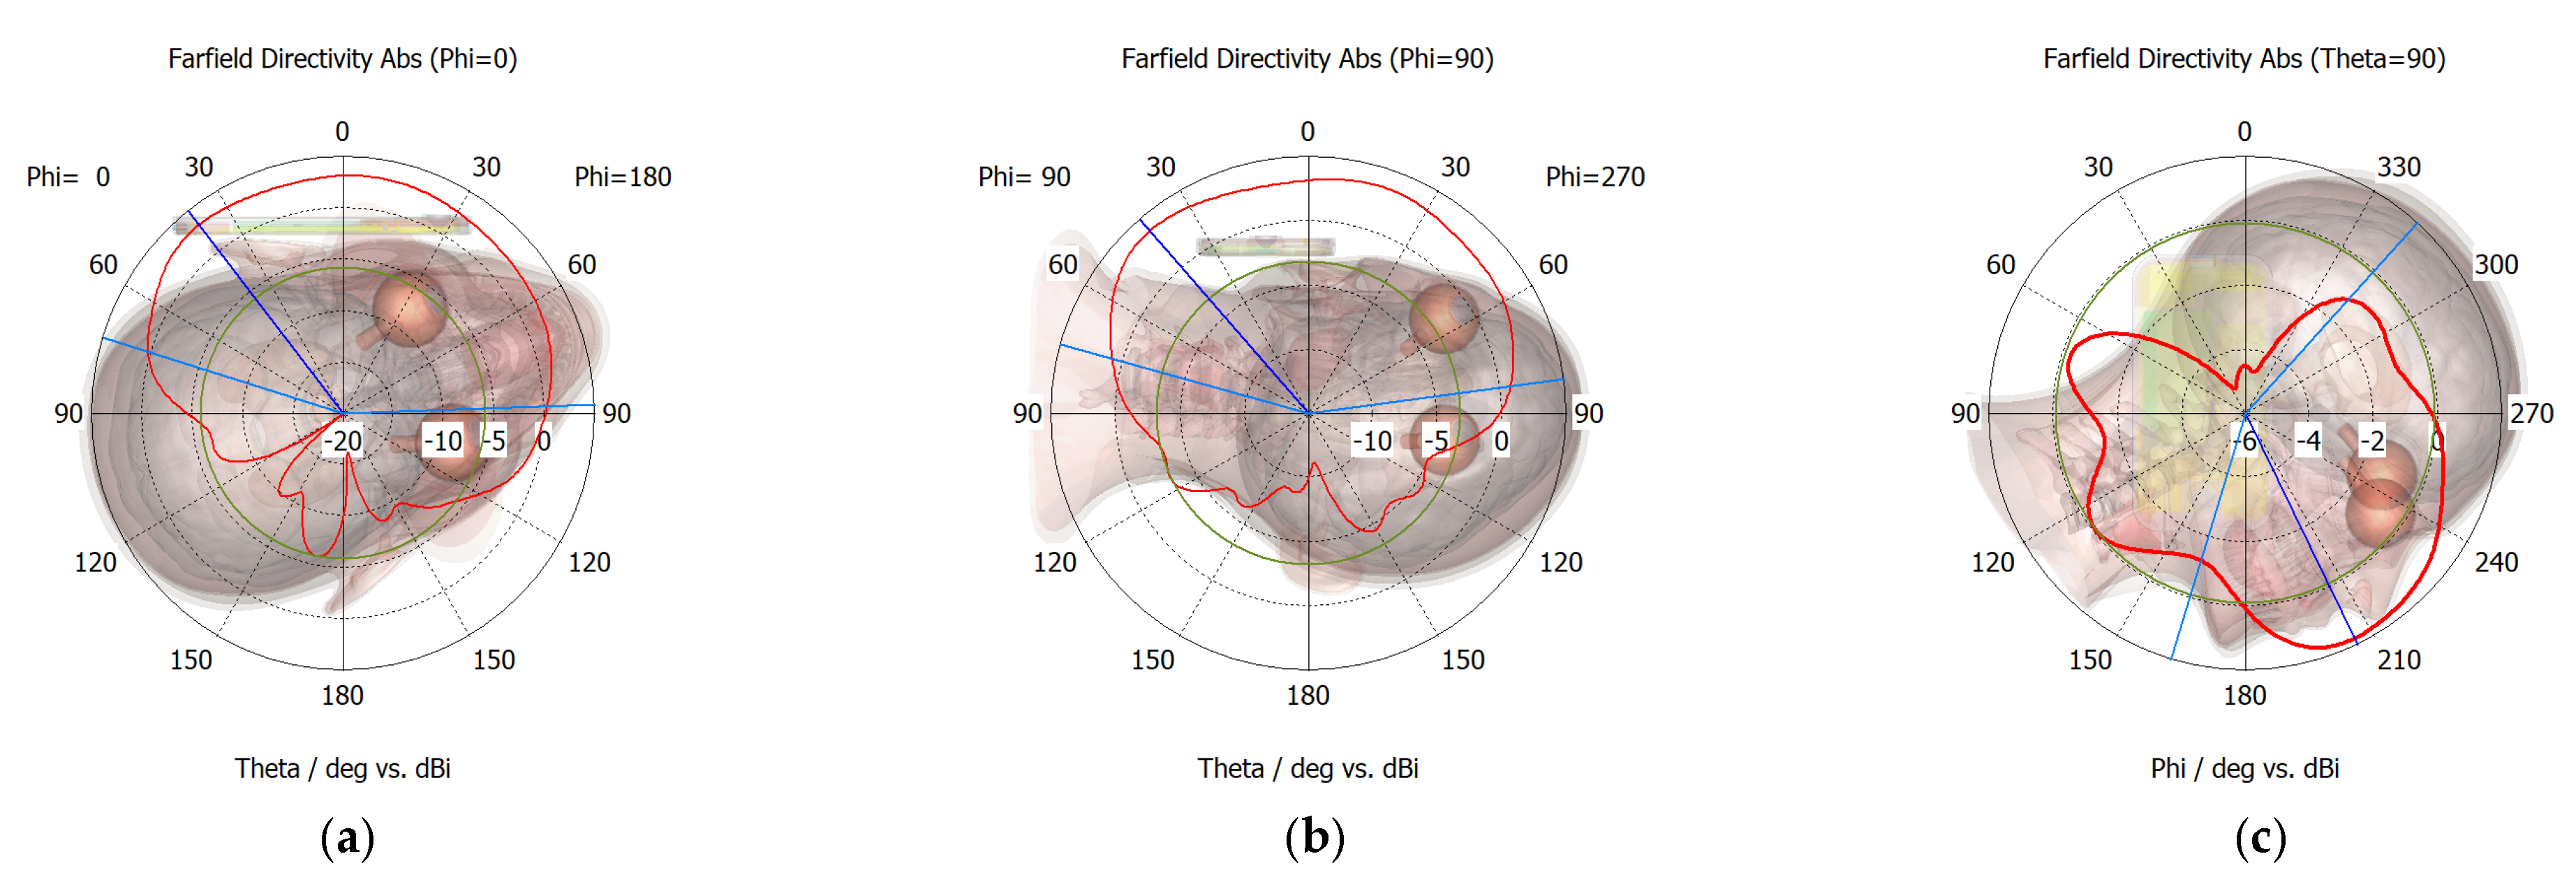
In order to perform simulations for particular frequency bands typical of the fourth-generation mobile network, the mobile phone model includes an appropriate antenna. A planar inverted F antenna (PIFA) was used as an electromagnetic radiation source. It can be designed and analyzed using an MIMO system [27]. Its output power and impedance are P = 1 W [28] and Z = 50 Ω, respectively. The antenna’s S parameters are illustrated in Figure 6. A radiation pattern of the antenna is presented in Figure 7, for φ = 0°, φ = 90°, and θ = 90°.
This investigation focuses on the worst case when the smartphone’s antenna is located in the microphone region, positioned at the user’s mouth height, on the same side as the titanium implant, and tilted towards the face (Figure 5). With the antenna placed this way relative to the mandible, the effect of the implant is the largest since the phone is positioned directly next to the face.
In addition, we investigate various distances between the antenna and the head while considering the presence of a mandible implant. This enables the determination of the safe distance between the phone and the head when the effect of a mandible implant on the electric field and SAR distribution can be neglected.

3. Results

Following numerical simulations, the obtained results of the electric field strength and the SAR values were analyzed for various cross-sections and specific propagation directions related to the implant’s location within the head.
To evaluate the effect of titanium implants in mandibular injuries on the electric field and SAR inside tissues near the implant, a comparative analysis was performed on the outcomes from models featuring and lacking the implant. The exposure scenario, including the position of the cellphone and its distance to the head model, remains unchanged for both models.
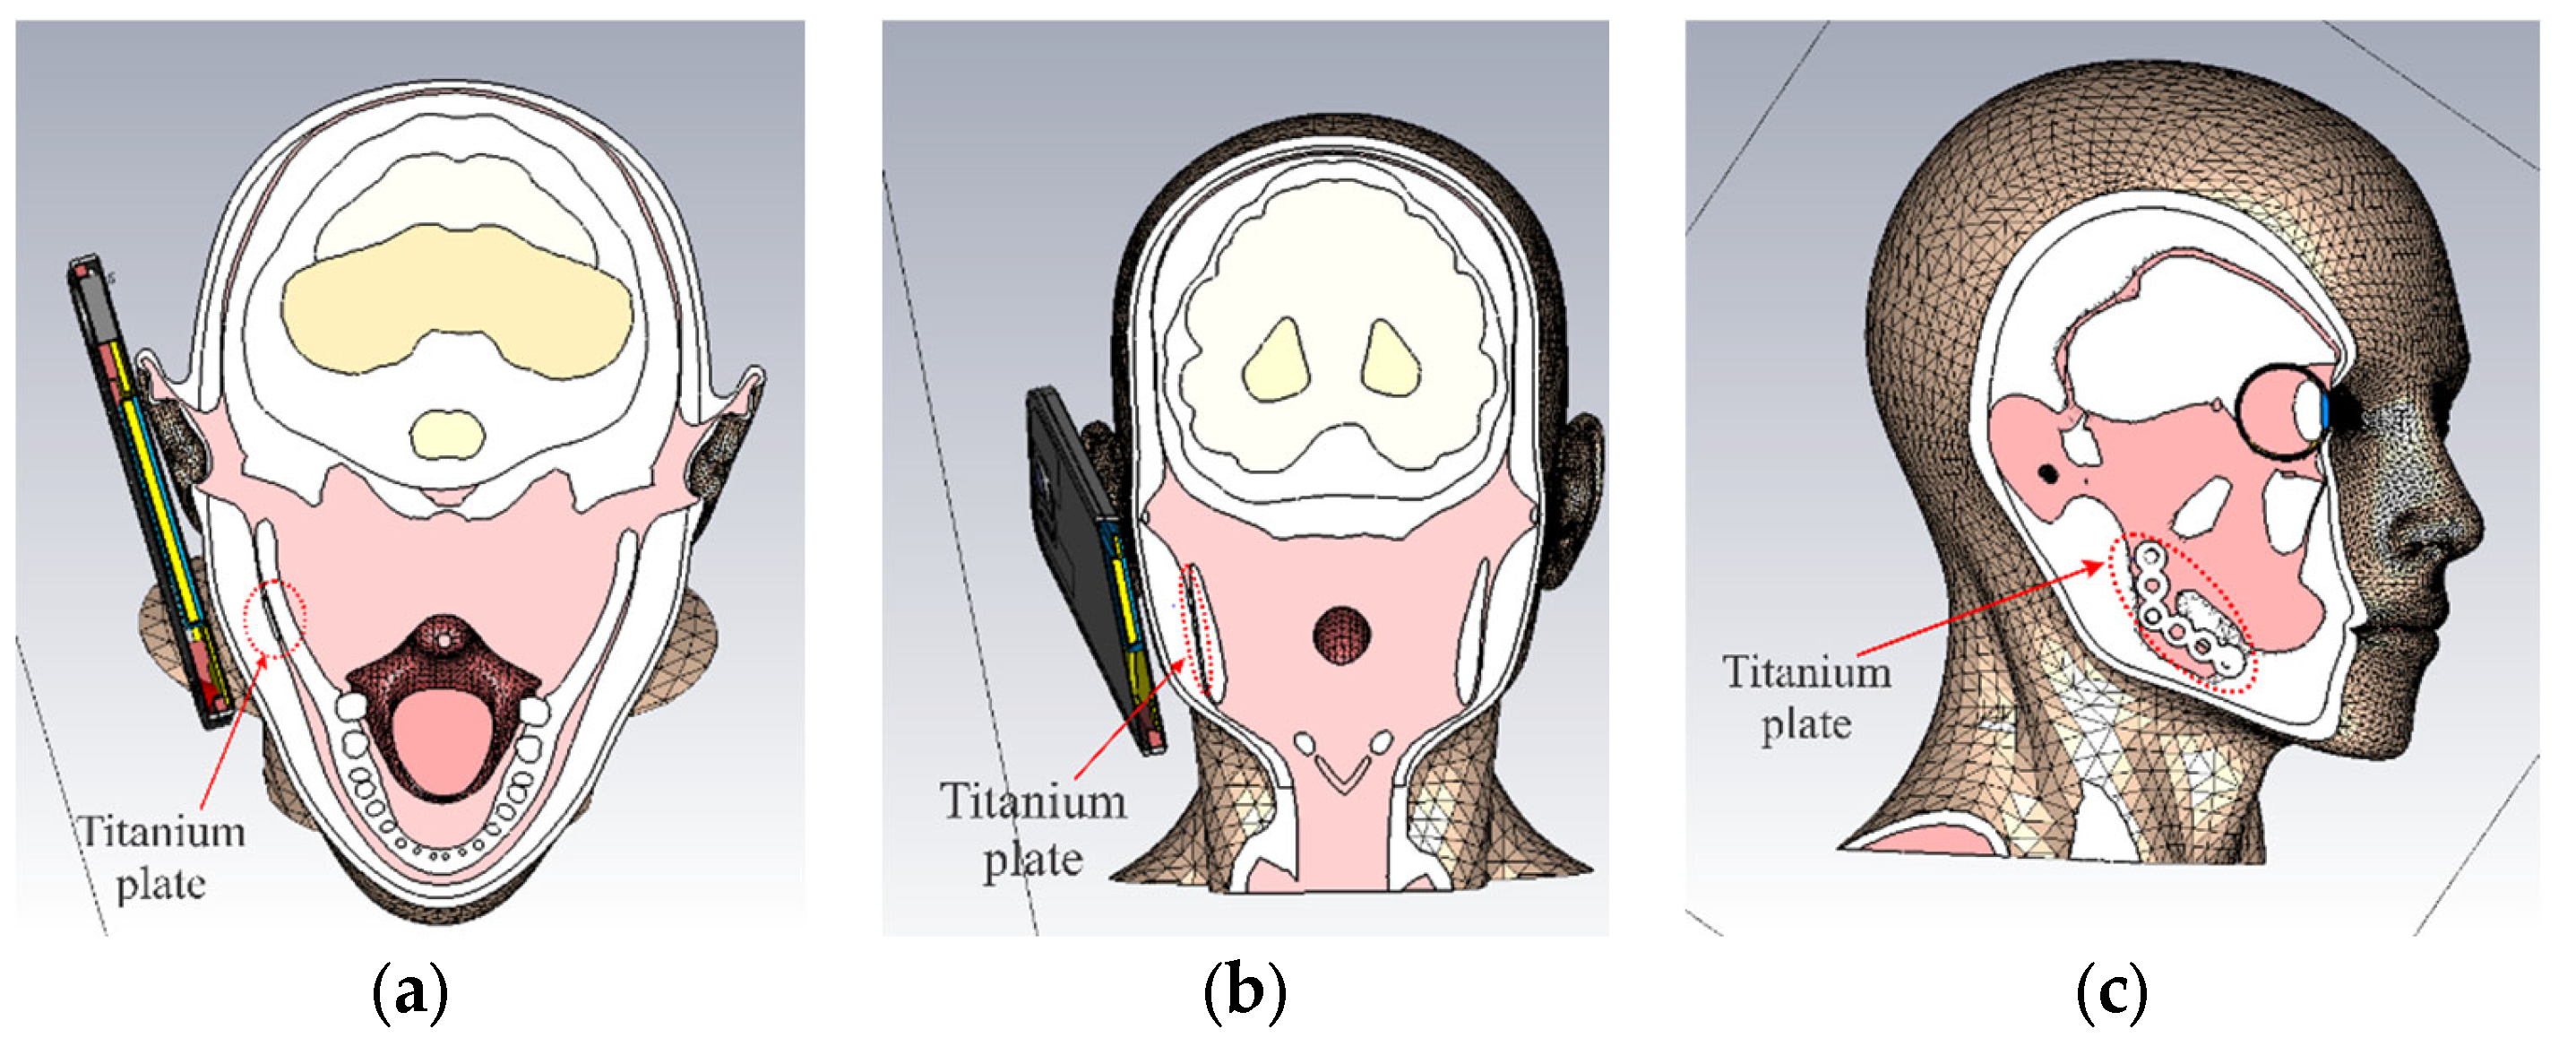
The results are presented for different cross-sections (Figure 8) positioned at the height of the titanium plate.

3.1. Electric Field Distribution Inside the User’s Head

Distributions of the electric field through the tissues at the different cross-sections, comparing the cases with and without a titanium implant, are presented in Figure 9, Figure 10, and Figure 11, respectively. For easier comparison, the color legend is set to the same values for both cases.
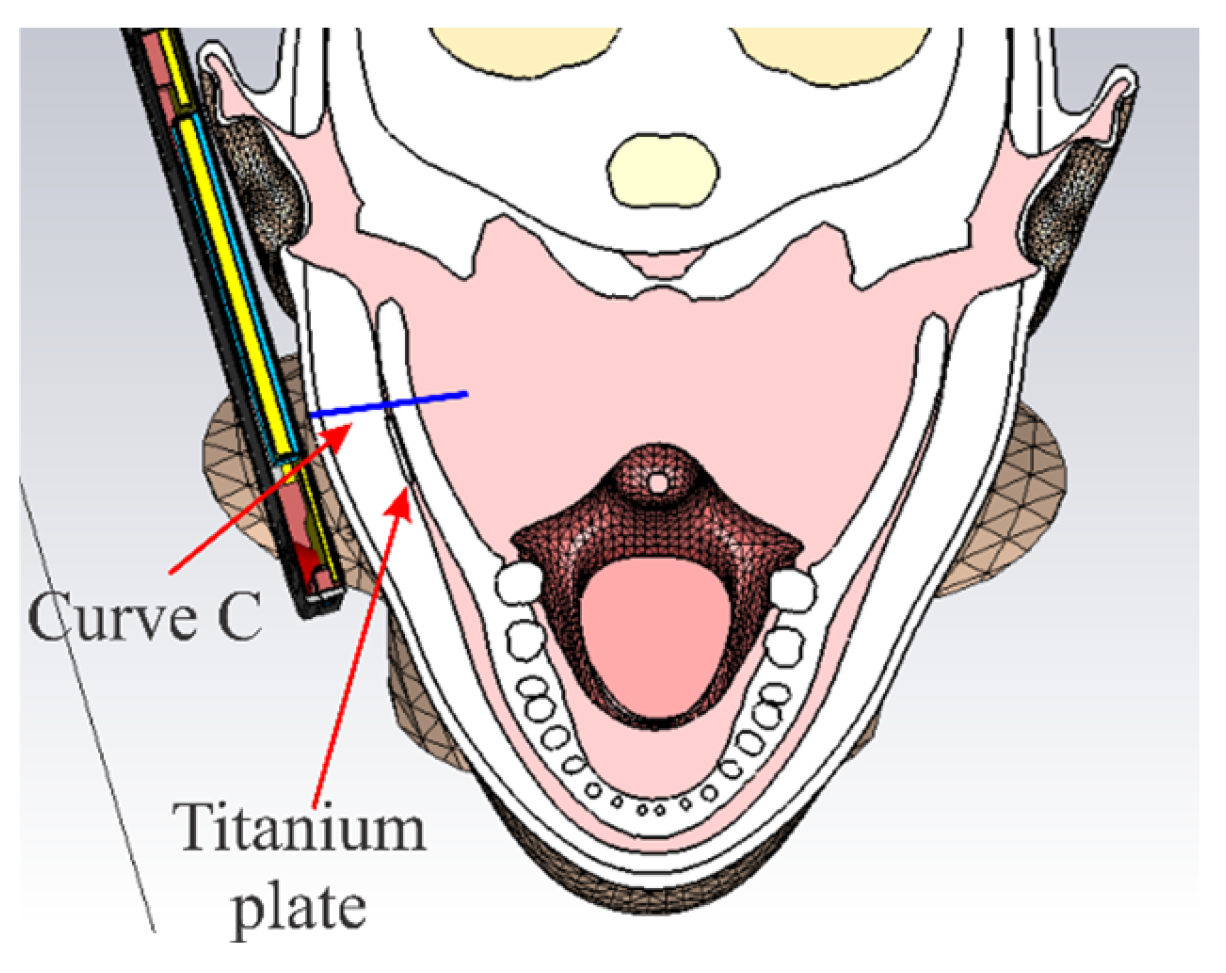
Figure 9, Figure 10 and Figure 11 show a significant difference in the intensity of the electric field in the tissues near the titanium implant when the implant is present. To better assess the increment of the electric field strength with the presence of an implant, the field distribution along line C, defined in Figure 12, is presented in Figure 13. Line C crosses the region where the largest variation in electric field distribution is observed.
The graph depicted in Figure 13 shows a significant rise in electric field intensity within biological tissues and organs near the titanium plate. The most significant variation in electric field intensity between the two models occurs in adipose and muscle tissues alongside the mandible. The highest intensity of the electric field at line C within the tissues surrounding the titanium plate is 138.42 V/m. Since the highest field in the jaw without an implant is 61.58 V/m, it indicates that with an implant, the electric field rises by 76.83 V/m.

3.2. Distribution of SAR Values Within the Model of the Head of a User

Permissible limits for human exposure to electromagnetic radiation are determined based on the impact on human health. Typical parameters for measuring these effects are electric field distribution and specific absorption rate (SAR). SAR is measured in W/kg and is defined as in [29]:
SAR = σ E 2 ρ = σ E m 2 2 ρ ,
where ρ represents the specific density of biological tissue (kg/m3), σ is the specific electrical conductivity of the tissue (S/m), and E and Em are the effective and maximum values of the electric field, respectively (V/m).
When exposure to the near-field radiation is observed, it is reasonable to calculate an averaged SAR over the volume of biological tissue affected by radiation [22]:
S A R AV = 1 V V S A R d V = 1 V V σ E 2 ρ m d V .
Averaged SAR is generally assessed for biological tissue masses of 1 g (SAR1g) and 10 g (SAR10g). Owing to the small size of the mandible, examining the distribution of SAR10g values would not correctly represent the energy absorbed within the mandible, particularly where a titanium implant is positioned. Consequently, this study will focus on averaging SAR for the 1 g and 0.1 g samples. The averaging of SAR outlined in this paper has been performed according to international standards [30].
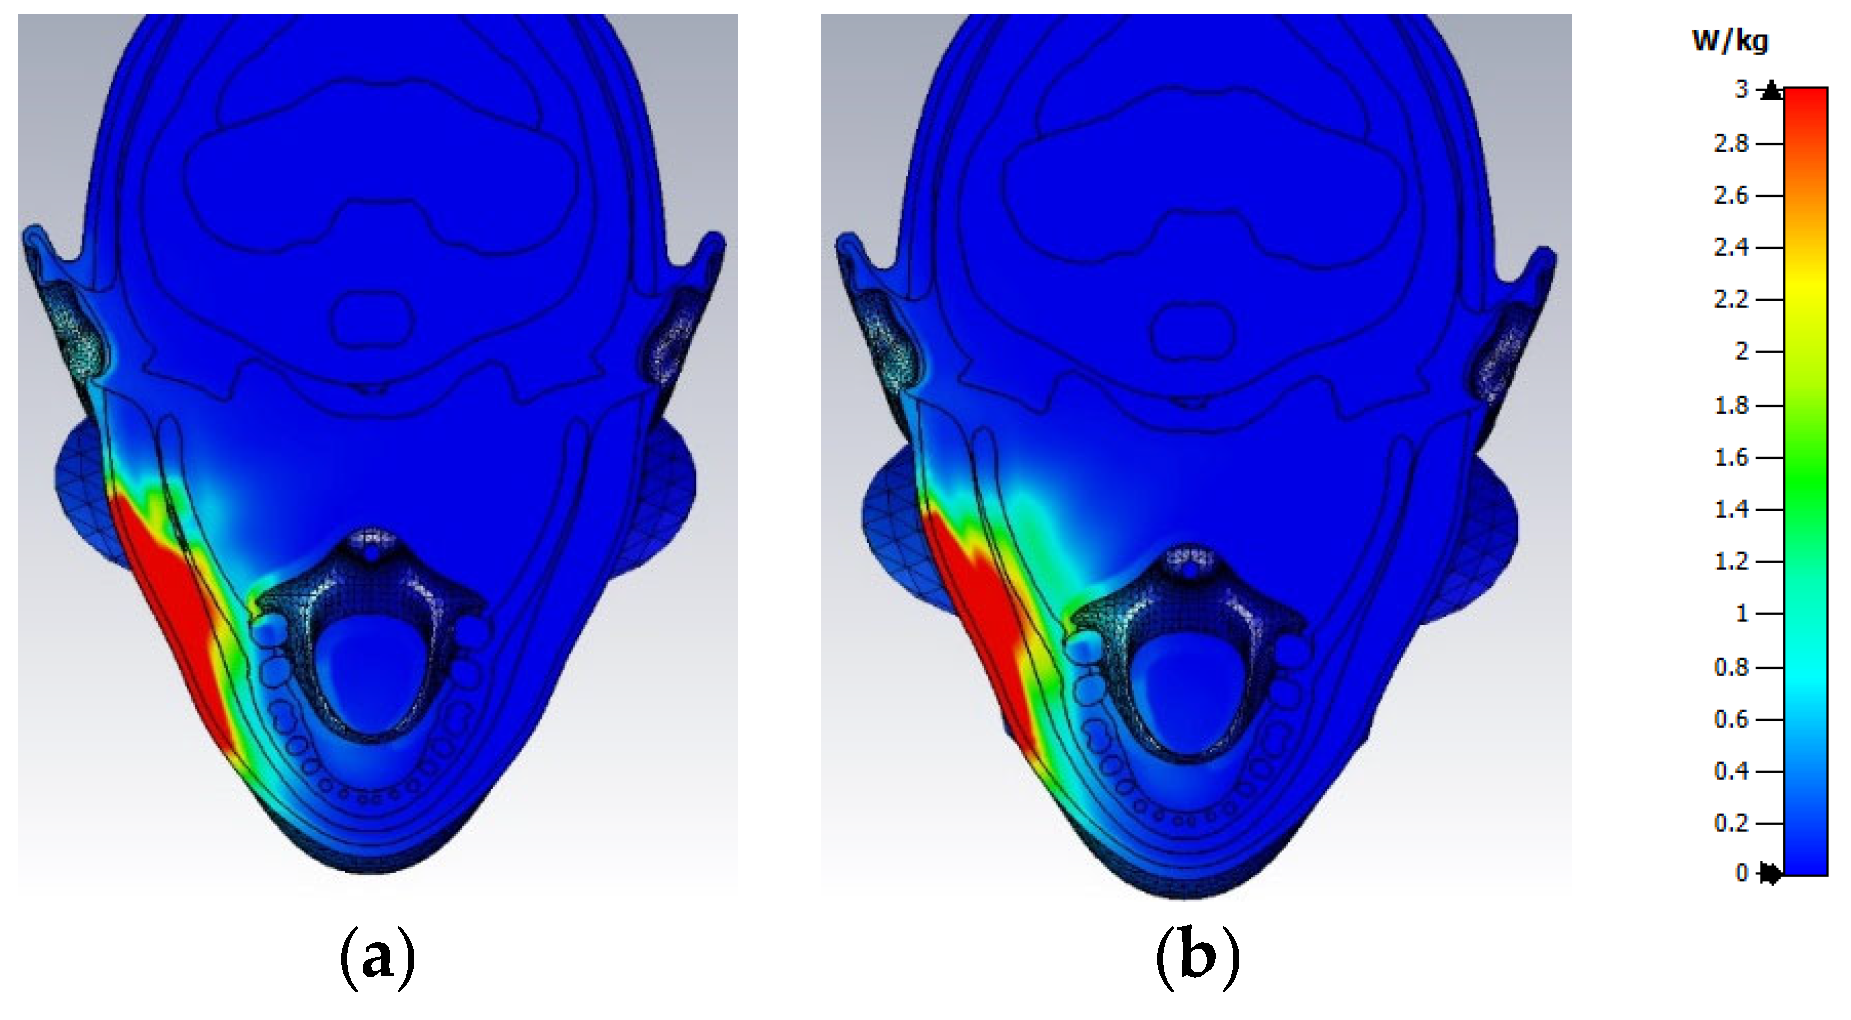
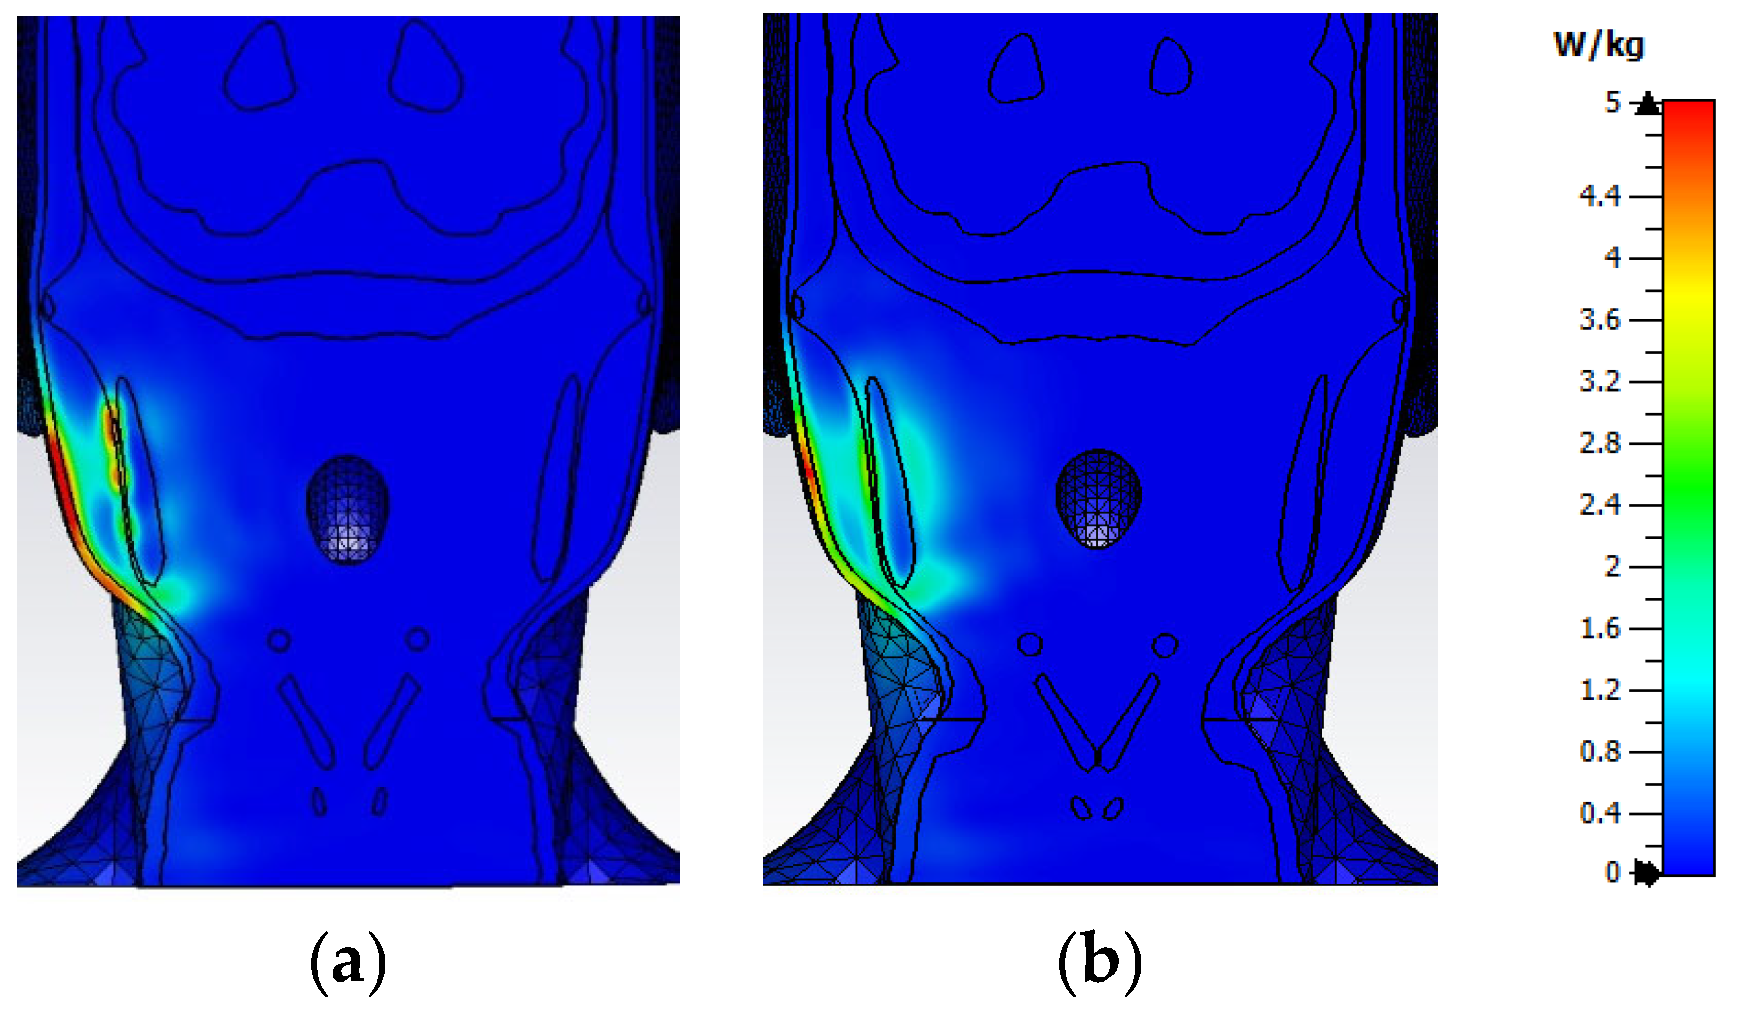
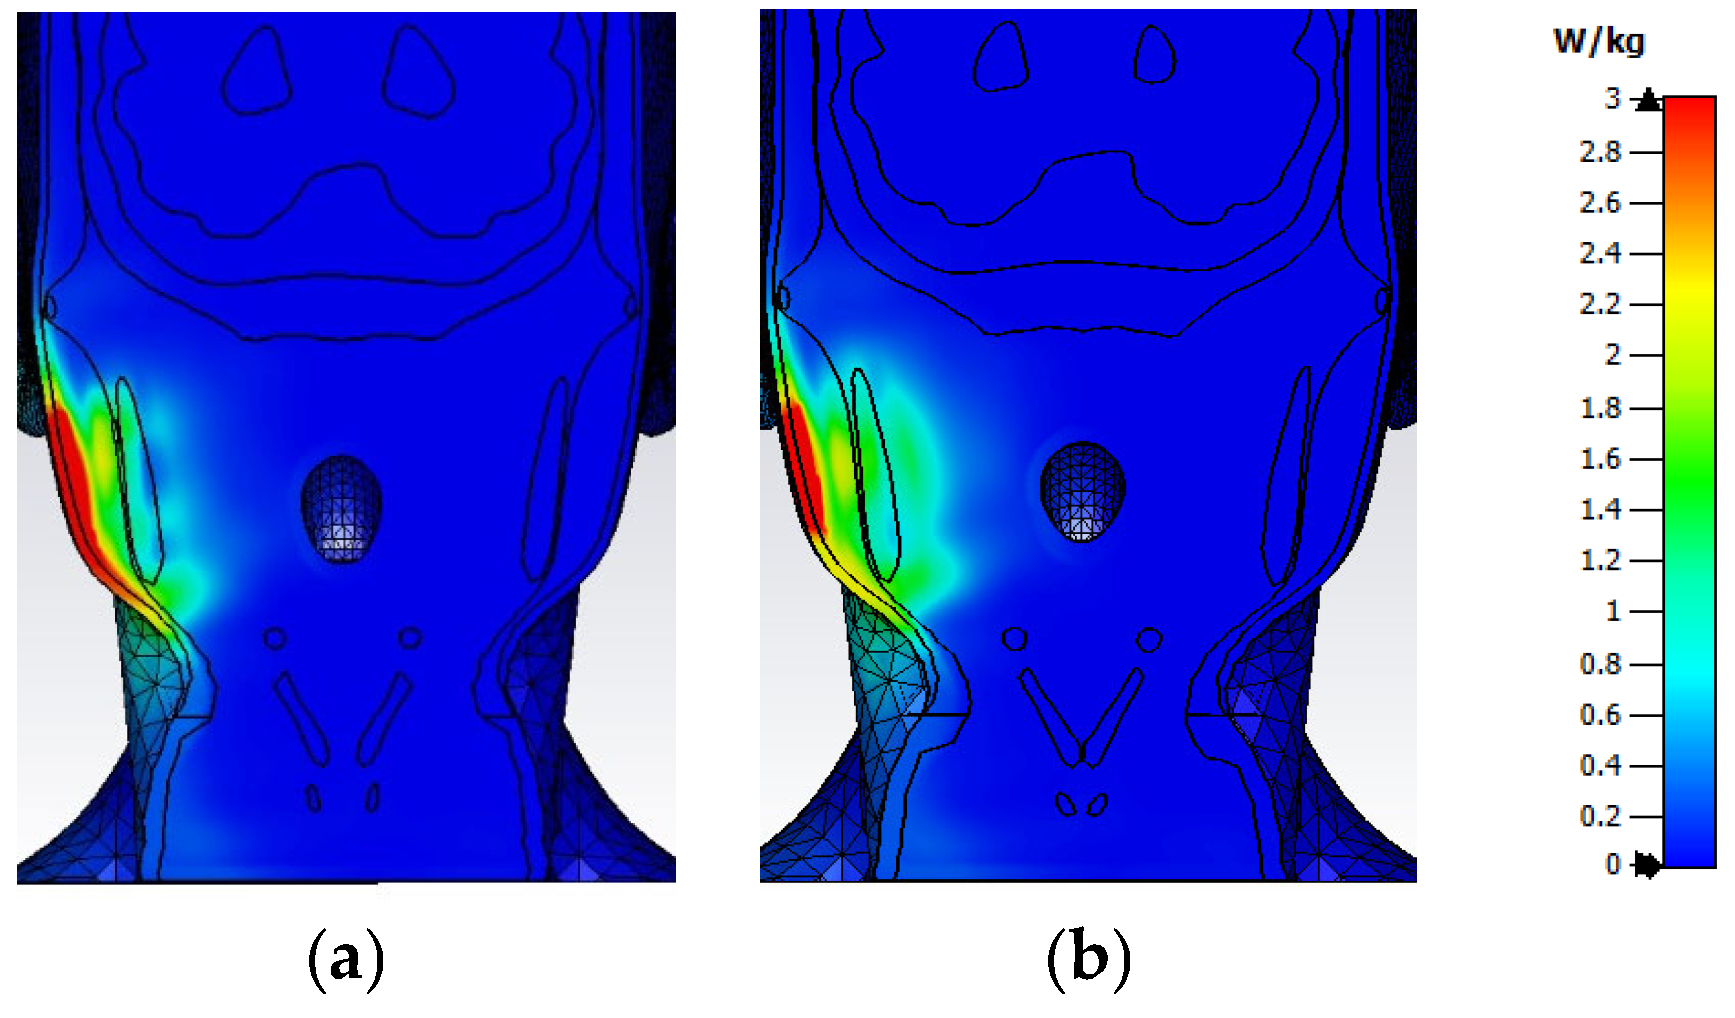
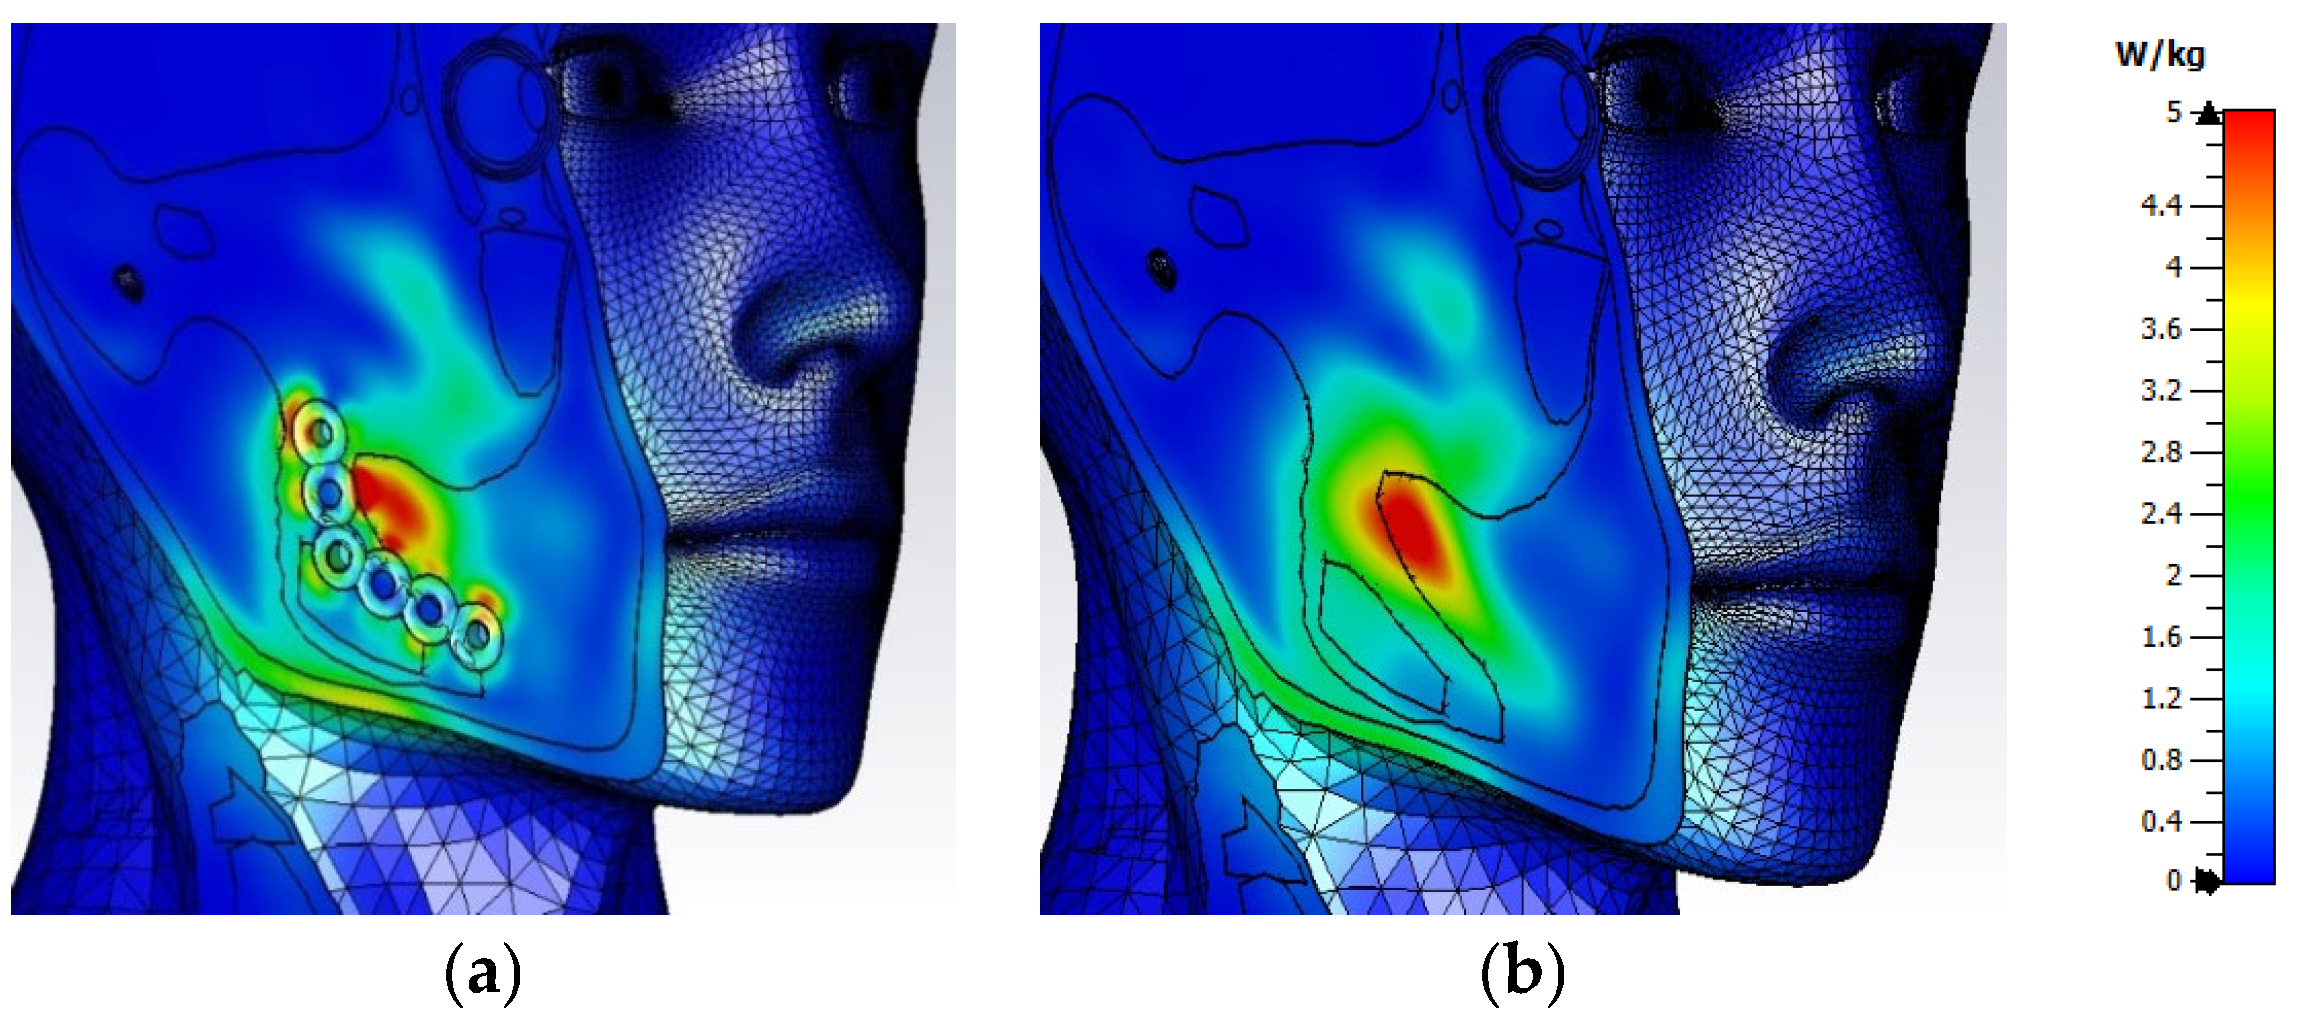
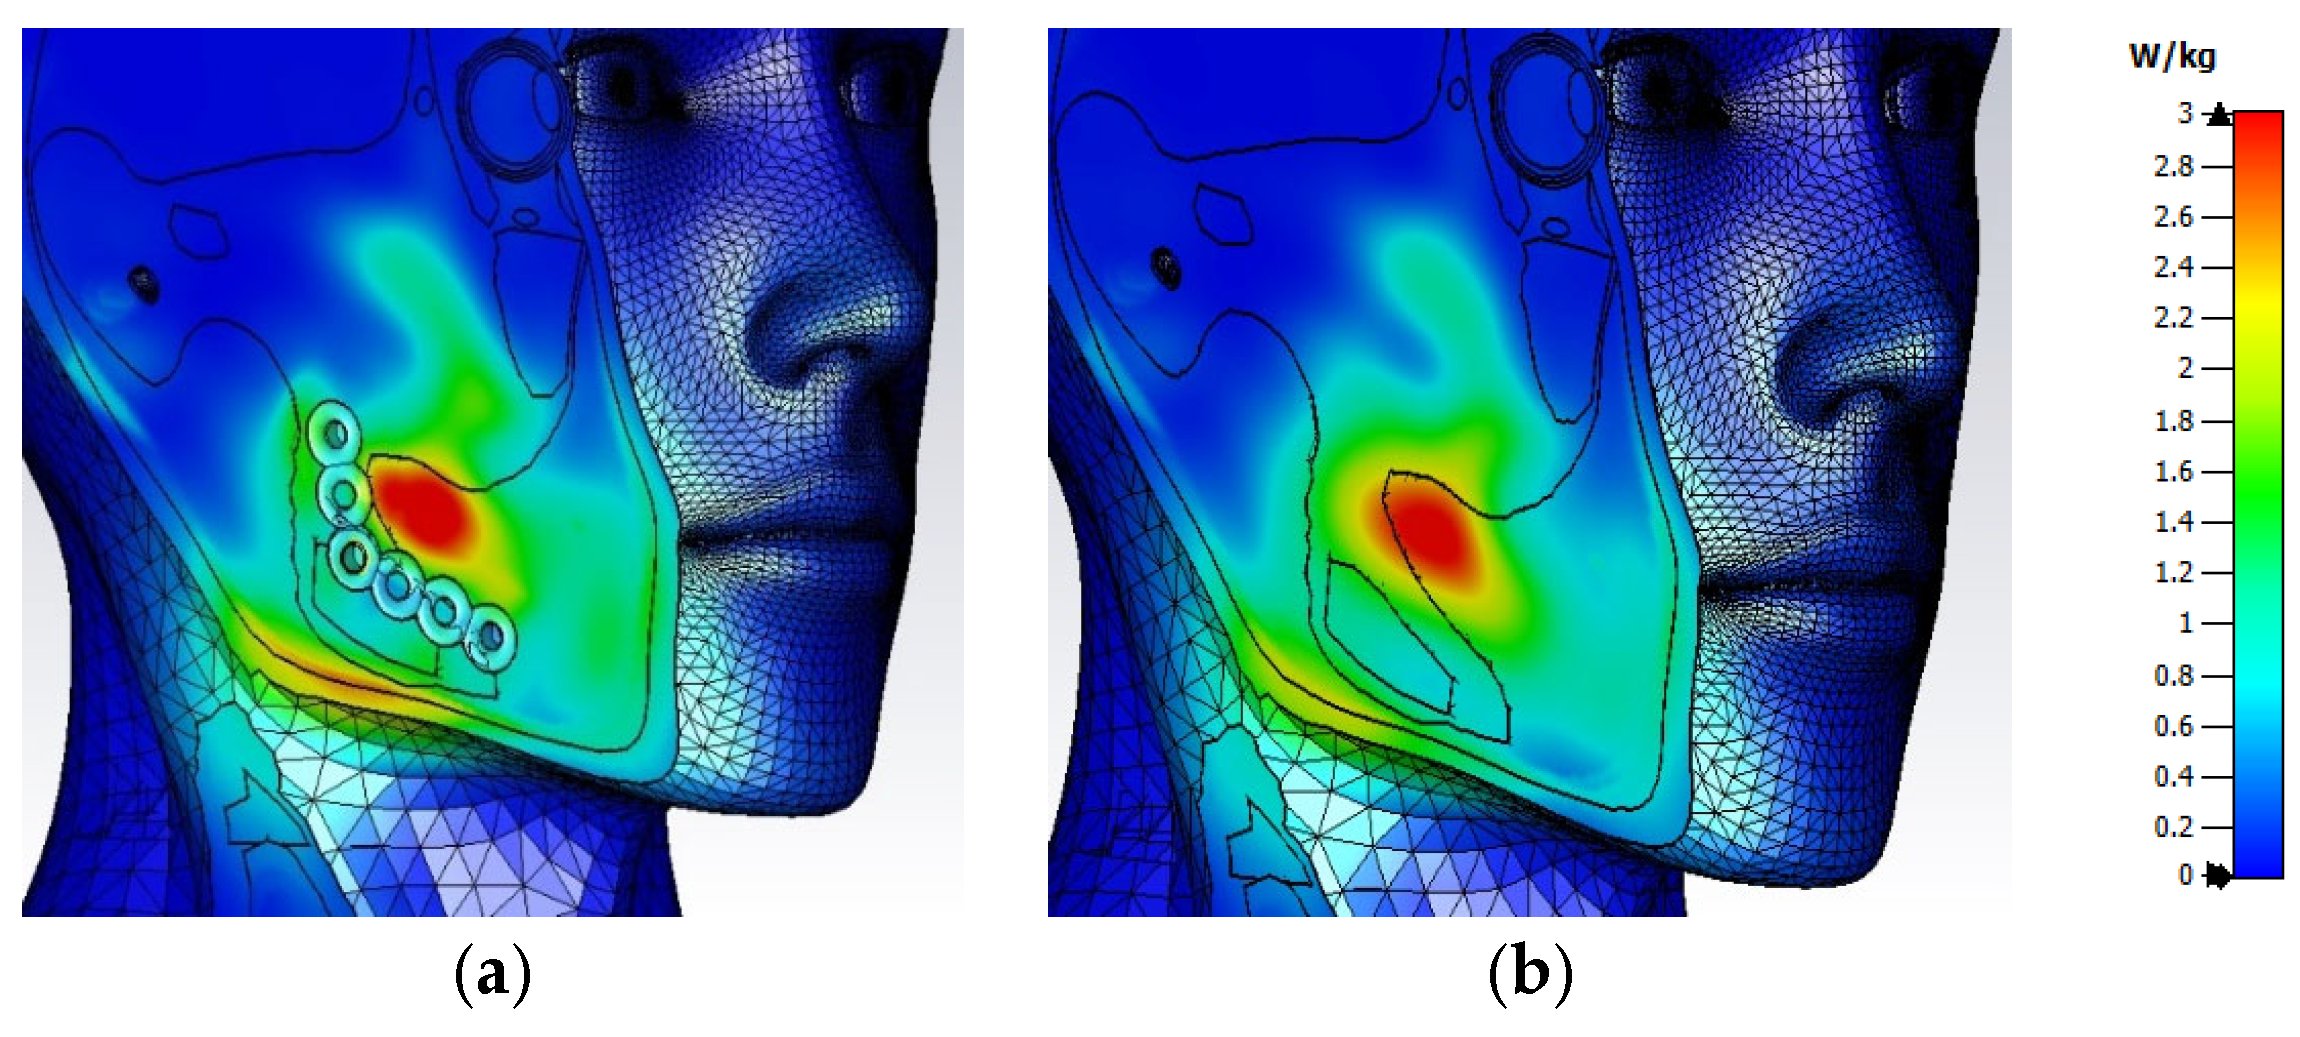
Spatial distributions of SAR0.1g and SAR1g at cross-section A for the scenarios with and without the titanium plate are presented in Figure 14 and Figure 15, respectively. Figure 16 and Figure 17 represent distributions of SAR0.1g and SAR1g at the cross-section B, respectively. Finally, SAR0.1g and SAR1g at the cross-section C are presented in Figure 18 and Figure 19, respectively. The color legend remains consistent for the SAR0.1g for all cross-sections. A uniform color legend for SAR1g across all cross-sections is also utilized.
Figure 14, Figure 15, Figure 16, Figure 17, Figure 18 and Figure 19 show that the spatial distribution of SAR differs when comparing the model with and without the titanium plate. A rise in SAR values in the model featuring the titanium plate is noted throughout all three cross-sections. The most significant difference relative to the model without the titanium plate occurs for the SAR0.1g value. The distribution of SAR0.1g along line C is presented in Figure 20 for a model with and without mandible implant.
Figure 20 indicates that the titanium plate affects the rise in the SAR0.1g value mostly within the tissues and organs surrounding the titanium plate. The maximum SAR0.1g value close to the titanium plate is 4.91 W/kg, approximately 2.3 times higher than the peak SAR0.1g value for the model without the plate.

3.3. Impact of the Face-to-Phone Distances on the Electric Field and SAR Distribution in the Implant Vicinity

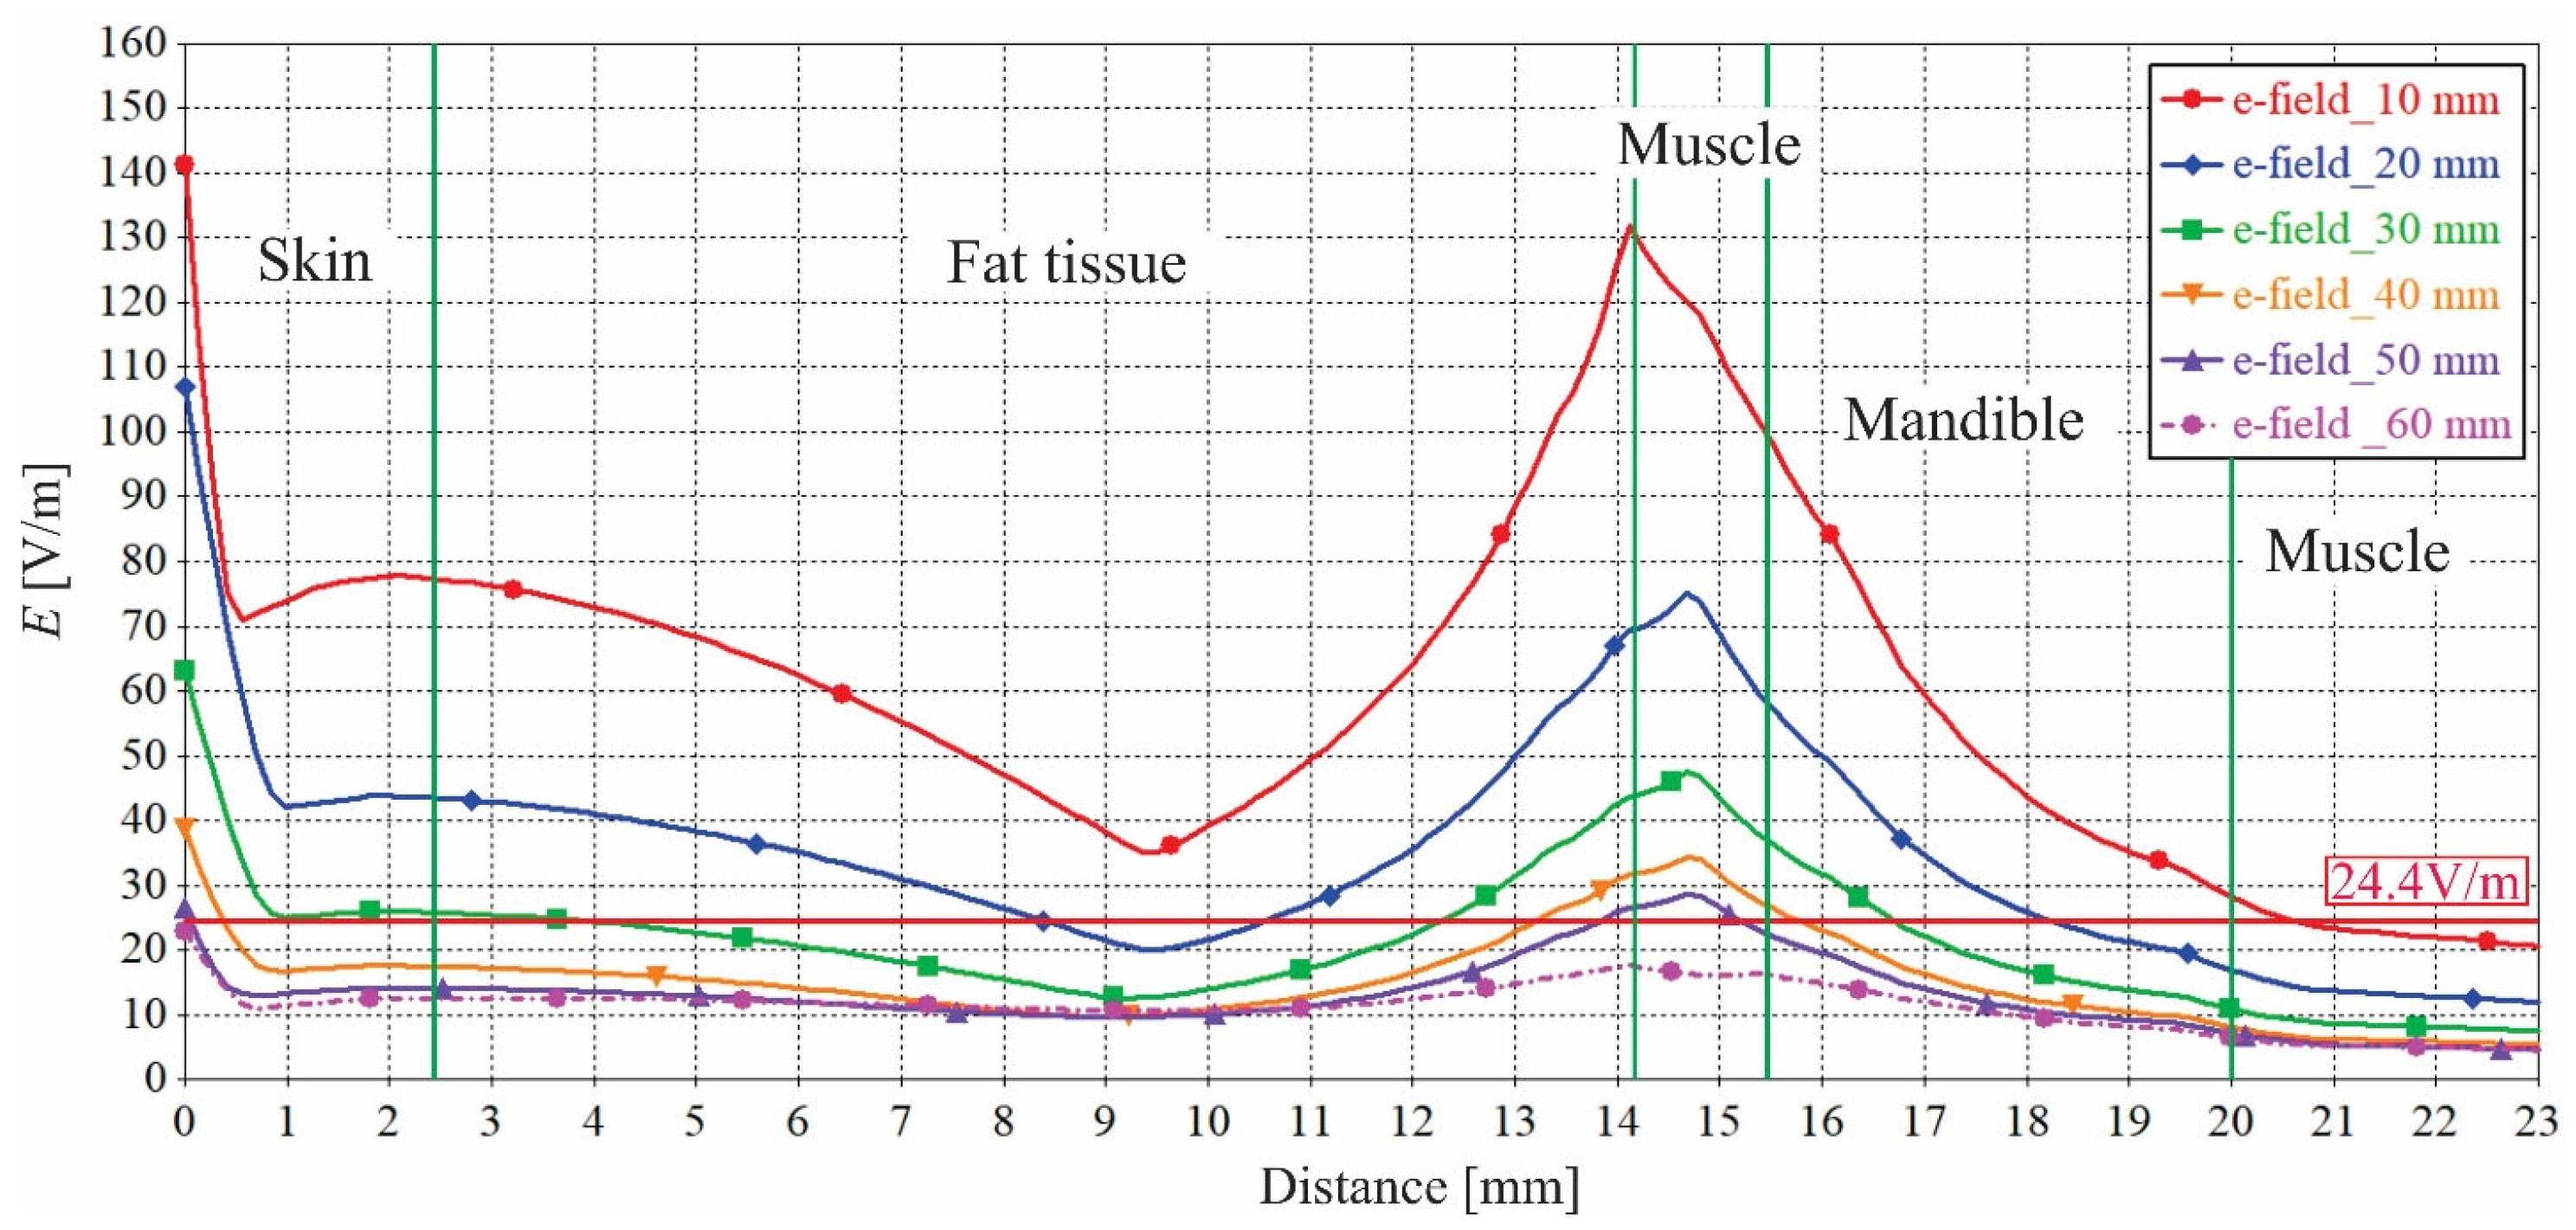
In this section, we examine how the proximity of a cell phone to a head influences the spread of electric field and SAR0.1g, which allows us to establish a safe distance where the electric field strength and SAR remain within the limits set by the standard [31]. The distance of the phone from the head varies between 1 cm and 6 cm with a step of 1 cm. We analyze the electric field and SAR distribution within cross-section A of the user’s head model (Figure 8a) and at line C (Figure 12).
The spatial distributions of the electric field intensity within head tissues and organs at distances ranging from 1 cm to 6 cm are shown in Figure 21a–f. The distribution along line C is illustrated in Figure 22.
The results presented in Figure 21 and Figure 22 show that the global maximum of the electric field intensity appears in the outermost layer of the head (skin), while a local maximum is located at the boundary between fat and muscle near the mandibular implant. As the phone retreats from the face, the intensity of the electric field decreases, and their maxima become smaller.
According to Figure 22, the electric field intensity exceeds the reference limit level for the electric field (24.4 V/m at a frequency of 2600 MHz) for distances up to 5 cm. However, a distance of 6 cm ensures that the strength of the electric field in the whole model is below the limits set by regulations.
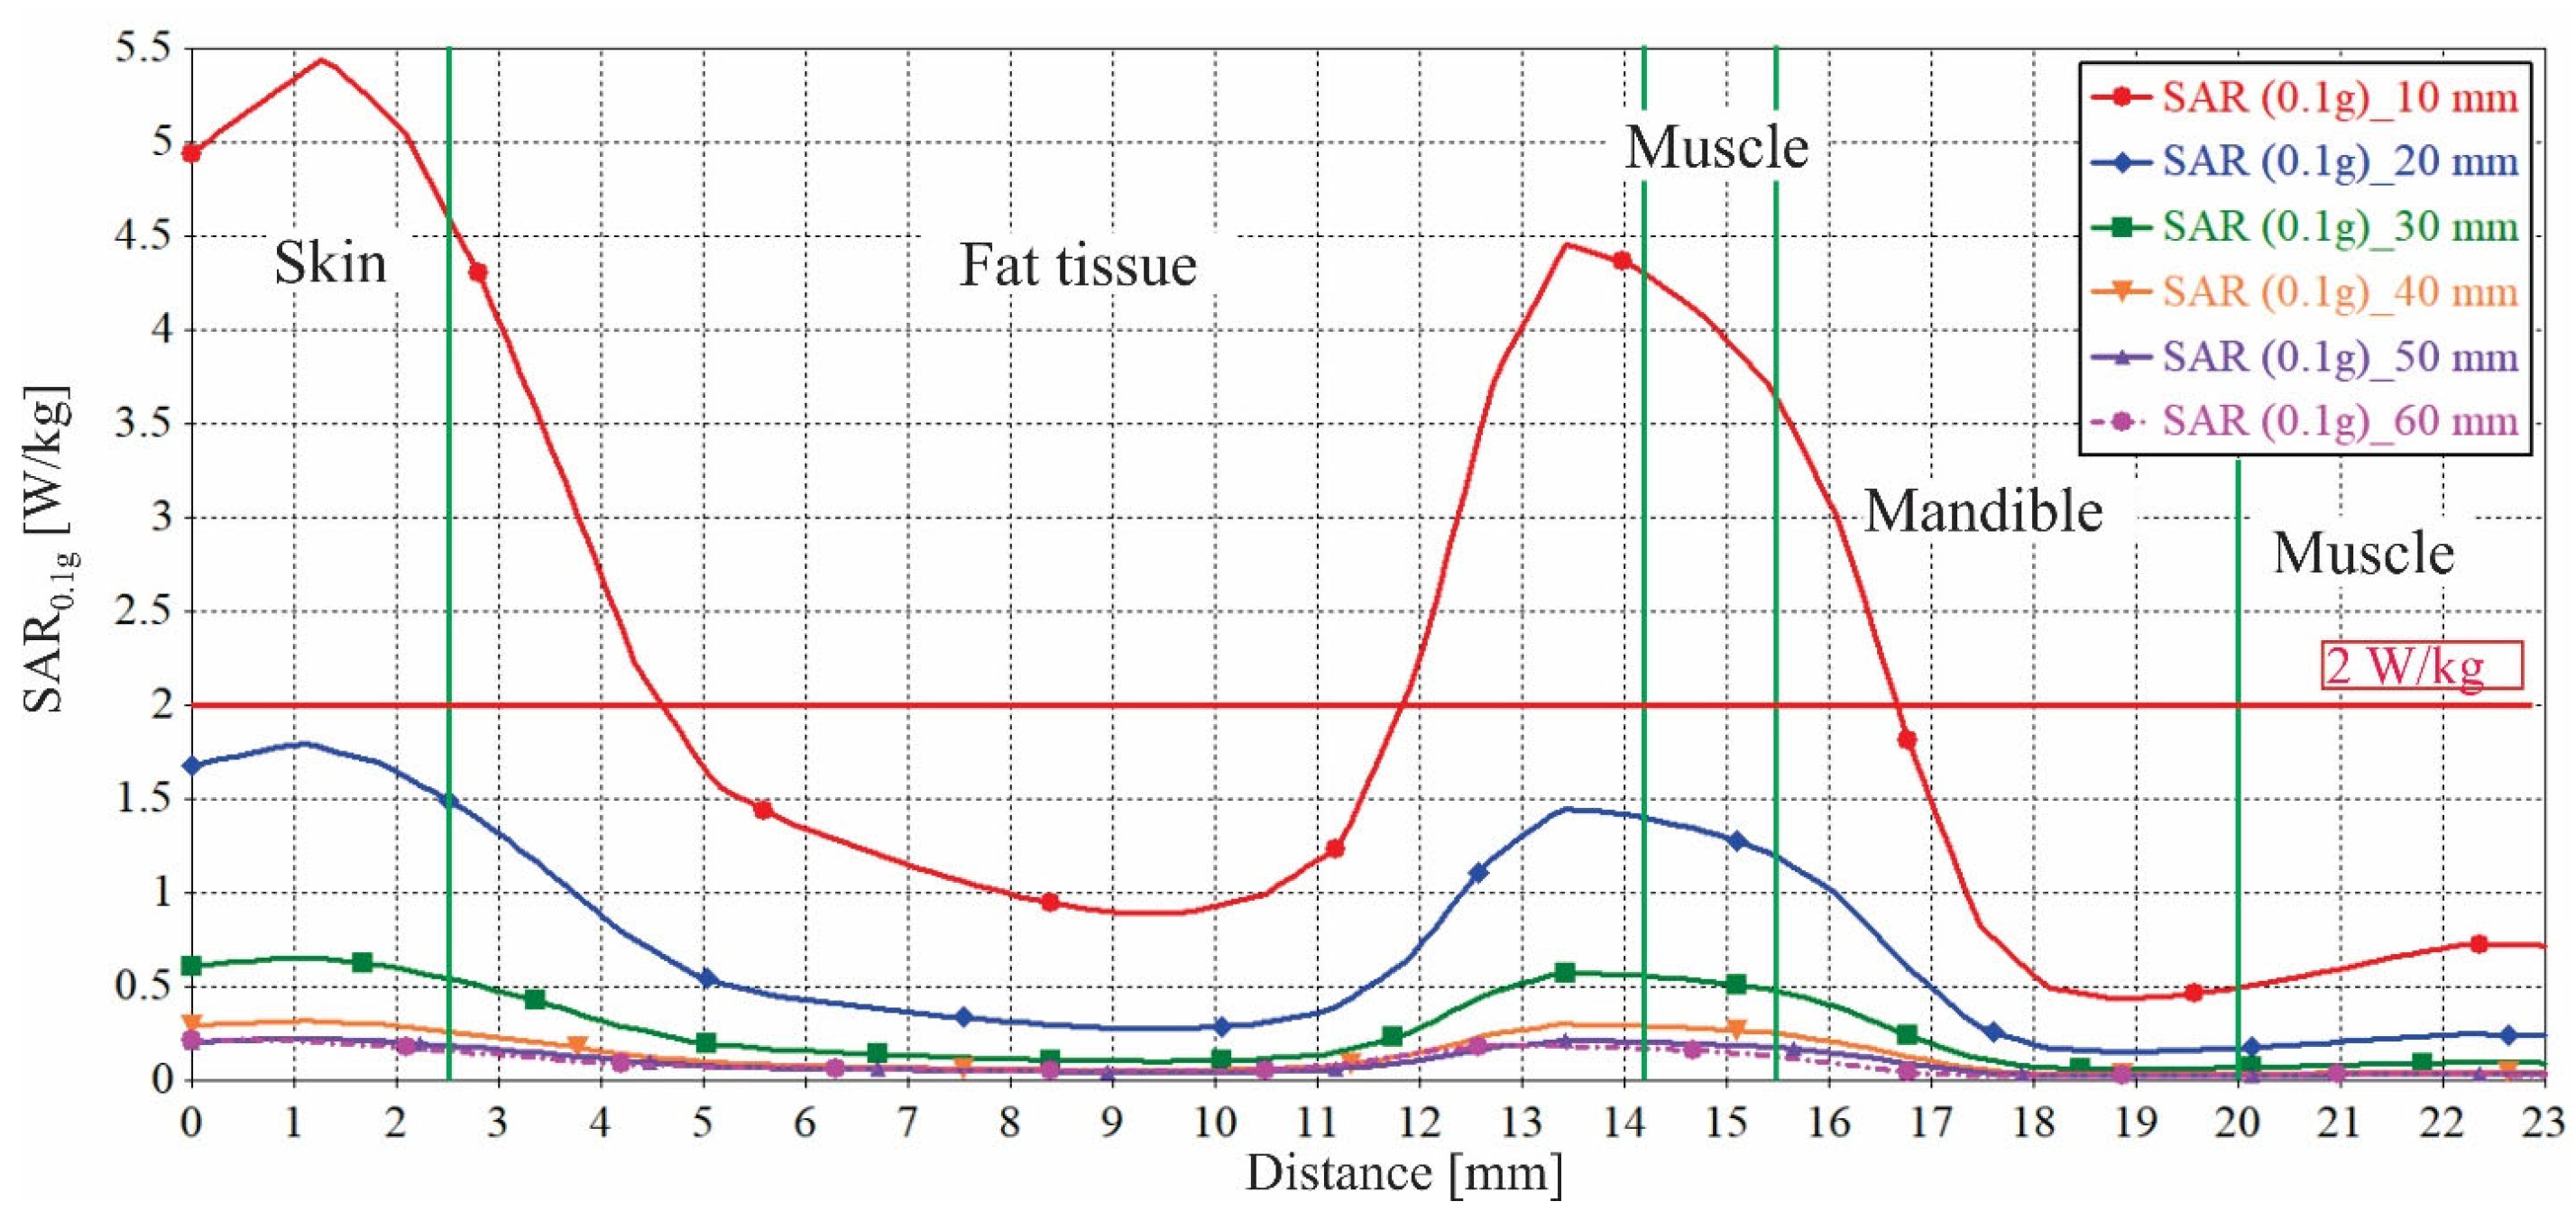
Figure 23a–f illustrates the spatial distributions of the SAR0.1g within head tissues and organs at distances from 1 cm to 6 cm. The distribution along line C is depicted in Figure 24.
The global maximum of SAR0.1g occurs inside the skin of the head model (Figure 24). The inner local maximum is evidently in the adipose tissue near the mandible. As the phone moves away from the face, the values of the SAR0.1g diminish, and their peaks lessen.
Unlike the electric field, which exceeds the permissible values for face-to-phone distances of up to 5 cm, the SAR0.1g values exceed the limit only at a distance of 1 cm (Figure 24). Starting at 2 cm, the SAR0.1g values comply with the established standards.

4. Conclusions

The widespread integration of mobile phones into daily life has contributed to a substantial increase in electromagnetic radiation exposure. Consequently, concerns regarding the specification of parameters related to the electromagnetic radiation emitted by mobile phones and its effects on users are justified. Considering that the impact of electromagnetic radiation from mobile devices is greatly affected by the composition and structure of the user’s head, it is reasonable to assume that metallic medical implants resulting from head and neck surgeries will notably influence the radiation distribution parameters. The findings in this study aim to clarify these aspects and provide a meaningful contribution to comprehending the impact of electromagnetic fields produced by mobile phones on the biological tissues of users.
One approach to evaluating the impact of radiation exposure involves determining the penetrated electromagnetic fields and the quantities of absorbed energy inside the user’s tissues. Nonetheless, ethical considerations restrict experimental research on individual exposure to electromagnetic fields in human populations. Therefore, we perform numerical simulations based on realistic 3D models of the head, phone, and a mandible implant to assess the penetrating field and energy.
The extreme worst case was considered in this study. The smartphone’s antenna is located in the microphone region, positioned at the same height as the user’s mouth, on the same side as the titanium implant, and tilted towards the face. With the antenna placed this way relative to the mandible, the effect of the implant is the largest. The electric field intensity and SAR are calculated for the cases without and with a titanium mandible implant and presented in the regions where the impact of an implant is the largest.
The presence of a titanium implant increases both the intensity of the electric field and the quantity of absorbed electromagnetic energy. The most significant differences between the both models (with and without the mandible implant) are noticeable in the fat and muscle tissues, along with the mandible where the titanium plate is secured with screws. The maximum strength of the electric field in the tissues around the titanium plate is 138.42 V/m, slightly more than double the field strength in the jaw without an implant. The mandible implant presence affects the rise in the SAR0.1g value, mostly within tissues surrounding the implant. The maximum SAR0.1g value close to the titanium plate is 4.91 W/kg, approximately 2.3 times higher than the peak SAR0.1g value for the model without the plate. The highest electric field strength and SAR0.1g value occur at the surface and 1 mm beneath the skin, respectively.
We have compared our numerical results to standards [31]. The maximal obtained electric field strength and SAR0.1g for the model without an implant occur inside the skin and exceed the limits 9.8 and 2.7 times, respectively. The field and SAR0.1g for the jaw with an implant are larger than the allowed values 9.8 and 2.8, respectively. Inner local maxima of the electric field strength and SAR0.1g appear in the muscle tissue near the implant and exceed the values prescribed by standards 5.7 and 2.5 times, respectively.
To identify the safe distance from the phone to the head when the electric field intensity and SAR values are below the permitted levels established by standards, we have examined various face-to-phone distances. Our numerical calculations indicate that electric field strength and SAR0.1g values are below the regulatory standards for distances of 6 cm and 2 cm, respectively.
The findings of this research may significantly affect both manufacturers of medical implants and the users and producers of mobile phones. Initially, medical implants made of non-metal materials would reduce or completely eliminate their influence on the electric field distribution and the amount of electromagnetic energy absorbed in the user’s head from mobile phones. Additionally, a multi-layered square-shaped metamaterial design for reducing electromagnetic absorption in wireless mobile devices can also be applied [24]. Ultimately, it is advised for individuals with titanium implants in the mandible to hold the phone on the side of the head that is opposite the implant during calls.

Author Contributions

Conceptualization, D.J., N.C. and B.P.; Methodology, D.J., D.K., V.S. and B.P.; Software, D.J.; Validation, D.J. and V.S.; Formal analysis, D.Ž.; Investigation, N.C.; Resources, D.K.; Writing—original draft, D.J.; Writing—review & editing, N.C., D.Ž. and B.P. All authors have read and agreed to the published version of the manuscript.

Funding

This work has been supported by the Ministry of Science, Technological Development and Innovation of the Republic of Serbia [Grant Number: 451-03-136/2025-03/200102].

Data Availability Statement

Data are contained within the article.

Conflicts of Interest

The authors declare no conflict of interest.

References

  1. Alpert, B.; Seligson, D. Removal of asymptomatic bone plates used for orthognathic surgery and facial fractures. J. Oral Maxillofac. Surg. 1996, 54, 618–621. [Google Scholar] [CrossRef] [PubMed]
  2. Rae, T. The biological response to titanium and titanium-aluminium-vanadium alloy particles. I. Tissue culture studies. Biomaterials 1986, 7, 30–36. [Google Scholar] [CrossRef] [PubMed]
  3. Haug, R.H. Retention of asymptomatic bone plates used for orthognathic surgery and facial fractures. J. Oral Maxillofac. Surg. 1996, 54, 611–617. [Google Scholar] [CrossRef]
  4. Katou, F.; Andoh, N.; Motegi, K.; Nagura, H. Immuno-inflammatory responses in the tissue adjacent to titanium miniplates used in the treatment of mandibular fractures. J. Cranio-Maxillo-Facial Surg. Off. Publ. Eur. Assoc. Cranio-Maxillo-Facial Surg. 1996, 24, 155–162. [Google Scholar] [CrossRef]
  5. Neumann, A.; Kevenhoerster, K. Biomaterials for craniofacial reconstruction. GMS Curr. Top. Otorhinolaryngol. Head Neck Surg. 2009, 8, Doc08. [Google Scholar] [CrossRef]
  6. Whittow, W.G.; Edwards, R.M.; Panagamuwa, C.J.; Vardaxoglou, J.C. Effect of tongue jewellery and orthodontist metallic braces on the SAR due to mobile phones in different anatomical human head models including children. In Proceedings of the Loughborough Antennas and Propagation Conference, Loughborough, UK, 17–18 March 2009; pp. 293–296. [Google Scholar] [CrossRef]
  7. Jovanović, B.D.; Krasić, D.D.; Stanković, B.V.; Cvetković, N.N.; Vucković, D.D. Electric field and SAR distribution in the vicinity of orthodontic brace exposed to the cell phone radiation. ACES J. 2019, 34, 1904–1914. [Google Scholar]
  8. Jovanović, D.; Krasić, D.; Cvetković, N.; Vucković, D.; Stanković, V. Electric Field and SAR Distribution in the Vicinity of Dental Implants Exposed to the Cell Phone Electromagnetic Radiation. COMPEL Int. J. Comput. Math. Electr. Electron. Eng. 2023, 45, 1052–1067. [Google Scholar] [CrossRef]
  9. Mortazavi, S.M.J.; Paknahad, M.; Khaleghi, I.; Eghlidospour, M. Effect of radiofrequency electromagnetic fields (RF-EMFS) from mobile phones on nickel release from orthodontic brackets: An in vitro study. Int. Orthod. 2018, 16, 562–570. [Google Scholar] [CrossRef]
  10. Fujii, Y. Gold alloy dental inlay for preventing involuntary body movements caused by electromagnetic waves emitted by a cell phone. Open J. Antennas Propag. 2014, 2, 37–43. [Google Scholar] [CrossRef]
  11. Chou, C.K.; McDougall, J.A.; Chan, K.W. RF heating of implanted spinal fusion stimulator during magnetic resonance imaging. IEEE Trans. Biomed. Eng. 1997, 44, 367–373. [Google Scholar] [CrossRef]
  12. Hocking, B.; Joyner, K.H.; Fleming, H.J. Implanted medical devices in workers exposed to radio-frequency radiation. Scand. J. Work. Environ. Health 1991, 17, 1–6. [Google Scholar] [CrossRef] [PubMed]
  13. Fleming, A.H.J.; Anderson, V.; Rowley, J.R. Computational estimate of the frequency response of metallic implants in biological tissues exposed to RF fields. In Proceedings of the ACES Annual Review of Progress in Applied Computational Electromagnetics, Monterey, CA, USA, 16–20 March 1999. [Google Scholar]
  14. Cooper, J.; Hombach, V. Increase in specific absorption rate in human heads arising from implantations. Electron. Lett. 1996, 32, 2217–2219. [Google Scholar] [CrossRef]
  15. Foster, K.R.; Goldberg, R.; Bonsignore, C. Heating of cardiovascular stents in intense radio frequency magnetic fields. Bioelectromagnetics 1999, 20, 112–116. [Google Scholar] [CrossRef]
  16. Crouzier, D.; Selek, L.; Martz, B.A.; Dabouis, V.; Arnaud, R.; Debouzy, J.-C. Risk assessment of electromagnetic fields exposure with metallic orthopedic implants: A cadaveric study. Orthop. Traumatol. Surg. Res. 2012, 98, 90–96. [Google Scholar] [CrossRef]
  17. Turgut, A.; Engiz, B.K. Analyzing the SAR in human head tissues under different exposure scenarios. Appl. Sci. 2023, 13, 6971. [Google Scholar] [CrossRef]
  18. Christopher, B.; Mary, S.; Khandaker, M.U.; Jojo, P.J. Empirical study on specific absorption rate of head tissues due to induced heating of 4G cell phone radiation. Radiat. Phys. Chem. 2021, 178, 108910. [Google Scholar] [CrossRef]
  19. Tian, R.; Wu, Y.-Q.; Lu, M.; Miao, X.-F. Specific absorption rate and temperature distributions in the human head with implanted deep brain stimulation subjected to mobile phone electromagnetic radiation. Electronics 2023, 12, 4389. [Google Scholar] [CrossRef]
  20. Benova, M.; Mydlova, J.; Psenakova, Z.; Smondrk, M. SAR evaluation in human head models with cochlear implant near PIFA antenna inside a railway vehicle. In Formation Technology in Biomedicine; Advances in Intelligent Systems and Computing; Springer: Cham, Switzerland, 2021; Volume 1186. [Google Scholar] [CrossRef]
  21. Virtanen, H.; Keshvari, J.; Lappalainen, R. The effect of authentic metallic implants on the SAR distribution of the head exposed to 900, 1800 and 2450 MHz dipole near field. Phys. Med. Biol. 2007, 52, 1221–1236. [Google Scholar] [CrossRef]
  22. Živaljević, D.; Jovanović, D.; Krasić, D.; Cvetković, N.; Petković, B. Impact of titanium cranial implants on the electric field and SAR distribution induced by mobile phones within the user’s head. Electronics 2024, 13, 4551. [Google Scholar] [CrossRef]
  23. Yi, M.; Wu, B.; Zhao, Y.; Su, T.; Chi, Y. Safety assessment and uncertainty quantification of electromagnetic radiation from mobile phones to the human head. Appl. Sci. 2023, 13, 8107. [Google Scholar] [CrossRef]
  24. Ramachandran, T.; Faruque, M.R.I.; Islam, M.T. Specific absorption rate reduction for sub-6 frequency range using polarization dependent metamaterial with high effective medium ratio. Sci. Rep. 2022, 12, 1803. [Google Scholar] [CrossRef] [PubMed]
  25. CST Microwave Studio, version 2012; Computer Simulation Technology: Framingham, MA, USA, 2012.
  26. Clemens, M.; Weiland, T. Discrete electromagnetism with the finite integration technique. Prog. Electromagn. Res. 2001, 32, 65–87. [Google Scholar] [CrossRef]
  27. Toro, J.; Choukiker, Y.K. Design and analysis of meanderline PIFA antenna with MIMO system for mobile handheld device. In Proceedings of the International Conference on Trends in Electronics and Informatics, Tirunelveli, India, 11–12 May 2017; pp. 1061–1065. [Google Scholar]
  28. IEEE C95.3-2002; IEEE Recommended Practice for Measurements and Computations of Radio Frequency Electromagnetic Fields with Respect to Human Exposure to Such Fields, 100 kHz–300 GHz. IEEE: New York, NY, USA, 2002. [CrossRef]
  29. Ebrahimi-Ganjeh, M.A.; Attari, A.R. Interaction of dual band helical and PIFA handset antennas with human head and hand. Prog. Electromagn. Res. 2007, 77, 225–242. [Google Scholar] [CrossRef]
  30. IEC/IEEE 62704-1; IEC/IEEE International Standard-Determining the Peak Spatial-Average Specific Absorption Rate (SAR) in the Human Body from Wireless Communications Devices, 30 MHz to 6 GHz-Part 1: General Requirements for Using the Finite-Difference Time-Domain (FDTD) Method for SAR Calculations; 27 October 2017. IEEE Standards Association: Piscataway, NJ, USA, 2017; pp. 1–86.
  31. Available online: http://demo.paragraf.rs/demo/combined/Old/t/t2009_12/t12_0270.htm (accessed on 5 September 2020).
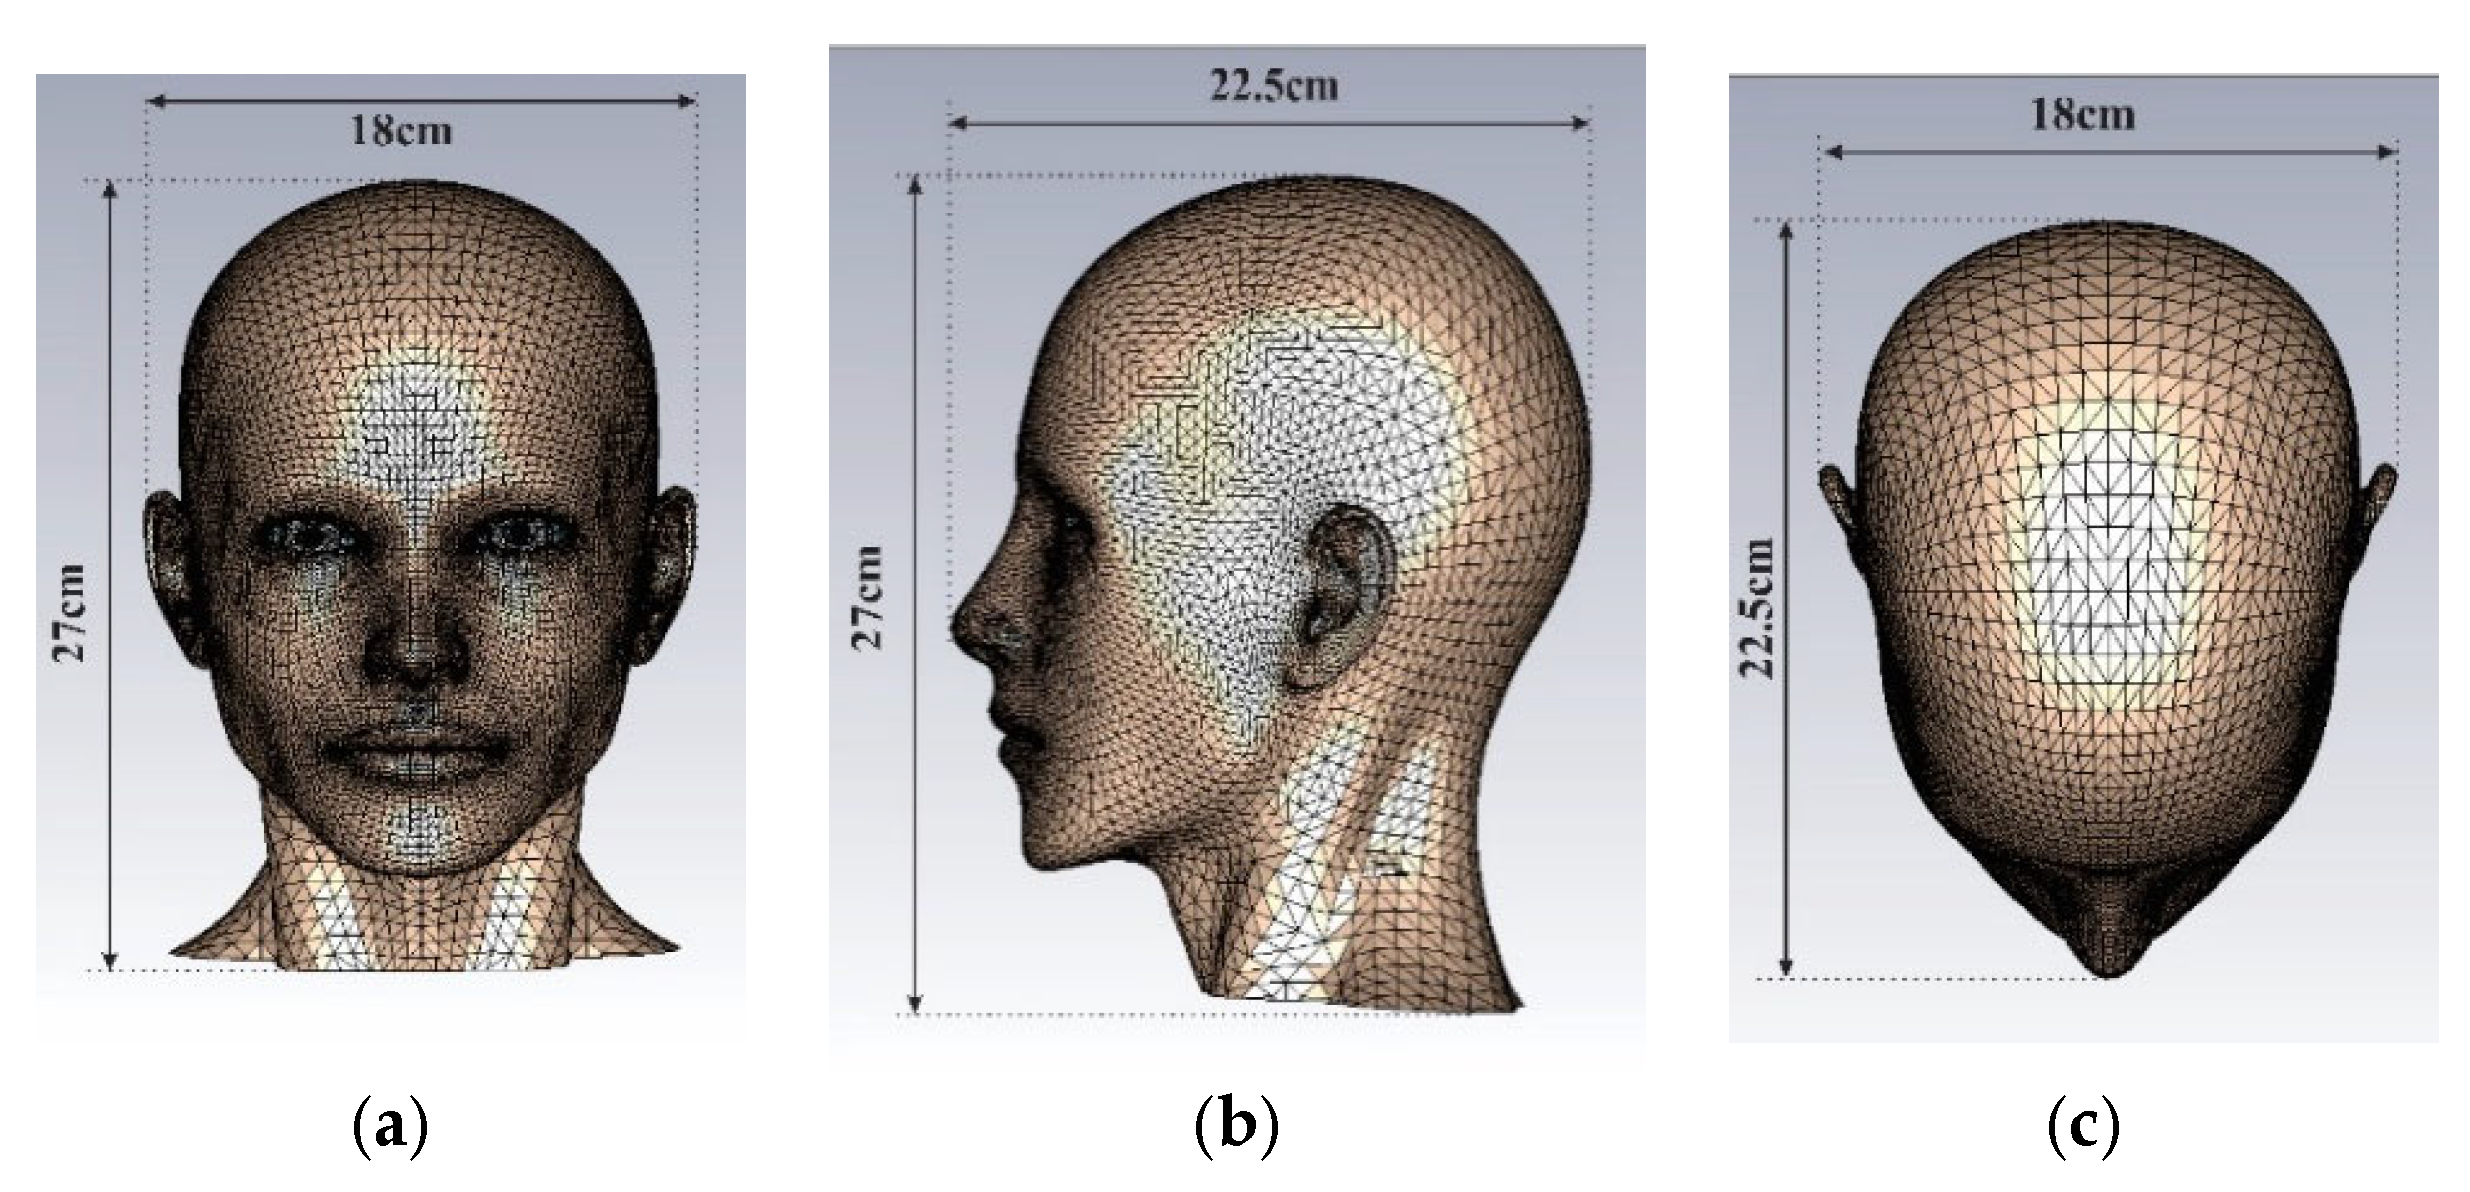
Figure 1. External appearance with dimensions of a typical adult’s head 3D model: (a) anterior view, (b) side view, and (c) top view.
Electronics 14 02096 g001
Figure 2. (a) Sagittal, (b) coronal, and (c) transverse cross-sections of the head model.
Electronics 14 02096 g002
Figure 3. Real titanium plates and screws and their CT scan.
Electronics 14 02096 g003
Figure 4. 3D model of a mandible implant.
Electronics 14 02096 g004
Figure 5. Representation of the three-dimensional cell phone model.
Electronics 14 02096 g005
Figure 6. S-parameters of antenna.
Electronics 14 02096 g006
Figure 7. Radiation pattern of antenna for (a) φ = 0°, (b) φ = 90° and (c) θ = 90°.
Electronics 14 02096 g007
Figure 8. Cross-sectional views of the head model used for analyzing the obtained results in the case of a titanium plate for securing mandible bone fragments: (a) cross-section A, (b) cross-section B, and (c) cross-section C.
Electronics 14 02096 g008
Figure 9. Spatial distribution of the electric field, E [V/m], in cross-section A: (a) with mandible implant and (b) without mandible implant.
Electronics 14 02096 g009
Figure 10. Spatial distribution of the electric field, E [V/m], in cross-section B: (a) with mandible implant and (b) without mandible implant.
Electronics 14 02096 g010
Figure 11. Spatial distribution of the electric field, E [V/m], in cross-section C: (a) with mandible implant and (b) without mandible implant.
Electronics 14 02096 g011
Figure 12. Line C for evaluation of obtained results.
Electronics 14 02096 g012
Figure 13. Electric field E [V/m] along line C.
Electronics 14 02096 g013
Figure 14. SAR0.1g [W/kg] in cross-section A: (a) with mandible implant and (b) without mandible implant.
Electronics 14 02096 g014
Figure 15. SAR1g [W/kg] in cross-section A: (a) with mandible implant and (b) without mandible implant.
Electronics 14 02096 g015
Figure 16. SAR0.1g [W/kg] in cross-section B: (a) with mandible implant and (b) without mandible implant.
Electronics 14 02096 g016
Figure 17. SAR1g [W/kg] in cross-section B: (a) with mandible implant and (b) without mandible implant.
Electronics 14 02096 g017
Figure 18. SAR0.1g [W/kg] in cross-section C: (a) with mandible implant and (b) without mandible implant.
Electronics 14 02096 g018
Figure 19. SAR1g [W/kg] in cross-section C: (a) with mandible implant and (b) without mandible implant.
Electronics 14 02096 g019
Figure 20. SAR0.1g along line C.
Electronics 14 02096 g020
Figure 21. The spatial distribution of the electric field inside the user’s head model for various distances of the radiation source from the user’s face: (a) 1 cm, (b) 2 cm, (c) 3 cm, (d) 4 cm, (e) 5 cm, and (f) 6 cm.
Electronics 14 02096 g021
Figure 22. Electric field intensity along line C for various distances of the radiation source from the user’s face. The limit according to the standard [31] is indicated by a horizontal red line.
Electronics 14 02096 g022
Figure 23. The spatial distribution of SAR0.1g inside the user’s head model for various distances of the radiation source from the user’s face: (a) 1 cm, (b) 2 cm, (c) 3 cm, (d) 4 cm, (e) 5 cm, and (f) 6 cm.
Electronics 14 02096 g023
Figure 24. SAR0.1g along line C for various distances of the radiation source from the user’s face. The limit according to the standard [31] is indicated by a horizontal red line.
Electronics 14 02096 g024
Disclaimer/Publisher’s Note: The statements, opinions and data contained in all publications are solely those of the individual author(s) and contributor(s) and not of MDPI and/or the editor(s). MDPI and/or the editor(s) disclaim responsibility for any injury to people or property resulting from any ideas, methods, instructions or products referred to in the content.