Article

HRDS: A High-Dimensional Lightweight Keypoint Detection Network Enhancing HRNet with Dim-Channel and Space Gate Attention Using Kolmogorov-Arnold Networks

1
College of Informatics, Huazhong Agricultural University, Wuhan 430070, China
2
Key Laboratory of Intelligent, Huazhong Agricultural University, Wuhan 430070, China
3
Technology in Animal Husbandry, Ministry of Agriculture and Rural Affairs, Wuhan 430070, China
4
Engineering Research Center of Smart Agricultural Technology, Ministry of Education, Wuhan 430070, China
5
Hubei Province Research Center of Engineering Technology of Agricultural Big Data, Wuhan 430070, China
*
Authors to whom correspondence should be addressed.
Electronics 2025, 14(10), 2038; https://doi.org/10.3390/electronics14102038
Submission received: 1 April 2025 / Revised: 29 April 2025 / Accepted: 14 May 2025 / Published: 16 May 2025

Abstract

:
Animal keypoint detection holds significant applications in fields such as biological behavior research and animal health monitoring. Although related research has reached a relatively mature stage of human keypoint detection, it still faces numerous challenges in the realm of animal keypoint detection. Firstly, there is a scarcity of keypoint detection datasets related to animals in public datasets. Secondly, existing solutions have adopted large-scale deep learning models to achieve higher accuracy, but these models are costly and difficult to widely promote within the industry. On the other hand, small-scale, low-cost detection models that are used to reduce costs suffer from insufficient accuracy and cannot meet the needs of industrial production. Therefore, designing and implementing a lightweight and high-accuracy animal keypoint detection model to meet industry needs has significant theoretical and practical importance. Addressing the aforementioned issues, this thesis proposes a lightweight animal keypoint detection method, HRDS, which maintains high accuracy while significantly reducing model complexity. Firstly, by removing the fourth stage from the HRNet architecture, the number of parameters and the computational complexity of the model are successfully reduced. Secondly, to enhance the model’s performance and robustness, a new attention mechanism module, DS, is designed. This module effectively counterbalances the loss of accuracy due to the significant reduction in the parameter count and helps to strengthen the model’s keypoint detection capability in complex scenarios. Experiments were performed on the AP-10K dataset, and the results indicated that the HRDS method achieves an accuracy rate of 70.34%, with a 73.05% reduction in the number of parameters compared to HRNet and only a 2.64% decrease in accuracy, maintaining high precision. The inference time of HRDS reaches 26.58 ms, with an inference speed of 37.62 FPS, and its inference time is only 87.3% of that of HRNet. This provides a new solution for applications in resource-constrained environments.

1. Introduction

Animal pose estimation is a technique that utilizes computer vision and deep learning to automatically identify and locate various parts of an animal’s body from image data or video data. This technology has a wide range of applications in biology, ecology, neuroscience, and other fields, including but not limited to animal behavior analysis, wildlife protection, animal health monitoring, and so on [1,2]. This technique leverages deep learning and computer vision methods to automatically identify and localize different body parts of animals from images or video data, providing a theoretical basis for animal behavior analysis, wildlife conservation, and health monitoring. Most existing pose estimation methods were initially developed for humans, and CNNs have achieved tremendous success in the field of human pose estimation [3], but they can be directly applied to animals by simply redefining the keypoints of the body [4].
However, reducing the complexity and computational cost of animal pose estimation models remains a pressing challenge. State-of-the-art animal pose estimation algorithms, including convolutional neural networks (CNNs) based on deep learning and Transformer models [5,6,7,8,9] incorporating attention mechanisms, often introduce deep architectures and large parameter counts to achieve high accuracy. While such models improve precision, they also significantly increase training and inference costs, thereby limiting their deployment on mobile devices and embedded platforms. This issue is particularly critical in edge computing and real-time applications, where constraints on computational resources and power consumption hinder the deployment of high-complexity models. Therefore, developing model lightweighting strategies to reduce complexity while maintaining high accuracy has become a major focus of both academia and industry [10,11].
To address these challenges, this paper proposes a high-dimensional feature learning framework designed to enhance the generalization and robustness of animal keypoint detection. Specifically, we employ Kolmogorov–Arnold Networks (KANs) [12] to model complex dependencies among keypoints in high-dimensional space, enabling the network to learn more expressive feature representations that can adapt to diverse animal species and pose variations. Furthermore, we introduce a contextual pooling strategy that adaptively refines the pooling process, mitigating the information loss associated with traditional pooling methods and preserving the integrity of keypoint features. To further optimize spatial and channel-wise feature representations, we design Dim-Channel Aware Attention (DCAA) and Space Gate Attention (SGA) mechanisms to enhance intra-channel and inter-channel feature interactions, respectively. These mechanisms improve keypoint detection accuracy, particularly in scenarios involving occlusions or complex backgrounds. KANs achieve enhanced parameter efficiency by employing B-spline functions as activation functions, allowing complex functional relationships to be represented with fewer parameters. This property makes KANs particularly advantageous for processing high-dimensional data and complex functions while simultaneously reducing model size.
The core advantage of our approach lies in its strong generalization capability, which enables it to transcend species specificity and maintain stable detection performance across various animal categories. By leveraging KANs’ high-dimensional representation learning, the model captures nonlinear relationships among keypoints, thereby improving robustness to pose variations and self-occlusions. Additionally, our method is optimized for computational efficiency, ensuring that high-dimensional feature learning does not introduce excessive computational overhead, thus maintaining high accuracy while enhancing practical applicability.
In summary, the main contributions of this paper include the following:
  • We proposed a new pooling operation known as Contextual Pooling. This pooling method combines the advantages of Maximum Pooling and Average Pooling, and it can dynamically calculate the pooling weights according to the features.
  • We propose new attention mechanisms, designated Dim-Channel-Aware Attention (DCAA) and Space Gate Attention (SGA). According to the characteristics of the KAN, the features are effectively extracted in the high-dimensional space. DCAA with the help of the KAN enhances the perception of the channel dimension, and SGA with the help of the KAN convolution enhances the key part of the spatial feature attention ability. feature attention capability for key parts of the space. The two attention mechanisms introduce a very small number of parameters and amount of computational burden to the model, which makes them very suitable for use in lightweight models.
  • HRDS, a lightweight animal keypoint detection model, is proposed. By analyzing HRNet, the redundant network structure is removed, and in order to counterbalance the decrease in accuracy due to the decrease in the number of parameters, two attention mechanisms, the DCAA and SGA modules, are introduced.
  • Experiments show that HRDS can be used in arithmetic-constrained scenarios and achieves good performance, striking a balance between the complexity and accuracy of the model.

2. Related Works

2.1. Animal Keypoint Detection

Unlike traditional image-processing-based approaches, keypoint detection methods based on deep learning extract features through deep neural network models and perform keypoint localization directly. Traditional image processing methods are incapable of capturing higher-level semantic information and therefore cannot match the performance achieved by deep learning techniques. Currently, owing to the availability of large-scale public human keypoint datasets, such as the MPII [13] dataset and the COCO dataset [14] dataset, keypoint detection methods for humans have become relatively mature and are capable of adapting to complex scenarios. Motivated by this progress, some researchers have begun exploring the application of human keypoint detection techniques to the domain of animal pose estimation.
Deep learning has significantly advanced keypoint detection in recent years, leading to the development of numerous models tailored for different aspects of the task. Early approaches, such as DeepPose [15], formulated pose estimation as a direct coordinate regression problem using deep neural networks. Following this line, DSNT [16] introduced differential normalization to achieve stable end-to-end coordinate regression, while SimCC [17] reformulated coordinate prediction as a classification task to balance precision and stability. More recent lightweight methods such as RLE [18], RTMPose [19], and ED-Pose [20] have further enhanced regression-based models with an emphasis on real-time performance and computational efficiency.EAPoseNet [21] is a lightweight animal pose estimation network designed for low-computing-power environments. It achieves real-time and high-accuracy keypoint detection even under resource constraints. Ref. [22] utilizes LSTM to achieve real-time gesture detection on embedded devices.
Meanwhile, heatmap-based methods have become the dominant framework for keypoint detection. CPM [23] pioneered the stage-wise refinement of heatmap predictions, and Hourglass networks leveraged a symmetric encoder–decoder structure to effectively capture multi-scale contextual information. SimpleBaseline2D [24] demonstrated that straightforward backbones such as ResNet [25] combined with deconvolution layers can achieve strong results [26,27,28], while HRNet further pushed performance by maintaining high-resolution features throughout the network. MSPN [29] introduced multi-stage progressive refinement to boost localization accuracy, and subsequent works such as SCNet [30], RSN [31], and DarkPose [32] have refined the design of heatmap-based architectures, improving feature representation and decoding strategies.
Several studies have focused on enhancing loss functions to better fit keypoint distributions. WingLoss [33] emphasized small-error regions to improve localization precision, AdaptiveWingLoss [34] dynamically adjusted the penalty based on the difficulty of each keypoint, and SoftWingLoss [35] introduced a smoother loss design for greater robustness against outliers. In parallel, spatial relationship modeling between keypoints has also gained attention. IPR [36] achieved accurate localization through an integral regression approach, with Debias IPR further improving consistency by correcting bias. Inte+ArrNet combined integral regression with relational reasoning to better capture inter-keypoint dependencies.
With the growing demand for practical applications, efficiency-oriented architectures have emerged. LiteHRNet [37] maintained high-resolution representations while significantly reducing computational complexity, and YoloPose integrated keypoint detection into object detection frameworks for real-time inference. ViPNAS [38] applied neural architecture search techniques to design compact and effective pose estimation models.
Recently, Transformer-based architectures have entered the field of keypoint detection. ViTPose [39] employed pure Transformer structures to directly model the spatial dependencies of keypoints, achieving competitive performance across benchmarks. Additionally, new keypoint representation paradigms have been explored. UDP [40] addressed biases inherent in heatmap-based training pipelines, CID [41] proposed an integral distribution method to better balance accuracy and stability, and DEKR introduced deformable convolutions to adaptively regress keypoints under complex pose variations.

2.2. Kolmogorov–Arnold Networks

Inspired by the Kolmogorov–Arnold representation theorem, Kolmogorov–Arnold Networks have been proposed as a novel neural network architecture for addressing complex function approximation problems [12]. The core idea of KANs is to approximate target functions through the superposition of a series of nonlinear functions, allowing the network to learn activation functions that better capture and represent the intricate relationships within high-dimensional data. The Kolmogorov-Arnold representation theorem states that if a function f is a multivariate continuous function defined over a bounded domain, then f can be expressed as a finite composition of univariate continuous functions and binary addition operations. Formally, a multivariate function f ( x ) can be represented as shown in Equation (1):
f ( x ) = f ( x 1 , , x n ) = q = 1 2 n + 1 Φ q ( p = 1 n ϕ q , p ( x p ) )
Here, ϕ q , p represents a univariate function of the variable x p , where ϕ q , p : [ 0 , 1 ] R , and Φ q : R R is also a univariate function. If a multivariate function is reduced to the learning of multiple univariate functions, these univariate functions may exhibit non-smoothness. To address this issue, ϕ q , p is modeled using a parameterized B-spline function, where c i are trainable parameters, as shown in Equations (2)–(4):
ϕ ( x ) = w b b ( x ) + w s spline ( x )
b ( x ) = silu ( x ) = x 1 + e x
spline ( x ) = i c i B i ( x )
The overall structure of a KAN is similar to that of a multi-layer perceptron (MLP); however, it enhances the model’s expressive capacity by employing nonlinear activation functions. The transformation at each layer, denoted as Φ l , operates on the input x l from the previous layer. The final formulation is expressed as shown in Equations (5) and (6):
KAN ( x ) = ( Φ l 1 Φ l 2 Φ 0 ) ( x )
x l + 1 = Φ l ( x l ) = ϕ l , 1 , 1 ( · ) ϕ l , 1 , n l ( · ) ϕ l , n l + 1 , 1 ( · ) ϕ l , n l + 1 , n l ( · ) x l

2.3. KAN Convolution

Convolution is one of the most fundamental operations in computer vision, primarily used to extract local features from images. It mimics the human eye’s ability to focus on local regions by sliding a small window (convolutional kernel) over the input features and extracting features block by block.
In KAN convolution (KANConv), the Kolmogorov–Arnold representation theorem and KAN network methodology are leveraged to define the convolutional kernel as a learnable nonlinear function [42], following the formulation shown in Equation (2), where each element of the convolutional kernel is given by ϕ ( x ) .
In the standard convolution operation for computer vision, the process can be interpreted as the kernel sliding over the input feature region, performing element-wise multiplication, summing the results, and applying an activation function. The mathematical formulation is expressed as shown in Equation (7), where the convolutional kernel is denoted as K R m × n , the input feature as X R H × W × C , and the output feature as Y . The indices a , b represent the spatial locations in the output feature map:
Y a , b = i = 0 m 1 j = 0 n 1 X a + i , b + j · K i , j
In KANConv, the convolutional kernel K R m × n is defined as shown in Equation (8):
K = ϕ 1 , 1 ( · ) ϕ 1 , 2 ( · ) ϕ 1 , n ( · ) ϕ m , 1 ( · ) ϕ m , 2 ( · ) ϕ m , n ( · )
The final formulation of KANConv is expressed as shown in Equation (9):
Y a , b = i = 0 m 1 j = 0 n 1 ϕ i , j ( X a + i , b + j )

3. Methods

3.1. Contextual Pooling

Pooling is an important technique in signal processing and data analysis, widely used in fields such as computer vision, speech recognition, and natural language processing [43,44,45,46]. In image processing, pooling typically refers to reducing the spatial resolution of an image, thereby lowering the dimensionality of the data while preserving the key information in the image. The goal of pooling is to reduce the data size while retaining important feature information.
However, traditional pooling methods, such as max pooling and average pooling, may fail to fully exploit the fine-grained information within the input feature map in certain cases [47,48]. The most common pooling operations are generally max pooling and average pooling. Max pooling only focuses on extreme values within local regions, neglecting non-extreme values that may also be important features. Average pooling, on the other hand, may lead to excessive smoothing of significant features, resulting in the loss of important spatial information. These limitations restrict the performance of traditional pooling methods in complex tasks.
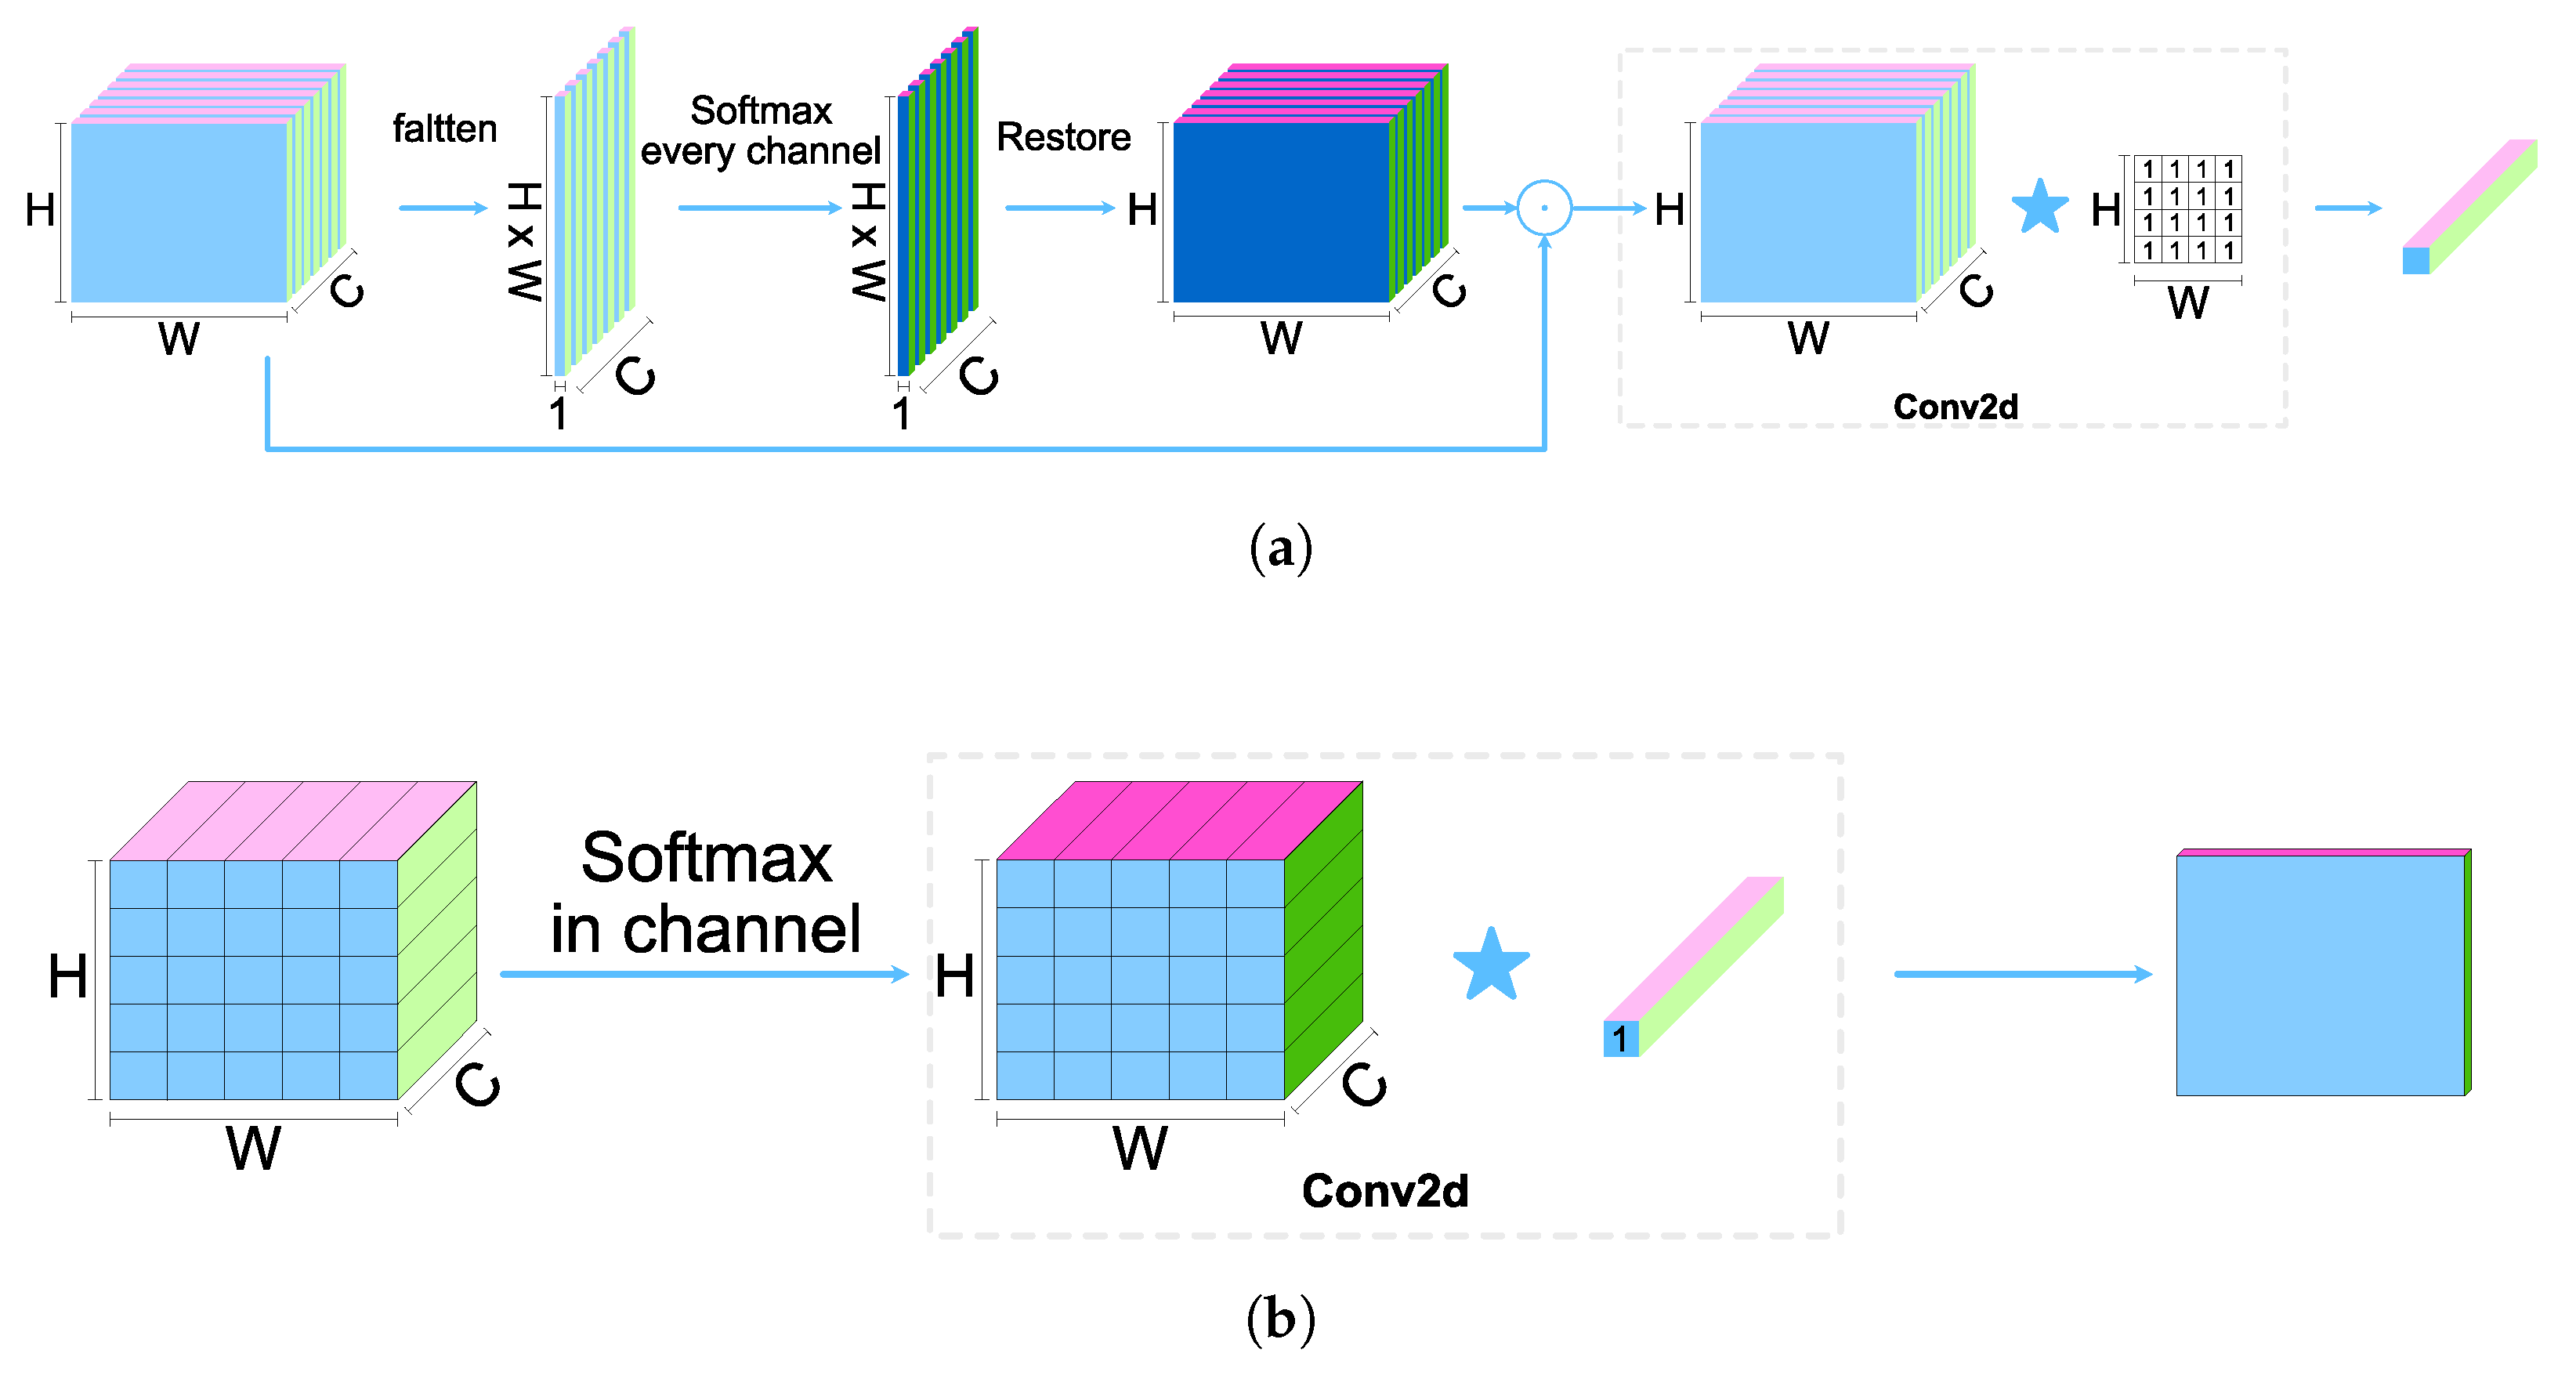
To address these issues, this paper proposes a context-aware pooling method: Contextual Pooling. Unlike traditional pooling methods, contextual pooling dynamically adjusts the weight of each region during the sampling process, allowing each region in the feature map to be adaptively weighted based on its importance. This method not only considers the features of the local regions but also incorporates the contextual relationships between regions, thus better preserving key feature information during pooling. By doing so, contextual pooling overcomes the limitations of traditional pooling methods in handling complex structures and details, enhancing the accuracy of feature extraction and the robustness of the model.
The specific implementation steps are as follows: Given the input feature X R H × W × C , the absolute value is first taken at each spatial position ( i , j ) , resulting in | X | . This operation addresses the potential weight distribution bias issue in the traditional Softmax function when dealing with features that contain negative values. Negative values, after being processed by the exponential function, experience a sharp decay in magnitude, which results in them being assigned extremely low weights during pooling, thus affecting the accurate representation of features. By introducing an absolute value preprocessing mechanism, this bias is corrected, allowing high-magnitude negative activations to participate in the weight distribution on equal terms with positive activations. This helps more accurately reflect the relative importance of feature magnitudes, further enhancing the adaptivity and accuracy of the pooling process.
In Contextual Pooling, by introducing context-aware weight distribution, the feature of each spatial position dynamically adjusts its weight based on its relative importance. This allows important regions to be assigned higher weights during the pooling operation, which helps retain crucial information more effectively. Particularly when dealing with complex images or multi-scale data, this method can significantly enhance the robustness and expressive power of the model. Contextual pooling not only addresses the limitations of traditional pooling methods but also enhances the spatial correlation of the features, thereby improving the performance of downstream tasks.
A 2D Softmax calculation is performed on the preprocessed features to generate the weight matrix W R H × W × C , for each channel, as shown in Equation (10), where W i , j represents the context-aware weights:
W i , j = exp ( | X i , j | ) m = 0 H 1 n = 0 W 1 exp ( | X m , n | )
where ( i , j ) represents the local coordinates in the feature map. This step uses the Softmax function to map the local feature magnitudes to a probability distribution, ensuring that regions with stronger responses receive higher weights. The features of each spatial location are dynamically weighted according to their contextual information, thus adjusting the pooling process based on the importance of different regions. Through the Softmax function, the local feature magnitudes are transformed into a probability distribution, ensuring that regions with stronger responses are assigned higher weights during pooling, thereby enhancing their influence on the final feature representation. Next, the generated weight matrix W is multiplied element-wise by the original input features X , enabling adaptive weighting of the features. This ensures that key information is preserved while reducing the influence of less important areas. This mechanism ensures that the pooling operation not only relies on local extrema but also takes into account the relative importance of spatial positions, further enhancing the accuracy of feature representation and the model’s expressive capacity.
X ˜ i , j = W i , j · X i , j
Finally, the weighted window undergoes pooling. This pooling operation is implemented through convolution, as shown in Equation (12). The feature map, which has been weighted by contextual pooling, has already been adaptively adjusted through the weights, ensuring that the features of each spatial location are weighted according to their importance in the overall image. Next, to further reduce the size of the feature map while retaining the key information from the weighted features, a convolution operation is applied to process the weighted feature map.
Y = X ˜ K
Here, the size of the convolution kernel K and the convolution stride are both equal to the pooling factor, with all convolution kernel weights set to 1. By fixing the convolution kernel weights to 1, the summation operation ensures that no additional trainable parameters are introduced, maintaining the parameter-free nature of classical pooling layers. This convolution process is not merely a simple pooling operation but is performed on a weighted basis that takes into account both local features and contextual relationships. This effectively avoids the issues in traditional pooling operations, such as over-smoothing significant features or neglecting important information. The schematic diagrams of the contextual pooling operation are shown in Figure 1.

3.2. HRDS

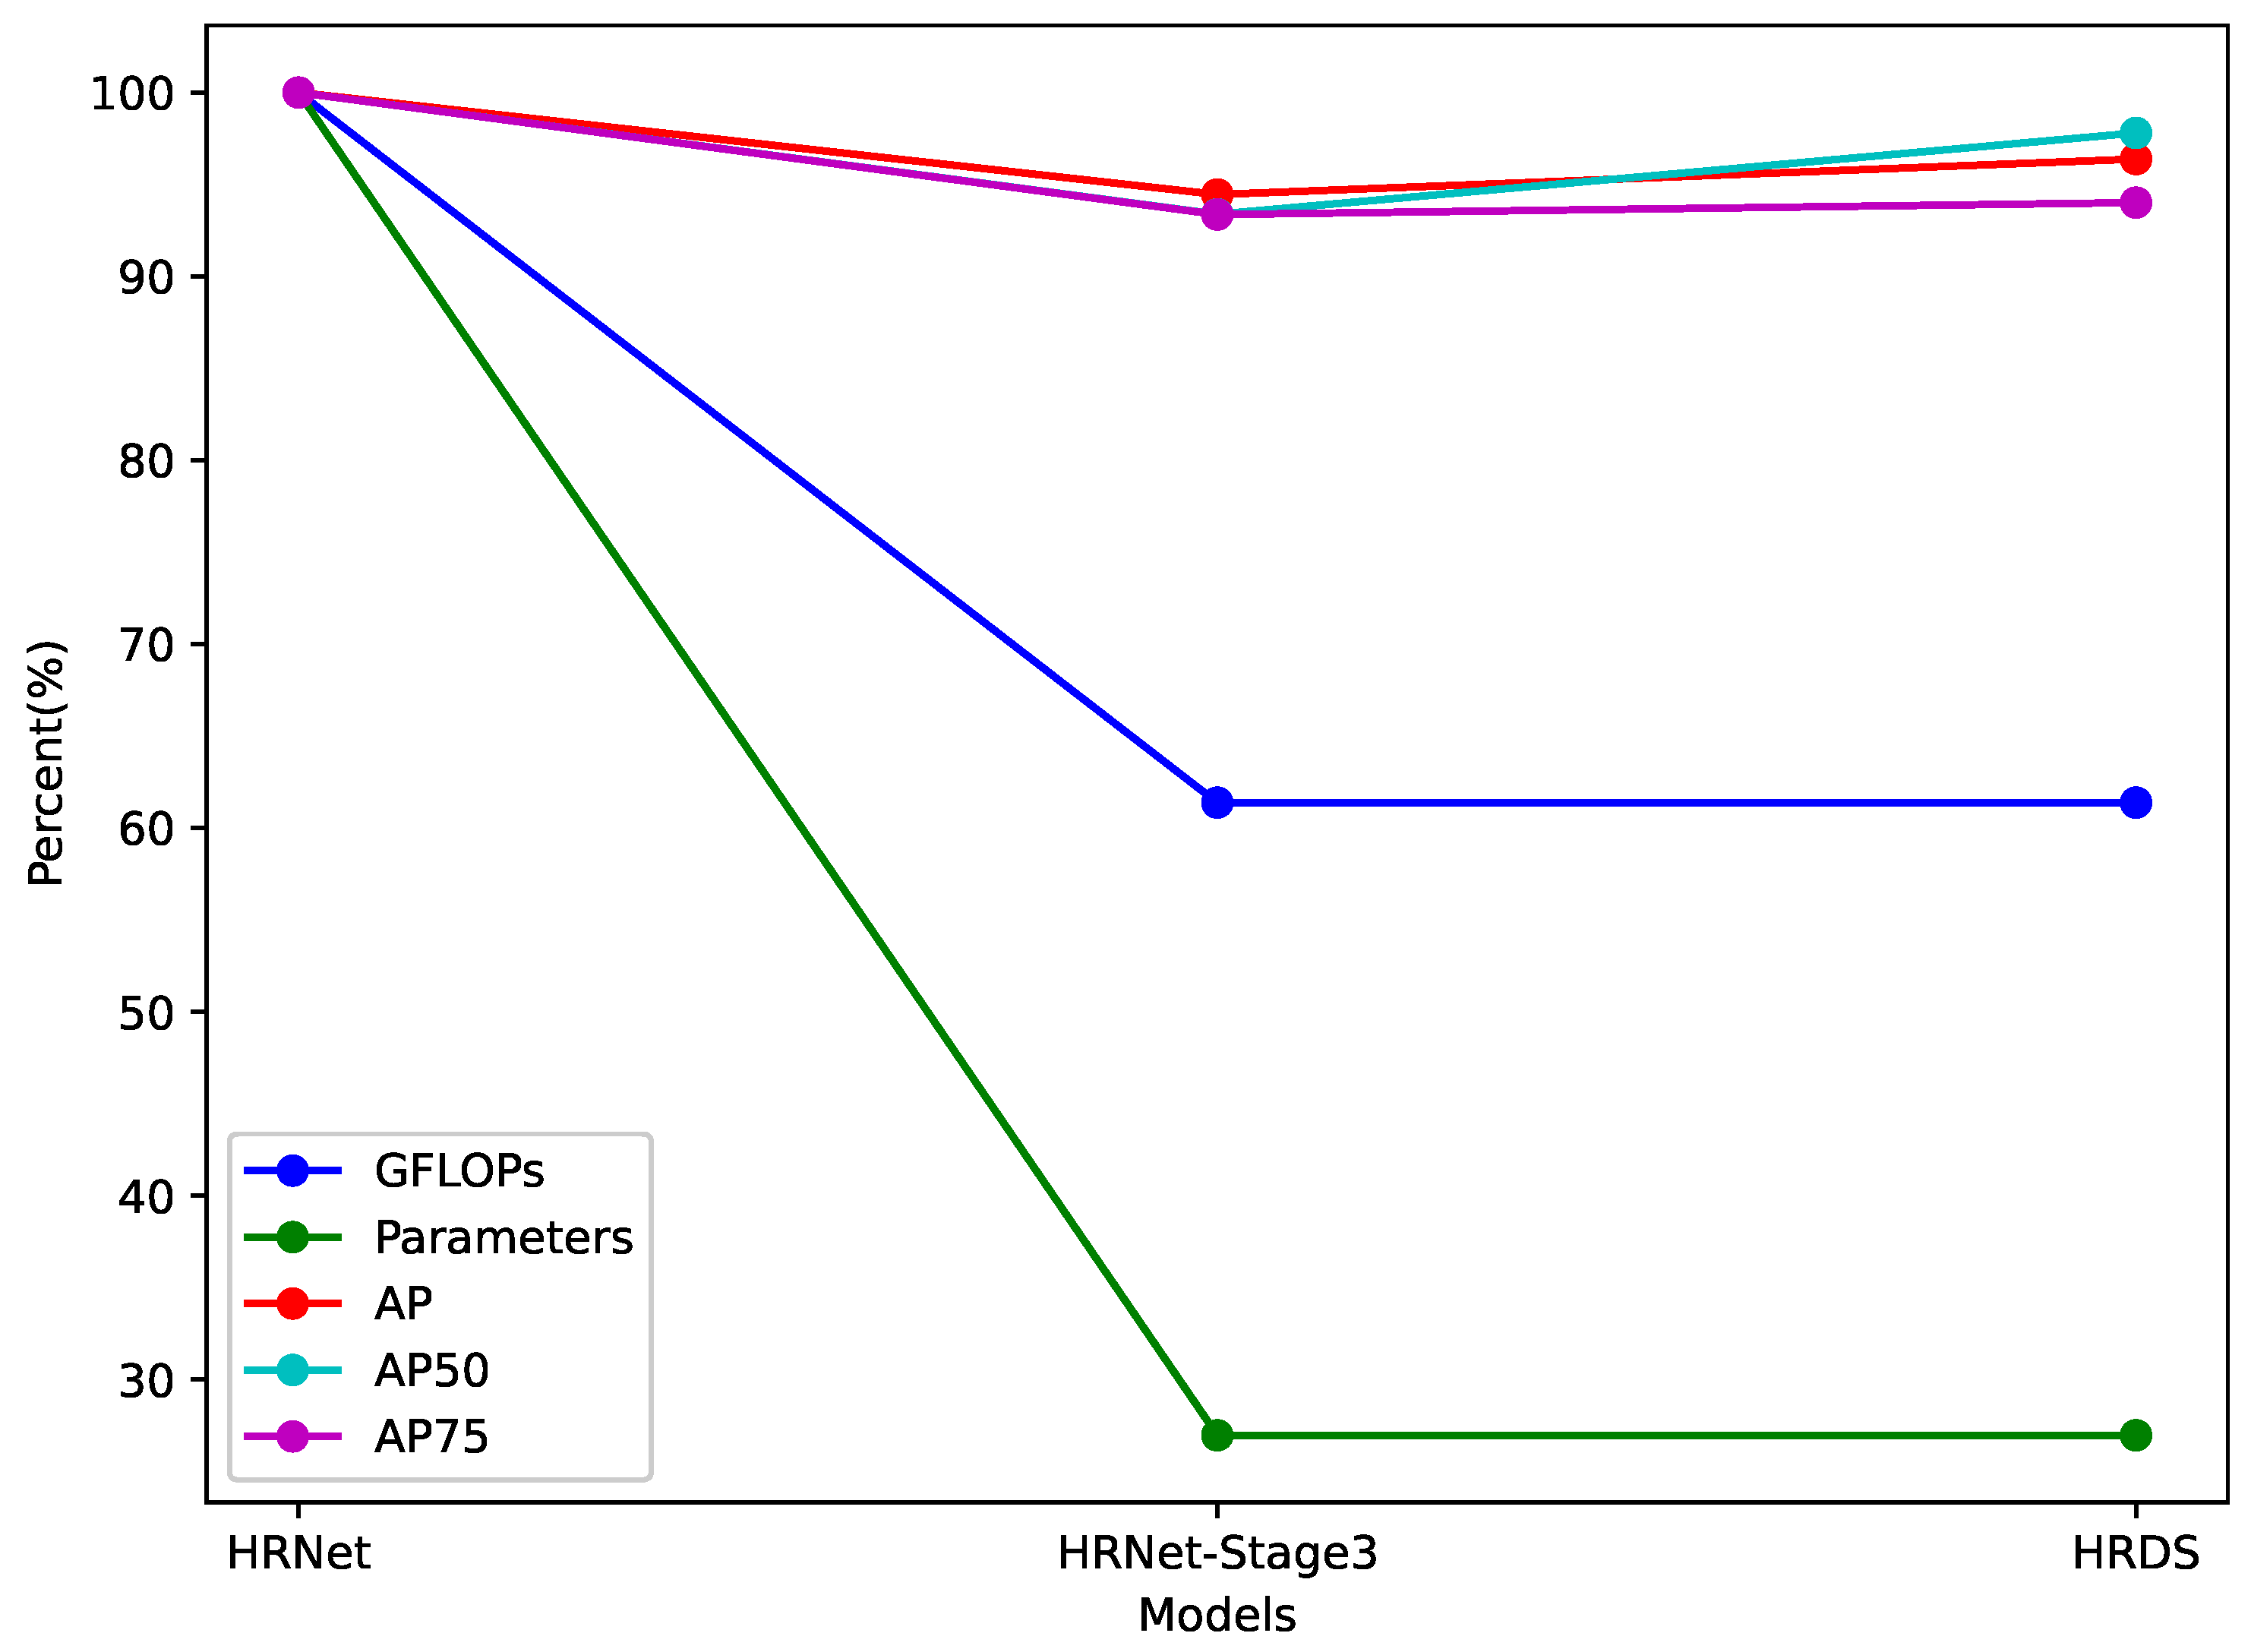
HRNet is a deep learning network architecture used for computer vision tasks (such as pose estimation, semantic segmentation, etc.). Its core idea is to maintain high-resolution feature representations throughout the network, rather than gradually reducing the resolution through pooling and then recovering it as in traditional methods. HRNet achieves this by connecting multiple subnetworks of different resolutions (from high to low) in parallel and performing multi-scale feature fusion through cross-resolution information exchange, resulting in outstanding performance on tasks. In HRNet Stage4, the network further extracts features by stacking multiple repeated modules (such as Bottleneck or Basic Block). However, this design may lead to parameter redundancy issues [49], which will also be verified in subsequent experimental sections. To address this issue, we propose a lightweight HRNet architecture called HRDS. HRDS retains the advantage of multi-scale feature fusion in HRNet while effectively reducing the model parameter size and improving computational efficiency and inference speed by introducing an attention mechanism module.
Networks based on attention mechanisms have advantages distinct from convolutional neural networks: they possess stronger global modeling capabilities. However, they have a drawback: Transformer structures involve a large number of parameters, significantly increasing computational cost and the number of parameters. During the process of model lightweighting, using low-parameter or even parameter-free attention is especially important. Figure 2 shows the structure of HRDS. In optimizing the HRNet model structure, we first remove the original HRNet Stage4. The motivation behind this is that Stage4 contains a large number of redundant parameters that do not significantly improve model performance in practical applications. After removing Stage4, the existing branches need to be merged in advance to maintain the overall network structure’s coherence. Stage3-final represents the final iteration of Stage3, for which the three branches need to be merged in advance. To counterbalance the loss of accuracy caused by reducing the model’s parameters, an attention mechanism DS module is used for image feature extraction, strengthening the features in high-dimensional channels and high-dimensional spaces.
Given the input feature X R H × W × C , after passing through the first three stages of HRNet, multi-scale features are merged in advance for output. Then, the Dim-Channel-Aware Attention f d c a a and Space Gate Attention f s g a are calculated. The specific calculation process is as follows:
X 1 = f d c a a ( X ) X ,
Y = f s g a ( X 1 ) X 1
where ⊗ denotes element-wise matrix multiplication, X 1 represents the features after Dim-Channel-Aware Attention, and Y represents the features after Space Gate Attention.

3.2.1. Dim-Channel-Aware Attention (DCAA)

For feature maps obtained from traditional convolutional networks, the number of channels is usually large, especially in deeper networks, leading to high-dimensional data. These high-dimensional features not only increase the computational complexity but may also contain redundant information, posing challenges to the model’s learning and generalization. To address this issue, the spatial dimensions of the feature map (height H and width W) are first compressed through the contextual pooling operation to reduce the computation and remove unimportant spatial information, while retaining more discriminative high-dimensional features. Then, the features after contextual pooling are passed into the KAN.
The KAN network, with its powerful expressive capability, is able to approximate any continuous function, thereby demonstrating stronger ability in feature learning and representation, especially in capturing fine-grained relationships and complex interactions in high-dimensional features. Ultimately, the features obtained through the KAN network enhance the model’s performance and generalization ability in high-dimensional data, allowing more precise extraction of subtle relationships and interaction features between different channels.

3.2.2. Space Gate Attention (SCA)

Spatial attention focuses on capturing the regions with the most significant information in the spatial domain, which is crucial for accurately locating the positional relationships in keypoint detection tasks. First, the spatial dimensions of the feature map are compressed through the contextual pooling operation, focusing on the most representative spatial information and reducing redundancy. Then, the downsampled features are passed into the KAN convolution operation to generate Space Gate Attention features, further enhancing the expressiveness of spatial features.
In keypoint detection, spatial features are inherently high-dimensional. Each spatial location not only contains its coordinate information but may also include other important attributes or semantic information, such as pixel values at different positions in the image, color channels, etc. These pieces of information intertwine in the spatial domain, forming complex high-dimensional representations. In keypoint detection tasks, accurately capturing the relationships between each spatial location is crucial, as the positions of the keypoints and their spatial relationships determine the performance of the model.
Spatial features typically contain multi-scale information, ranging from low-level pixel information to high-level semantic information. Features from different levels are extracted and fused in the spatial domain, forming richer and more complex high-dimensional representations. The spatial attention mechanism, by focusing on the most crucial parts of the space, can effectively enhance the feature information at important locations, thus improving the precision of keypoint localization and recognition. In this process, spatial attention helps the model capture fine-grained spatial variations, leading to stronger accuracy and robustness in keypoint detection.

4. Experiment

4.1. Evaluation Metrics

The standard evaluation metric is based on Object Keypoint Similarity (OKS), as shown in Equation (15):
OKS p = i exp ( d p i 2 / 2 S p 2 k i 2 ) δ ( v p i > 0 ) i δ ( v p i > 0 )
Here, p represents the animal’s ID in the ground-truth data; i represents the keypoint’s ID; d p i is the Euclidean distance between each keypoint of the predicted animal and the corresponding keypoint in the ground truth data; S p is the scale factor for the current animal, which is equal to the square root of the area it occupies in the ground-truth data, i.e., S p = ( x 2 x 1 ) ( y 2 y 1 ) ; k i is the normalization factor for the ith keypoint, calculated from the standard deviation of all the ground truth data in the dataset; v p i indicates whether the ith keypoint of the pth animal is visible; and δ is a function used to select visible points for calculation. When OKS = 1 , it indicates perfect prediction; when OKS = 0.75 , it represents AP75; when OKS = 0.5 , it represents AP50; and for OKS = 0.5 , 0.55 , , 0.90 , 0.95 , the average accuracy of all predicted keypoints is represented as AP.
To more comprehensively evaluate the model’s performance, a new evaluation metric is proposed, namely, “Precision per Million Parameters” (PMP). This metric takes into account both the model’s parameter count and its accuracy in the task, quantifying the model’s parameter efficiency. The calculation method is as shown in Equation (16):
PMP = AP Parameters × 10 6
By using the PMP metric, the efficiency of the model can be quantified, achieving higher accuracy with fewer parameters. This allows a clear understanding of the actual contribution of parameters to model performance, providing an effective reference for model designers to optimize the parameter configuration and improve overall efficiency.

4.2. Experiment Setup

All experiments were conducted on a server equipped with an Intel (R) Xeon (R) Gold 6240 CPU (2.60 GHz) and an NVIDIA A100 PCIe 40 GB GPU. The software environment consisted of CUDA 11.7 and Python 3.9.19. Model development and training were implemented using the OpenMMLab open-source framework. The version of MMPose is v1.3.0. The training process was configured for 500 epochs, with validation performed at 10-epoch intervals. The Adam optimizer with a variable learning rate schedule was employed. Specifically, the learning rate was set to 5 × 10⁻⁴ for epochs [0, 460), reduced to 5 × 10⁻⁵ for epochs [460, 490), and further decreased to 5 × 10⁻⁶ for epochs [490, 500]. The batch size for training was fixed at 64.

4.3. Datasets

AP-10K [50] is a large-scale dataset dedicated to animal pose estimation, proposed jointly by JD Explore Academy, Xidian University, and the University of Sydney. This dataset consists of 10,015 mammalian images annotated with pose information, categorized into 23 families and 54 species. AP-10K is designed to facilitate research in animal pose estimation by providing a large-scale benchmark platform. The images in this dataset have been carefully collected and filtered according to a taxonomic hierarchy, with high-quality keypoint annotations manually labeled and verified. The annotations adhere to the COCO dataset format, with detailed specifications provided in Table 1.
AP-10K was specifically developed to support research on animal pose estimation in wild environments, with a particular focus on mammalian pose estimation. Furthermore, the dataset has been widely utilized in various studies, including but not limited to evaluating animal pose estimation models and exploring different aspects of the problem, such as supervised learning-based animal pose estimation, human-to-animal pose estimation transfer, and model generalization performance. This demonstrates that AP-10K is not only a valuable data resource but has also become a key tool in advancing research in this field.
In summary, AP-10K is a crucial dataset for animal pose estimation, providing a large volume of high-quality, well-annotated images that serve as a strong foundation for research in this domain.

4.4. HRNet Parameter Redundancy Experiment

In this section of the experiment, the effectiveness of this structural adjustment is validated on the AP-10K dataset by progressively removing the later stages of HRNet and comparing the performance of each sub-model. The model used in this experiment is the HRNet-w32 scale (hereinafter, HRNet refers to the HRNet-w32 model). The parameter count and computational complexity of each stage of HRNet are statistically analyzed, and the results are shown in Table 2.
Stage 2 has a computational complexity of 0.48 GFLOPs and 0.47M parameters, accounting for 4.7% of HRNet’s total computational complexity and 1.6% of the total parameters; Stage 3 has a computational complexity of 2.94 GFLOPs and 7.12M parameters, accounting for 28.7% of HRNet’s total computational complexity and 24.9% of the total parameters; Stage 4 has a computational complexity of 2.92 GFLOPs and 20.41M parameters, accounting for 28.5% of HRNet’s total computational complexity and 71.5% of the total parameters. The results of training models with different stages are shown in Table 3.
HRNet achieves an AP value of 72.98% on the AP-10K dataset. When only the stages up to Stage 2 were retained, the model’s parameter count drastically decreases, leading to a significant drop in accuracy. The parameter count decreases by 27.6M, and the resulting AP value is only 49.78%. Compared to HRNet, the AP value decreases by 23.20%. On the other hand, when the model is retained up to Stage 3, the parameter count reduces by 20.71M. Compared to HRNet, the AP value decreases by only 4.05%, while the parameter count is only 27.45% of the original, and the computation cost is 61.35%. As shown in Figure 3, the keypoint prediction heatmaps for HRNet and HRNet Stage 3, it can be observed that even without Stage 4, the first three stages of the network are capable of extracting sufficient features and capturing the key areas. Stage 4 refines these areas but does not significantly change the locations of the regions of focus. This result strongly demonstrates that in HRNet Stage 4, with over 20M parameters, does not bring significant accuracy improvement. The reason why removing the fourth stage still maintains high accuracy lies in the nature of HRNet: in each stage, multiple resolutions of features are kept in parallel, allowing the first three stages to adequately fuse high-, medium-, and low-resolution spatial information. This means that even without the additional fusion in Stage 4, the model can still maintain a certain level of accuracy in pose estimation.

4.5. Keypoint Detection on the AP-10K Dataset

As shown in Figure 4, a comparative histogram was plotted to illustrate the performance of the HRNet Stage 3 and HRDS models, with the original HRNet model results used as the baseline (100%). Specifically, the HRNet Stage 3 model exhibits a computational cost of 6.287 GFLOPs, which is only 61.37% of the computational cost of the original HRNet model. Its parameter count is reduced to 7.686M, equivalent to 26.95% of the original model’s size. In terms of accuracy, the HRNet Stage 3 model achieves an AP value that is 94.45% of that of the original model. In comparison, the HRDS model maintains a nearly identical computational cost of 6.289 GFLOPs (also 61.37% of the original) and the same parameter proportion (26.95% of the original). However, it achieves a higher AP value, reaching 96.38% of the original model’s accuracy. These results demonstrate that the proposed HRDS model successfully balances lightweight design with high accuracy. Despite a substantial reduction in both computational complexity and model size, HRDS preserves, and even slightly improves upon, the detection performance compared to HRNet Stage 3. This highlights the effectiveness of the proposed improvements and suggests the model’s strong potential for practical deployment, particularly in resource-constrained environments.
The specific test results [17,18,25,38,51,52,53] on the AP-10K dataset are shown in Table 4. From the table, it can be seen that the HRNet Stage 3 model’s accuracy decreases by 4.05%, while the HRDS model’s accuracy decreases by only 2.64%. Even as the parameter count is significantly reduced, high accuracy is further ensured. A horizontal comparison of different models reveals that models with fewer parameters often do not achieve high accuracy, and models with more parameters do not necessarily yield good results. From Table 4, it can be seen that the HRDS model performs the best in terms of the PMP metric, which also indicates that in other models, the model parameters have not played their expected role well. For example, the Hourglass model, with nearly 100 million parameters, achieves lower accuracy.
Some network prediction results are shown in Figure 5, which includes predictions from label data, the proposed model, models with higher parameter counts, and models with lower parameter counts.

4.6. Ablation Studies

This experiment aimed to verify the effectiveness of contextual pooling. We conducted experiments on the CIFAR-100 dataset, replacing the middle and lower pooling layers of the ResNet network with contextual pooling layers, and compared the performance with the original network structure. Since HRNet is built using modules from ResNet, we chose ResNet as the backbone for the ablation experiment. In ResNet, the network extracts features through a convolution layer followed by max pooling, and average pooling is applied at the end of the network. To validate the effectiveness of the approach, we replaced both of these operations with contextual pooling. The experimental results are shown in Table 5.
Similarly, the output features of ResNet are fed into the network detection head for keypoint detection tasks. The experimental results are shown in Table 6.
The results from the experiment shown in Table 7 are as follows: networks using the DS module exhibit a certain improvement in accuracy. It can be concluded that the DS module effectively enhances the global modeling ability of the model, improving its accuracy with almost no increase in computation or parameter volume.
To simulate the inference scenario on devices with limited computing resources, Table 8 lists the inference speeds of the models on CPU, where inference speed is calculated in FPS (frames per second). The value is the reciprocal of the average inference time (in seconds). The inference is performed on the AP-10K test set, with average inference time calculated as total inference time divided by the number of test samples. From the table, we can see that traditional large models such as Hourglass have an inference speed of 15.58 FPS, which is slower than that of other models and comes with higher resource consumption, making these models unsuitable for real-time inference applications. In contrast, lightweight models such as MobileNetV2 and ShuffleNetV2 exhibit lower computational and parameter requirements, requiring only 2.11 GFLOPs and 1.82 GFLOPs of computation, which makes them suitable for resource-constrained environments, with inference speeds of 47.18 FPS and 49.32 FPS, respectively. For some scenarios, purely lightweight or high-complexity models may not meet both accuracy and inference efficiency requirements. Models with moderate complexity, such as HRNet Stage 3, ResNet-50, and RLE, strike a good balance between computational load, parameter size, and inference speed. For example, HRNet Stage 3 has a computational load of 6.29 GFLOPs, a parameter size of 7.69M, and an FPS of 37.64, with an inference time of 26.57 ms. This performance makes it suitable for applications that require high accuracy while also maintaining real-time inference capabilities. Our proposed HRDS model demonstrates significant balance in performance, with a computation of 6.29 GFLOPs and a parameter size of 7.69M, similar to HRNet Stage 3, indicating that it maintains inference speed while preserving high accuracy. This balanced performance suggests that HRDS can meet the dual requirements of accuracy and inference efficiency, making it suitable for scenarios that require high precision while also limiting inference efficiency. Generally, the frame rate of ordinary network cameras is between 24 and 30 FPS, which can meet real-time inference needs.

5. Discussion

This study, based on previous theoretical research, investigates the issue of parameter redundancy in Stage 4 of the HRNet model. By reproducing the flaws in the original model design on the AP-10K dataset, the study further validates this problem. Addressing this issue represents an important step towards model lightweighting.
To significantly reduce the number of parameters while minimizing the loss of accuracy, this chapter proposes a new model, HRDS. This model not only effectively mitigates the performance degradation caused by parameter reduction but also verifies the problem of ineffective channel information fusion in neural networks constructed with traditional convolutional layers. Comparative experiments show that HRDS achieves a notable improvement in accuracy compared to the HRNet Stage 3 model while also significantly enhancing computational efficiency compared to HRNet Stage 4. Ablation studies further highlight the importance of spatial attention mechanisms; introducing the DS module into different backbone networks consistently leads to improvements in accuracy, thereby confirming the effectiveness of the model design. Qualitative testing on the Animal Pose dataset demonstrates that HRDS can still accurately predict keypoints, verifying its strong generalization capability. To simulate environments with limited computational resources, inference speed tests were conducted on a CPU, and the results show that HRDS is capable of handling real-time inference tasks.
Due to certain issues in the current implementation of the KAN module, attempts to rewrite the BasicBlock and Bottleneck modules using KAN and KAN convolution resulted in increases of nearly 100-fold in model parameter count and computational cost, making training infeasible. In future work, we plan to apply KAN to other state-of-the-art models once the KAN implementation is further optimized.

Author Contributions

Conceptualization, F.L.; funding acquisition, F.L., G.L.; investigation, F.L.; methodology, X.W.; project administration, F.L., G.L.; resources, G.L.; software, X.W.; supervision, F.L., G.L.; validation, X.W.; writing—original draft, X.W.; writing—review and editing, F.L. All authors have read and agreed to the published version of the manuscript.

Funding

This research was funded by Yingzi Tech and by the Huazhong Agricultural University Intelligent Research Institute of Food Health (No. IRIFH202407, No. IRIFH202212).

Data Availability Statement

The data can be shared up on request.

Conflicts of Interest

The authors declare no conflicts of interest.

References

  1. Saad Saoud, L.; Sultan, A.; Elmezain, M.; Heshmat, M.; Seneviratne, L.; Hussain, I. Beyond observation: Deep learning for animal behavior and ecological conservation. Ecol. Inform. 2024, 84, 102893. [Google Scholar] [CrossRef]
  2. Zuffi, S.; Kanazawa, A.; Berger-Wolf, T.; Black, M.J. Three-D Safari: Learning to Estimate Zebra Pose, Shape, and Texture From Images “In the Wild”. In Proceedings of the IEEE/CVF International Conference on Computer Vision (ICCV), Seoul, Republic of Korea, 27 October–2 November 2019. [Google Scholar]
  3. Samkari, E.; Arif, M.; Alghamdi, M.; Al Ghamdi, M.A. Human pose estimation using deep learning: A systematic literature review. Mach. Learn. Knowl. Extr. 2023, 5, 1612–1659. [Google Scholar] [CrossRef]
  4. Zhang, X.; Wang, W.; Chen, Z.; Zhang, J.; Tao, D. Promptpose: Language prompt helps animal pose estimation. arXiv 2022, arXiv:arXiv.2206.11752. [Google Scholar]
  5. Vaswani, A.; Shazeer, N.; Parmar, N.; Uszkoreit, J.; Jones, L.; Gomez, A.N.; Kaiser, Ł.; Polosukhin, I. Attention is all you need. arXiv 2017, arXiv:1706.03762. [Google Scholar]
  6. Dosovitskiy, A.; Beyer, L.; Kolesnikov, A.; Weissenborn, D.; Zhai, X.; Unterthiner, T.; Dehghani, M.; Minderer, M.; Heigold, G.; Gelly, S.; et al. An image is worth 16x16 words: Transformers for image recognition at scale. arXiv 2020, arXiv:2010.11929. [Google Scholar]
  7. Liu, Z.; Lin, Y.; Cao, Y.; Hu, H.; Wei, Y.; Zhang, Z.; Lin, S.; Guo, B. Swin transformer: Hierarchical vision transformer using shifted windows. In Proceedings of the IEEE/CVF International Conference on Computer Vision, Montreal, BC, Canada, 11–17 October 2021; pp. 10012–10022. [Google Scholar]
  8. Carion, N.; Massa, F.; Synnaeve, G.; Usunier, N.; Kirillov, A.; Zagoruyko, S. End-to-end object detection with transformers. arXiv 2020, arXiv:2005.12872. [Google Scholar]
  9. Zhu, L.; Wang, X.; Ke, Z.; Zhang, W.; Lau, R.W. Biformer: Vision transformer with bi-level routing attention. In Proceedings of the IEEE/CVF Conference on Computer Vision and Pattern Recognition, Vancouver, BC, Canada, 17–24 June 2023; pp. 10323–10333. [Google Scholar]
  10. Naveen, S.; Kounte, M.R. Compact optimized deep learning model for edge: A review. Int. J. Electr. Comput. Eng. 2023, 13. [Google Scholar] [CrossRef]
  11. Shuvo, M.M.H.; Islam, S.K.; Cheng, J.; Morshed, B.I. Efficient acceleration of deep learning inference on resource-constrained edge devices: A review. Proc. IEEE 2022, 111, 42–91. [Google Scholar] [CrossRef]
  12. Liu, Z.; Wang, Y.; Vaidya, S.; Ruehle, F.; Halverson, J.; Soljačić, M.; Hou, T.Y.; Tegmark, M. KAN: Kolmogorov-Arnold Networks. arXiv 2025, arXiv:2404.19756. [Google Scholar]
  13. Andriluka, M.; Pishchulin, L.; Gehler, P.; Schiele, B. 2D Human Pose Estimation: New Benchmark and State of the Art Analysis. In Proceedings of the IEEE Conference on Computer Vision and Pattern Recognition, Columbus, OH, USA, 23–28 June 2014. [Google Scholar]
  14. Lin, T.Y.; Maire, M.; Belongie, S.; Hays, J.; Perona, P.; Ramanan, D.; Dollár, P.; Zitnick, C.L. Microsoft COCO: Common Objects in Context. arXiv 2014, arXiv:1405.0312. [Google Scholar]
  15. Toshev, A.; Szegedy, C. Deeppose: Human pose estimation via deep neural networks. In Proceedings of the IEEE Conference on Computer Vision and Pattern Recognition, Columbus, OH, USA, 23–28 June 2014; pp. 1653–1660. [Google Scholar]
  16. Nibali, A.; He, Z.; Morgan, S.; Prendergast, L. Numerical Coordinate Regression with Convolutional Neural Networks. arXiv 2018, arXiv:1801.07372. [Google Scholar]
  17. Li, Y.; Yang, S.; Liu, P.; Zhang, S.; Wang, Y.; Wang, Z.; Yang, W.; Xia, S.T. SimCC: A Simple Coordinate Classification Perspective for Human Pose Estimation. arXiv 2021, arXiv:2107.03332v3. [Google Scholar]
  18. Li, J.; Bian, S.; Zeng, A.; Wang, C.; Pang, B.; Liu, W.; Lu, C. Human pose regression with residual log-likelihood estimation. In Proceedings of the IEEE/CVF International Conference on Computer Vision, Montreal, BC, Canada, 11–17 October 2021; pp. 11025–11034. [Google Scholar]
  19. Jiang, T.; Lu, P.; Zhang, L.; Ma, N.; Han, R.; Lyu, C.; Li, Y.; Chen, K. RTMPose: Real-Time Multi-Person Pose Estimation based on MMPose. arXiv 2023, arXiv:2303.07399v2. [Google Scholar]
  20. Yang, J.; Zeng, A.; Liu, S.; Li, F.; Zhang, R.; Zhang, L. Explicit Box Detection Unifies End-to-End Multi-Person Pose Estimation. In Proceedings of the International Conference on Learning Representations, Kigali, Rwanda, 1–5 May 2023. [Google Scholar]
  21. Chen, Y.; Guo, C.; Jiao, T.; Zhang, Z.; Song, J. EAPoseNet: Efficient animal pose network in low computing power scenarios. J. Real Time Image Process. 2025, 22, 1–15. [Google Scholar] [CrossRef]
  22. Dong, W.; Sheng, K.; Huang, B.; Xiong, K.; Liu, K.; Cheng, X. Stretchable self-powered TENG sensor array for human robot interaction based on conductive ionic gels and LSTM neural network. IEEE Sens. J. 2024, 24, 37962–37969. [Google Scholar] [CrossRef]
  23. Wei, S.E.; Ramakrishna, V.; Kanade, T.; Sheikh, Y. Convolutional pose machines. In Proceedings of the IEEE Conference on Computer Vision and Pattern Recognition, Las Vegas, NV, USA, 27–30 June 2016; pp. 4724–4732. [Google Scholar]
  24. Xiao, B.; Wu, H.; Wei, Y. Simple baselines for human pose estimation and tracking. In Proceedings of the European Conference on Computer Vision (ECCV), Munich, Germany, 8–14 September 2018; pp. 466–481. [Google Scholar]
  25. He, K.; Zhang, X.; Ren, S.; Sun, J. Deep residual learning for image recognition. In Proceedings of the IEEE Conference on Computer Vision and Pattern Recognition, Las Vegas, NV, USA, 27–30 June 2016; pp. 770–778. [Google Scholar]
  26. Li, C.; Lee, G.H. From synthetic to real: Unsupervised domain adaptation for animal pose estimation. In Proceedings of the IEEE/CVF Conference on Computer Vision and Pattern Recognition, Nashville, TN, USA, 20–25 June 2021; pp. 1482–1491. [Google Scholar]
  27. Mu, J.; Qiu, W.; Hager, G.D.; Yuille, A.L. Learning from synthetic animals. In Proceedings of the IEEE/CVF Conference on Computer Vision and Pattern Recognition, Seattle, WA, USA, 13–19 June 2020; pp. 12386–12395. [Google Scholar]
  28. Mathis, A.; Mamidanna, P.; Cury, K.M.; Abe, T.; Murthy, V.N.; Mathis, M.W.; Bethge, M. DeepLabCut: Markerless pose estimation of user-defined body parts with deep learning. Nat. Neurosci. 2018, 21, 1281–1289. [Google Scholar] [CrossRef] [PubMed]
  29. Li, W.; Wang, Z.; Yin, B.; Peng, Q.; Du, Y.; Xiao, T.; Yu, G.; Lu, H.; Wei, Y.; Sun, J. Rethinking on Multi-Stage Networks for Human Pose Estimation. arXiv 2019, arXiv:1901.00148. [Google Scholar]
  30. Liu, J.J.; Hou, Q.; Cheng, M.M.; Wang, C.; Feng, J. Improving convolutional networks with self-calibrated convolutions. In Proceedings of the IEEE/CVF Conference on Computer Vision and Pattern Recognition, Seattle, WA, USA, 13–19 June 2020; pp. 10096–10105. [Google Scholar]
  31. Cai, Y.; Wang, Z.; Luo, Z.; Yin, B.; Du, A.; Wang, H.; Zhou, X.; Zhou, E.; Zhang, X.; Sun, J. Learning Delicate Local Representations for Multi-Person Pose Estimation. arXiv 2020, arXiv:cs.CV/2003.04030. [Google Scholar]
  32. Zhang, F.; Zhu, X.; Dai, H.; Ye, M.; Zhu, C. Distribution-aware coordinate representation for human pose estimation. In Proceedings of the IEEE/CVF Conference on Computer Vision and Pattern Recognition, Seattle, WA, USA, 13–19 June 2020; pp. 7093–7102. [Google Scholar]
  33. Feng, Z.H.; Kittler, J.; Awais, M.; Huber, P.; Wu, X.J. Wing Loss for Robust Facial Landmark Localisation with Convolutional Neural Networks. In Proceedings of the 2018 IEEE Conference on Computer Vision and Pattern Recognition (CVPR), Salt Lake City, UT, USA, 18–23 June 2018; pp. 2235–2245. [Google Scholar]
  34. Wang, X.; Bo, L.; Fuxin, L. Adaptive wing loss for robust face alignment via heatmap regression. In Proceedings of the IEEE/CVF International Conference on Computer Vision, Seoul, Republic of Korea, 27 October–2 November 2019; pp. 6971–6981. [Google Scholar]
  35. Lin, C.; Zhu, B.; Wang, Q.; Liao, R.; Qian, C.; Lu, J.; Zhou, J. Structure-Coherent Deep Feature Learning for Robust Face Alignment. IEEE Trans. Image Process. 2021, 30, 5313–5326. [Google Scholar] [CrossRef] [PubMed]
  36. Sun, X.; Xiao, B.; Wei, F.; Liang, S.; Wei, Y. Integral human pose regression. In Proceedings of the European Conference on Computer Vision (ECCV), Munich, Germany, 8–14 September 2018; pp. 529–545. [Google Scholar]
  37. Yu, C.; Xiao, B.; Gao, C.; Yuan, L.; Zhang, L.; Sang, N.; Wang, J. Lite-HRNet: A Lightweight High-Resolution Network. In Proceedings of the CVPR, Nashville, TN, USA, 20–25 June 2021. [Google Scholar]
  38. Xu, L.; Guan, Y.; Jin, S.; Liu, W.; Qian, C.; Luo, P.; Ouyang, W.; Wang, X. ViPNAS: Efficient Video Pose Estimation via Neural Architecture Search. arXiv 2021, arXiv:2105.10154v1. [Google Scholar]
  39. Xu, Y.; Zhang, J.; Zhang, Q.; Tao, D. ViTPose: Simple Vision Transformer Baselines for Human Pose Estimation. In Proceedings of the Advances in Neural Information Processing Systems, New Orleans, LA, USA, 28 November–9 December 2022. [Google Scholar]
  40. Huang, J.; Zhu, Z.; Guo, F.; Huang, G. The Devil Is in the Details: Delving Into Unbiased Data Processing for Human Pose Estimation. In Proceedings of the IEEE/CVF Conference on Computer Vision and Pattern Recognition (CVPR), Seattle, WA, USA, 13–19 June 2020. [Google Scholar]
  41. Wang, D.; Zhang, S. Contextual Instance Decoupling for Robust Multi-Person Pose Estimation. In Proceedings of the IEEE/CVF Conference on Computer Vision and Pattern Recognition (CVPR), New Orleans, LA, USA, 18–24 June 2022; pp. 11060–11068. [Google Scholar]
  42. Bodner, A.D.; Tepsich, A.S.; Spolski, J.N.; Pourteau, S. Convolutional Kolmogorov-Arnold Networks. arXiv 2024, arXiv:2406.13155. [Google Scholar]
  43. Zhou, D.X. Theory of deep convolutional neural networks: Downsampling. Neural Netw. 2020, 124, 319–327. [Google Scholar] [CrossRef] [PubMed]
  44. Goodfellow, I.; Bengio, Y.; Courville, A.; Bengio, Y. Deep Learning; MIT Press Cambridge: Cambridge, UK, 2016; Volume 1. [Google Scholar]
  45. Krizhevsky, A.; Sutskever, I.; Hinton, G.E. Imagenet classification with deep convolutional neural networks. Adv. Neural Inf. Process. Syst. 2012, 25, 84–90. [Google Scholar] [CrossRef]
  46. LeCun, Y.; Bottou, L.; Bengio, Y.; Haffner, P. Gradient-based learning applied to document recognition. Proc. IEEE 1998, 86, 2278–2324. [Google Scholar] [CrossRef]
  47. Graham, B. Fractional max-pooling. arXiv 2014, arXiv:1412.6071. [Google Scholar]
  48. Nirthika, R.; Manivannan, S.; Ramanan, A.; Wang, R. Pooling in convolutional neural networks for medical image analysis: A survey and an empirical study. Neural Comput. Appl. 2022, 34, 5321–5347. [Google Scholar] [CrossRef] [PubMed]
  49. Wang, X.; Wang, W.; Lu, J.; Wang, H. HRST: An Improved HRNet for Detecting Joint Points of Pigs. Sensors 2022, 22, 7215. [Google Scholar] [CrossRef] [PubMed]
  50. Yu, H.; Xu, Y.; Zhang, J.; Zhao, W.; Guan, Z.; Tao, D. AP-10K: A Benchmark for Animal Pose Estimation in the Wild. arXiv 2021, arXiv:2108.12617. [Google Scholar]
  51. Newell, A.; Yang, K.; Deng, J. Stacked hourglass networks for human pose estimation. In Proceedings of the Computer Vision—ECCV 2016: 14th European Conference, Amsterdam, The Netherlands, 11–14 October 2016; pp. 483–499. [Google Scholar]
  52. Sandler, M.; Howard, A.; Zhu, M.; Zhmoginov, A.; Chen, L.C. Mobilenetv2: Inverted residuals and linear bottlenecks. In Proceedings of the IEEE Conference on Computer Vision and Pattern Recognition, Salt Lake City, UT, USA, 18–23 June 2018; pp. 4510–4520. [Google Scholar]
  53. Ma, N.; Zhang, X.; Zheng, H.T.; Sun, J. Shufflenet v2: Practical guidelines for efficient cnn architecture design. In Proceedings of the European Conference on Computer Vision (ECCV), Munich, Germany, 8–14 September 2018; pp. 116–131. [Google Scholar]
Figure 1. Contextual Pooling. (a) shows how Contextual Pooling is calculated in space. (b) shows how Contextual Pooling is calculated in channels.
Electronics 14 02038 g001
Figure 2. HRDS model.
Electronics 14 02038 g002
Figure 3. HRNet and HRNet Stage 3 keypoint prediction heatmaps. Top: original image; middle: HRNet prediction; bottom: HRNet Stage 3 prediction.
Electronics 14 02038 g003
Figure 4. Comparison of the number of parameters, computational complexity, and AP between HRNet and the improved model.
Electronics 14 02038 g004
Figure 5. Visualization of some network prediction results. The red box clearly highlights the differences in prediction results among different models. (a) Label results. (b) HRDS prediction results. (c) HRNet Stage 3 prediction results. (d) ResNet50 results. (e) MobileNetV2 prediction results. (f) simcc_vipnas prediction results.
Electronics 14 02038 g005
Table 1. AP-10K keypoint definitions.
KeypointDescriptionKeypointDescription
1Left Eye10Right Elbow
2Right Eye11Right Front Paw
3Nose12Left Hip
4Neck13Left Knee
5Root of Tail14Left Back Paw
6Left Shoulder15Right Hip
7Left Elbow16Right Knee
8Left Front Paw17Right Back Paw
9Right Shoulder
Table 2. The computational complexity and parameter count in different stages of HRNet.
StageGFLOPsParams.
Stage20.480.47M
Stage32.947.12M
Stage42.9220.41M
HRNet-w3210.2528.54M
Table 3. Keypoint detection results with HRNet retained at different stages.
Retained StagesGFLOPsParams.AP (%)AP50 (%)AP75 (%)
Stage410.2528.54M72.9894.5179.95
Stage36.297.69M68.9388.2574.64
Stage22.420.94M49.7884.9848.60
Table 4. Test results of different models on the AP-10K dataset.
ModelGFLOPsParams.AP (%)AP50 (%)AP75 (%)PMP
HRNet-w32 *10.2528.53M72.9894.5179.952.56
HRNet-w32-s36.297.69M68.9388.2574.648.97
ResNet507.2734.00M68.3291.5675.542.01
Hourglass28.6594.85M66.2591.4871.360.70
MobileNetV22.119.57M62.3491.0466.496.51
ShuffleNetV21.827.55M59.9088.3861.467.93
RLE5.3723.70M59.0288.1262.952.49
simcc-vipnas1.0710.09M63.1090.4468.556.25
ViT-base25.0390.04M54.9984.7456.270.61
RTMPose-m2.5713.62M67.6390.9872.374.97
HRDS (Ours) *6.29(−3.96)7.69M(−20.84)70.34(−2.64)92.43(−2.08)75.16(−4.79)9.15(+6.59)
* marks the models we compared. Bold font indicates the best result.
Table 5. Contextual Pooling effectiveness ablation experiment on the CIFAR-100 dataset.
DescriptionTop 1 (%)Top 5 (%)
ResNet1868.1387.64
ResNet18 with CD (ours)68.93(+0.80)88.32(+0.68)
ResNet3472.5790.42
ResNet34 with CD (ours)72.84(+0.27)90.72(+0.30)
ResNet5079.9095.19
ResNet50 with CD (ours)80.23(+0.33)95.76(+0.57)
Bold font indicates the best result.
Table 6. Contextual Pooling effectiveness ablation experiment on the AP-10K Dataset.
DescriptionAP (%)AP50 (%)AP75 (%)
ResNet1858.8784.3065.17
ResNet18 with CD (ours)59.02(+0.15)84.94(+0.64)66.03(+0.86)
ResNet3463.6286.5470.48
ResNet34 with CD (ours)63.84(+0.22)86.47(−0.07)(+0.37)
ResNet5068.3291.5675.54
ResNet50 with CD (ours)(+0.18)91.92(+0.36)76.03(+0.49)
Bold font indicates the best result.
Table 7. Performance of the DS module in other models.
DescriptionGFLOPsParams.AP (%)AP50 (%)AP75 (%)
ResNet507.2734.00M68.3291.5675.54
ResNet50+7.2734.00M69.21(+0.89)92.04(+0.48)76.38(+0.84)
Hourglass28.6594.85M66.2591.4871.36
Hourglass+28.6594.85M66.54(+0.29)92.73(+1.25)72.16(+0.80)
MobileNetV22.119.57M62.3491.0466.49
MobileNetV2+2.119.57M62.98(+0.64)91.69(+0.65)68.36(+1.87)
ShuffleNetV21.827.55M59.9088.3861.46
ShuffleNetV2+1.827.55M61.35(+1.45)90.41(+2.03)62.57(+1.11)
RLE5.3723.70M59.0288.1262.95
RLE+5.3723.70M59.93(+0.91)89.03(+0.91)64.28(+1.33)
simcc-vipnas1.0710.09M63.1090.4468.55
simcc-vipnas+1.0710.09M64.21(+1.11)91.65(+1.44)70.08(+1.53)
ViT-base25.0390.04M54.9984.7456.27
ViT-base+25.0390.04M55.68(+0.69)86.41(+1.67)57.03(+0.76)
RTMPose-m2.5713.62M67.6390.9872.37
RTMPose-m+2.5713.62M68.83(+1.20)91.62(+0.64)73.74(+1.37)
‘+’ in the table indicates that the model includes the DS module. Bold font indicates the best result.
Table 8. Inference speed of different models on the AP-10K dataset.
ModelGFLOPsParams.FPSInference Time (ms)
HRNet-w32 *10.2528.53M32.8430.45
HRNet-stage36.297.69M37.6426.57
ResNet-507.2734.00M31.5731.41
Hourglass28.6594.85M15.5864.34
MobileNetV22.119.57M47.1821.19
ShuffleNetV21.827.55M49.3220.27
RLE5.3723.70M26.8737.21
simcc-vipnas1.0710.09M42.4123.58
ViTPose-base25.0390.04M17.2358.04
RTMPose-m2.5713.62M34.6628.85
HRDS (ours) *6.29(−3.96)7.69M(−20.84)37.62(+4.78)26.58(−3.87)
“*” marks the models we compared.
Disclaimer/Publisher’s Note: The statements, opinions and data contained in all publications are solely those of the individual author(s) and contributor(s) and not of MDPI and/or the editor(s). MDPI and/or the editor(s) disclaim responsibility for any injury to people or property resulting from any ideas, methods, instructions or products referred to in the content.

