Article

Integration of the Chimp Optimization Algorithm and Rule-Based Energy Management Strategy for Enhanced Microgrid Performance Considering Energy Trading Pattern

by
Mukhtar Fatihu Hamza
1,*,
Babangida Modu
2 and
Sulaiman Z. Almutairi
3
1
Department of Mechanical Engineering, College of Engineering in Alkharj, Prince Sattam Bin Abdulaziz University, Alkharj 11942, Saudi Arabia
2
Department of Electrical and Electronic Engineering, University of Maiduguri, Maiduguri 1069, Borno, Nigeria
3
Department of Electrical Engineering, College of Engineering, Prince Sattam Bin Abdulaziz University, Al kharj 16278, Saudi Arabia
*
Author to whom correspondence should be addressed.
Electronics 2025, 14(10), 2037; https://doi.org/10.3390/electronics14102037
Submission received: 12 April 2025 / Revised: 4 May 2025 / Accepted: 7 May 2025 / Published: 16 May 2025

Abstract

:
The increasing integration of renewable energy into modern power systems has prompted the need for efficient hybrid energy solutions to ensure reliability, sustainability, and economic viability. However, optimizing the design of hybrid renewable energy systems, particularly those incorporating both hydrogen and battery storage, remains challenging due to system complexity and fluctuating energy trading conditions. This study addresses these gaps by proposing a novel framework that combines the Chimp Optimization Algorithm (ChOA) with a rule-based energy management strategy (REMS) to optimize component sizing and operational efficiency in a grid-connected microgrid. The proposed system integrates photovoltaic (PV) panels, wind turbines (WT), electrolyzers (ELZ), hydrogen storage, fuel cells (FC), and battery storage (BAT), while accounting for seasonal variations and dynamic energy trading. Each contribution in the Research Contributions section directly addresses critical limitations in previous studies, including the lack of advanced metaheuristic optimization, underutilization of hydrogen-battery synergy, and the absence of practical control strategies for energy management. Simulation results show that the proposed ChOA-based model achieves the most cost-effective and efficient configuration, with a PV capacity of 1360 kW, WT capacity of 462 kW, 164 kWh of BAT storage, 138 H 2 tanks, a 571 kW ELZ, and a 381 kW FC. This configuration yields the lowest cost of energy (COE) at $0.272/kWh and an annualized system cost (ASC) of $544,422. Comparatively, the Genetic Algorithm (GA), Salp Swarm Algorithm (SSA), and Grey Wolf Optimizer (GWO) produce slightly higher COE values of $0.274, $0.275, and $0.276 per kWh, respectively. These findings highlight the superior performance of ChOA in optimizing hybrid energy systems and offer a scalable, adaptable framework to support future renewable energy deployment and smart grid development.

1. Introduction

The growing global energy demand and the environmental consequences of fossil fuel combustion have intensified the need for sustainable alternatives. As energy consumption and CO2 emissions continue to rise at alarming rates [1,2], renewable energy sources have emerged as a viable solution to meet future energy needs while reducing environmental harm. Among these, photovoltaic (PV) and wind turbine (WT) technologies are especially promising due to their rapid technological advancements and decreasing costs [3]. However, the inherent variability of solar and wind resources driven by fluctuations in irradiance, wind speed, and temperature results in intermittent power output [4,5]. This intermittency necessitates robust energy storage systems to ensure supply reliability. In particular, PV systems require energy storage to bridge the gap between peak generation and off-peak demand, such as nighttime or cloudy conditions. Similarly, WT systems depend on favorable wind conditions and may cease operation during low or excessively high wind speeds. Combining solar and wind energy in a hybrid system, complemented by energy storage, offers a practical approach to improving energy security and minimizing production costs [6].
Optimal sizing of hybrid renewable energy systems is essential to balance cost, reliability, and sustainability. Hydrogen storage has gained attention as a complementary solution to battery storage, offering long-term storage capacity and cross-sectoral applications in transportation, industry, and heating [7,8]. Unlike batteries, which mainly support short-term grid balancing, hydrogen enables seasonal storage and supports decarbonization across various sectors. While the integration of hydrogen can enhance system flexibility and economic performance—especially in energy markets—it also introduces additional operational complexity that must be carefully managed.
Optimizing profitability is achievable by simultaneously leveraging hydrogen energy technology and participating in the energy market, taking advantage of the promising market dynamics and the versatile use of hydrogen energy technology. However, this approach introduces significant complexity to operating strategies for renewable energy-based hydrogen energy operators. A comprehensive analysis of these strategies is crucial for advancing the global energy transition. Currently, over 95% of hydrogen production originates from ‘grey’ sources, predominantly natural gas and coal, highlighting the need for a shift toward more sustainable practices [9,10]. Hybrid energy generation integrates diverse energy production components, including generators, storage units, and renewables, to enhance reliability. These systems are optimized to meet specific load demands while balancing economic, environmental, and reliability goals. Designing such systems is challenging due to constraints like resource availability, technical specifications, financial factors, and load profiles. Under-sizing risks operational failures and unmet energy needs, while oversizing increases costs due to surplus energy generation [11].
Numerous methods have been developed to optimize hybrid system design, including mathematical modeling, metaheuristic algorithms, and software-based tools. Popular metaheuristic approaches include the Levy Flight Algorithm [12,13], Salp Swarm Algorithm [14], Hybrid Levy Flight–Salp Swarm [15], Grasshopper Optimization Algorithm [16], and many more. Additionally, software tools like HOMER have attracted significant attention. However, these tools face limitations. HOMER lacks flexibility in control strategy modeling, and evolutionary algorithms can suffer from premature convergence or entrapment in local optima [17]. Nevertheless, these approaches have been extensively applied, and their effectiveness in hybrid system design and optimization has been evaluated by various researchers. The next section discusses relevant studies that have utilized these optimization techniques.
This study introduces a novel approach that integrates the Chimp Optimization Algorithm (ChOA), a recent metaheuristic inspired by chimpanzee hunting behavior, with a rule-based energy management system (REMS) to optimize the sizing and operation of a grid-connected hybrid microgrid. The proposed system incorporates PV, WT, electrolyzers, hydrogen storage tanks, fuel cells, and batteries. It also considers time-of-use (ToU) electricity pricing and seasonal variations, aiming to enhance economic viability and operational efficiency.

1.1. Literature Review

Many researchers worldwide have extensively studied energy production units that integrate diverse hybrid systems, leveraging hybrid renewable sources and metaheuristic algorithms. This section highlights key improvements and insights from prominent research efforts on microgrid systems undertaken by researchers from many regions across the globe [18,19,20,21,22,23,24,25].
The authors in [26] performed an analysis of a PV/diesel–BAT system to ensure continuous supply of energy for three domestic households’ energy demands in a village in Cameroon. They modeled energy flows using hourly solar radiation data obtained from monthly medians through the Duffie and Beckman method. Their findings indicated that the suggested microgrid could be more economical compared with grid electricity for households located far away from the grid infrastructure. The authors in Ref. [27] conducted a technical and economic analysis across different places in India using six microgrid systems. They identified the WT/PV/diesel/BAT arrangement as the most economical choice for a 1.3 kW maximum load, with a per kWh energy cost of $0.162. Similarly, the authors in [28] optimized a renewable energy-based generation system integrating sources such as PV–WT–MGT, combined heat systems, and fuel cells. This system was designed to meet an average daily electrical demand of 38.7 MWh and a thermal demand of 99.4 MWh, with the PV/FC/EL/ H 2 /BAT unit emerging as the most efficient. In [29], a grid-independent hybrid system consisting of PV–WT–diesel–battery was evaluated using HOMER Pro. Software to assess its technical and economic feasibility for three energy demands across 16 grid isolated areas in Chad. Results highlighted optimal configurations varying by location and user, including PV/BAT, PV/Diesel/BAT, and PV/WT/Diesel/BAT systems, with energy costs ranging from $0.367 to $0.529. Furthermore, the systems demonstrated the potential to cut annual emissions of carbon by 15,670 kg in contrast to diesel generator-based solutions. In Ref. [30], a method for producing steel without fossil fuels was introduced and assessed, where hydrogen was used to directly reduce iron ore. This approach provides significant flexibility in generation and electrical energy usage, contributing to grid stability via hydrogen storage and thermal storage technologies. Nevertheless, additional studies are needed to assess the economic feasibility of these flexible procedures. In Ref. [31], the authors analyzed the technology of power to gas (P2G) as an alternative energy solution for managing the energy output of extensive wind turbine farms connected with the national grid of Europe. Their findings revealed that the power-gas system effectively minimizes energy losses caused by grid congestion. Yet, the use of gas turbines in the process leads to increased carbon dioxide emissions. The authors in [32] explored the optimal configuration for a grid-independent WT–PV–PH energy system, aiming to minimize both the energy cost and supply loss. Their results revealed that combining WT and PV energy offers greater economic benefits than relying on either source independently. The authors of [33] designed an optimal WT–PV–FC energy system to supply electricity to domestic and commercial centers in Iran. They analyzed various hybrid configurations, including PV–FC, WT–FCS, and PV–WT–FC, under different maximum allowable load disturbance possibilities. The findings showed that the PV–WT–FC system was the most economical option, with a minimum life-cycle cost and maximum reliability due to reduced load disturbances, making it a more sustainable choice for these centers. Guo et al. [34] applied an arbitrary optimization method to design a standalone WT–PV–Battery energy system for developing power supply. For the PV–battery optimization, they evaluated different PV panels, such as mono, poly, and thin-film, and compared the results to those of WT–BES systems. Based on economic, technical, and environmental considerations, the polycrystalline–PV–battery system emerged as the most suitable solution for the proposed location.
The authors in [35] utilized HOMER to conduct a techno-economic assessment of hybrid Battery-H_2-PH energy storage solutions. By analyzing nine hybrid configurations, they identified the PV–diesel–battery system as the most economical option, with a net present cost (NPC) of $2.70 million and a levelized cost of energy (LCOE) of $0.178/kWh. Additionally, their study showed this configuration had a payback period of 5.73 years, an excess electricity rate of 8.28%, and a renewable energy fraction of 37.1%. Similarly, in Ref. [36], the authors explored the viability of supplying power to a 50-household longhouse in Malaysia by deploying PV/BAT/FC and PV/BAT energy systems. The results, derived from the analysis, demonstrated that the PV/BAT configuration is found to be economical and environmentally sustainable, achieving a net present value of $335,297 and a cost of energy of $0.323/kWh. The authors in [37] performed a technical, economic, and ecological evaluation of WT–PV–diesel generators across multiple sites in Cameroon. Their study included battery and hydrogen storage options for supplying three loads. The findings indicated that microgrid-integrated BAT storage remained more economical in the short-term scenario than those relying on hydrogen storage. Similarly, Le et al. [37] explored the optimal sizing and operation of BAT and H_2 storage, considering factors like energy cost fluctuation and component degradation. The analysis was based on a practical scenario of a grid-connected storehouse in a tropical region, stocked with a PV system. The results demonstrated that battery-based systems generally outperformed H_2-based systems, achieving high self-sufficiency percentages with better net present cost. This study [38] use GA-PSO algorithm and integrated four renewable energy sources with storage to minimize cost, maximize renewable usage, and meet energy demand. Results show that GA-PSO outperforms standard methods in speed and accuracy. The proposed system achieves an energy cost below 0.17 US$/kWh and replaces over 50% of fossil fuel usage. This study in [39] compared two Energy Management Systems (EMSs) and a Rule-Based EMS (REMS) and an Optimization-Based EMS (OEMS) for a microgrid in Guelph, Canada. The OEMS, based on a unit commitment model, demonstrated superior performance over the REMS while maintaining microgrid stability. The authors in [40] integrates deep learning and multiplicative weights update (MWU) for joint solar-wind forecasting. It includes optimized sizing, dynamic ramping limits, and an improved dispatch strategy to reduce curtailment and enhance grid integration. Results show up to 99% ramping compliance, limited curtailment below 12.9%, and a 2.53% profit increase using MWU forecasting. The authors in [41] used HOMER Pro and MATLAB/Simulink to achieve a low electricity cost of 0.18 SAR/kWh compared to conventional sources. Results confirm the system’s resilience to load and weather variations, highlighting its suitability for decentralized energy supply. In Ref. [42] an optimized power management method for microgrids operating in both isolated and grid-connected modes was proposed. Using Lagrange multiplier theory, the method effectively manages both stationary and EV batteries, as confirmed by simulation results. The authors in [43] proposed a Multiobjective Genetic Algorithm (MOGA) for optimal technical and economic management of microgrids. Results show a 16% reduction in reservation costs with load response, and wind power offers an effective balance between cost and pollution. In Ref. [44] a fuzzy inference-based framework for the optimal allocation and operation of renewable energy sources and battery storage systems using hourly data over a year. When applied to IEEE 37-node test system, it achieves an 80% reduction in energy losses compared to a base case. This study in [45] proposes an Intelligent Smart Energy Management System (ISEMS) for efficient energy usage in smart grids with high renewable energy input. It uses advanced forecasting models, with PSO-optimized SVM showing the highest accuracy in hourly and day-ahead predictions. The authors in [46] introduces a best-strategy-response algorithm to reach Nash equilibrium without a central coordinator, supporting dynamic and scalable participation. Simulations in an islanded microgrid demonstrate the method’s efficiency, robustness to communication issues, and alignment between individual and overall system goals. In Ref. [47] two optimization frameworks are proposed: one for maximizing total revenue and another game-theoretical model focusing on consumer utilization and storage revenue. Results show that real-time grid pricing significantly impacts profit distribution, with seller profits increasing under such schemes.
Table 1 provides an overview of recent research on renewable energy-based microgrids incorporating hydrogen storage systems.
The study summarizes various studies on H 2 storage, FC, and renewable energy systems from 2015 to 2024. Many of the referenced documents highlight significant challenges and limitations in large-scale implementation, such as the lack of cost analysis, the complexity of thermal management in H 2 storage, and the failure to account for economic factors like market competitiveness or operational fluctuations. Additionally, issues such as simplified assumptions in modeling, the absence of detailed economic or reliability assessments, and the limitations of optimization models (especially in real-time applications) are common drawbacks in these studies. Furthermore, several studies acknowledge the restricted capability of some software tools, such as HOMER, due to the “black box” nature of their mathematical models. These limitations suggest a need for more comprehensive, real-world assessments and improvements in system modeling and cost analysis for sustainable energy technologies.

1.2. Research Contributions
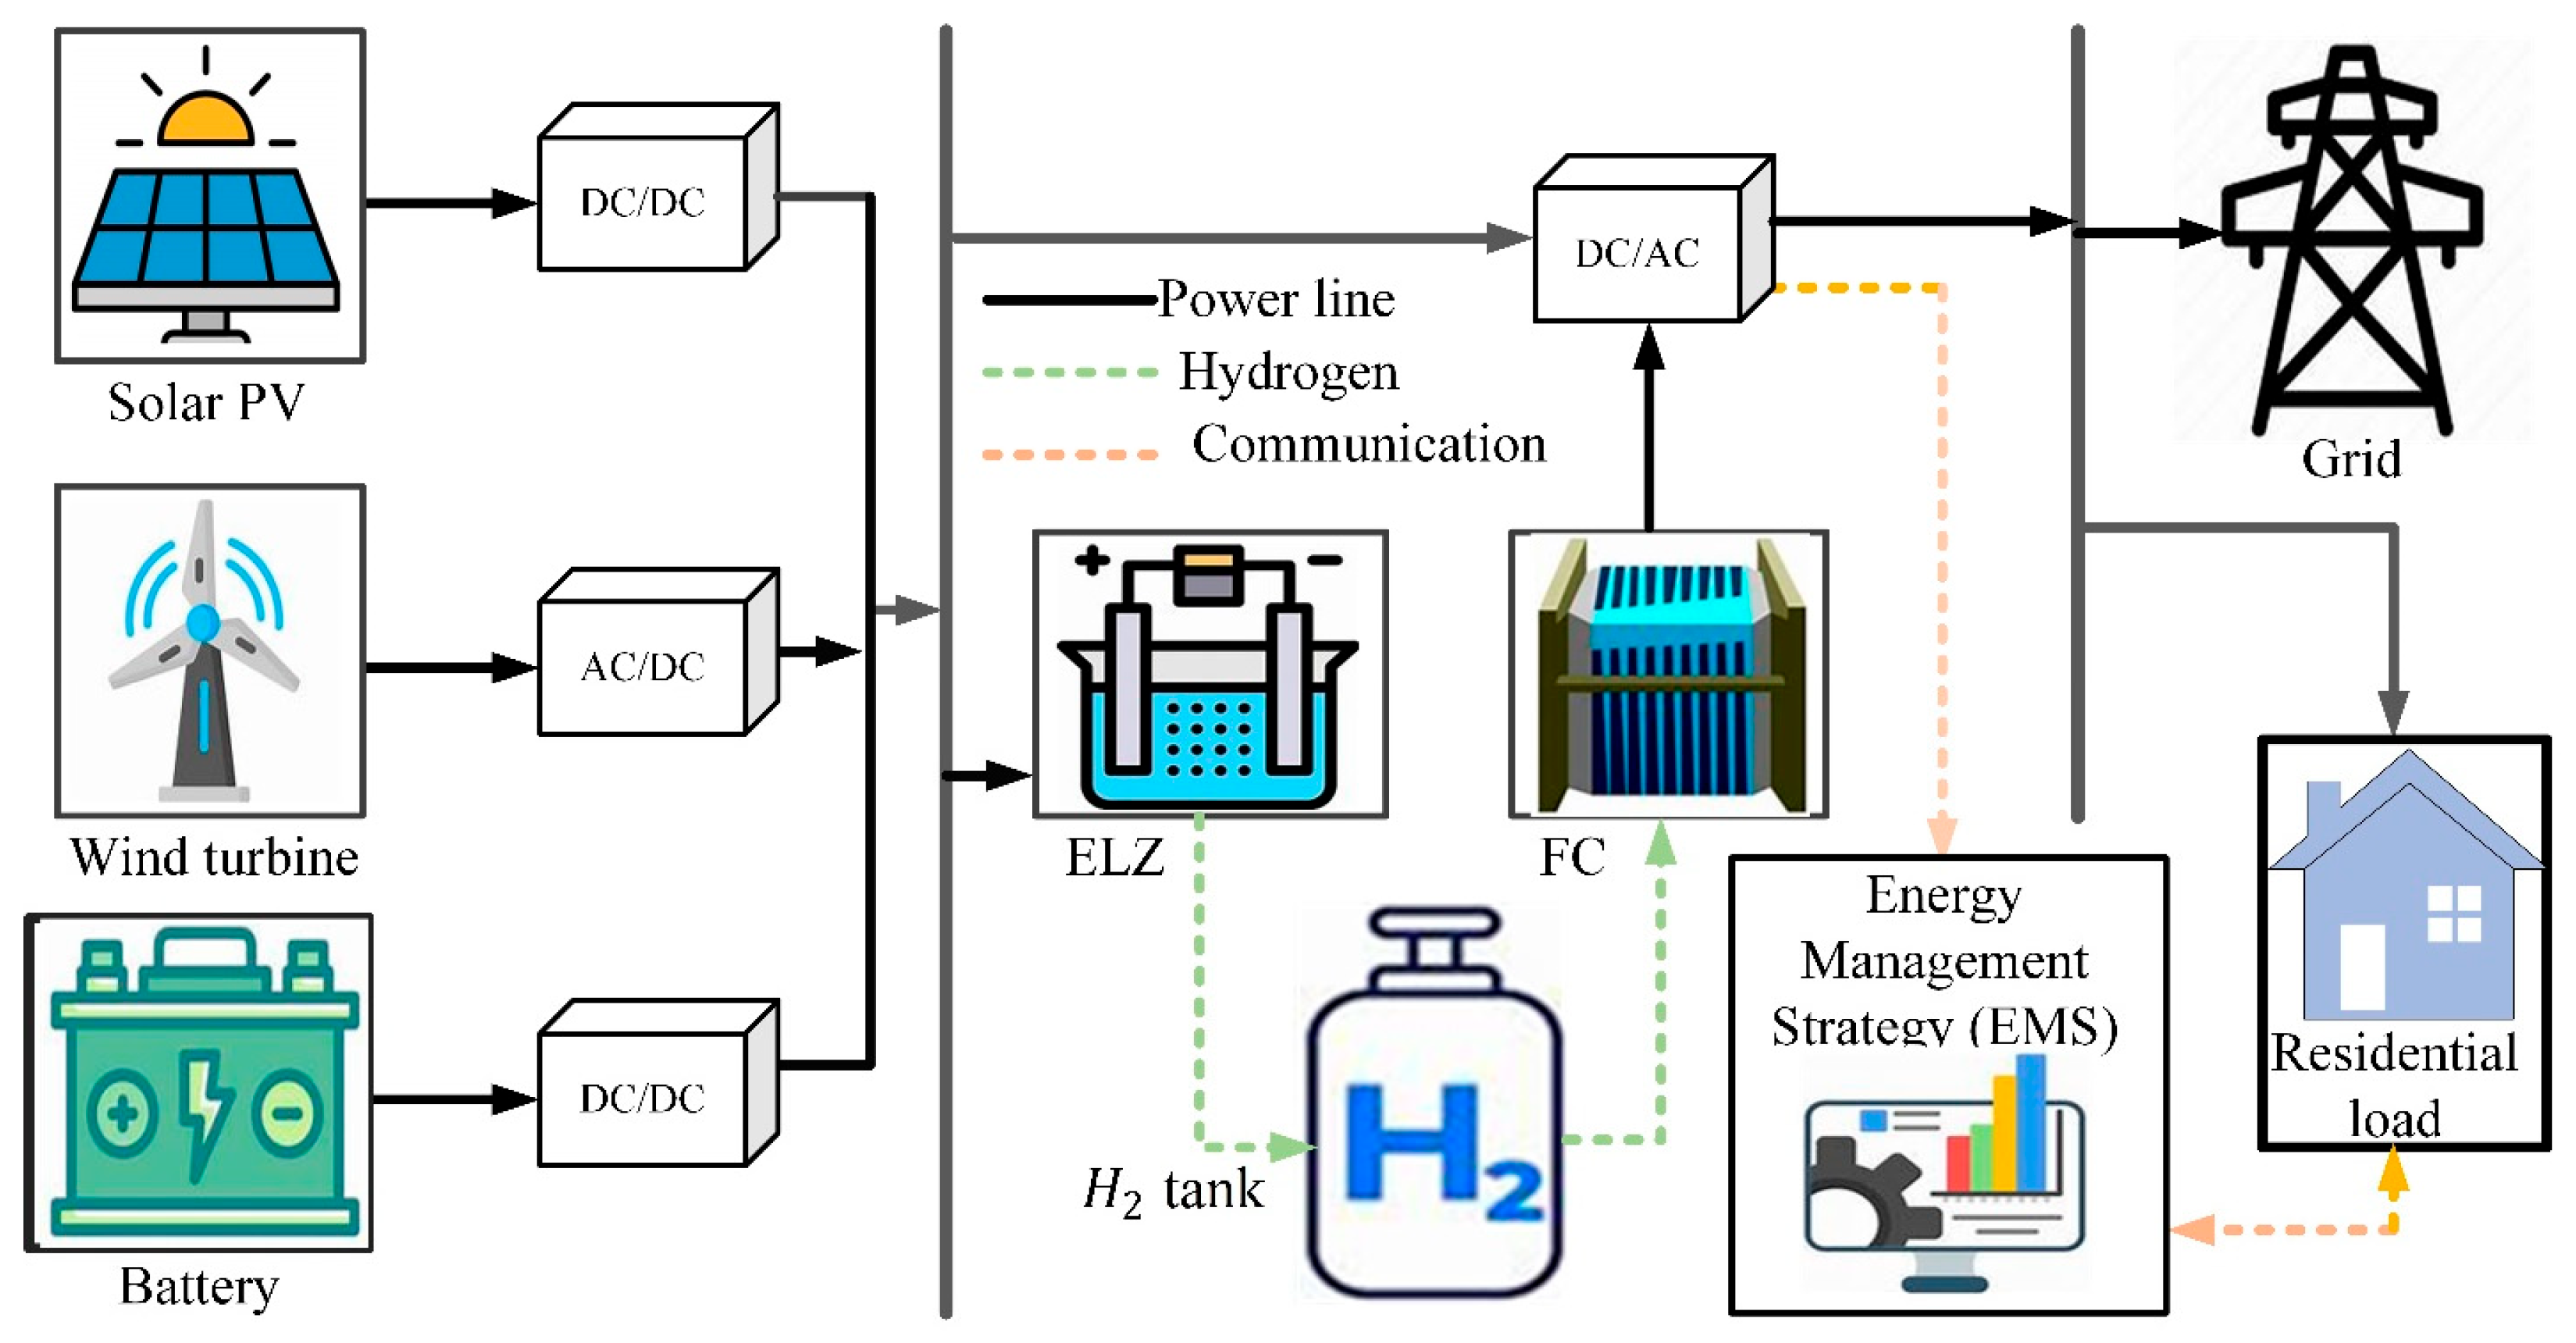
The paper introduces the Chimp Optimization Algorithm (ChOA) as an effective solution for energy management based on a rule-based approach. The ChOA optimizes the power delivery sequence across various energy sources and loads, ensuring reliable, efficient, and eco-friendly power generation while considering the specific constraints and descriptions of each system component. The key impacts of the research are sum up as follows:
  • Integration of a H 2 and BAT energy storage systems within a grid-connected microgrid, which includes photovoltaic (PV), wind turbine (WT), H 2 electrolyzer (ELZ), FC, and BAT storage.
  • Implementation of the ChOA for optimal power distribution across different MG sources.
  • A comparative analysis demonstrating the efficiency of the ChOA, showing results against three other optimization techniques: the Salp Swarm Algorithm (SSA), Grey Wolf Optimization (GWO), and Genetic Algorithm (GA).
  • Determination of optimal sizes of the optimization parameters related to the microgrid components, which include PV, WT, FC, ELZ, H 2 tank, and BAT units.

2. Materials and Methods

This section outlines the computational models for key components of eco-friendly hybrid energy systems, such as WT, solar PV, and BAT, as well as H 2 storage, E L Z , and F C , designed in accordance with environmental conditions and manufacturer guidelines. Figure 1 depicts a typical grid-connected MG that operates with renewable energy sources (RESs) and maintains a connection with the main grid. The hybrid microgrid comprises PV, WT, H 2 , and BAT components. The H 2 energy system consists of a storage tank, F C , and E L Z . An energy management system operating based on a rule-based approach oversees load scheduling, storage operation, and grid interaction to optimize the performance of the H 2 and BAT systems while incorporating demand response (DR) strategies, ensuring alignment with environmentally friendly, technical, and economic goals. A comprehensive discussion of the microgrid components modeling is offered in the subsequent sections.

2.1. Modelling of Photovoltaic System

The photovoltaic (PV) output is determined by multiple factors, such as PV module efficiency ( η p v ) , system efficiency η p v ,   s y s , the number of modules (MN), the area of each module (MA), and the total solar irradiation. The generated energy is computed using the following formula [15,16,63]:
E p v = η p v × η p v ,   s y s × A M × N M × T I
In this context, η p v ,   s y s accounts for system losses due to factors such as shading, soiling, and inverter inefficiencies. The module area (MA) is determined based on the specifications provided by the manufacturer, while the efficiency of the PV η p v is expressed using Equation (2):
η p v = η p v ,   r e f . × 1 β r e f . × T p v T S T C
T p v = T a m b + G T G N O C T × N O C T T a N O C T
The PV efficiency is affected by ambient temperature and solar insolation, as it depends on these factors. The nameplate specifications of the MG components are provided in Table 2.

2.2. WT System Model

Wind generators harness wind energy to produce electrical power, which is one of their most common applications. When wind hits the blades of a wind turbine, it causes them to rotate. This motion drives the turbines connected to the blades, converting the wind’s kinetic energy into rotational energy. A shaft linked to the generator transfers this energy, enabling the production of electricity through the process of electromagnetism [26]. The output power of the WT is calculated using Equation (4) [66]:
P W T o u t ( t ) = 0 V < V c u t i n   a n d   V > V c u t o u t a V 3 b P r V c u t i n < V > V R a t e d P r V r a t e d < V < V c u t o u t
In this context, P r denotes the rated power, a and b are numbers, which can be defined as follows:
a = P r V R a t e d 3 V c u t i n
b = V c u t i n 3 V R a t e d 3 V c u t i n 3
The equation used to estimate the wind speed at the hub of the wind turbine is given by the following model [67]:
v 2 v 1 = h 2 h 1 α
v 1 denotes the wind speed at height h 1 , while v 2 refers to the speed of wind adjusted to altitude h 2 . The constant α, usually set at 1/7, is influenced by several factors such as ambient temperature, atmospheric stability, season, speed of the wind, and terrain characteristics [67].
The total output power of n number of W T ( N W T ) can be obtained as follows:
P W T ( t ) = P W T o u t ( t ) × N W T

2.3. Modelling of Hydrogen Fuel Cell

H 2 energy storage comprises three key components: an E L Z , storage, and an FC stack. Presently, there are four categories of E L Z : anion exchange membrane (AEM), alkaline, proton exchange membrane (PEM), and solid oxide (SO) E L Z [68]. Among the three, the PEM E L Z (PEM ELZ) has garnered considerable attention for MW-scale applications, due to the fact that it is cost-effective maintenance with good efficiency [69].
The equation of E L Z is adopted from [70], which is represented in Equation (9):
v c t = V o c + v a c t t + v t + v c o n t             t T ,
V o c = G 2 F + R T 2 F l n P H 2 P o 2 P H 2 o
v a c t = R T 2 F a a l n j ( t ) J o , a + R T 2 F a c l n j ( t ) J o , c               t T ,
v t = i t · R               t T ,
v c o n t = R T 2 F l n J L i m J L i m j t               t T .
A high H 2 production rate is essential to meet the demand for H 2 . Therefore, multiple E L Z are arranged in sequence, denoted as N s , to create an E L Z unit. Voltage drop across E L Z is obtained by the formulation given in Equation (14):
v s t = N s · v c t               t T
The quantity of H 2 from E L Z is proportional to the current delivered to E L Z unit. The relationship is represented by Equation (15) as follows [71]:
M t = η F t · N s · i t · m H 2 2 F                   t T
In this context, m H 2 denotes mass of H 2 (kg/mol). The efficiency of conversion η F t is calculated using the following formula [72]:
η F t = c 1 P H 2 + c 2 · j t d + f ,               t T
The E L Z conversion efficiency is shown in Equation (17):
η t = M t · H H V p t                 t T
In Equation (17), HHV represents the H 2 heating value in (J/kg).
The electrical power used by the E L Z unit ( P E H T ( t ) ) can be obtained by using Equation (18):
P E H T t = i t · v s t               t T
The E L Z current is symbolized by i ( t ) .
The stored energy in H 2 in the storage unit is computed by using Equation (19) [70,73]:
E H T t = E H T t 1 + E H T t × δ t P H T F C ( t ) × δ t × η H T
At interval step t, the amount of stored H 2 is denoted by (EHT). The power from E L Z to the H 2 tank is symbolized by P E H T , while P H T F C denotes the power supplied from the H 2 tank to FC. The efficiency of the H 2 tank is expressed as η H T . The output from the FC, P F C , can be obtained using Equation (20) as follows:
P F C ( t ) = P H T F C ( t ) × η F C × η c o n v
where η F C and η c o n v represent the efficiencies FC and converter.

2.4. Modelling of Battery Storage

The charging and discharging of a BAT storage depend on the capacity of the BAT storage. The depth of discharge (DoD) corresponds to the maximum ratio of energy that can be securely released from the BAT to avoid adverse effects on the lifecycle [74]. Therefore, Equations (21) and (22) make up the power limitations for charging and discharging, while Equation (20) states the boundary of the state of charge (SOC) of the BAT [75].
P B A T , D C H ¯ P t B A T , D C H P B A T , D C H ¯
P B A T , C H ¯ P t B A T , C H P B A T , C H ¯
S O C ¯ S O C t S O C ¯       t   ϵ   T
In addition, Equation (23) proves the balance of the SOC battery, whereas Equation (24) is applied to curtail power loss through charging or discharging.
S O C t = S O C t 1 + η B A T , C H × P t B A T , C H   ·   t Q B A T P t B A T , D C H   ·   t η B A T , D C H × Q B A T δ B A T , D S F × S O C t 1     t   ϵ   T
P B A T , C H × P B A T , D C H = 0
BAT degradation has an effect on lifetime and increases running costs. Equation (26) computes the degradation price, bearing in mind BAT cost, SOC, DoD, residual value, circular-trip, and charge/discharge occurrence.
D C t B A T = C B A T S V B A T 2 D O D t × Q B A T × B C C t η B A T , C H × η B A T , D C H   t   ϵ   T
D O D t = 1 S O C t 1     t   ϵ   T
B C C t = a D O D t b     t   ϵ   T

2.5. Modeling of Grid Inverter

The output power from the inverter connected to the grid is computed using the following expression [69]:
P i n v ,   o u t = P p v + P w t + P s t o r a g e × η i n v

2.6. Energy Management System

This study proposes a rule-based energy management system (REMS) for a grid-connected MG. A rule-based EMS is used due to its simplicity, user-friendliness, real-world application, and low computation demands. The sequence of operations is obviously drawn for engineers and operators, which can be amended by engineers to enhance operational viability and allow optimum scheduling. The working principle of the EMS is as follows:
In this plan, during peak hours, the retail price (RP) and FiT for electricity are relatively high. Consequently, households are advised to minimize grid electricity purchases and maximize electricity sales to the grid. Conversely, during off-peak hours, RP and FiT are obviously low. Therefore, it is suggested that power from the grid be procured and surplus power be stored in the H 2 and BAT storage, even with high generation from solar PV and WT.
In the mid-peak hours, RP and FiT are at standard rates. Thus, any deficit in energy should primarily be met by hydrogen and batteries to reduce electricity procurement costs. Moreover, excess renewable power should be utilized to recharge the H 2 and BAT for subsequent peak hours. Algorithm 1 below outlines the REMS for the time-of-use–time-of-use (ToU-ToU) plan as follows:
Algorithm 1 REMS for ToU-ToU plan
Inputs:   MG   elements   data ,   irradiation ,   temperature ,   wind   speed   profiles ,   P T L , SOC of the energy storage system, SOH in the HST.
Outputs: Schedule of power sharing among the RES, hydrogen storage, battery units, and the main grid.
for   t = 1 : 8760
for (each time interval (t)) do
Step   1 :   Calculate   the   P P V ( t ) ,   P W T ( t ) using Ir(t), T(t), VW .   if   η i n v × ( P P V t + P W T t ) > P T L ( t )
if The ToUsell price is high
then
The load should be supplied, and then the extra to the grid, then charge the BAT, then charge the hydrogen storage tank.
else
The load should be supplied, then charge the BAT, charge hydrogen tank, and the excess to the grid.
end if
else
if the TOUbuy price is high
The load should be supplied first, then release BAT energy, supply hydrogen fuel cell, and then buy shortfall power from the grid.
else
Load should be supplied first, then buy the shortfall power from the grid, release BAT energy, supply hydrogen to fuel cell.
end if
end if
end for
In this study, the justification for the priority logic of REMS integrates economic signals (ToU rates), energy storage characteristics, and load demand considerations to achieve a balanced, low-complexity, and cost-effective operational strategy.

3. Formulation of Optimization Problem

Optimal sizing of an MG can be articulated as follows [69]:
Minimalize   f x = [ f 1 x , f 2 x , , f k x ]
Constrained by h ( x ) 0 and g x = 0
Here, x , f ( x ) , f 1 ( x ) , h ( x ) , and g ( x ) represent the searching space of the model, which comprises the i t h individual objective function, as well as the associated disparity and parity constraint sets.

3.1. Objective Function

The MG is analyzed based on two key metrics: ASC and COE. These metrics are selected to enhance the MG’s performance and ensure a stable power delivery at the lowest feasible cost.

3.1.1. Annual Cost of System

The ASC is an extensively recognized metric used in evaluating the cost-effectiveness of MG systems. Equation (31) represents the primary objective function to minimize, incorporating relevant limitations [15].
A S C ( $ / k W h ) = F ( N P V C P V + N W T C W T + N B T C B T + N E L C E L + N H T C H T + P F C C F C + P I N V C I N V )
Here, P V , W T , E L , H 2 tank, F C , B T , and INV are given as C P V , C W T , C E L , C H T , C F C , C B T , and C I N V , respectively. N P V , N W T , N B T , N E L , and N H T correspond to the number of P V panel, W T , B T , E L , and H 2 tank. The ratings of F C and INV are represented by P F C and P I N V , respectively.

3.1.2. Levelized Cost of Energy

The COE is an important metric for evaluating the economic viability of an MG. It encompasses all costs incurred throughout the MG’s operational lifespan, including initial capital expenditure, maintenance and operation, and other related expenses. These total costs are then expressed as the corresponding cost per unit of electrical energy produced. Mathematically, the COE is described as the ratio between the ASC in dollars ($) and the total electrical energy produced by the MG in kilowatt-hours (kWh) [66].
L C O E = A S C E T o t a l

3.2. Optimization Constraint

The constraint for the equilibrium power is expressed by Equation (33) [70]:
P P V t + P W T t + P G t = P L t + P H S ( t ) + P B S ( t )
In this context, P G , P H S , and P B T stand for grid, H 2 , and BAT storage, respectively. These power values can either be positive (purchasing) or negative (selling), relative to the grid, and charging or discharging with respect to the BAT system.
In addition, the objective functions are subject to constraints ensuring the proper operation of H 2 and the BAT storage system, as well as the grid. These limits are defined as follows:
  • B A T SOC:
S O C m i n S O C ( t ) S O C m a x
2.
A set of limitations governs the electrolyzer (ELZ) capacity, the H 2 in the storage tank (HST), the state of H 2 (SoH) in the tank, and the electrical power delivered by the FC, as specified in the following equations:
P E l z m i n P E H T t P E l z m a x                   t T .
S O H m i n S O H ( t ) S O H m a x
E H S T m i n E H S T ( t ) E H S T m a x
E F C m i n E F C ( t ) E F C m a x
The performance criteria are constrained by restrictions of power exchange between the MG and grid utility, which are outlined in Equation (39):
P G m i n k W P G ( t ) P G m a x k W

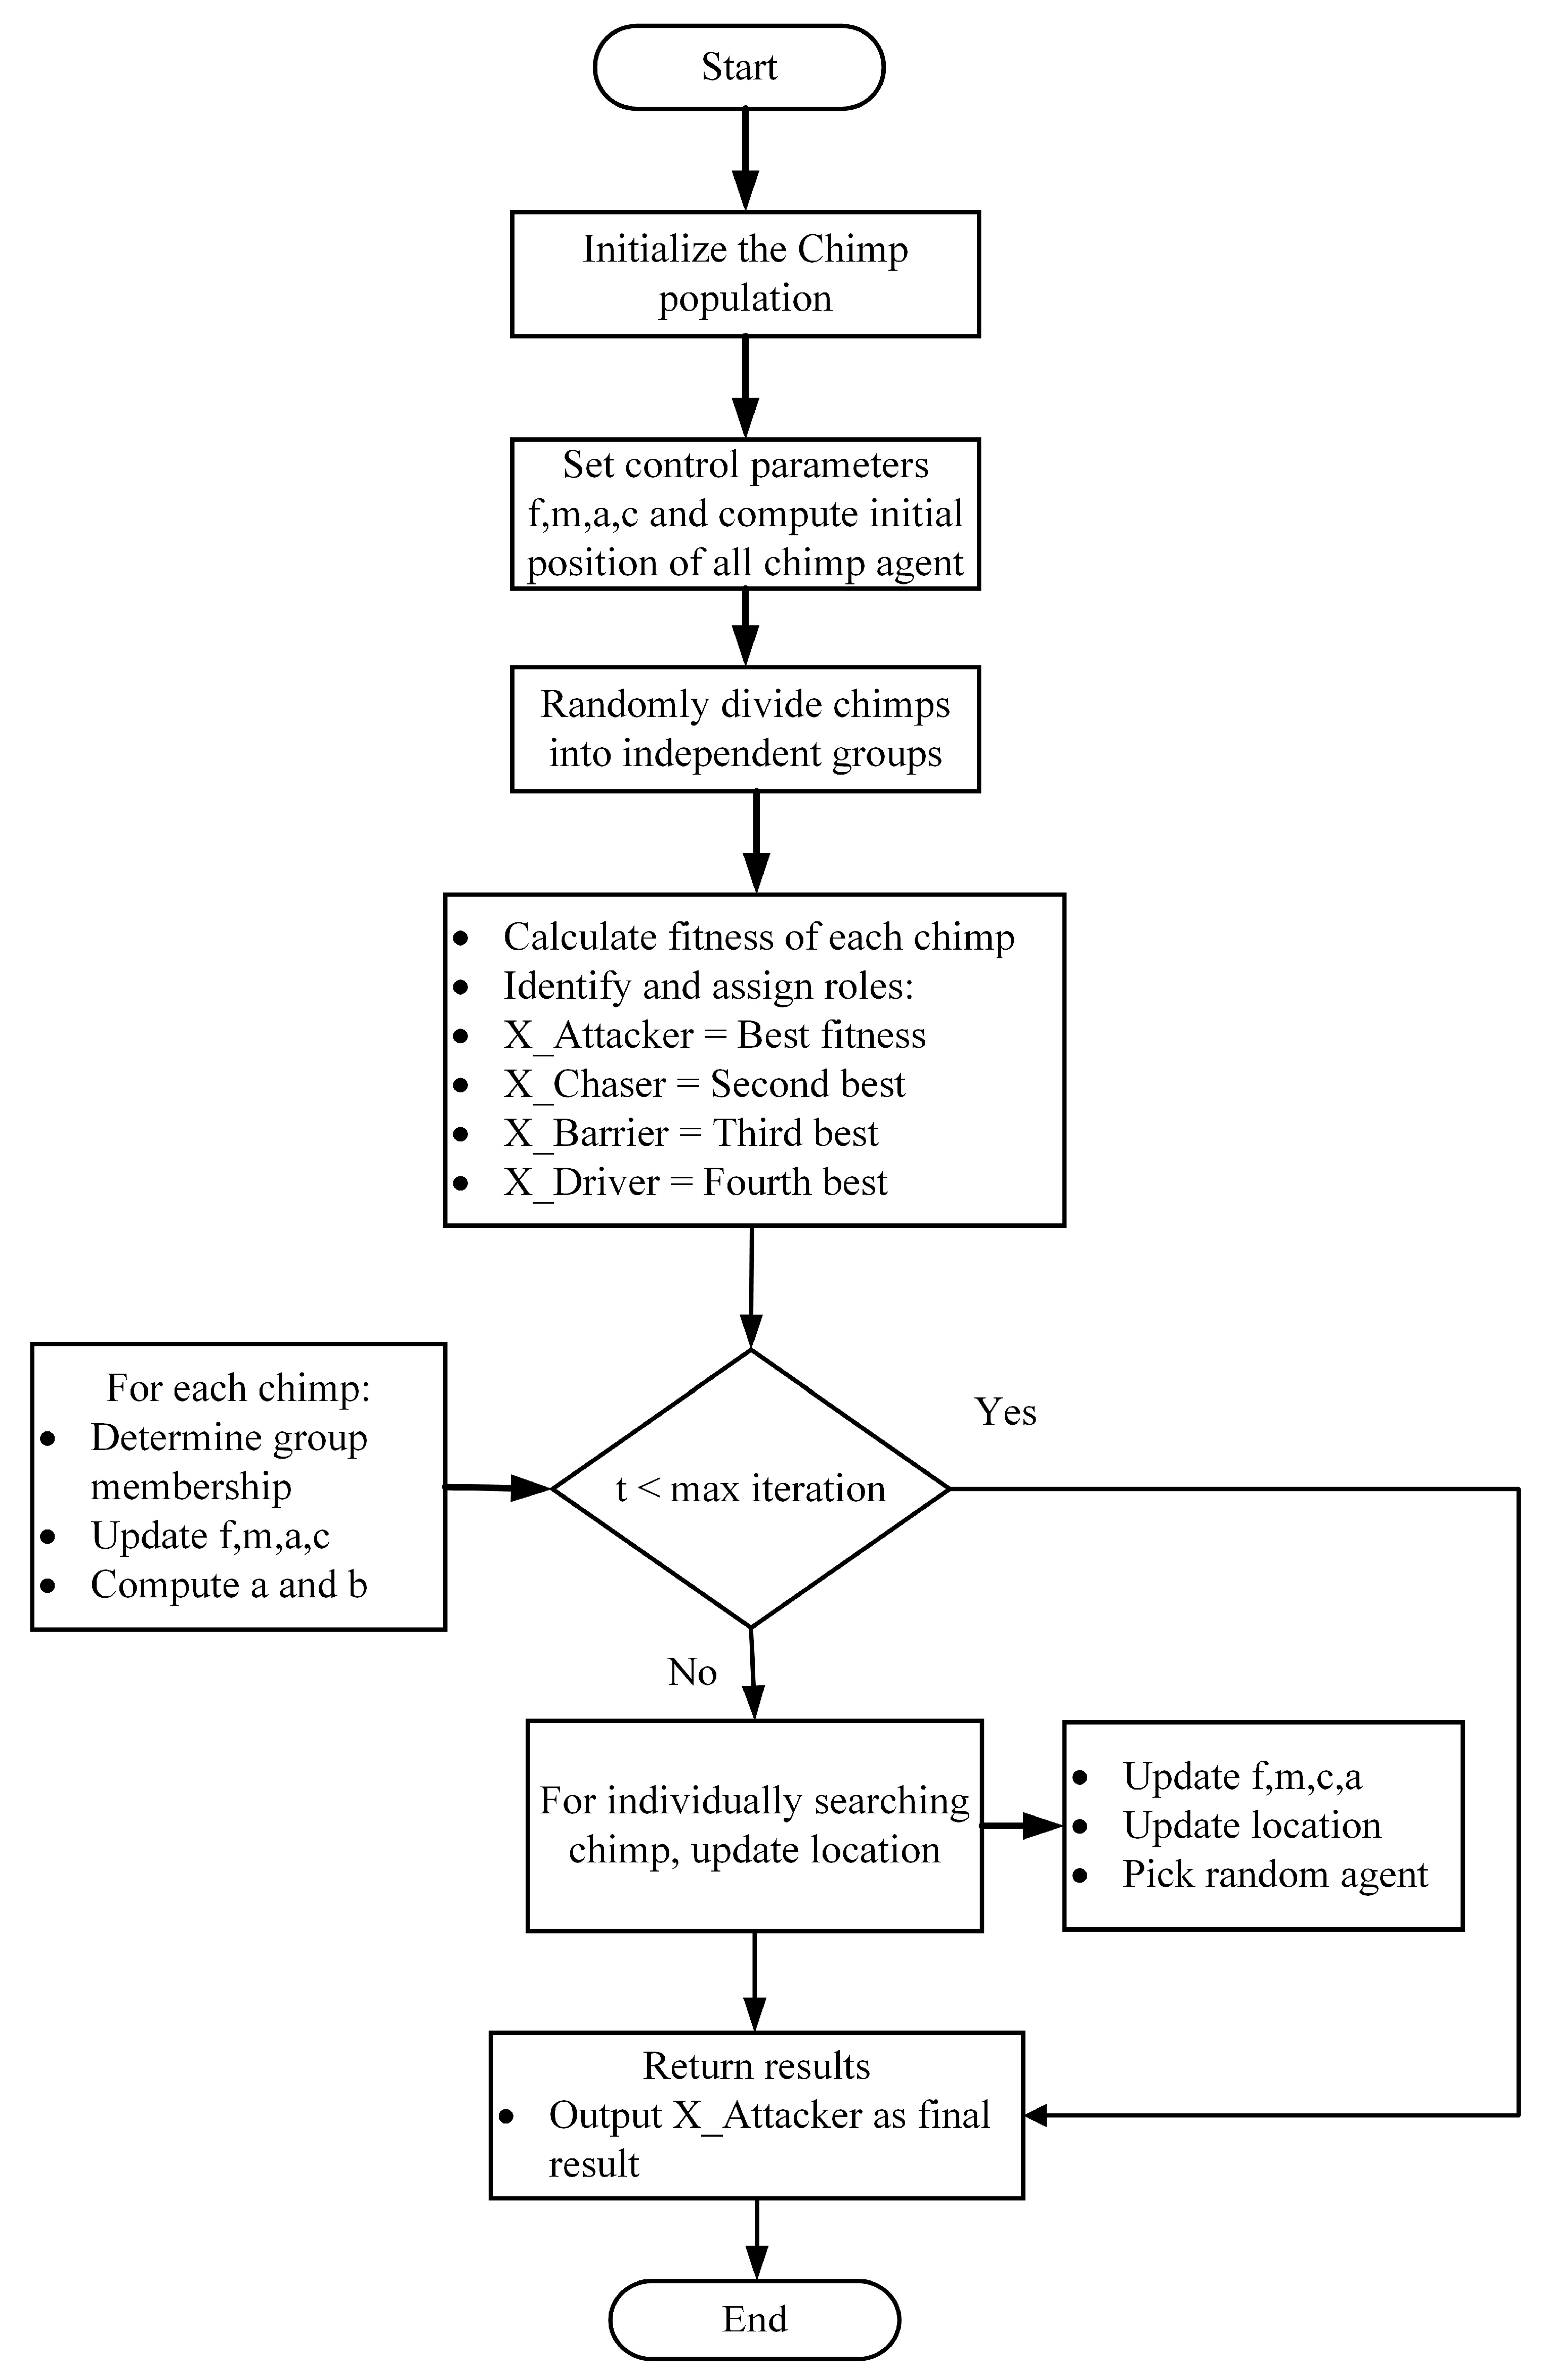
4. Chimp Optimization Algorithm

The Chimp Optimization Algorithm (ChOA) is a nature-inspired optimization approach modeled on the hunting strategies of chimps and was introduced by [76]. In a chimp colony, four distinct roles exist: driver, barrier, chaser, and attacker. Despite having diverse abilities, these roles are essential for coordinating efforts to capture prey. Figure 2 illustrates the necessary actions and strategies involved in the hunting process. As illustrated in Figure 2, drivers are responsible for pursuing the prey during the hunting process. Barriers obstruct the prey’s movement by creating obstacles among the tree branches. Chasers focus on catching up with the prey, while attackers predict the prey’s escape path, forcing it back toward the chasers’ position. Collectively, the driver, barrier, and chaser contribute to the exploration stage (stage 1), whereas attackers assume control during the exploitation stage (stage 2) [77].
In the mathematical framework, ChOA is unable to directly identify the optimal solution (prey) within the abstract search space. To address this limitation, the solutions associated with the driver, barrier, chaser, and attacker are designated as the most favorable. Consequently, these four groups guide the remaining chimps during the search phase and hunting phase. This connection is expressed as follows:
D A = C 1 X A M 1 X ,   D B = C 2 X B M 2 X ,   D C = C 3 X C M 3 X ,   D D = C 4 X D M 4 X
X 1 = X A A 1 D A ,   X 2 = X B A 2 D B ,   X 3 = X C A 3 D C ,   X 4 = X D A 4 D D
X ( t + 1 ) = X 1 + X 2 + X 3 + X 4 4
Here, t represents the present iteration. The vectors X A , X B , X C , and X D correspond to the present positions of the four groups of chimps. The vector X represents the present position of other chimps. Additionally, the C , M , and A vectors play a significant role in the ChOA mechanism and are determined using Equations (43)–(45):
A = 2 · f · r 1 f
C = 2 · r 2
f M = Chaotic   value
Here, r 1 and r 2 denote random vectors with constants ranging between 1 and 0, while f is a control parameter that decreases non-linearly from 2.5 to 0. The pseudo-code and flowchart of the ChOA are presented in Table 3 and Figure 3.
The ChOA was developed and implemented in MATLAB R2021b. All algorithmic structures, fitness function evaluations, and system constraints were encoded using custom scripts. The solver was fully developed without relying on prebuilt toolboxes, allowing for maximum flexibility in tailoring the algorithm to the system’s multi-objective optimization requirements. Simulations were performed on a computer equipped with an Intel Core i7 processor and 16 GB of RAM.

5. Simulation Results

In this section, the results of renewable energy resources needed for modeling and optimizing hybrid energy systems are presented, which include PV–WT–FC–BAT designed to supply power to a community in northeastern Nigeria, a region characterized by an ample and consistent source of energy from wind and solar throughout the year. Figure 4 presents detailed data on wind speed, solar radiation, temperature, and load demand. The study is based on Nigeria’s electricity pricing structure, highlighting that peak hours occur from 8:00 to 18:00, while off-peak hours span from 1:00 to 7:00 and 19:00 to 24:00. This distinction is significant because electricity market dynamics, including flexibility and economic efficiency, vary between peak and off-peak periods.
Table 4 presents detailed parameter settings for the suggested ChOA and the standard algorithms, which are SSA, GWO, and GA.

5.1. Optimization Results

The optimal results derived from the benchmark optimization algorithms are summarized in Table 5 and illustrated in Figure 4, emphasizing the superior performance of ChOA compared to GA, SSA, and GWO. As shown in Table 5, the ChOA method achieved the most effective and cost-efficient results, with a minimum ASC of $544,422 and COE of $0.272. In comparison, SSA, GWO, and GA reported high ASC of $544,834, $545130, and $544,612; LCOEs of $0.275, $0.276, and $0.274, respectively. All three optimization algorithms recorded zero loss of power due to the integration of the grid into the MG. The fraction of renewable energy in the MG stands at 57%, with PV contributing 43% and WT accounting for 14%.
Figure 5 presents the final ASC values for the methods, demonstrating that ChOA achieved the lowest cost among the algorithms tested (SSA, GWO, and GA). This advantage is attributed to ChOA’s unique ability to handle local optima more effectively than SSA, GWO, and GA. A detailed breakdown of the total ASC is depicted in Figure 6, showing the contributions of photovoltaic, wind, battery, fuel cell, hydrogen, electrolyzer, inverter, and grid at 22.5%, 9.5%, 1.7%, 2.6%, 1.6%, 7.4%, 0.9%, and 53.9%, respectively.

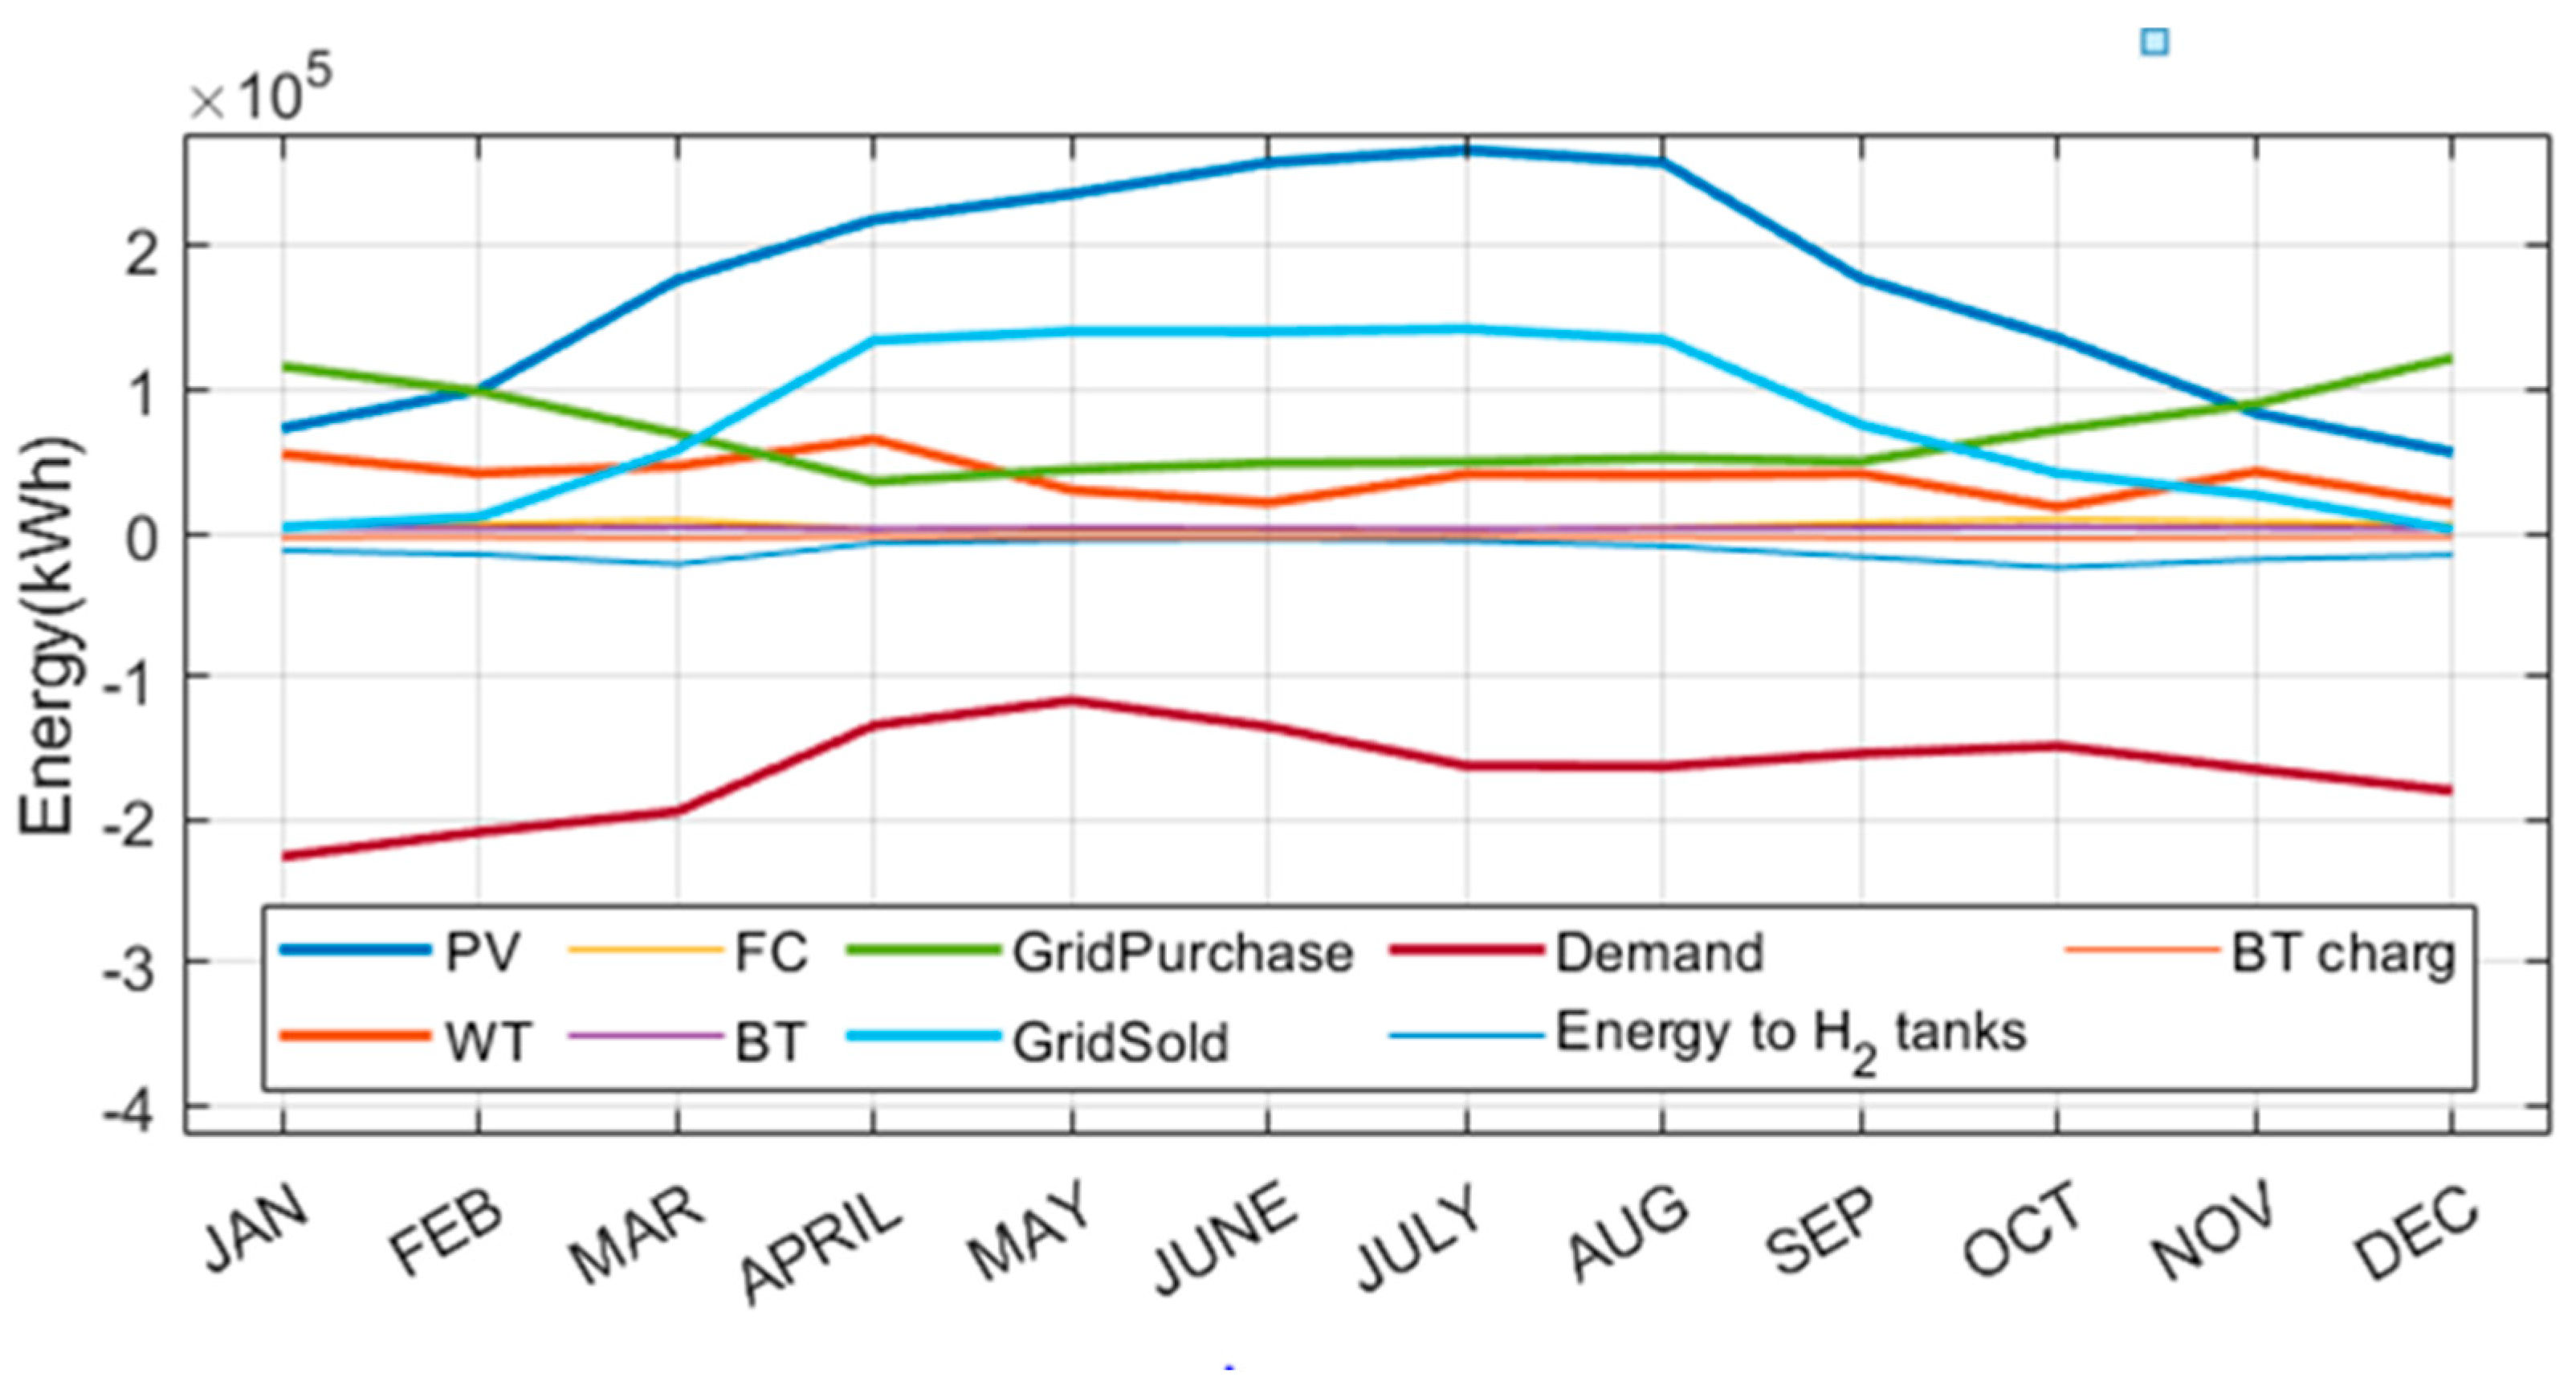
5.2. Seasonal Variability of Energy Sources and Contributions

Figure 7 provides a detailed representation of the monthly energy generation, grid interaction, and load consumption in a grid-connected microgrid, emphasizing the contributions of its various components. The PV system, represented in blue, emerges as the dominant energy generator, with output levels peaking during summer months (e.g., May to August) due to increased solar irradiance. This trend underscores the seasonal dependence of PV systems, which generate significantly more energy during the summer months. WT, shown in orange, provides a consistent but relatively smaller share of energy across the year, reflecting the variability in wind availability and its complementary role in the microgrid. The FC, represented in yellow, produces a steady and low energy output, indicating its potential use for base-load support or as a reliable backup during periods of insufficient renewable generation.
The battery, depicted in purple, has minimal energy output, highlighting its role as a supplementary component, used for energy balancing or short-term backup. The microgrid’s interaction with the grid is also evident, with energy purchased from the grid (green) being prominent in months with lower renewable energy generation and higher load demands, such as the winter months (e.g., December and January). Conversely, during the summer, surplus energy primarily from PV generation is sold back to the grid (light blue), demonstrating the ability of the system to function as a net energy contributor during periods of high renewable output.
The blue curve represents the monthly load demand, which exhibits a clear seasonal variation. Demand is highest in colder months (e.g., December and January), driven by heating requirements, and decreases during warmer months when cooling requirements may not fully offset the reduced energy use. This seasonal fluctuation in demand aligns with the energy generation and grid interaction dynamics, highlighting how the microgrid relies on both renewable sources and grid energy to meet varying needs throughout the year.
The graph shown in Figure 8 illustrates the energy balance between supply and demand in a grid-connected microgrid, showing the contributions and interactions of its components throughout the year. PV systems, represented by the blue line, dominate energy generation, with output peaking in summer (May to August) and declining in winter, while WT in orange and the FC in yellow provide steady but smaller contributions. The grid complements renewable generation, with energy purchases (green) increasing during winter months to meet higher demand and energy sold in cyan rising during summer due to PV surpluses. Battery charging and discharging help balance fluctuations, while energy directed to hydrogen tanks (light blue) remains relatively stable year-round. Energy demand (maroon) peaks in colder months, driven by heating requirements, and decreases during warmer months. The microgrid effectively balances supply and demand through dynamic interactions between renewable generation, energy storage, and grid dependency, ensuring reliability despite seasonal variations. Figure 9a,b also illustrate a combined annual and weekly renewable energy production, respectively.

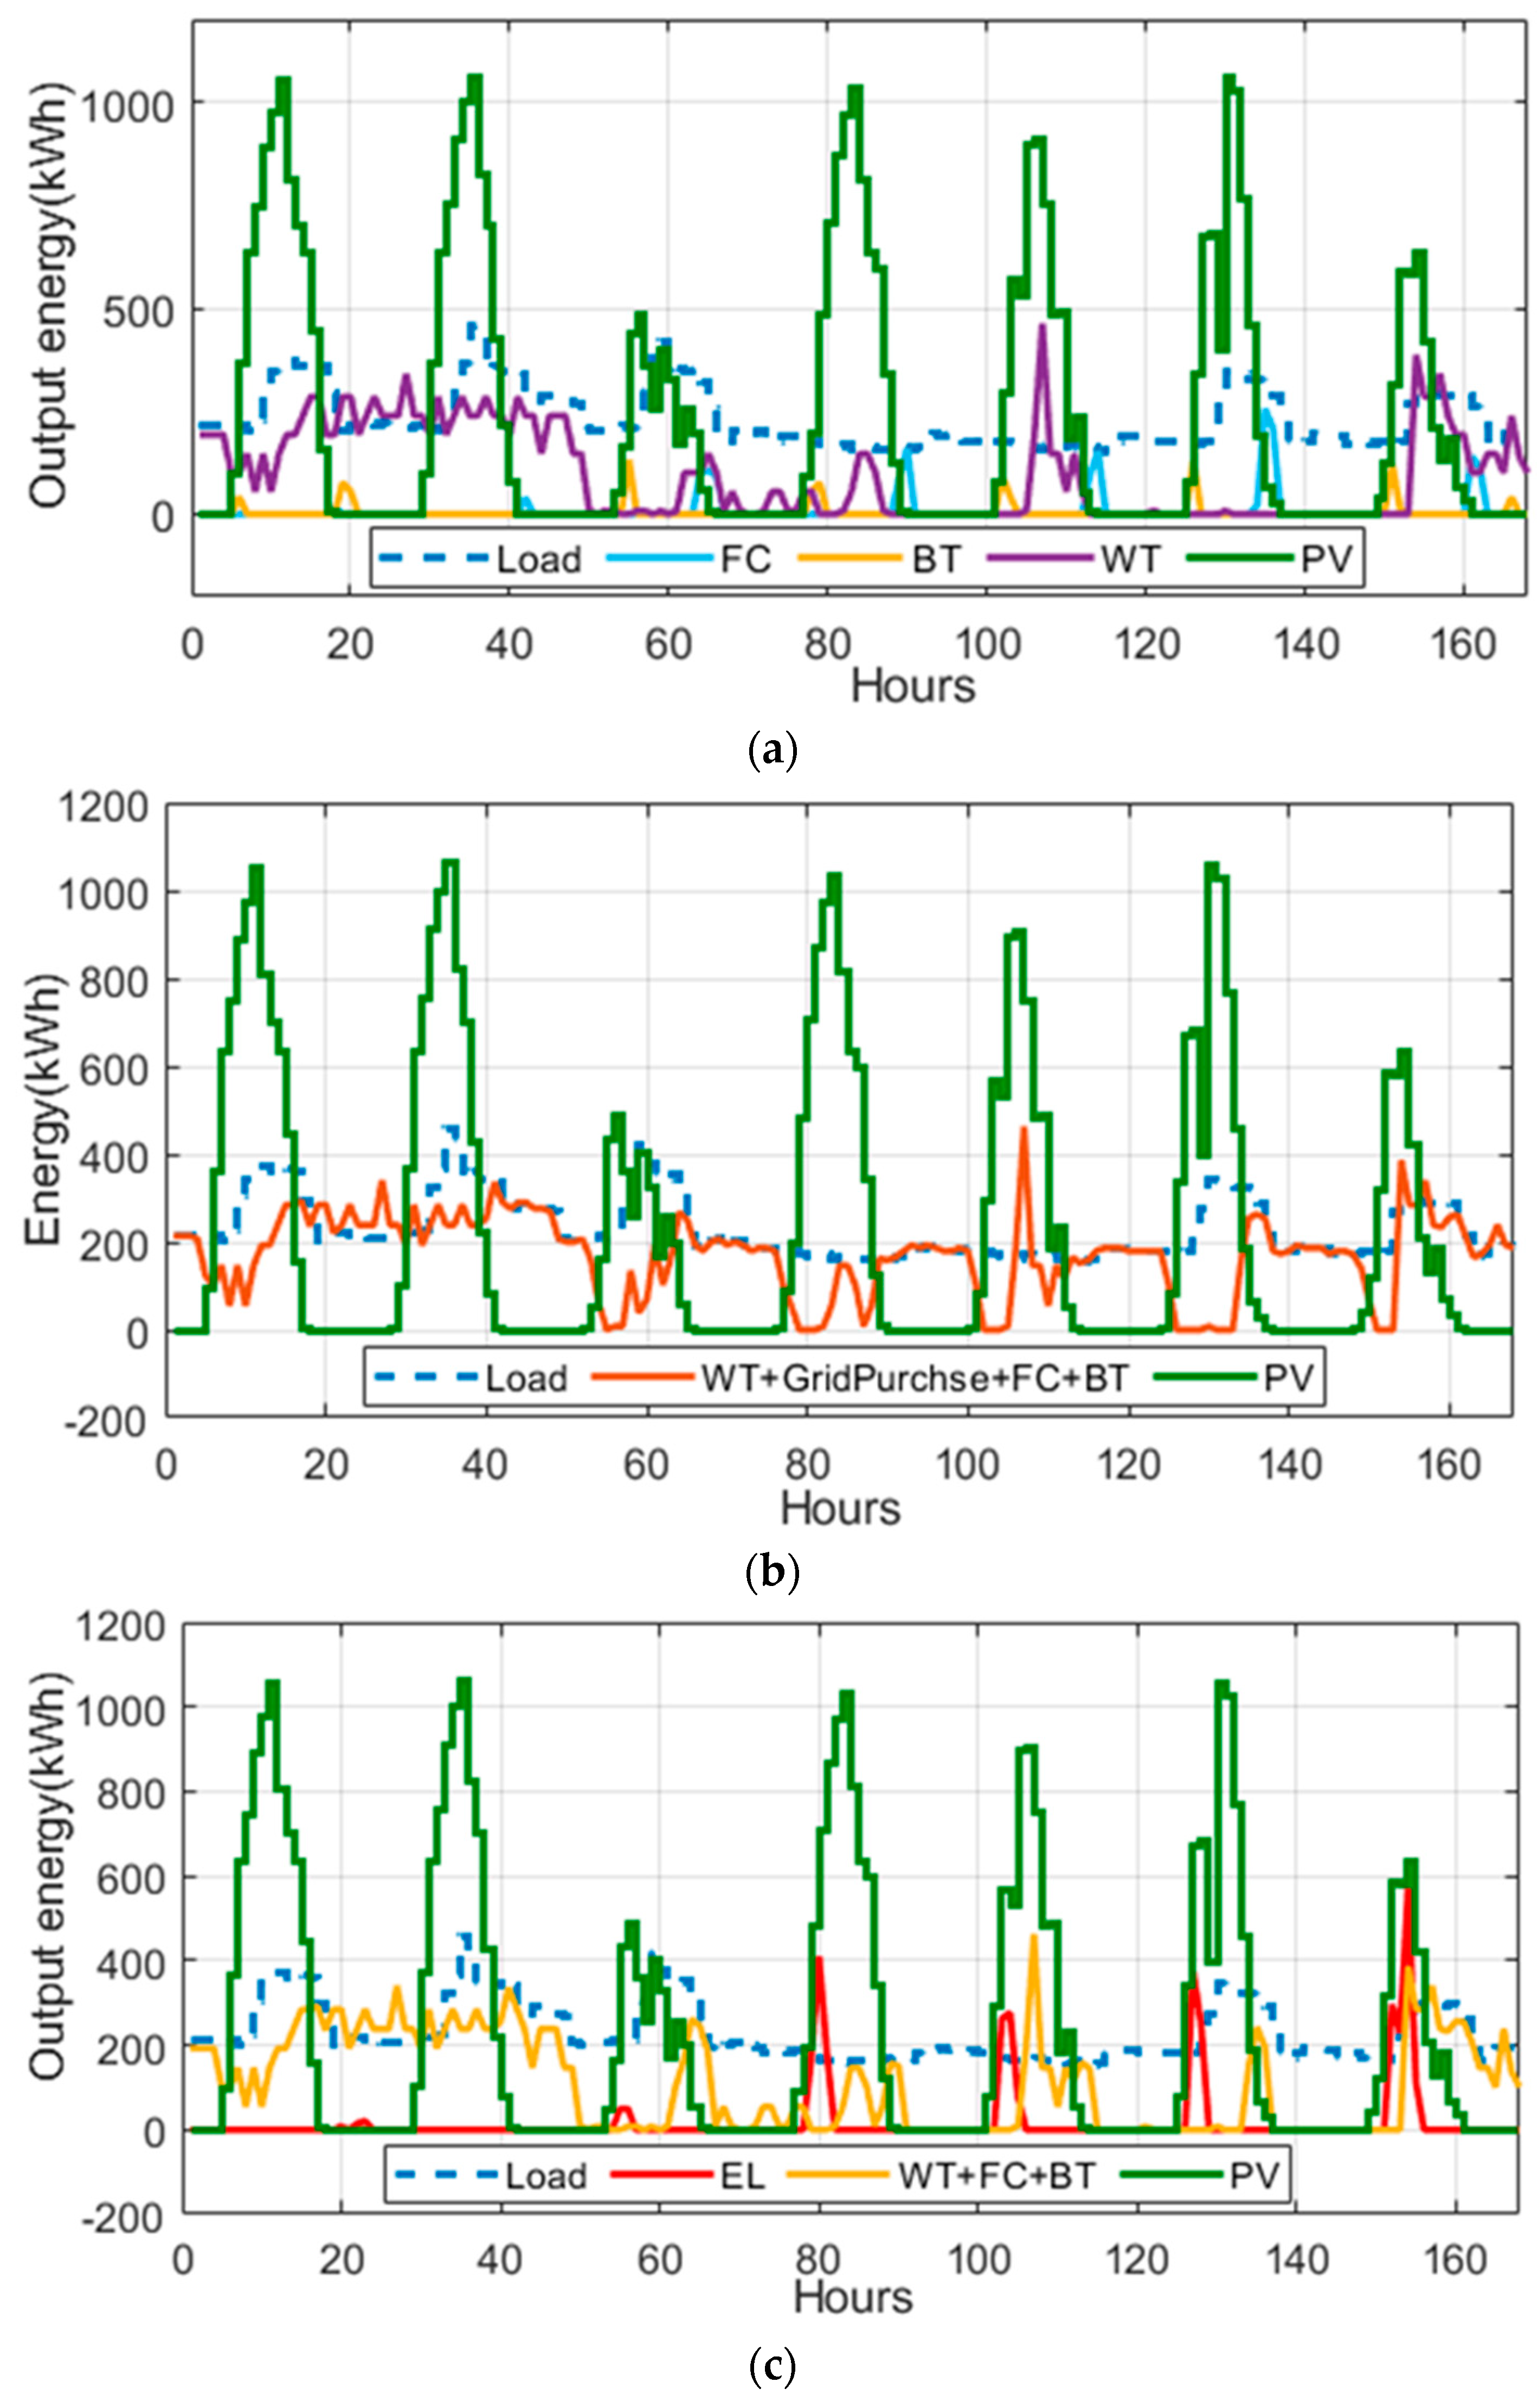
5.3. Analysis of Power Production and Demand

The three graphs shown in Figure 10a–c illustrate the energy generation dynamics of a microgrid under different operational scenarios. Figure 10a, demonstrating energy generation without grid connection, highlights the significant role of renewable energy sources such as WT and PV systems in meeting the load demand (blue dashed line). However, due to the absence of grid support, the system relies solely on energy storage and generation from batteries (BAT) and fuel cells (FC) to bridge the gap during renewable shortfalls, leading to occasional mismatches between supply and demand.
The second scenario, depicted in Figure 10b, incorporates the electrolyzer (EL) output into the energy generation analysis. The red line represents hydrogen production via the electrolyzer, which operates during periods of surplus energy from WT and PV systems. This integration allows the excess energy to be stored in hydrogen form, enhancing the system’s energy storage capability and overall efficiency. The energy contribution from WT, PV, and the combined operation of FC and BAT further ensures a stable energy supply while enabling hydrogen production as a secondary output.
The third scenario, represented in Figure 10c, showcases energy generation in a grid-connected setup, where the orange line represents the combined energy contribution from WT, grid purchases, FC, and BAT. The grid connection significantly enhances the flexibility of the system by providing supplementary energy during renewable energy deficits. This connectivity ensures a continuous power supply, even under fluctuating renewable energy conditions. Furthermore, the PV system (green line) remains a dominant source of energy, while the grid stabilizes the system by compensating for any deficits and exporting surplus energy when available. These figures collectively stress the importance of grid integration and hydrogen storage in optimizing microgrid energy management and ensuring reliability across various scenarios.
The diagram shown in Figure 11 illustrates the dynamic interplay between energy generation, load demand, and battery state of charge (SOC) in a grid-connected microgrid over time. WT, shown by the blue line, provides consistent energy, while photovoltaic (PV) generation, indicated by black markers, follows a diurnal cycle, peaking during the day and ceasing at night, significantly contributing to daytime energy needs. Fuel cells and batteries (FC + BAT, green line) operate jointly to support the load during renewable shortfalls, particularly at night. The grid (cyan line) supplements energy when both renewable and storage resources are insufficient, ensuring reliability. Load demand (magenta line) remains relatively stable, with minor fluctuations, while the battery SOC (orange line) fluctuates dynamically, charging during surplus PV generation and discharging during periods of high demand or low renewable output. This coordinated operation among renewable sources, battery storage, and grid energy effectively balances supply and demand, demonstrating the ability of the energy system to manage variability and ensure a reliable energy supply.

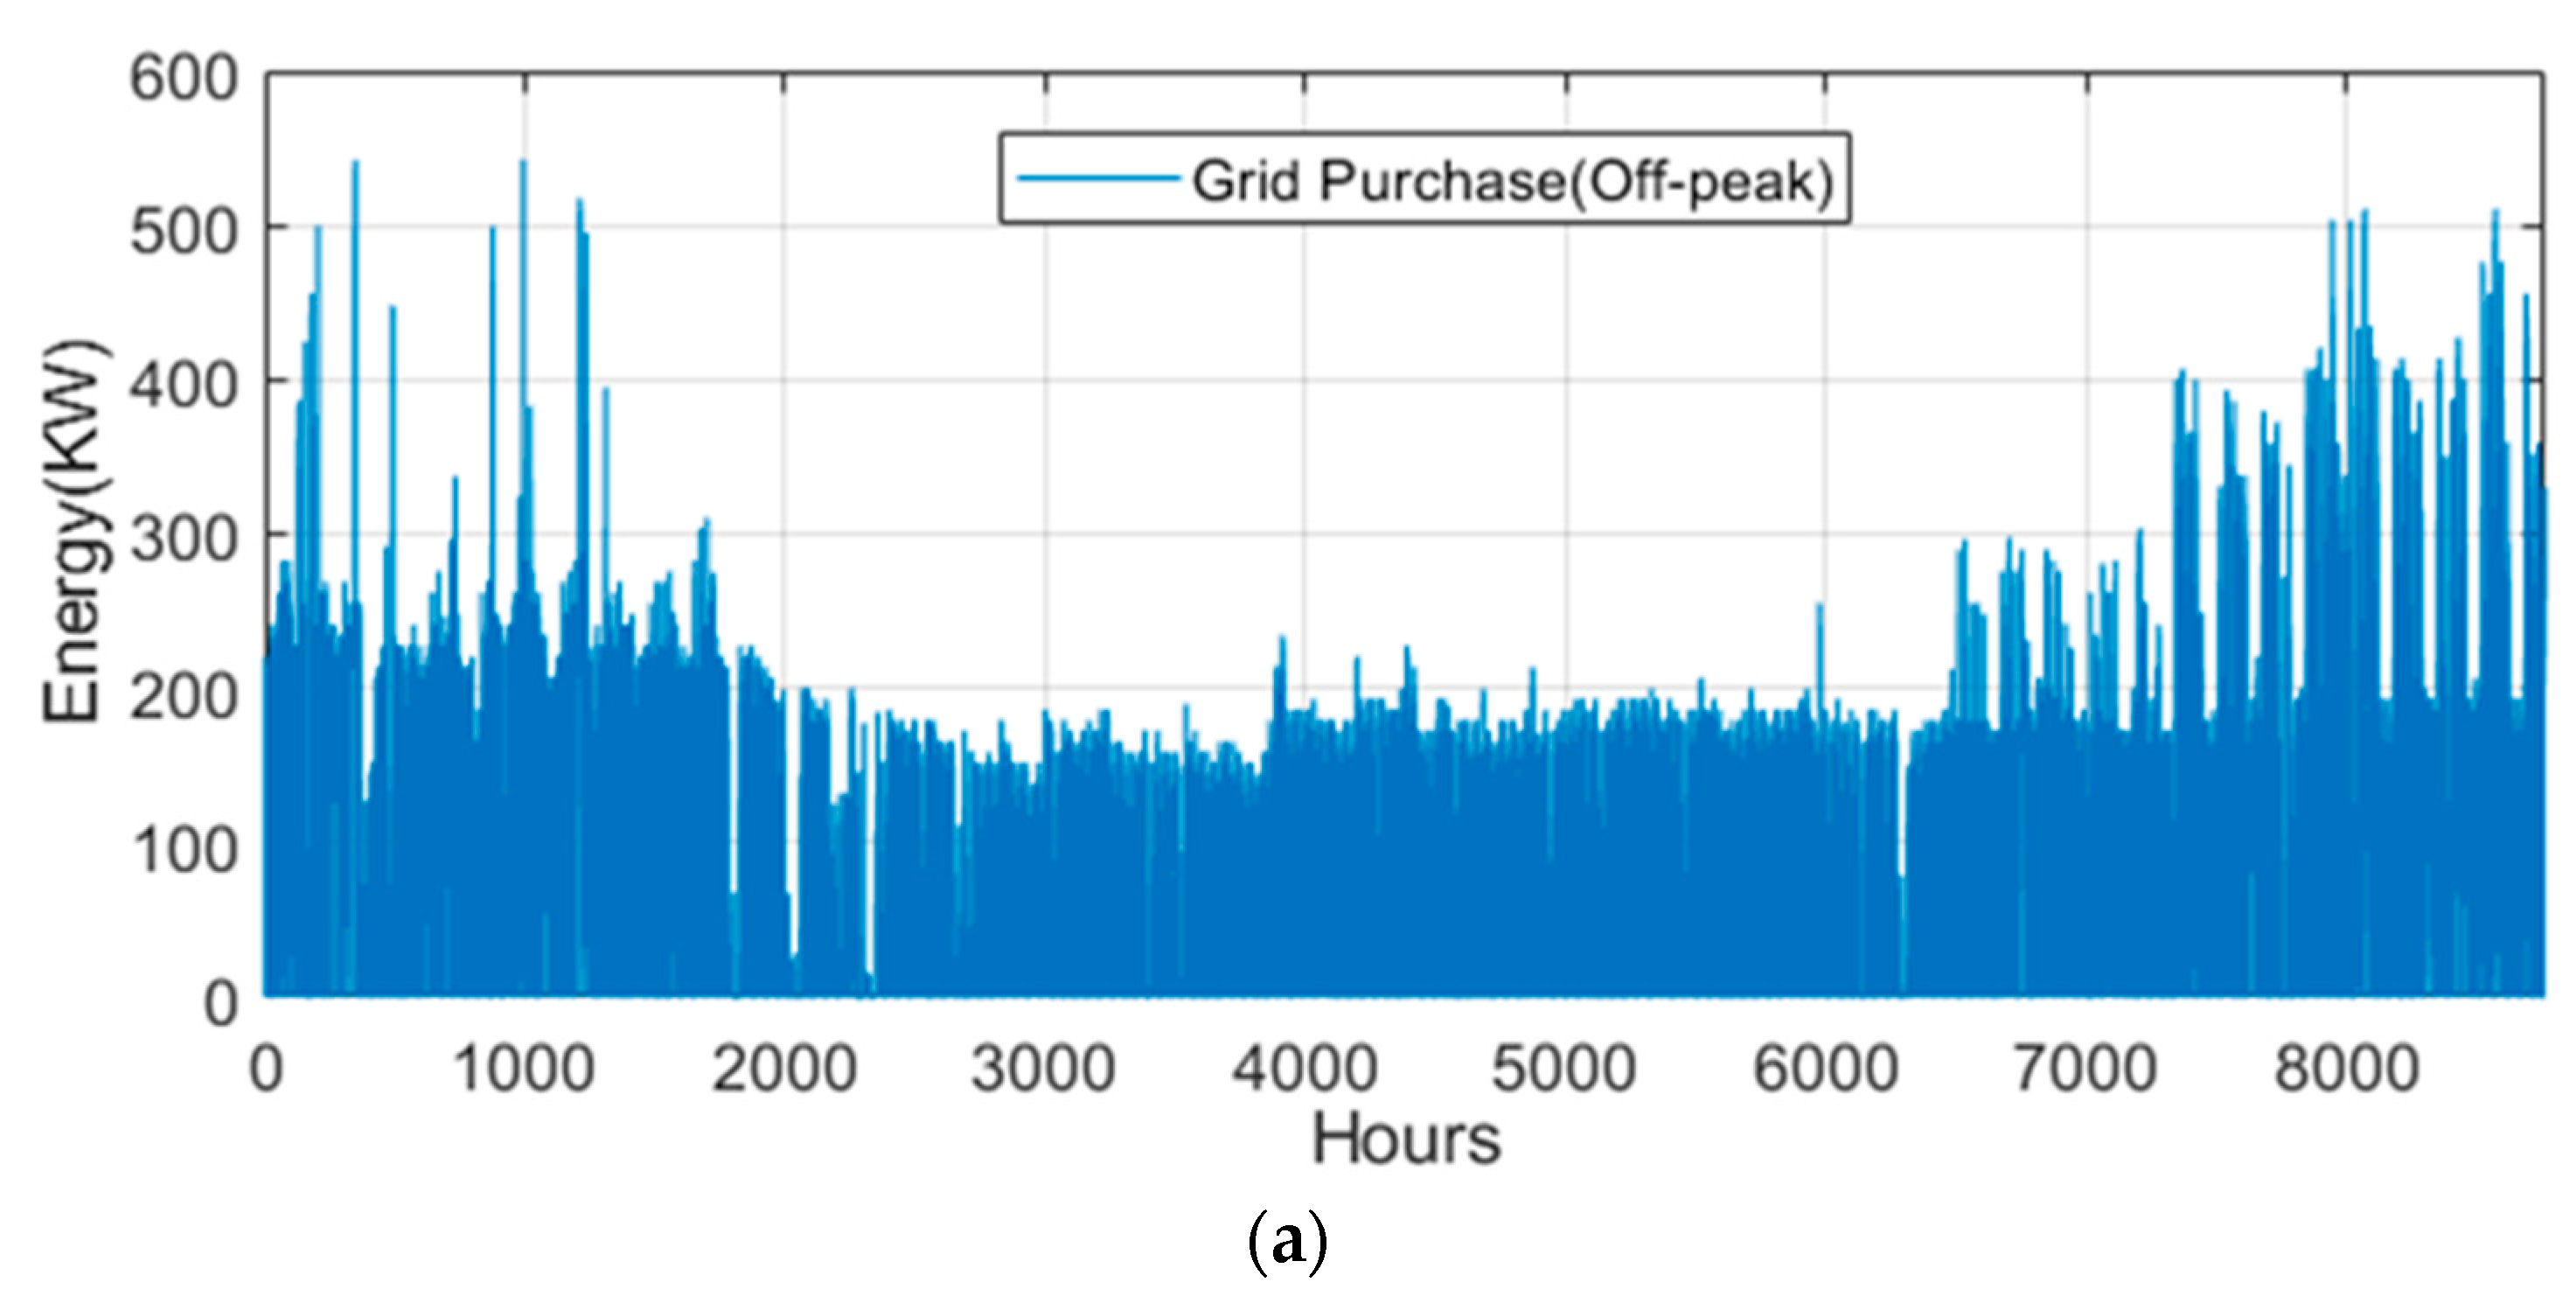
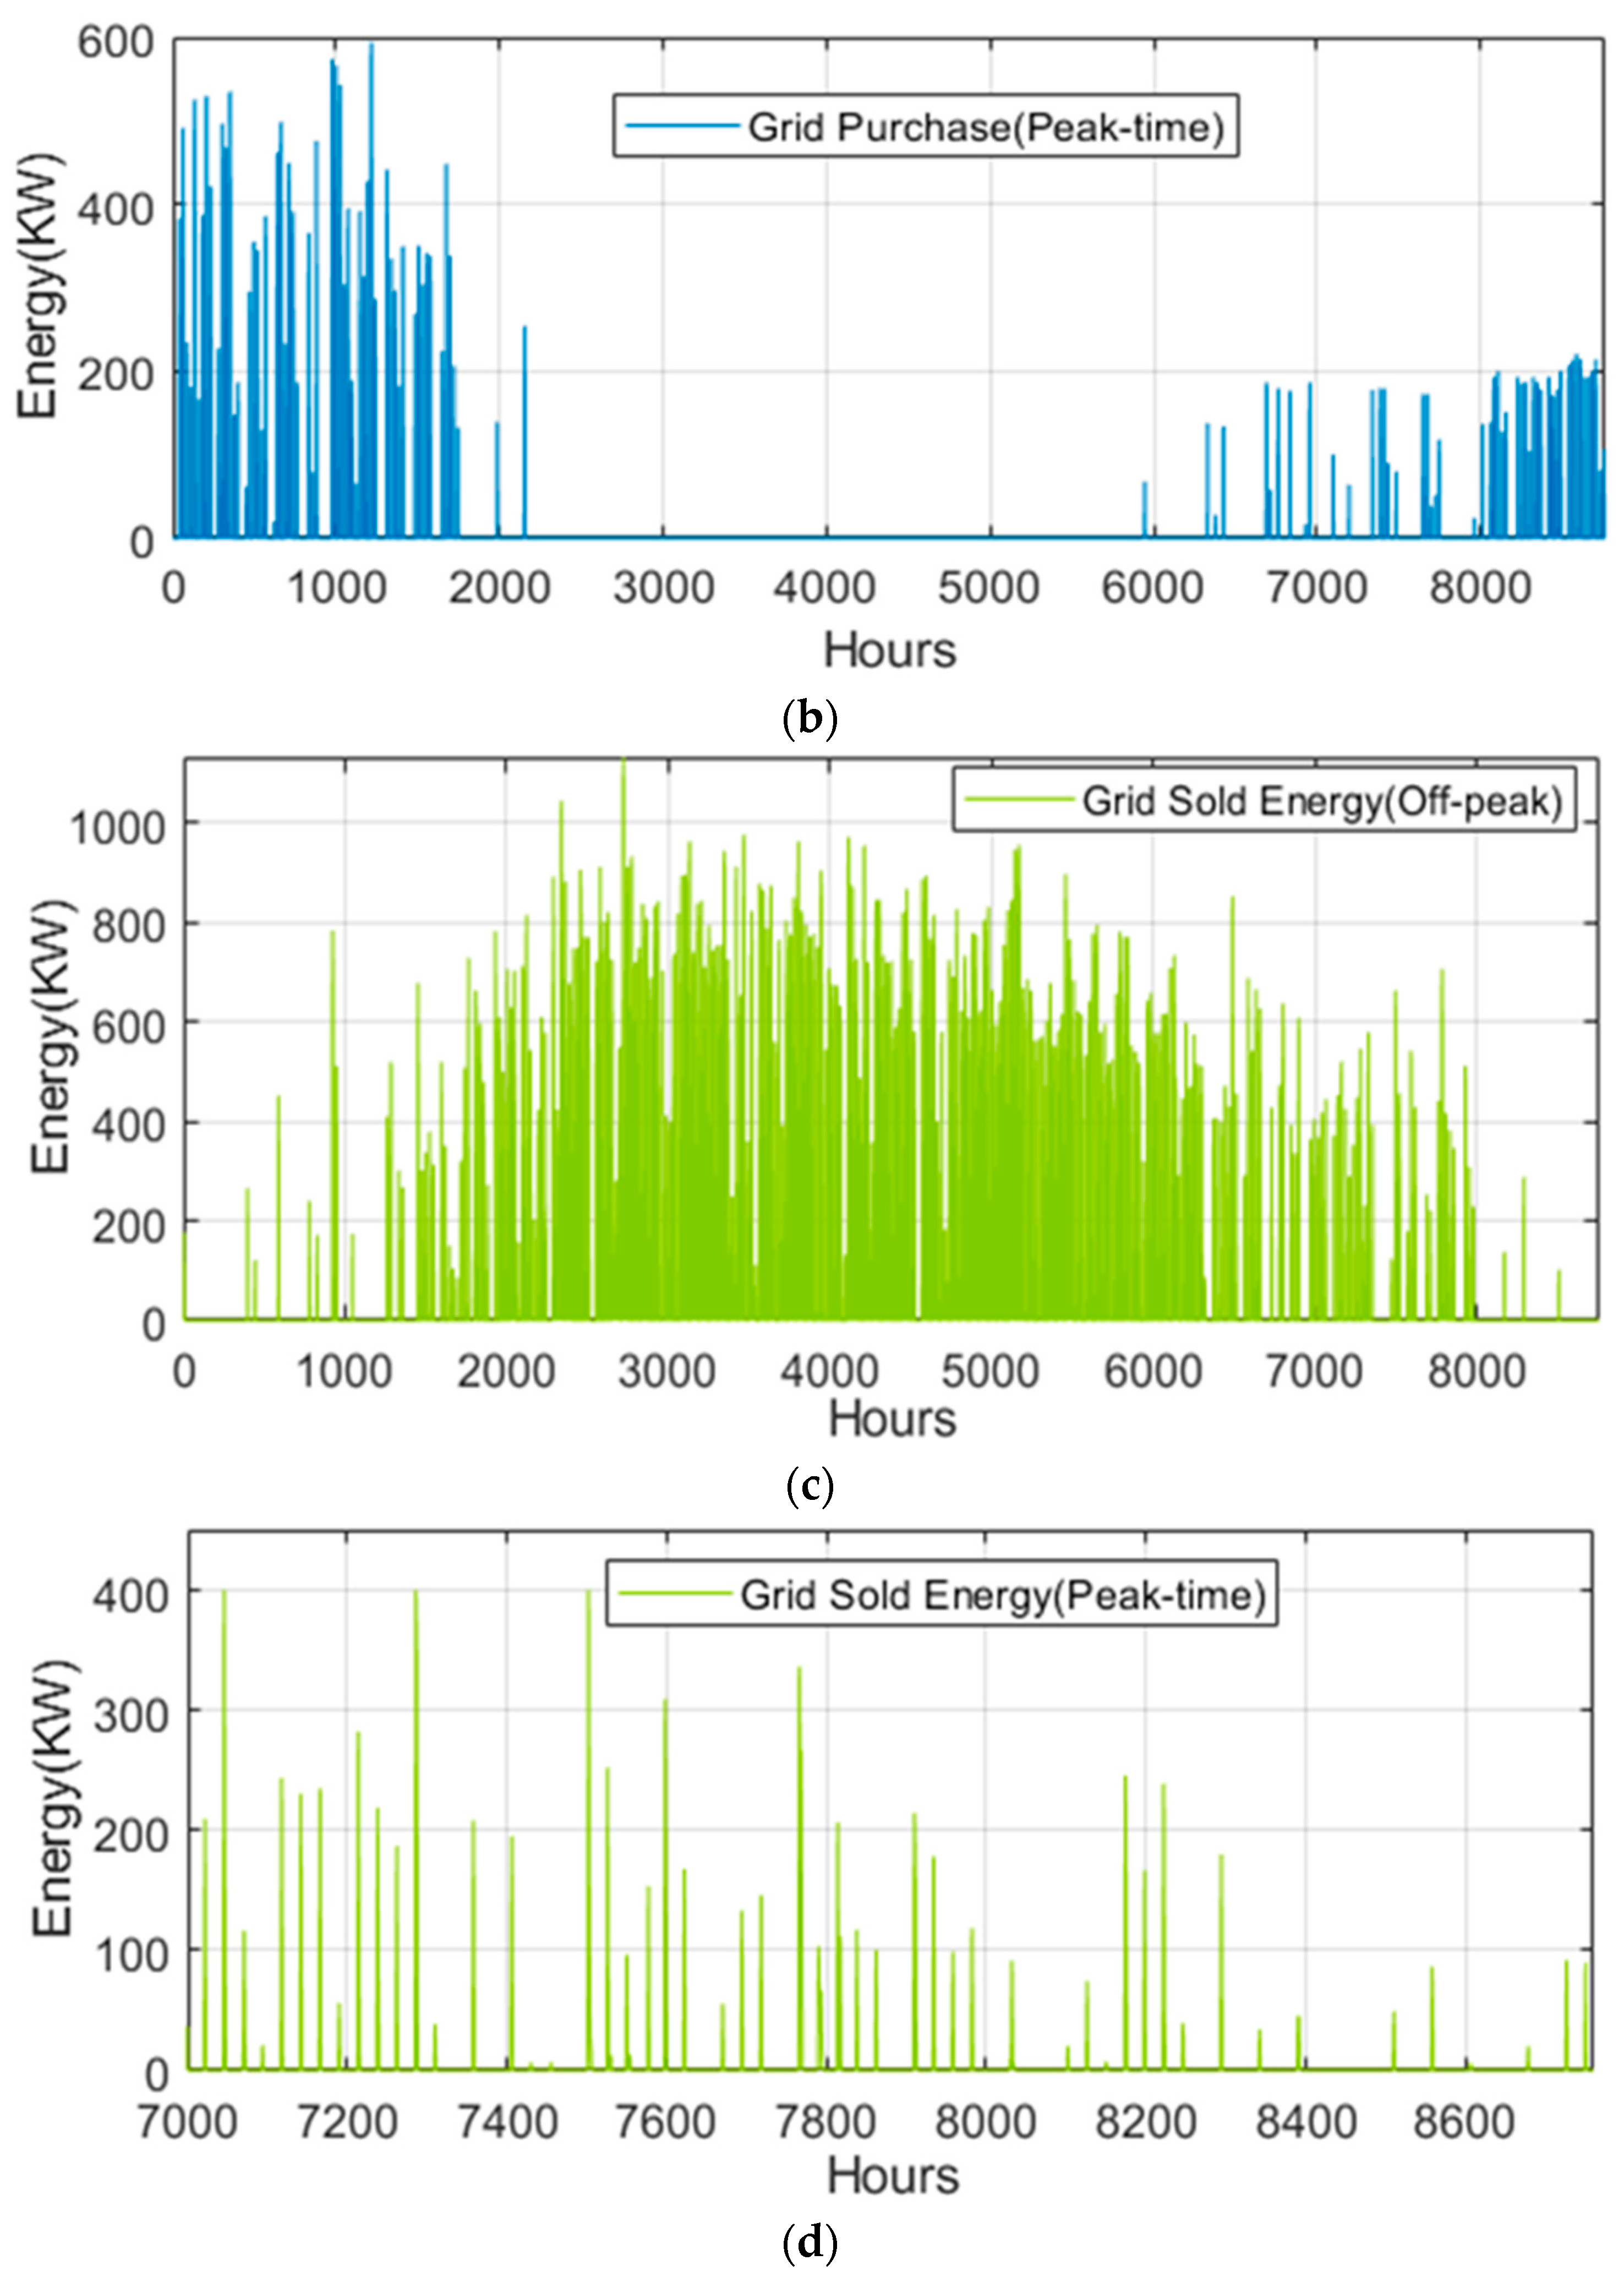
5.4. Analysis of Energy Trade: Purchases and Sales

The four graphs depicted by Figure 12a (grid purchase, off-peak), Figure 12b (grid purchase, peak-time), Figure 12c (grid sold, off-peak), and Figure 12d (grid sold, peak-time) illustrate annual energy trading patterns in a grid-connected microgrid, highlighting energy purchases during off-peak and peak times and energy sales during off-peak and peak hours. Off-peak purchases dominate, with consistent periods of high demand reaching up to 500–550 kW, reflecting cost-saving strategies by utilizing cheaper energy prices for demand fulfillment or storage charging. Peak-time purchases are less frequent and of lower magnitude, indicating effective demand-side management and reliance on local renewable generation or storage to reduce dependency on costly peak-hour energy. Energy sales during off-peak hours show a consistent pattern, peaking at around 1000 kW, suggesting the microgrid actively exports surplus energy, likely from renewables or storage, to generate revenue. Seasonal trends are evident, with higher off-peak sales in the middle of the year, potentially corresponding to increased renewable energy availability. The overall strategy reflects a strong focus on cost optimization, leveraging off-peak trades and minimizing peak-hour dependence, with opportunities for further improvement through enhanced storage integration and renewable forecasting.

6. Conclusions

This study proposed an integrated framework combining the Chimp Optimization Algorithm (ChOA) with a rule-based energy management system (REMS) for the optimal sizing and operation of a grid-connected microgrid featuring hybrid hydrogen ( H 2 ) and battery (BAT) storage systems. The ChOA demonstrated superior performance compared to benchmark algorithms such as SSA, GA, and GWO, achieving the lowest cost of energy (COE) at $0.272/kWh and a corresponding reduction in annual system cost (ASC). The enhanced performance is attributed to ChOA’s balanced exploration–exploitation strategy and adaptive social behavior modeling, which enable it to navigate the complex, multi-dimensional design space effectively and avoid local optima.
The proposed REMS strategy, tailored to a time-of-use (ToU) pricing environment, offers a transparent and computationally efficient approach suitable for practical implementation. It prioritizes grid interaction, storage utilization, and renewable generation based on real-time price signals, improving energy cost management and resource scheduling. However, this study has limitations. The simulation was conducted under the climatic, economic, and demand conditions specific to northeastern Nigeria, which may restrict the generalizability of the findings. Additionally, static load profiles and fixed ToU tariffs were assumed, without incorporating real-time uncertainties or user behavior dynamics.
Future work will address these limitations by testing the model across multiple climatic regions and regulatory contexts; incorporating stochastic elements such as variable load profiles, renewable resource intermittency, and dynamic electricity pricing; and including performance indicators like renewable energy penetration, system reliability, and emission reduction.

Author Contributions

Conceptualization, data curation and methodology, B.M.; software, and validation, M.F.H. and S.Z.A.; formal analysis, investigation, and resources, B.M. and M.F.H.; writing—original draft preparation, writing—review and editing, and visualization, M.F.H., B.M. and S.Z.A. All authors have read and agreed to the published version of the manuscript.

Funding

The authors extend their appreciation to Prince Sattam Bin Abdulaziz University for funding this research work through the project number (PSAU/2024/01/28992).

Data Availability Statement

The data presented in this study are available on request from the corresponding author due to privacy policies.

Conflicts of Interest

The authors declare no conflicts of interest.

Nomenclature

B C C t Battery cycle count P t B A T D , C H Battery discharging power
BATBattery Q B A T Battery capacity
CSCuckoo search δ B A T , D S F Battery dissipation factor
D C t B A T Battery degradation cost S O S t State of charge of battery
ELZElectrolyzer S O C ¯ Minimum state of charge
GAGenetic algorithm S O C ¯ Maximum state of charge
GAMSGeneral algebraic modeling system η B A T , C H Battery charging efficiency
HSHarmony Search η B A T , D C H Battery discharging efficiency
MILPMix integer linear programming P r e l z Electrolyzer rating
MNLPMix non-linear programming P r f c Fuel cell rating
NSGA-IINon-dominated sorting GA P r h t Hydrogen tank rating
SOHState of hydrogen P r p v Photovoltaic rating
η i n v Inverter efficiency P r w t Wind turbine rating
N H T Number of hydrogen tanks P p v Photovoltaic power
P m a x B A T Maximum battery powerPSOParticle swarm optimization
P i n v o u t Inverter output power P s t o r a g e Power storage
P b a t m a x Maximum battery powerPVPhotovoltaic
P T L Total load P w t Wind turbine power
∆tTime stepSoCState of charge
η F C Fuel cell efficiency S o C m a x Maximum state of charge
η H S T Hydrogen tank efficiency S o C m i n Minimum state of charge
E H S T Hydrogen stored energy T n o c t Operating cell temperature
P E T H Electrolyzer output powerVSpeed
P G Grid power V c u t i n Cut in speed
P t B T , C H Battery charging power V c u t o u t Cut out speed
P H T F C Power from HT to FC V R a t e d Rated speed

References

  1. Espoir, D.K.; Sunge, R.; Bannor, F. Economic growth, renewable and nonrenewable electricity consumption: Fresh evidence from a panel sample of African countries. Energy Nexus 2023, 9, 100165. [Google Scholar] [CrossRef]
  2. Wankouo Ngouleu, C.A.; Koholé, Y.W.; Fohagui, F.C.V.; Tchuen, G. Optimal sizing and techno-enviro-economic evaluation of a hybrid photovoltaic/wind/diesel system with battery and fuel cell storage devices under different climatic conditions in Cameroon. J. Clean. Prod. 2023, 423, 138753. [Google Scholar] [CrossRef]
  3. Hamza, M.F.; Modu, B. A bibliometric analysis on renewable energy microgrids integrating hydrogen storage: Strategies for optimal sizing and energy management. Sci. Afr. 2025, 27, e02609. [Google Scholar] [CrossRef]
  4. Aliyu, A.K.; Modu, B.; Tan, C.W. A review of renewable energy development in Africa: A focus in South Africa, Egypt and Nigeria. Renew. Sustain. Energy Rev. 2018, 81, 2502–2518. [Google Scholar] [CrossRef]
  5. Al-Sharafi, A.; Sahin, A.Z.; Ayar, T.; Yilbas, B.S. Techno-economic analysis and optimization of solar and wind energy systems for power generation and hydrogen production in Saudi Arabia. Renew. Sustain. Energy Rev. 2017, 69, 33–49. [Google Scholar] [CrossRef]
  6. Wankouo Ngouleu, C.A.; Koholé, Y.W.; Fohagui, F.C.V.; Tchuen, G. Techno-economic analysis and optimal sizing of a battery-based and hydrogen-based standalone photovoltaic/wind hybrid system for rural electrification in Cameroon based on meta-heuristic techniques. Energy Convers. Manag. 2023, 280, 116794. [Google Scholar] [CrossRef]
  7. Samy, M.; Barakat, S.; Ramadan, H. A flower pollination optimization algorithm for an off-grid PV-Fuel cell hybrid renewable system. Int. J. Hydrogen Energy 2019, 44, 2141–2152. [Google Scholar] [CrossRef]
  8. Argyrou, M.C.; Christodoulides, P.; Kalogirou, S.A. Energy storage for electricity generation and related processes: Technologies appraisal and grid scale applications. Renew. Sustain. Energy Rev. 2018, 94, 804–821. [Google Scholar] [CrossRef]
  9. Li, Y.; Shang, Z.; Peng, F.; Zhao, Y.; Ren, L. Improved control-oriented polarization characteristic modeling for proton exchange membrane water electrolyzer with adaptive hunting game based metaheuristic optimization. Energy Convers. Manag. 2024, 305, 118264. [Google Scholar] [CrossRef]
  10. Müller, L.A.; Leonard, A.; Trotter, P.A.; Hirmer, S. Green hydrogen production and use in low- and middle-income countries: A least-cost geospatial modelling approach applied to Kenya. Appl. Energy 2023, 343, 121219. [Google Scholar] [CrossRef]
  11. Elkadeem, M.; Kotb, K.M.; Ullah, Z.; Atiya, E.G.; Dán, A.; Wang, S. A two-stage multi-attribute analysis method for city-integrated hybrid mini-grid design. Sustain. Cities Soc. 2021, 65, 102603. [Google Scholar] [CrossRef]
  12. Modu, B.; Abdullah, M.P.; Alkassem, A.; Hamza, M.F. Optimal rule-based energy management and sizing of a grid-connected renewable energy microgrid with hybrid storage using Levy Flight Algorithm. Energy Nexus 2024, 16, 100333. [Google Scholar] [CrossRef]
  13. Modu, B.; Abdullah, M.P.; Alkassem, A.; Bukar, A.L.; Zainal, N.H. Operational Strategy of a Hybrid Renewable Energy System With Hydrogen-Battery Storage for Optimal Performance Using Levy Flight Algorithm. In Proceedings of the 2023 IEEE Conference on Energy Conversion (CENCON), Kuching, Malaysia, 23–24 October 2023; pp. 35–40. [Google Scholar]
  14. Modu, B.; Abdullah, M.P.; AlKassem, A.; Hamza, M.F.; Bukar, A.L. The role of hybrid hydrogen-battery storage in a grid-connected renewable energy microgrid considering time-of-use electricity tariffs. J. Energy Storage 2025, 105, 114729. [Google Scholar] [CrossRef]
  15. Modu, B.; Abdullah, M.P.; Bukar, A.L.; Hamza, M.F.; Adewolu, M.S. Operational strategy and capacity optimization of standalone solar-wind-biomass-fuel cell energy system using hybrid LF-SSA algorithms. Int. J. Hydrogen Energy 2024, 50, 92–106. [Google Scholar] [CrossRef]
  16. Bukar, A.L.; Tan, C.W.; Yiew, L.K.; Ayop, R.; Tan, W.-S. A rule-based energy management scheme for long-term optimal capacity planning of grid-independent microgrid optimized by multi-objective grasshopper optimization algorithm. Energy Convers. Manag. 2020, 221, 113161. [Google Scholar] [CrossRef]
  17. Mahmoudi, S.M.; Maleki, A.; Ochbelagh, D.R. Optimization of a hybrid energy system with/without considering back-up system by a new technique based on fuzzy logic controller. Energy Convers. Manag. 2021, 229, 113723. [Google Scholar] [CrossRef]
  18. Moafi, M.; Ardeshiri, R.R.; Mudiyanselage, M.W.; Marzband, M.; Abusorrah, A.; Rawa, M.; Guerrero, J.M. Optimal coalition formation and maximum profit allocation for distributed energy resources in smart grids based on cooperative game theory. Int. J. Electr. Power Energy Syst. 2023, 144, 108492. [Google Scholar] [CrossRef]
  19. Petrucci, A.; Barone, G.; Buonomano, A.; Athienitis, A. Modelling of a multi-stage energy management control routine for energy demand forecasting, flexibility, and optimization of smart communities using a Recurrent Neural Network. Energy Convers. Manag. 2022, 268, 115995. [Google Scholar] [CrossRef]
  20. Samy, M.; Almamlook, R.E.; Elkhouly, H.I.; Barakat, S. Decision-making and optimal design of green energy system based on statistical methods and artificial neural network approaches. Sustain. Cities Soc. 2022, 84, 104015. [Google Scholar] [CrossRef]
  21. Güven, A.F.; Yörükeren, N.; Samy, M.M. Design optimization of a stand-alone green energy system of university campus based on Jaya-Harmony Search and Ant Colony Optimization algorithms approaches. Energy 2022, 253, 124089. [Google Scholar] [CrossRef]
  22. Mokhtara, C.; Negrou, B.; Settou, N.; Bouferrouk, A.; Yao, Y. Design optimization of grid-connected PV-Hydrogen for energy prosumers considering sector-coupling paradigm: Case study of a university building in Algeria. Int. J. Hydrogen Energy 2021, 46, 37564–37582. [Google Scholar] [CrossRef]
  23. Alshammari, N.; Asumadu, J. Optimum unit sizing of hybrid renewable energy system utilizing harmony search, Jaya and particle swarm optimization algorithms. Sustain. Cities Soc. 2020, 60, 102255. [Google Scholar] [CrossRef]
  24. Djouahi, A.; Negrou, B.; Rouabah, B.; Mahboub, A.; Samy, M.M. Optimal sizing of battery and super-capacitor based on the MOPSO technique via a new FC-HEV application. Energies 2023, 16, 3902. [Google Scholar] [CrossRef]
  25. Djouahi, A.; Negrou, B.; Touggui, Y.; Samy, M.M. Optimal sizing and thermal control in a fuel cell hybrid electric vehicle via FC-HEV application. J. Braz. Soc. Mech. Sci. Eng. 2023, 45, 533. [Google Scholar] [CrossRef]
  26. Koholé, Y.W.; Fohagui, F.C.V.; Wankouo Ngouleu, C.A.; Tchuen, G. An effective sizing and sensitivity analysis of a hybrid renewable energy system for household, multi-media and rural healthcare centres power supply: A case study of Kaele, Cameroon. Int. J. Hydrogen Energy 2024, 49, 1321–1359. [Google Scholar] [CrossRef]
  27. Bukar, A.L.; Tan, C.W.; Lau, K.Y. Optimal sizing of an autonomous photovoltaic/wind/battery/diesel generator microgrid using grasshopper optimization algorithm. Sol. Energy 2019, 188, 685–696. [Google Scholar] [CrossRef]
  28. Bakht, M.P.; Salam, Z.; Gul, M.; Anjum, W.; Kamaruddin, M.A.; Khan, N.; Bukar, A.L. The Potential Role of Hybrid Renewable Energy System for Grid Intermittency Problem: A Techno-Economic Optimisation and Comparative Analysis. Sustainability 2022, 14, 14045. [Google Scholar] [CrossRef]
  29. Babatunde, O.M.; Munda, J.L.; Hamam, Y. Hybridized off-grid fuel cell/wind/solar PV/battery for energy generation in a small household: A multi-criteria perspective. Int. J. Hydrogen Energy 2022, 47, 6437–6452. [Google Scholar] [CrossRef]
  30. Babatunde, O.M.; Munda, J.L.; Hamam, Y. Off-grid hybrid photovoltaic—Micro wind turbine renewable energy system with hydrogen and battery storage: Effects of sun tracking technologies. Energy Convers. Manag. 2022, 255, 115335. [Google Scholar] [CrossRef]
  31. Martsinchyk, K.; Martsinchyk, A.; Łazor, M.; Shuhayeu, P.; Kupecki, J.; Niemczyk, A.; Błesznowski, M.; Milewski, J. Feasibility study and techno-economic assessment of power-to-gas (P2G) technology based on solid oxide electrolysis (SOE). J. Environ. Manag. 2024, 354, 120425. [Google Scholar] [CrossRef]
  32. Ren, Y.; Jin, K.; Gong, C.; Hu, J.; Liu, D.; Jing, X.; Zhang, K. Modelling and capacity allocation optimization of a combined pumped storage/wind/photovoltaic/hydrogen production system based on the consumption of surplus wind and photovoltaics and reduction of hydrogen production cost. Energy Convers. Manag. 2023, 296, 117662. [Google Scholar] [CrossRef]
  33. Ghaem Sigarchian, S.; Malmquist, A.; Martin, V. Design optimization of a small-scale polygeneration energy system in different climate zones in Iran. Energies 2018, 11, 1115. [Google Scholar] [CrossRef]
  34. Guo, E.; He, B.; Zhang, J. Effects of photovoltaic panel type on optimum sizing of an electrical energy storage system using a stochastic optimization approach. J. Energy Storage 2023, 72, 108581. [Google Scholar] [CrossRef]
  35. El Hassani, S.; Oueslati, F.; Horma, O.; Santana, D.; Moussaoui, M.A.; Mezrhab, A. Techno-economic feasibility and performance analysis of an islanded hybrid renewable energy system with hydrogen storage in Morocco. J. Energy Storage 2023, 68, 107853. [Google Scholar] [CrossRef]
  36. Awan, A.B.; Zubair, M.; Sidhu, G.A.S.; Bhatti, A.R.; Abo-Khalil, A.G. Performance analysis of various hybrid renewable energy systems using battery, hydrogen, and pumped hydro-based storage units. Int. J. Energy Res. 2019, 43, 6296–6321. [Google Scholar] [CrossRef]
  37. Le, T.S.; Nguyen, T.N.; Bui, D.-K.; Ngo, T.D. Optimal sizing of renewable energy storage: A techno-economic analysis of hydrogen, battery and hybrid systems considering degradation and seasonal storage. Appl. Energy 2023, 336, 120817. [Google Scholar] [CrossRef]
  38. Mellouk, L.; Ghazi, M.; Aaroud, A.; Boulmalf, M.; Benhaddou, D.; Zine-Dine, K. Design and energy management optimization for hybrid renewable energy system- case study: Laayoune region. Renew. Energy 2019, 139, 621–634. [Google Scholar] [CrossRef]
  39. Restrepo, M.; Cañizares, C.A.; Simpson-Porco, J.W.; Su, P.; Taruc, J. Optimization- and Rule-based Energy Management Systems at the Canadian Renewable Energy Laboratory microgrid facility. Appl. Energy 2021, 290, 116760. [Google Scholar] [CrossRef]
  40. Mohandes, B.; Wahbah, M.; Moursi, M.S.E.; El-Fouly, T.H.M. Renewable Energy Management System: Optimum Design and Hourly Dispatch. IEEE Trans. Sustain. Energy 2021, 12, 1615–1628. [Google Scholar] [CrossRef]
  41. Alzahrani, A. Energy Management and Optimization of a Standalone Renewable Energy System in Rural Areas of the Najran Province. Sustainability 2023, 15, 8020. [Google Scholar] [CrossRef]
  42. Tran, H.G.; Ton-That, L.; Thao, N.G.M. Lagrange Multiplier-Based Optimization for Hybrid Energy Management System with Renewable Energy Sources and Electric Vehicles. Electronics 2023, 12, 4513. [Google Scholar] [CrossRef]
  43. Torkan, R.; Ilinca, A.; Ghorbanzadeh, M. A genetic algorithm optimization approach for smart energy management of microgrids. Renew. Energy 2022, 197, 852–863. [Google Scholar] [CrossRef]
  44. Barukčić, M.; Varga, T.; Benšić, T.; Jerković Štil, V. Optimal Allocation of Renewable Energy Sources and Battery Storage Systems Considering Energy Management System Optimization Based on Fuzzy Inference. Energies 2022, 15, 6884. [Google Scholar] [CrossRef]
  45. Rao, C.K.; Sahoo, S.K.; Yanine, F.F. Intelligent power management system for optimizing load strategies in renewable generation. Electr. Eng. 2025, 107, 3039–3061. [Google Scholar] [CrossRef]
  46. Zeng, J.; Wang, Q.; Liu, J.; Chen, J.; Chen, H. A Potential Game Approach to Distributed Operational Optimization for Microgrid Energy Management With Renewable Energy and Demand Response. IEEE Trans. Ind. Electron. 2019, 66, 4479–4489. [Google Scholar] [CrossRef]
  47. Fernandez, E.; Hossain, M.J.; Mahmud, K.; Nizami, M.S.H.; Kashif, M. A Bi-level optimization-based community energy management system for optimal energy sharing and trading among peers. J. Clean. Prod. 2021, 279, 123254. [Google Scholar] [CrossRef]
  48. Maleki, A.; Pourfayaz, F.; Ahmadi, M.H. Design of a cost-effective wind/photovoltaic/hydrogen energy system for supplying a desalination unit by a heuristic approach. Sol. Energy 2016, 139, 666–675. [Google Scholar] [CrossRef]
  49. Singh, A.; Baredar, P. Techno-economic assessment of a solar PV, fuel cell, and biomass gasifier hybrid energy system. Energy Rep. 2016, 2, 254–260. [Google Scholar] [CrossRef]
  50. Hosseinalizadeh, R.; Shakouri, H.; Amalnick, M.S.; Taghipour, P. Economic sizing of a hybrid (PV–WT–FC) renewable energy system (HRES) for stand-alone usages by an optimization-simulation model: Case study of Iran. Renew. Sustain. Energy Rev. 2016, 54, 139–150. [Google Scholar] [CrossRef]
  51. Singh, A.; Baredar, P.; Gupta, B. Techno-economic feasibility analysis of hydrogen fuel cell and solar photovoltaic hybrid renewable energy system for academic research building. Energy Convers. Manag. 2017, 145, 398–414. [Google Scholar] [CrossRef]
  52. Maleki, A. Design and optimization of autonomous solar-wind-reverse osmosis desalination systems coupling battery and hydrogen energy storage by an improved bee algorithm. Desalination 2018, 435, 221–234. [Google Scholar] [CrossRef]
  53. Khan, F.A.; Pal, N.; Saeed, S.H. Review of solar photovoltaic and wind hybrid energy systems for sizing strategies optimization techniques and cost analysis methodologies. Renew. Sustain. Energy Rev. 2018, 92, 937–947. [Google Scholar] [CrossRef]
  54. Ramli, M.A.M.; Bouchekara, H.R.E.H.; Alghamdi, A.S. Optimal sizing of PV/wind/diesel hybrid microgrid system using multi-objective self-adaptive differential evolution algorithm. Renew. Energy 2018, 121, 400–411. [Google Scholar] [CrossRef]
  55. Felseghi, R.-A.; Carcadea, E.; Raboaca, M.S.; Trufin, C.N.; Filote, C. Hydrogen fuel cell technology for the sustainable future of stationary applications. Energies 2019, 12, 4593. [Google Scholar] [CrossRef]
  56. Kaur, M.; Pal, K. Review on hydrogen storage materials and methods from an electrochemical viewpoint. J. Energy Storage 2019, 23, 234–249. [Google Scholar] [CrossRef]
  57. Luta, D.N.; Raji, A.K. Optimal sizing of hybrid fuel cell-supercapacitor storage system for off-grid renewable applications. Energy 2019, 166, 530–540. [Google Scholar] [CrossRef]
  58. Ghenai, C.; Bettayeb, M. Modelling and performance analysis of a stand-alone hybrid solar PV/Fuel Cell/Diesel Generator power system for university building. Energy 2019, 171, 180–189. [Google Scholar] [CrossRef]
  59. Xu, C.; Ke, Y.; Li, Y.; Chu, H.; Wu, Y. Data-driven configuration optimization of an off-grid wind/PV/hydrogen system based on modified NSGA-II and CRITIC-TOPSIS. Energy Convers. Manag. 2020, 215, 112892. [Google Scholar] [CrossRef]
  60. Ghenai, C.; Salameh, T.; Merabet, A. Technico-economic analysis of off grid solar PV/Fuel cell energy system for residential community in desert region. Int. J. Hydrogen Energy 2020, 45, 11460–11470. [Google Scholar] [CrossRef]
  61. Samy, M.M.; Barakat, S.; Ramadan, H.S. Techno-economic analysis for rustic electrification in Egypt using multi-source renewable energy based on PV/wind/FC. Int. J. Hydrogen Energy 2020, 45, 11471–11483. [Google Scholar] [CrossRef]
  62. Hakimi, S.M.; Hasankhani, A.; Shafie-khah, M.; Catalão, J.P.S. Optimal sizing and siting of smart microgrid components under high renewables penetration considering demand response. IET Renew. Power Gener. 2019, 13, 1809–1822. [Google Scholar] [CrossRef]
  63. Samy, M.M.; Sarhan, H.H.; Barakat, S.; Al-Ghamdi, S.A. A Hybrid PV-Biomass Generation Based Micro-Grid for the Irrigation System of a Major Land Reclamation Project in Kingdom of Saudi Arabia (KSA)—Case Study of Albaha Area. In Proceedings of the 2018 IEEE International Conference on Environment and Electrical Engineering and 2018 IEEE Industrial and Commercial Power Systems Europe (EEEIC/I&CPS Europe), Palermo, Italy, 12–15 June 2018; pp. 1–8. [Google Scholar]
  64. Bukar, A.L.; Chaitusaney, S.; Kawabe, K. Optimal energy management and techno-economic assessment of hydrogen energy production system incorporated with photovoltaic and battery storage. Int. J. Hydrogen Energy 2024, 62, 1139–1153. [Google Scholar] [CrossRef]
  65. Abdulkadir, M.; Bukar, A.; Modu, B. Mppt-based control algorithm for PV system using iteration-PSO under irregular shadow conditions. Arid Zone J. Eng.-Technol. Environ. 2017, 13, 97–110. [Google Scholar]
  66. Modu, B.; Abdullah, M.P.B.; Alkassem, A.; Garni, H.Z.A.; Alkabi, M. Optimal Design of a Grid-Independent Solar-Fuel Cell-Biomass Energy System Using an Enhanced Salp Swarm Algorithm Considering Rule-Based Energy Management Strategy. IEEE Access 2024, 12, 23914–23929. [Google Scholar] [CrossRef]
  67. Koholé, Y.W.; Fohagui, F.C.V.; Djiela, R.H.T.; Tchuen, G. Wind energy potential assessment for co-generation of electricity and hydrogen in the far North region of Cameroon. Energy Convers. Manag. 2023, 279, 116765. [Google Scholar] [CrossRef]
  68. Modu, B.; Abdullah, M.P.; Bukar, A.L.; Hamza, M.F. A systematic review of hybrid renewable energy systems with hydrogen storage: Sizing, optimization, and energy management strategy. Int. J. Hydrogen Energy 2023, 48, 38354–38373. [Google Scholar] [CrossRef]
  69. Modu, B.; Abdullah, M.P.; Bukar, A.L.; Hamza, M.F.; Adewolu, M.S. Energy management and capacity planning of photovoltaic-wind-biomass energy system considering hydrogen-battery storage. J. Energy Storage 2023, 73, 109294. [Google Scholar] [CrossRef]
  70. Yousri, D.; Farag, H.E.Z.; Zeineldin, H.; El-Saadany, E.F. Integrated model for optimal energy management and demand response of microgrids considering hybrid hydrogen-battery storage systems. Energy Convers. Manag. 2023, 280, 116809. [Google Scholar] [CrossRef]
  71. Trifkovic, M.; Sheikhzadeh, M.; Nigim, K.; Daoutidis, P. Modeling and control of a renewable hybrid energy system with hydrogen storage. IEEE Trans. Control Syst. Technol. 2013, 22, 169–179. [Google Scholar] [CrossRef]
  72. Yodwong, B.; Guilbert, D.; Phattanasak, M.; Kaewmanee, W.; Hinaje, M.; Vitale, G. Faraday’s efficiency modeling of a proton exchange membrane electrolyzer based on experimental data. Energies 2020, 13, 4792. [Google Scholar] [CrossRef]
  73. Sun, H.; Ebadi, A.G.; Toughani, M.; Nowdeh, S.A.; Naderipour, A.; Abdullah, A. Designing framework of hybrid photovoltaic-biowaste energy system with hydrogen storage considering economic and technical indices using whale optimization algorithm. Energy 2022, 238, 121555. [Google Scholar] [CrossRef]
  74. Armijo, J.; Philibert, C. Flexible production of green hydrogen and ammonia from variable solar and wind energy: Case study of Chile and Argentina. Int. J. Hydrogen Energy 2020, 45, 1541–1558. [Google Scholar] [CrossRef]
  75. Bukar, A.L.; Chaitusaney, S.; Kawabe, K. Optimal design of on-site PV-based battery grid-tied green hydrogen production system. Energy Convers. Manag. 2024, 307, 118378. [Google Scholar] [CrossRef]
  76. Khishe, M.; Mosavi, M.R. Chimp optimization algorithm. Expert Syst. Appl. 2020, 149, 113338. [Google Scholar] [CrossRef]
  77. Khishe, M.; Nezhadshahbodaghi, M.; Mosavi, M.R.; Martín, D. A Weighted Chimp Optimization Algorithm. IEEE Access 2021, 9, 158508–158539. [Google Scholar] [CrossRef]
Figure 1. Representation of the proposed microgrid.
Electronics 14 02037 g001
Figure 2. The search (first stage of hunting) and exploitation (second stage of hunting) [77].
Electronics 14 02037 g002
Figure 3. Flowchart of the Chimp Optimization Algorithm.
Electronics 14 02037 g003
Figure 4. (a) Solar radiation, (b) ambient temperature, (c) wind speed, and (d) load demand.
Electronics 14 02037 g004
Figure 5. Annual component cost.
Electronics 14 02037 g005
Figure 6. Summarized overall ASC for all the components in the MG.
Electronics 14 02037 g006
Figure 7. Power generation by each component in the MG.
Electronics 14 02037 g007
Figure 8. Average monthly energy balance over one year.
Electronics 14 02037 g008
Figure 9. Combine microgrid generation and load demand: (a) annual, (b) weekly.
Electronics 14 02037 g009
Figure 10. Weekly energy generation analysis: (a) without grid support, (b) without grid showing EL output, (c) with grid support scenario.
Electronics 14 02037 g010
Figure 11. Weekly energy generation mix versus BAT SoC.
Electronics 14 02037 g011
Figure 12. Weekly energy trades: (a) grid purchase (off-peak), (b) grid purchase (peak-time), (c) grid sold (off-peak), (d) grid sold (peak-time).
Electronics 14 02037 g012aElectronics 14 02037 g012b
Table 1. Summary of previous studies conducted by various authors.
S/NRef.YearCitationsScope and Constraint
1[48]2016227The study did not account for sensitivity analysis on key metric variations, including component costs, efficiency rates, and weather fluctuations.
2[49]2016138There is provision to view, alter, or introduce a mathematical model (black box) in HOMER.
3[50]2016321The financial analysis relies on specific cost assumptions that may not be universally applicable and could vary over time.
4[51]2017272The study employs a specific load demand model, which does not account for variations and uncertainties in real-world energy consumption.
5[52]2018297The study’s fundamental assumptions did not account for metrics like maintenance costs, component degradation, and fluctuations in energy costs.
6[53]2018237The approaches for assessing reliability and evaluating costs, which are essential for validating techno-economic feasibility, are not provided.
7[54]2018257There is provision to view, alter, or introduce a mathematical model (black box) in HOMER.
8[55]2019376Challenges related to the regulatory framework, energy policymakers, and potential stakeholders.
9[56]2019170Absence of a thorough comparative breakdown, with cost, accessibility, and environmental effects of the materials.
10[57]2019144There is no provision to view, alter, or introduce a mathematical model (black box) in HOMER.
11[58]2019214The reliability of the results can be affected by the assumptions made for the components, like effectiveness, degradation charges, and operational constraints.
12[59]2020333The optimization model does not account for fluctuations in load demand and renewable energy generation.
13[60]2020370Assuming a steady load demand might not accurately represent real-world fluctuations in residential energy consumption.
14[61]2020190Initial cost assumptions affect the economic assessment and funding options.
15[62]2021188The real-time application can be affected by the complexity of the algorithm.
Table 2. Nameplate specifications of the RE and storage components [15,16,64,65].
ComponentParametersValuesUnit
Photovoltaic (PV) P r p v at STC1kW
T n o c t 48 ± 2°C
T c o f 3.4 × 10 3 1/°C
η p v 16.9%
Wind turbine (WT) P r w t 1kW
v i n 2.5m/s
v o u t 20m/s
v r a t e d 9.5m/s
Electrolyser P r e l e 1kW
η e l e 75%
Hydrogen tank P r h t 1kg
Heating value39.72kWh/kg
Minimum pressure3bar
Maximum pressure28bar
Fuel cell P r f c 1kW
η f c 60%
Battery n 5Years
B c a p . 45.2kWh
DOD70%
S o C m a x / S o C m i n 80/20%
η b a t 0.85%
B c a p . ( s i n g l e ) 250Ah
Project   n 25Year
i n f 4%
Inverter η i n v 92%
Table 3. Chimp Optimization Algorithm (ChOA) pseudo-code.
1. Initialize Parameters:
Define the initial chimp population  x i   ( i = 1 ,   2 ,   ,   n ) .
S e t   c o n t r o l   p a r a m e t e r s   f , m , a ,   a n d   c {where fm = the movement coefficient representing the impact factor of each chimp in the search process; a = the convergence parameter controlling exploration and exploitation balance; c = the influence coefficient simulating the social behavior in the hunt.}
Compute the initial position for all the chimp agent
Randomly divide the chimp population into independent groups
Until stopping condition is satisfied
2. Evaluate Initial Fitness:
Calculate the fitness of each chimp agent in the population.
Identify and assign roles:
X A t t a c k e r   = B e s t   s o l u t i o n   ( h i g h e s t   f i t n e s s )
X C h a s e r   =  Second − best solution
X B a r r i e r   =  Third − best solution.
X D r i v e r   = F o u r t h b e s t   s o l u t i o n
3. Begin Iterations:
w h i l e   ( t < m a x i m u m   n u m b e r   o f   i t e r a t i o n s )
Repeat until a stopping condition (e.g., max iterations) is met
For each chimp, determine its group membership.
Update f , m ,   a n d   c using group approach,
Compute a and d using f , m ,   a n d   c
end for
for individually search chimp
i f   µ < 0.5
i f   a < 1
Update the location of the present search agent
e l s e   i f   a > 1
Pick arbitrary search agent
end if
e l s e   i f   µ 0.5
Update the location of the present search
end if
end for
Update f, m, a, and c
Update X A t t a c k e r , X C h a s e r , X B a r r i e r and X D r i v e r
t = t + 1
4. Return Results:
output  X A t t a c k e r , the best solution found, as the final result.
Table 4. The specific parameter settings of the algorithms.
AlgorithmPopulationNumber of IterationsAdditional Parameters
ChOAn = 40T = 100Distribution index β = 1.5; λ = 1; coefficient of social force α = 1; control parameter for flexibility μ = 1
SSAn = 40T = 100Step size control factor a = 0.01
GAn = 40T = 100Crossover distribution index: 20; mutation index: 20; crossover probability: 0.8; mutation probability: 0.2
GWOn = 40T = 100Alpha, beta, and delta coefficients; the wolf chasing approach directed by alpha
Table 5. Optimum result obtained from the three benchmarked algorithms.
Optimization MethodPV (kW)WT (kW)BAT (kWh) N H T ELZ (kW)FC (kW)COE ($)ASC ($)
ChOA13604621641385713810.272544,422
SSA13635421671415744110.275544,834
GA13565541661395724070.274544,612
GWO13585461652395724090.276545,130
Disclaimer/Publisher’s Note: The statements, opinions and data contained in all publications are solely those of the individual author(s) and contributor(s) and not of MDPI and/or the editor(s). MDPI and/or the editor(s) disclaim responsibility for any injury to people or property resulting from any ideas, methods, instructions or products referred to in the content.

