Article

Improvement of Mask R-CNN Algorithm for Ore Segmentation

1
College of Information Engineering, Dalian Ocean University, Dalian 116024, China
2
College of Marine Engineering, Dalian University of Technology, Dalian 116024, China
*
Author to whom correspondence should be addressed.
Electronics 2025, 14(10), 2025; https://doi.org/10.3390/electronics14102025
Submission received: 31 March 2025 / Revised: 10 May 2025 / Accepted: 14 May 2025 / Published: 16 May 2025

Abstract

:
In response to the low precision of ore image segmentation under complex working conditions, an improved Mask R-CNN segmentation algorithm is proposed. The traditional Mask R-CNN uses a simple deconvolution operation to generate masks, which can lead to the loss of ore edge information and insufficient detail processing, affecting segmentation accuracy. Therefore, an improved model based on the Mask R-CNN framework is proposed in this paper. By introducing the Re-parameterized Refocus Convolution (RefConv) into the residual networks, the expressive power of the feature extraction network is enhanced. Meanwhile, the Efficient Channel Attention (ECA) is embedded in the output part of the Feature Pyramid Network (FPN), enhancing the model’s ability to capture key information. The improved Mask R-CNN network structure can reduce the loss of ore detail information caused by convolution operations and improve the network’s segmentation accuracy. Comparative experiments between the improved algorithm and the original algorithm show that the average Intersection over Union (MIoU) of the improved algorithm reached 92.8%, which is about a 6.8% increase compared to the original Mask R-CNN algorithm; the average pixel accuracy (mAP) is 97.2%, which is about a 5.1% increase compared to the original algorithm, indicating higher detection accuracy for ore identification and segmentation.

1. Introduction

Ore resource detection faces many challenges, including diverse ore morphologies, complex background environments, and the limitations of traditional detection methods. Conventional ore detection techniques typically involve sampling, remote sensing, and high-resolution imaging [1]. Sampling allows for precise analysis of mineral morphology and accurate estimation of coverage and abundance. However, the number of samples is often limited, and the sampling process is costly. Remote sensing technology constructs models of ore coverage, particle size, and abundance by analyzing echo reflection signals. While it enables large-scale resource evaluation, it struggles to capture detailed information on individual ore morphology and distribution. In contrast, high-resolution image-based ore detection provides a more intuitive observation of mineral resource distribution and offers advantages such as high efficiency, accuracy, and cost-effectiveness [2].
With the rapid development of modern artificial intelligence and machine vision technology, many scholars have increasingly integrated high-quality mineral images with effective image processing algorithms to rapidly obtain mineral distribution information in mining areas [3,4]. In recent years, deep learning methods based on convolutional neural networks (CNN) have achieved significant progress in image segmentation, particularly in object detection. Object detection algorithms are generally categorized into one-stage and two-stage methods. One-stage algorithms, such as YOLO [5] and RetinaNet [6], perform end-to-end object detection using a single convolutional neural network. In contrast, two-stage object detection first generates candidate regions through methods such as selective search or region proposal networks (RPN), followed by classification and localization. Compared to one-stage algorithms, two-stage methods offer higher detection accuracy and are more advantageous in fine segmentation tasks. Representative algorithms include R-CNN [7] and Faster R-CNN [8]. Mask R-CNN, proposed by Kaiming He et al. [9], extends Faster R-CNN by introducing an additional parallel segmentation branch. In addition to retaining the classification and bounding box regression branches from Faster R-CNN, it generates segmentation masks for target objects, demonstrating superior performance in natural scene image segmentation [10,11].
This paper builds upon Mask R-CNN and introduces the RefConv to enhance ore detail representation, mitigating loss of fine-grained information during convolution operations. Additionally, the ECA is incorporated into the FPN layer, enabling the model to segment target regions more accurately, particularly when processing polymetallic nodules of varying scales and morphologies. The improved algorithm is compared with the original Mask R-CNN, and the experimental results show that the detection accuracy of the improved algorithm for ore identification and segmentation tasks has been significantly improved.
The main contributions of this paper are summarized as follows:
  • To address the challenge of low segmentation accuracy of ores in complex environments, we propose an improved segmentation algorithm based on Mask R-CNN. Experimental results demonstrate that the proposed algorithm outperforms existing methods in terms of accuracy and adaptability, providing effective support for ore detection and offering significant practical value.
  • We introduced the RefConv in the residual network, which optimizes the extraction of fine-grained details through group convolutions. This module enhances the capability of extracting local features when processing complex ore morphologies and mitigates the issue of detail loss caused by insufficient feature fusion in traditional convolution operations.
  • To improve the network’s performance in handling multi-scale objects, we incorporate the Efficient Channel Attention into the FPN layer. By dynamically adjusting the weights of each channel in the feature map, the network is guided to focus more effectively on critical features.
The remainder of this paper is organized as follows: Section 2 provides a detailed description of the proposed algorithm. Section 3 presents and compares the experimental results, and Section 4 concludes the paper.

2. Methods

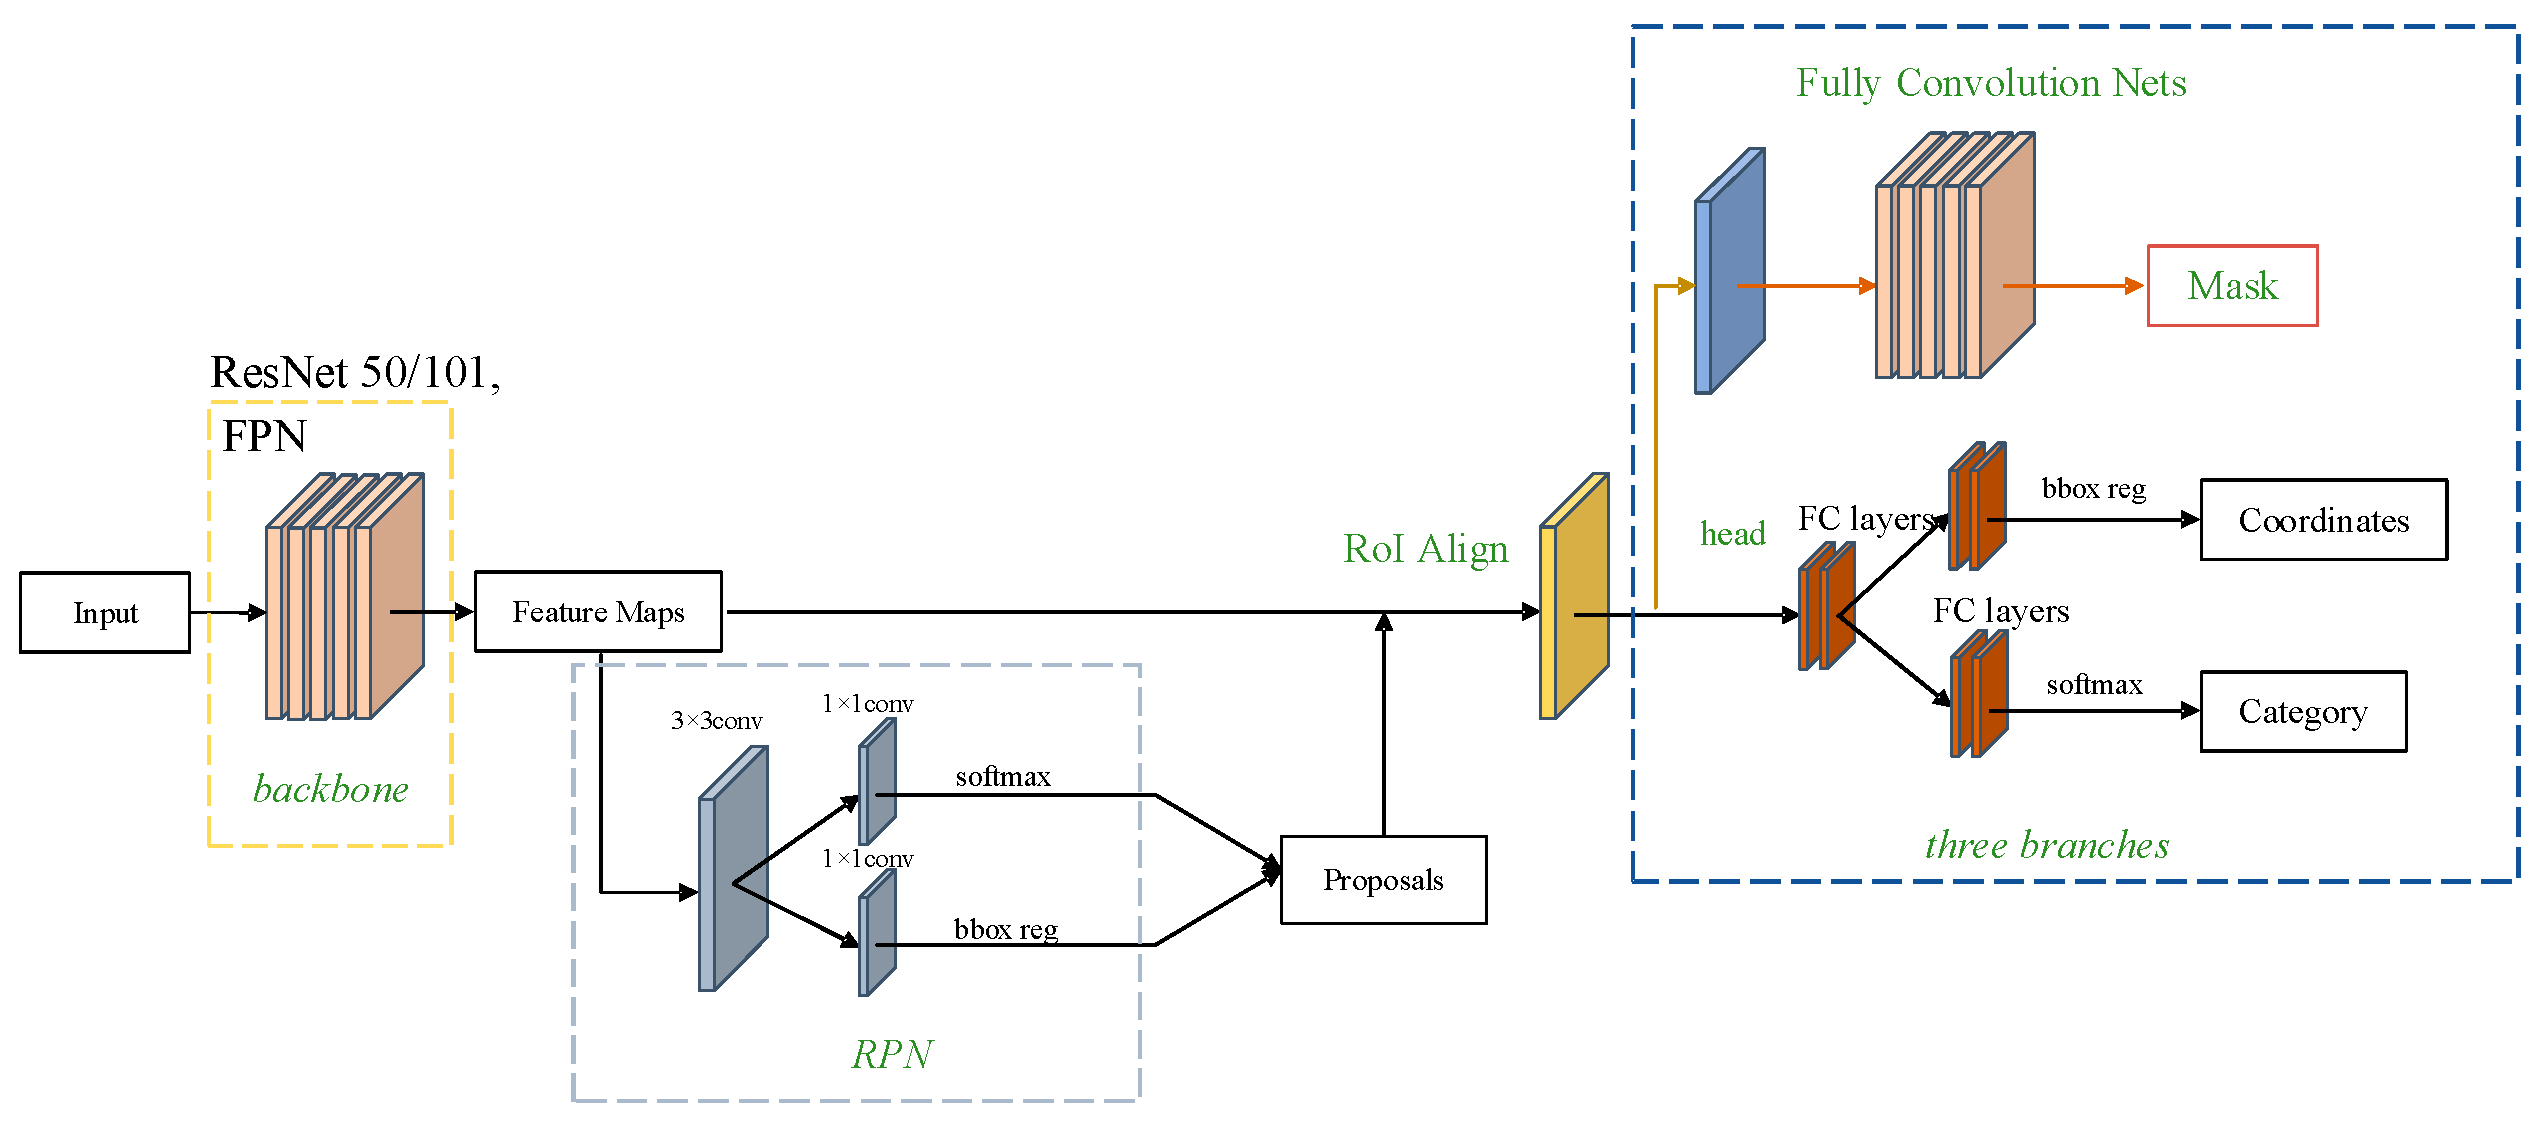
2.1. Mask R-CNN Network Model

Mask R-CNN is a deep learning model that combines object detection and instance segmentation. It expands on Faster R-CNN by adding a parallel branch for predicting target masks. Its network structure mainly consists of four parts: the main feature extraction network (backbone), the Region Proposal Network (RPN), the Region Pooling layer (ROI Align), and the prediction branch network. It can effectively complete tasks such as target segmentation, target classification, and boundary regression. The network structure is shown in Figure 1.
The feature extraction network mainly uses a series of convolutional layers such as GoogLeNet [12], VGG16 [13], and ResNet [14], to extract image feature maps. Among them, the ResNet network is more commonly used. Unlike fully connected networks, it uses cross-layer residual connections to directly insert skip connections between inputs and outputs, thus achieving an organic combination of low-level geometric information and high-level semantic information, which can further expand the depth of the network. This paper mainly uses ResNet50. The Feature Pyramid Network [15] is used for feature fusion, extracting features from feature maps of different scales. Together with ResNet, it forms the main network. The upper feature layer is upsampled to the same size as the next feature layer, and then they are added to obtain a new feature layer.
By performing multiple convolutional operations on each feature map, and combining them with predefined anchors, the Region Proposal Network performs box regression operations on each anchor to predict boundaries and obtain candidate boxes and predict categories. Then, Non-Maximum Suppression [16] is used to filter the candidate boxes to obtain the most suitable ones.
When the sizes of the candidate boxes generated by the Region Proposal Network is uncertain, ROIPooling is used on the feature map to perform maximum pooling with nearest-neighbor interpolation, outputting a feature map of consistent size. In Mask-RCNN, to solve the problem of the two quantization errors introduced in the ROIPooling operation, ROIAlign is used instead of ROIPooling, changing the nearest-neighbor interpolation to bilinear interpolation. The output of the ROIAlign module is a 7 × 7 feature map, which is further processed by the prediction network to generate the predicted mask.

2.2. Improved Mask R-CNN Network Model

With the rapid development of deep learning technology, Mask R-CNN has achieved significant results in object detection and instance segmentation tasks. By adding a parallel segmentation branch into Faster R-CNN, it can achieve precise object detection and pixel-level segmentation. However, the existing Mask R-CNN framework still has certain limitations when dealing with complex scenes and multi-scale targets, especially in capturing detailed information, segmenting ores of different scales, and adapting to complex backgrounds [17]. Therefore, to address these challenges, this paper proposes an improved Mask R-CNN network model designed to enhance its performance in ore image segmentation tasks.

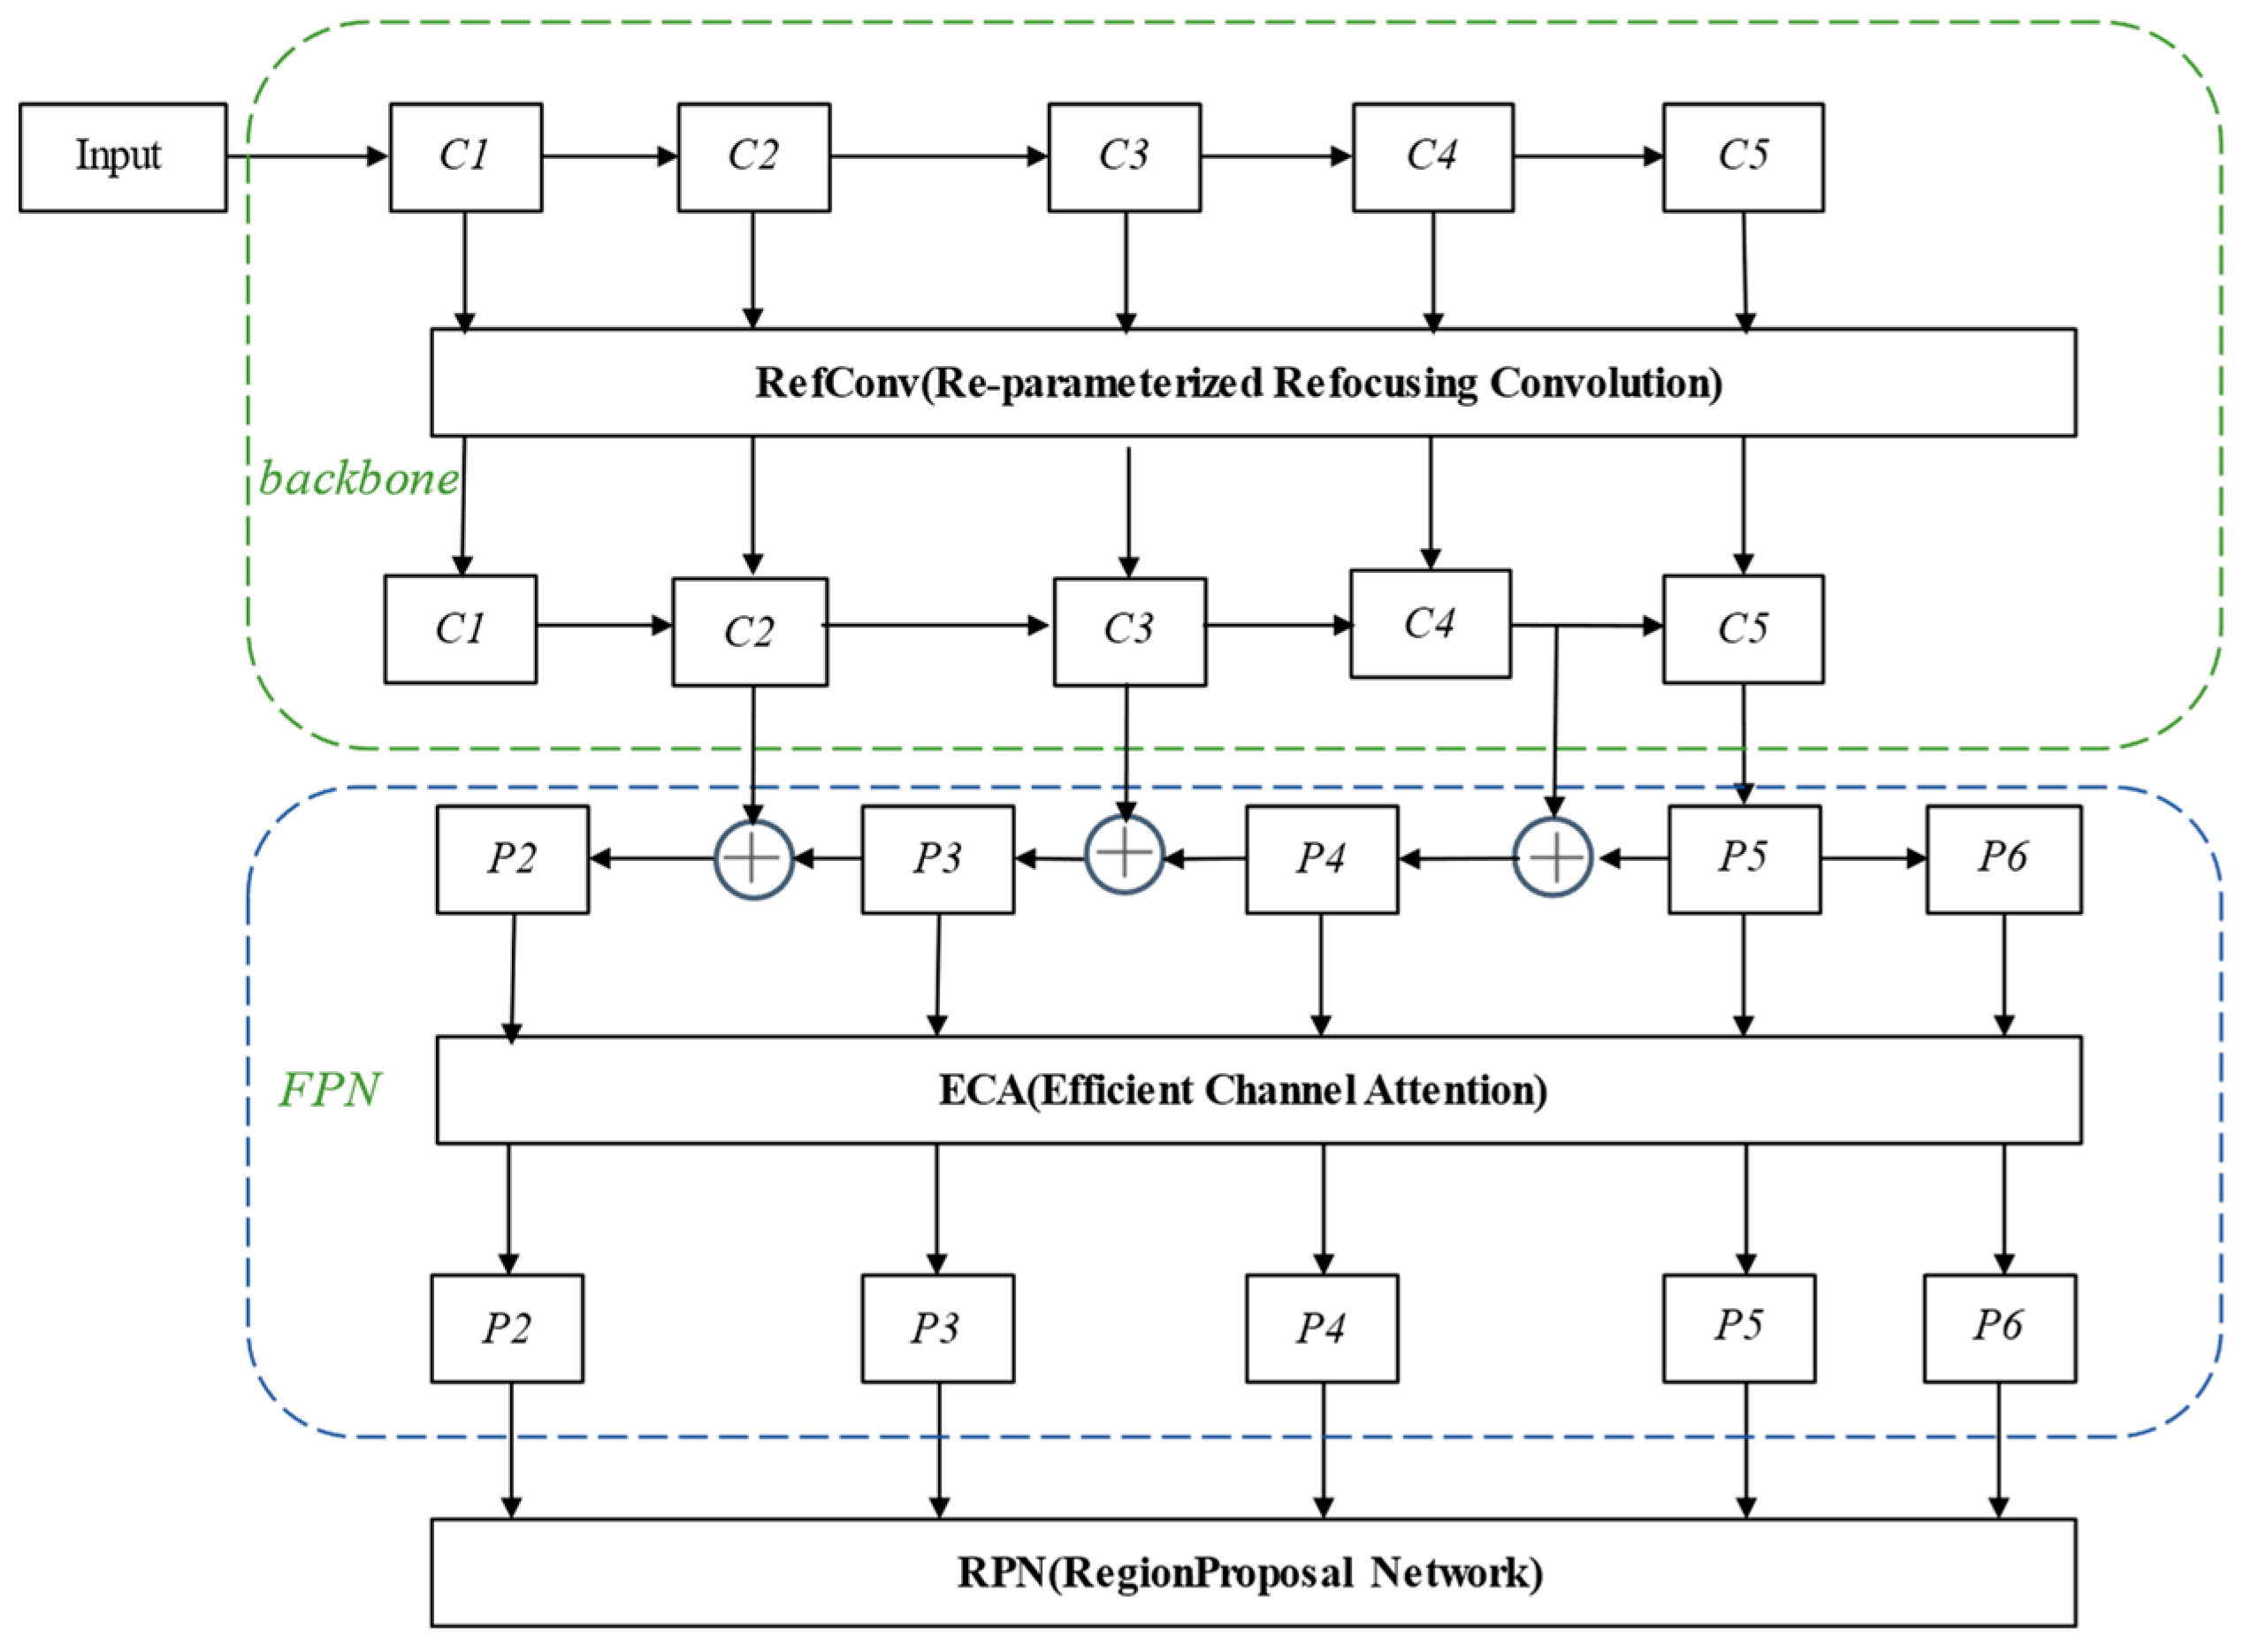
2.2.1. Improved Network Model Architecture

The improved Mask R-CNN network architecture is shown in Figure 2. Compared to the traditional Mask R-CNN, the improved model shows significant enhancements in feature extraction and multi-scale feature fusion capabilities. RefConv strengthens the expressive power of feature maps during the feature extraction stage by introducing group convolutions and feature refocusing mechanisms—namely, the ability of the feature maps to discriminate between foreground and background, preserve edge and texture details, and adapt to multi-scale shape variations. This enables the network to capture fine-grained features more effectively, particularly in ore images, where it can better preserve details of edges, textures, and complex shapes, overcoming the common issue of loss of detail encountered with traditional convolution operations. By reducing interference between channels, RefConv optimizes the feature extraction process, ensuring that each convolution group focuses on extracting specific local features, which significantly enhances the expression of fine details and improves segmentation accuracy. On the other hand, ECA optimizes multi-scale feature fusion in the Feature Pyramid Network (FPN) layer by adaptively adjusting the weights of each channel. In the presence of complex backgrounds and ore images with varying scales, ECA enables the network to focus more effectively on key information while suppressing the interference of background noise. This mechanism ensures that the network integrates features from different scales more accurately, thus improving segmentation accuracy and robustness for multi-scale objects. These improvements enable the model to better adapt to segmentation tasks in complex backgrounds and ores of different scales, providing more efficient and accurate technical support for mineral resource development.
Although previous studies have explored the use of RefConv and ECA in object detection and segmentation, the innovation of this study lies in combining these two techniques and incorporating them into the Mask R-CNN framework. This enhances the model’s feature extraction capabilities and multi-scale feature fusion in ore image segmentation. Compared to existing methods, the proposed algorithm not only significantly improves segmentation accuracy but also strengthens the model’s adaptability to the specific characteristics of ore images, such as complex textures and background noise.

2.2.2. Re-Parameterized Refocus Convolution

Re-parameterized Refocus Convolution is a convolutional unit designed to enhance standard convolution through re-parameterization and feature refocusing. The core idea is to attach a learnable refocusing transformation to the base convolutional weights. During training, only the transformation parameters are optimized, and they are subsequently fused with the original weights during inference. This approach improves the network’s ability to capture fine-grained details while maintaining the original architecture and computational cost [18].
Traditional convolution operations usually perform uniform convolution on all input feature channels, which may lead to loss of information when dealing with complex scenes, especially when dealing with targets of complex morphology and different scales. To solve this problem, RefConv adopts a group convolution strategy that divides the input feature channels into multiple subgroups, each processed independently by dedicated convolutional kernels. This operation increases the independence among convolutional filters, allowing each group to focus on capturing fine-grained information from specific spatial regions or scales, while simultaneously mitigating feature redundancy caused by inter-channel interference [19]. To preserve the semantic coherence of the overall representation, RefConv incorporates a feature fusion mechanism after the grouped convolution, which integrates the locally extracted features from each subgroup into a unified global representation. This design significantly enhances the network’s ability to represent object shapes, boundary contours, and fine texture details.
The segmentation of ore images faces several challenges, including complex target shapes, strong background interference, a large number of small-scale fragments, and jagged edges. In such scenarios, RefConv demonstrates significant advantages. On the one hand, its multi-channel feature fusion capability enhances the perception of ore edges and texture details, enabling the model to more accurately distinguish between ore and background regions, thereby generating segmentation results with clearer boundaries and more precise contours. On the other hand, RefConv exhibits strong multi-scale feature modeling capabilities, with different channels focusing on region-specific features at varying scales and shapes, improving the model’s ability to detect and segment ore targets of different sizes. By replacing the original Conv2D convolution with RefConv, it not only enhances the expressive power of the convolutional layer but also strengthens the network’s adaptability to complex target morphologies while ensuring computational efficiency.

2.2.3. Efficient Channel Attention

Efficient Channel Attention is a lightweight channel attention method that enhances the network’s ability to focus on key channel features by adaptively adjusting the weights of individual channels in the feature map [20].
Traditional attention mechanisms typically use fully connected layers or 2D convolution operations to model dependencies between channels, which involves first compressing the information from all channels through dimensionality reduction and then reconstructing it to recover the channel dimensions. While such strategies are effective in capturing global channel dependencies, they inevitably result in the loss of fine-grained feature details during the compression and reconstruction processes. This issue becomes particularly pronounced when the number of channels is small or when there are significant differences between channel features, as critical information may be discarded. To address this limitation, the Efficient Channel Attention introduces a dimension-preserving local cross-channel interaction strategy. Instead of reducing dimensionality, ECA models channel dependencies through local convolutional operations while maintaining the original channel structure. This approach avoids the semantic degradation caused by dimensionality compression and enables more robust and consistent attention allocation by preserving the semantic integrity across feature channels. The structure of RefConv and ECA is shown in Figure 3.
In the context of channel attention modeling, the kernel size of the convolution operation determines the receptive field over which inter-channel dependencies are captured. A kernel that is too small may fail to encompass sufficient contextual information, while an excessively large kernel can introduce redundant computations and noise, potentially leading to model overfitting. To address this trade-off and enable more efficient and flexible channel interaction, the Efficient Channel Attention incorporates an adaptive kernel size selection mechanism based on the number of input channels. Specifically, the kernel size used for one-dimensional convolution is dynamically determined by a function of the channel dimension, allowing the model to automatically adjust the range of local cross-channel interactions. The underlying design principle is intuitive: a larger number of channels implies a broader range of contextual dependencies that should be captured, warranting a larger kernel; conversely, fewer channels require only a limited interaction scope to avoid unnecessary overhead. This mechanism allows ECA to adaptively control the receptive field without introducing dimensionality reduction, thereby achieving a balanced trade-off between modeling capacity and computational efficiency. As a result, it significantly enhances the accuracy and generalization capability of channel attention representation across different network layers.
In ore image segmentation tasks, ore targets often have intricate texture and morphological features, and background noise and non-target regions often interfere with segmentation results [21]. However, the ECA can adaptively adjust channel weights when processing multi-channel feature maps, allowing the model to focus more on extracting target ore features and suppressing the influence of background noise. Especially in the fusion process of multi-scale features, the ECA can effectively enhance network’s ability to emphasize critical features, thereby improving the accuracy and robustness of segmentation.

2.3. Loss Function

In this study, the training loss function of Mask R-CNN consists of two main components. The first component is the loss from the Region Proposal Network stage ( L r p n ), while the second is the loss from the multi-task branch network ( L m u l _ t a s k ). The weights of all loss components are fixed. The total loss of the model is the sum of these two losses, and the specific calculation formula is as follows:
L t o t a l = L r p n + L m u l _ t a s k ,
The L r p n includes the anchor classification loss and the bounding box regression loss. The detailed computation is as follows:
L r p n = 1 N c l s 1 i = 1 n L c l s p i , p i * + λ 1 1 N r e g 1 i = 1 n p i * L r e g t i , t i * ,
The L m u l _ t a s k includes the losses of the three main tasks: classification loss ( L c l s ), bounding box regression loss ( L r e g ), and mask loss ( L m a s k ), which use SoftMax loss, Smooth L1 loss, and binary cross-entropy loss, respectively:
L m u l t a s k = 1 N c l s 2 i = 1 n L c l s p i , p i * + λ 2 1 N r e g 2 i = 1 n p i * L r e g t i , t i * + γ 2 1 N m a s k i = 1 n L m a s k s i , s i * ,
Here, N * represents the number of corresponding anchors; p i and p i * represent the predicted and ground truth classification probabilities, respectively; t i and t i * represent the parameterized coordinates of the predicted and ground truth bounding boxes, respectively; s i and s i * indicate the binary mask matrices of the predicted and ground truth masks, respectively; λ * and γ * are hyperparameters of the model. Setting these hyperparameters helps balance the training losses of bounding box regression and mask branches. In the loss function, λ is used to balance the weights of the bounding box regression loss and the mask branch loss. The optimal value for λ is typically determined through experimentation or grid search. A larger value of λ causes the model to place more emphasis on the bounding box regression task during training, while a smaller value of λ shifts more focus to the mask branch task. γ is used to balance the positive and negative sample ratio in the Focal Loss, playing a crucial role in the loss function for object detection tasks. Focal Loss adjusts the weight of hard-to-classify samples through γ. A larger value of γ encourages the model to focus more on challenging samples during training, thereby improving the model’s ability to segment rare or poorly defined targets.
In the loss function formulation, the normalization factors N c l s , N r e g , and N m a s k are used to balance the losses from different tasks. Specifically, N c l s corresponds to the number of positive samples in the classification task, N r e g represents the number of positive samples in the regression task, and N m a s k refers to the number of valid pixels in the mask branch. These normalization factors are typically computed based on the sample count for each task and remain fixed throughout the training process. This approach ensures a balanced contribution of each task’s loss, preventing any one task from dominating the training process and thereby improving the model’s overall performance across multiple tasks.

3. Experimental Results and Analysis

3.1. Dataset Creation

Due to the lack of public raw ore datasets, it is necessary to manually annotate the ores within the dataset. In this study, the ore image dataset used was photographed in a laboratory simulation environment and includes images of ores of various sizes and shapes. To ensure the authenticity and controllability of the image data, real ore samples were used in the experiment and captured under natural lighting conditions. Additionally, to enhance the model’s adaptability to various background environments, the backgrounds of the images were diversified, covering a range of different scene types.
The dataset contains a total of 500 high-resolution images, with each image containing 10 to 30 polymetallic nodules. All images have been manually annotated using the LabelMe tool, which allows for precise annotation of the polymetallic nodules. The annotations were subsequently converted into the standard COCO dataset format. The output annotations include the image ID, width, height, filename, each ore’s ID, corresponding image ID, bounding box, segmentation mask, area, and corresponding category label. Since this paper only focuses on the segmentation of polymetallic nodules, all annotated targets are “ore”. Using image enhancement techniques, including scaling and rotation operations, the ore images are expanded to a dataset of 3500 images. Each image has an original resolution of 4096 × 3072 pixels and a size of approximately 7 MB, resulting in a total dataset capacity of 25 GB. To meet the training requirements of deep learning models, we divided the dataset, with 80% of the data used for model training and 20% for model validation and testing. To ensure the randomness and fairness of the data split, the images were divided using random sampling. Additionally, high-similarity images or scenes were excluded from overlapping between the training, validation, and test sets, thereby ensuring the independence and non-interference of each dataset.

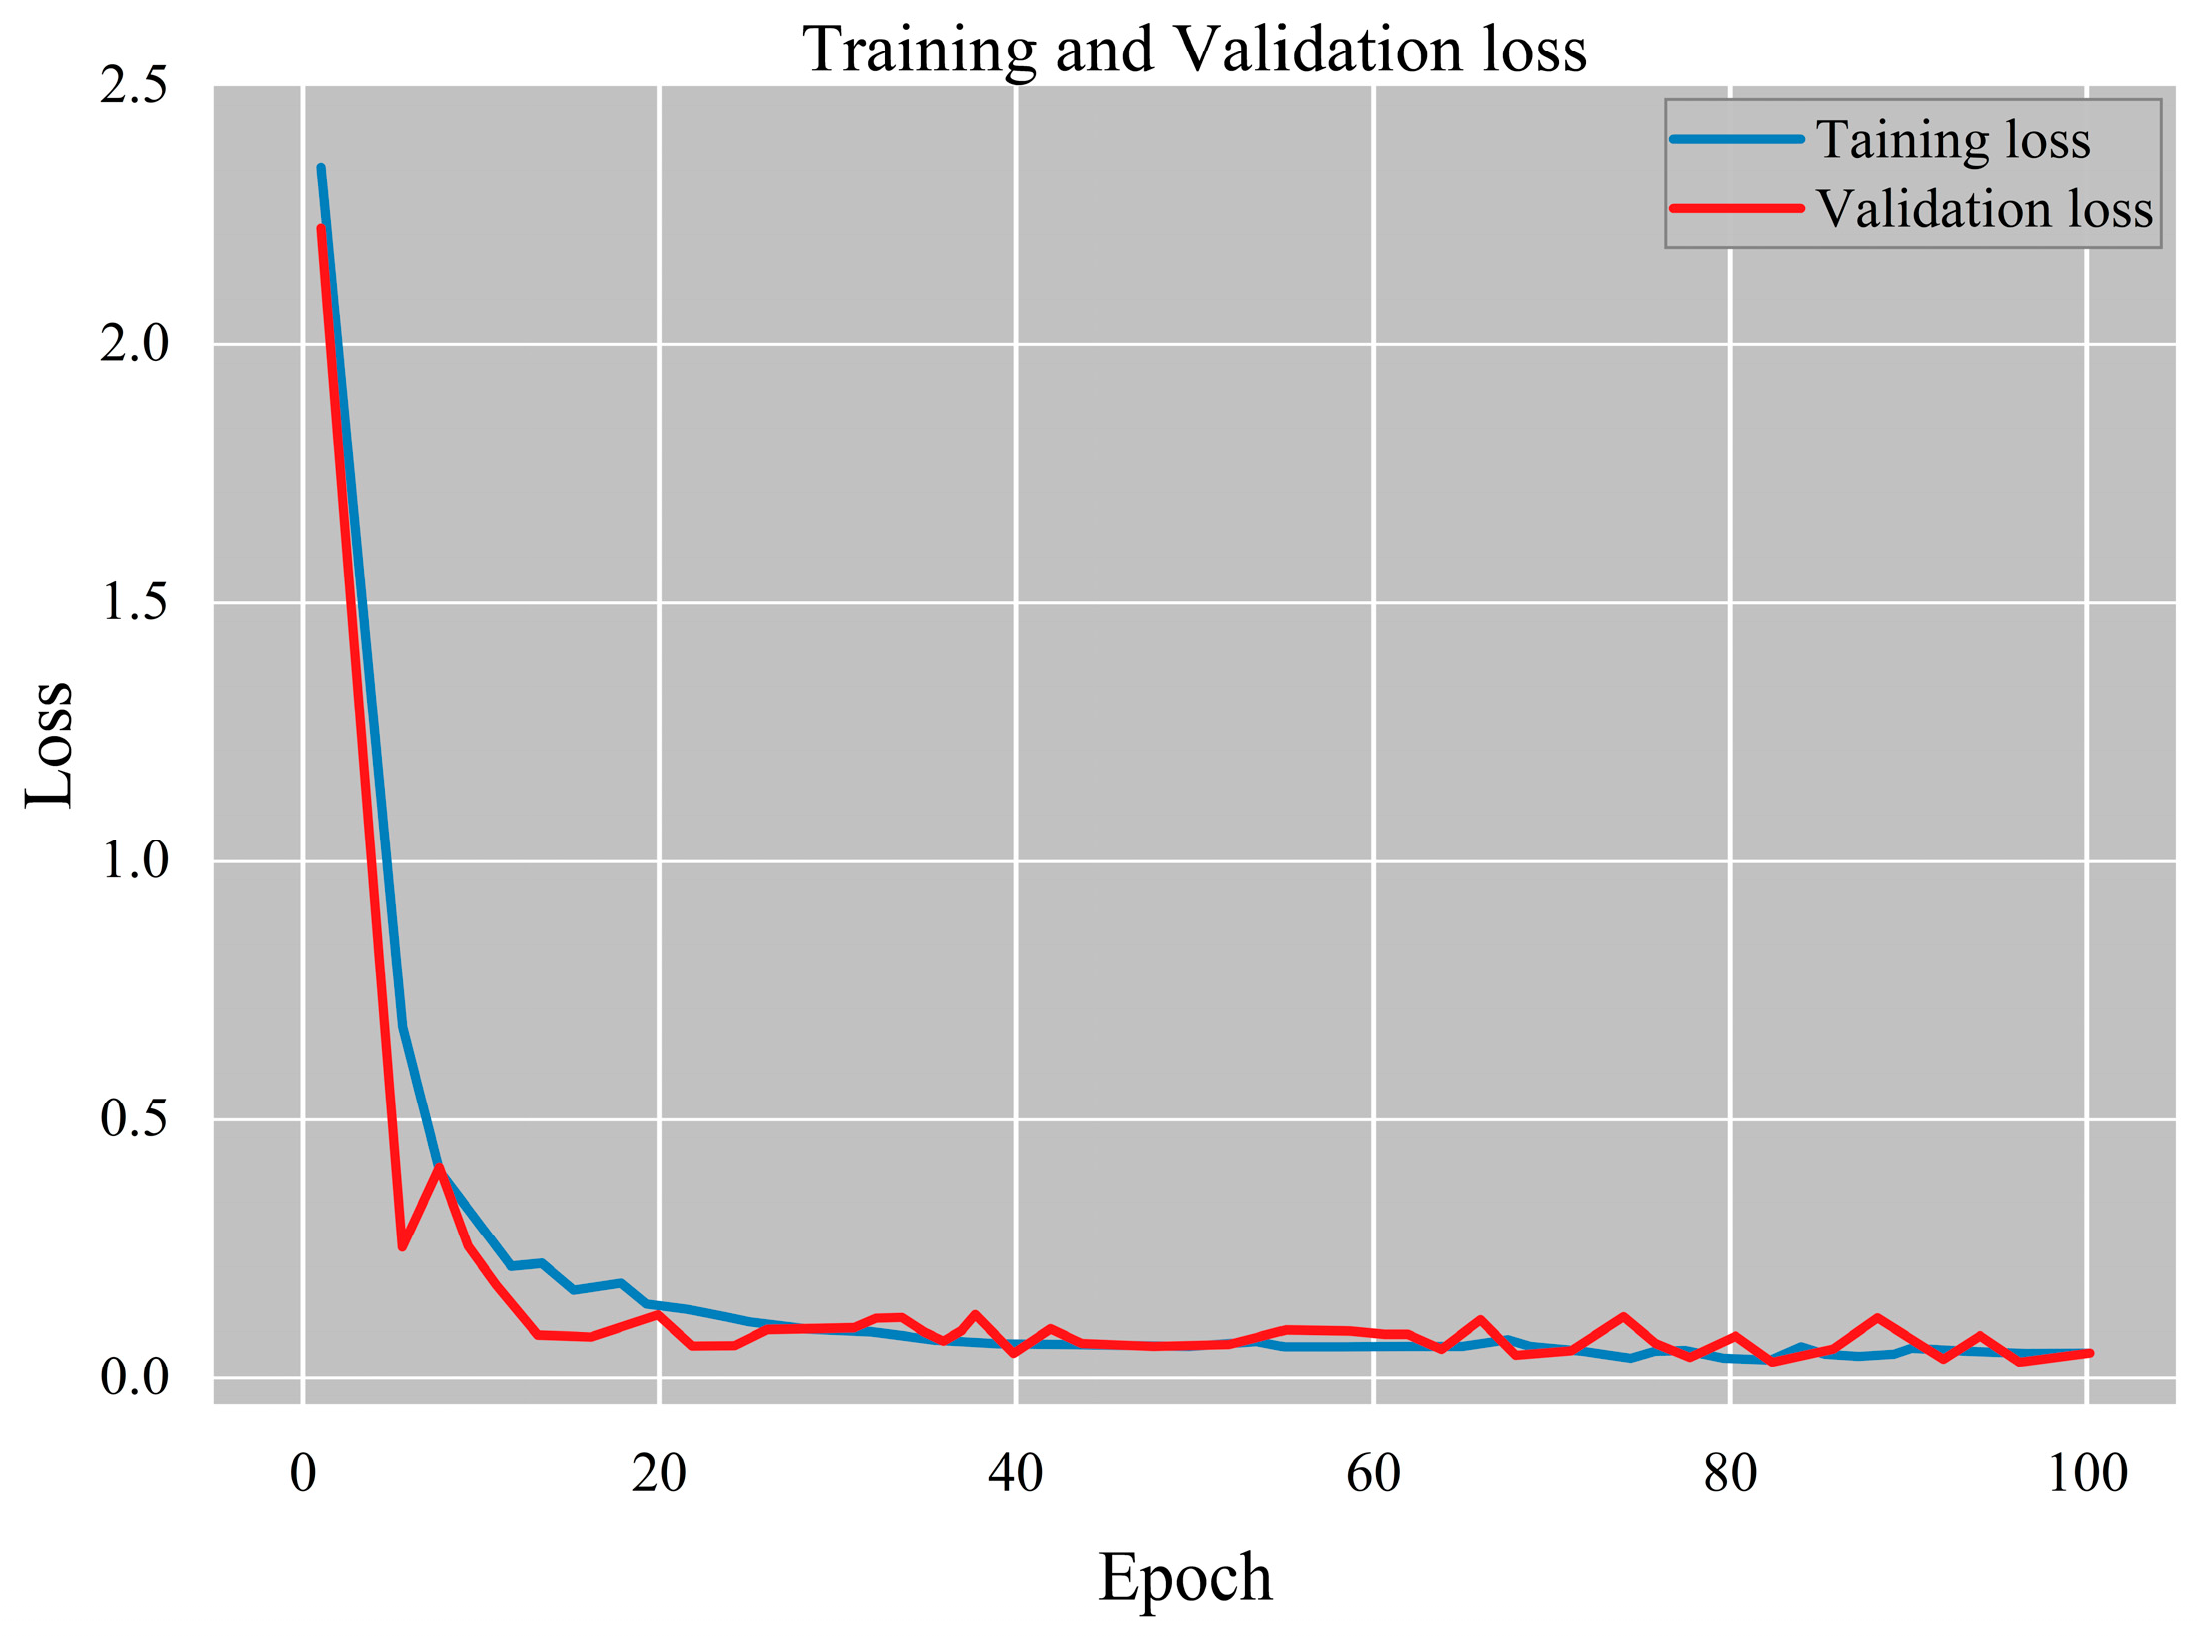
3.2. Training Platform Setup and Parameter Settings

The server used in this experiment runs on the Ubuntu 18.04 operating system and is equipped with an NVIDIA Tesla V100 GPU with 16 GB of memory. TensorFlow, which has a long development history and is known for its stability, was chosen as the platform for building the Mask R-CNN network. To handle complex computations efficiently, CUDA parallel computing architecture was utilized, leveraging GPU acceleration to enhance the speed of network training and inference.
This study employs a Mask R-CNN model pretrained on the COCO dataset, with the corresponding pretrained weights loaded. The Mask RCNN network was trained under the network parameters shown in Table 1. First, the images in the training set were adjusted to 748 × 1024 px, and the pre-trained network parameters were set, with the RPN’s RPN_ANCHOR_SCALES set to (32, 64, 128, 256, and 512), the initial learning rate set to 0.001, the momentum factor set to 0.9,the weight decay set to 0.0001, and the batch size set to 8, which remained fixed throughout the training process. Additionally, a step decay learning rate scheduling strategy was applied, where the learning rate was reduced by a factor of 0.1 every 20 epochs. During the training process, this study employed a stage-wise training strategy. In the initial phase, we froze the first few layers of ResNet and only trained the parameters of the subsequent layers, allowing the network to focus on learning task-specific features. As training progressed, more layers of ResNet were gradually unfrozen, enabling the full optimization of all layers in the later stages. This strategy helps stabilize the training process and accelerate the model’s convergence.

3.3. Evaluation Metrics

The metrics used to evaluate the segmentation effect in segmentation algorithms usually include Intersection over Union (IoU), Mean Intersection over Union (MIoU), Average Precision, and Mean Average Precision (mAP).
IoU represents the intersection over union of the predicted results and the true results, that is, the ratio of the intersection of the predicted values to the union of the predicted values and the true values. In this study, Intersection over Union (IoU) is calculated based on the segmentation masks rather than the bounding boxes, to evaluate the accuracy of the ore segmentation. The calculation formula is shown in Equation (4):
I o U = T P T P + F P + F N ,
MIoU represents the average value of IoU in the image prediction results for the same category. The calculation formula is shown in Equation (5):
M I o U = 1 c l a s s i = 1 c l a s s I o U i
mAP is the average value of all categories’ AP. In this study, since the task is single-class classification, the mAP is equivalent to the AP used in multi-class tasks. The evaluation of AP in this study is conducted using the COCO-style evaluation methodology, which is based on segmentation masks. The calculation formula is shown in Equation (6):
m A P = 1 N i = 1 N A P i
In this experiment, MIoU and mAP are mainly used as evaluation indicators for network segmentation effects. Since different prediction results will be obtained when the IoU threshold is set differently, this experiment compares the prediction results under three IoU threshold settings of 0.50, 0.75, and 0.85, with the corresponding evaluation indicators being M I o U 0.5 , M I o U 0.75 , M I o U 0.85 , m A P 0.5 , m A P 0.75 , m A P 0.85 , and the average MIoU and mAP of the three thresholds.

3.4. Experimental Analysis

To verify the effectiveness of the proposed improved network model, the ore dataset was trained with the improved Mask RCNN model. To illustrate the convergence behavior during training, the loss curve is presented in Figure 4. As shown, the loss decreases rapidly in the early stages and gradually stabilizes after approximately the 30th epoch, indicating that the training process is relatively stable.
Under the same experimental environment and hyperparameters, U-Net, Deep Lab v3+, and the original Mask RCNN model were tested and compared with the improved version. U-Net, a classical image segmentation model, utilizes an encoder–decoder architecture with skip connections to preserve high-resolution features, and is widely used in medical image segmentation. DeepLab v3+ enhances the model’s ability to capture multi-scale features by incorporating dilated convolutions and depth-wise separable convolutions, while improving computational efficiency, which results in exceptional performance in semantic segmentation tasks. The original Mask R-CNN, built upon the Faster R-CNN framework, adds an instance segmentation branch, enabling simultaneous object detection and pixel-level segmentation.
In this study, MIoU and mAP are calculated based on segmentation masks for the ore segmentation task. To enhance the stability of the evaluation results and reduce fluctuations caused by randomness, this study conducted multiple independent training experiments. The reported MIoU and mAP values are the averages of the results obtained from these training runs. Table 2 presents a comparison of the four networks based on their MIoU test results.
From Table 2, it is evident that, when using MIoU as the segmentation network evaluation indicator, the performance order is: Deep Lab v3+ < U-Net < Original Mask RCNN < Improved Mask RCNN. Specifically, Deep Lab v3+ exhibited the poorest segmentation performance, with an MIoU of 81.6%. U-Net showed an improvement of approximately 1.5% in MIoU compared to Deep Lab v3+. The original Mask R-CNN algorithm demonstrated an improvement of about 2.7% in MIoU over U-Net, and the Improved Mask R-CNN algorithm outperformed Deep Lab v3+ by about 11%, with an improvement of approximately 6.8% over the original Mask R-CNN, indicating a notable enhancement in segmentation performance.
This study uses the COCO-style evaluation method to calculate AP (Average Precision) with IoU@[0.5:0.95], and provides the AP values at specific IoU thresholds, such as 0.5, 0.75, and 0.85. Table 3 presents the mAP test results for the four networks. It can be found that among the four network structures, Deep Lab v3+ again showed the weakest segmentation performance, with an mAP of only 89.04%. The remaining three networks exhibited mAP scores exceeding 90%, with the Improved Mask R-CNN achieving the highest mAP of approximately 97.23%, representing an improvement of about 8.2% over Deep Lab v3+ and a 5.1% increase compared to the original Mask R-CNN.
Under identical data splits and random seed conditions, both the original Mask R-CNN and the improved model were independently trained five times, and the performance differences were statistically analyzed. The paired differences were tested for normality using the Shapiro–Wilk test (MIoU: p = 0.27; mAP: p = 0.19), confirming that the normality assumption was satisfied. Therefore, a paired t-test was applied. The results showed that the improved model achieved an average increase of 6.795% in MIoU (SD = 0.4137%; 95% CI [6.285%, 7.313%]; t(4) = 36.78, p = 1.8 × 10⁻⁶) and an average increase of 5.128% in mAP (SD = 0.7819%; 95% CI [4.158%, 6.098%]; t(4) = 15.62, p = 1.9 × 10⁻⁴). Both improvements were highly significant at the α = 0.05 significance level, indicating that the proposed enhancement not only holds statistical significance in terms of performance improvement but also demonstrates good generalization ability.
By comparing the test results of the four network structures in terms of MIoU and mAP metrics, it can be concluded that the improved Mask R-CNN segmentation algorithm proposed in this paper demonstrates outstanding performance in both indicators, significantly enhancing the overall segmentation performance of the network. To visually demonstrate the advantages of the improved algorithm, this study randomly selects an example image from the test set. Figure 5 presents a set of comparison results for the segmentation of raw ore by the four networks. In Figure 5, Figure 5a represents the original image, Figure 5b shows the manually annotated image of the raw ore, and Figure 5c–f correspond to the test results of the original Mask R-CNN, U-Net, Deep Lab v3+, and the improved Mask R-CNN algorithm, respectively. It can be observed from the figures that the test results of Deep Lab v3+ show severe adhesion, while the U-Net results show good adhesion but overly smooth segmentation. The morphology of the segmented targets differs significantly from the original image, resulting in poor segmentation accuracy. The original Mask R-CNN algorithm exhibits over-segmentation compared to the original image; the test results of the improved algorithm are smoother in segmentation effects and the edges are closer to the original and annotated images. Since the model is trained based on the annotated image for feature extraction, the closer the test results of the trained model are to the annotated image, the better the model’s performance. The test results of the improved Mask R-CNN model are the closest to the annotated image, yielding the best results.
This study compares the time complexity of the proposed algorithm with that of the original Mask R-CNN, with detailed results presented in Table 4. Although the introduction of RefConv and the ECA introduces some additional computational overhead, the overall computational cost does not increase significantly. Experimental results on the NVIDIA Tesla V100 show that the average prediction time per image for the improved model increases by only 29 milliseconds compared to the original model. This indicates that, despite the improved accuracy, the enhanced model maintains a reasonable balance in inference speed without significantly increasing computational time.
In order to more intuitively demonstrate the outstanding performance of the improved Mask R-CNN model in ore detection and segmentation, Figure 6 presents the segmentation results of ore targets in real-world scenes under varying lighting conditions, pose changes, and background interference. The example images shown are not randomly selected but are typical results chosen from the test set, intended to reflect the model’s robustness and adaptability in complex environments. As shown in the figure, the improved model accurately delineates the segmentation boundaries of ore targets, generates corresponding bounding boxes and precise segmentation masks, and annotates each target with its predicted class and confidence score. Through instance segmentation, the model provides pixel-level segmentation boundaries for individual ore instance, which closely align with the original morphology of the ores. The segmentation results are more accurate and clearer, avoiding the over-smoothing or blurred edges commonly observed in traditional methods. Particularly, even in the presence of complex backgrounds, different lighting conditions, and varying ore poses, the model consistently performs high-precision instance segmentation. This demonstrates that the improved model can precisely perform ore instance segmentation in real-world scenes, significantly enhancing its accuracy and robustness when handling complex scenarios.
Although the proposed model demonstrates good overall segmentation accuracy, its performance may be affected in cases of blurred boundaries, similar textures, or complex backgrounds. Therefore, future research could focus on enhancing the model’s adaptability to these challenges, with the aim of improving its robustness and generalization capabilities.

4. Conclusions

In response to the challenges of low precision and high equipment costs in the field of mineral resources, this paper proposes an improved Mask RCNN algorithm model for more accurate segmentation of ores. This model enhances the feature map’s expressive power by incorporating the RefConv to transform the ResNet residual network, enabling the network to better capture detailed information in ore images. Additionally, the ECA is introduced in the FPN layer to dynamically adjust the weight of each channel. This allows the network to adaptively focus on key channel features when fusing multi-scale features, thereby improving segmentation accuracy.
A comparison between the proposed improved Mask R-CNN algorithm and several commonly used segmentation models is presented. The experimental results demonstrate that the improved Mask R-CNN algorithm proposed in this study outperforms several commonly used segmentation models in terms of MIoU and mAP metrics, achieving higher segmentation accuracy. Furthermore, a comparison of the segmentation results for ore images among four networks indicates that the improved algorithm yields smoother outputs and edges that align more closely with the ground truth labels of the ore. In practical applications, the improved model exhibits robust performance in detecting ores under varying lighting conditions, poses, and background conditions, offering valuable reference for further research.
To advance the application of AI-based ore segmentation technology in mining operations, future research should focus on the following key directions: First, integrating image enhancement and data augmentation techniques to optimize ore image quality and expand the training dataset, thereby improving the model’s adaptability to complex scenarios and segmentation accuracy. Second, integrating the improved Mask R-CNN algorithm into existing ore detection systems to enable automated, efficient, real-time segmentation, while ensuring rapid response and real-time processing under hardware constraints. Finally, exploring the application of this algorithm in ore resource assessment, using segmentation results to estimate ore reserves and quality, thereby providing valuable decision support for mining operations. In summary, the improved Mask R-CNN algorithm holds significant research value and application potential in ore segmentation. Future efforts should focus on algorithm optimization, system integration, and resource assessment to drive its deeper application in the mining industry.

Author Contributions

K.T. contributed to the conception of the study and contributed significantly to analysis and manuscript preparation; L.Q. and Y.P. made important contributions in adjustments made to the structure of the paper, revised the paper, edited the manuscript, and polished the English; K.T. and X.W. formed the experiment; K.T. performed the data analyses and wrote the manuscript. All authors have read and agreed to the published version of the manuscript.

Funding

This research is supported by Liaoning Provincial Education Department Basic Research Project (Project No. LJKMZ20221115) and National Natural Science Foundation of China (Project No. 51975032). The authors also express their deep gratitude to the editors and reviewers for their careful reading, suggestions, and comments on the manuscript.

Data Availability Statement

The data supporting the findings of this study are of a semi-confidential nature and cannot be made publicly available due to privacy and security concerns. Access to the data is restricted, and any requests for data sharing will be considered on a case-by-case basis, subject to approval by the relevant institutional review boards and data protection authorities.

Acknowledgments

The authors would like to express their sincere gratitude to the Liaoning Provincial Education Department for their financial support through the Basic Research Project (Project No. LJKMZ20221115), and to the National Natural Science Foundation of China for their funding (Project No. 51975032). We would also like to thank the editors and reviewers for their careful reading and constructive comments on the manuscript, which significantly contributed to improving the quality of the paper. In addition, we acknowledge the administrative and technical support provided throughout the course of this study. Special thanks are due to Xiaobo Wang for his invaluable assistance during the experiment setup and data collection. We also extend our heartfelt gratitude to Yuguo Pei and Leilei Qu for their expert guidance and continuous support throughout the study.

Conflicts of Interest

The authors declare that there are no conflicts of interest with the publication of this article.

References

  1. Abubakar, J.; Zhang, Z.; Cheng, Z.; Yao, F.; Bouko, A.-A.B.S.D. Advancing Skarn Iron Ore Detection through Multispectral Image Fusion and 3D Convolutional Neural Networks (3D-CNNs). Remote. Sens. 2024, 16, 3250. [Google Scholar] [CrossRef]
  2. Wang, W.; Li, Q.; Zhang, D.; Fu, J. Image segmentation of adhesive ores based on MSBA-Unet and convex-hull defect detection. Eng. Appl. Artif. Intell. 2023, 123, 106185. [Google Scholar] [CrossRef]
  3. Liu, R.; Jiang, Z.; Yang, S.; Fan, X. Twin Adversarial Contrastive Learning for Underwater Image Enhancement and Beyond. IEEE Trans. Image Process. 2022, 31, 4922–4936. [Google Scholar] [CrossRef] [PubMed]
  4. Yu, W.; Zhao, L.; Zhong, T. Unsupervised Low-Light Image Enhancement Based on Generative Adversarial Network. Entropy 2023, 25, 932. [Google Scholar] [CrossRef] [PubMed]
  5. Jiang, P.; Ergu, D.; Liu, F.; Cai, Y.; Ma, B. A Review of Yolo Algorithm Developments. Procedia Computer Science. 2022, 199, 1066–1073. [Google Scholar] [CrossRef]
  6. Tan, L.; Huangfu, T.; Wu, L.; Chen, W. Comparison of RetinaNet, SSD, and YOLO v3 for real-time pill identification. BMC Med. Inform. Decis. Mak. 2021, 21, 324. [Google Scholar] [CrossRef]
  7. Murugan, V.; Nidhila, A. Vehicle Logo Recognition using RCNN for Intelligent Transportation Systems. In Proceedings of the 4th IEEE International Conference on Wireless Communications Signal Processing and Networking (WiSPNET), Chennai, India, 21–23 March 2019. [Google Scholar]
  8. Chen, K.-B.; Xuan, Y.; Lin, A.-J.; Guo, S.-H. Esophageal cancer detection based on classification of gastrointestinal CT images using improved Faster RCNN. Comput. Methods Programs Biomed. 2021, 207, 106172. [Google Scholar] [CrossRef] [PubMed]
  9. He, K.; Gkioxari, G.; Dollár, P.; Girshick, R. Mask r-cnn. In Proceedings of the IEEE International Conference on Computer Vision, Venice, Italy, 22–29 October 2017. [Google Scholar]
  10. Fang, S.; Zhang, B.; Hu, J. Improved Mask R-CNN Multi-Target Detection and Segmentation for Autonomous Driving in Complex Scenes. Sensors 2023, 23, 3853. [Google Scholar] [CrossRef]
  11. Sahin, M.E.; Ulutas, H.; Yuce, E.; Erkoc, M.F. Detection and classification of COVID-19 by using faster R-CNN and mask R-CNN on CT images. Neural Comput. Appl. 2023, 35, 13597–13611. [Google Scholar] [CrossRef] [PubMed]
  12. Szegedy, C.; Liu, W.; Jia, Y.; Sermanet, P.; Reed, S.; Anguelov, D.; Erhan, D.; Vanhoucke, V.; Rabinovich, A. Going Deeper with Convolutions. In Proceedings of the IEEE Conference on Computer Vision and Pattern Recognition (CVPR), Boston, MA, USA, 7–12 June 2015. [Google Scholar]
  13. Brahimi, S.; Ben Aoun, N.; Ben Amar, C. Boosted Convolutional Neural Network for object recognition at large scale. Neurocomputing 2019, 330, 337–354. [Google Scholar] [CrossRef]
  14. Shafiq, M.; Gu, Z. Deep Residual Learning for Image Recognition: A Survey. Appl. Sci. 2022, 12, 8972. [Google Scholar] [CrossRef]
  15. Kim, S.-W.; Kook, H.-K.; Sun, J.-Y.; Kang, M.-C.; Ko, S.-J. Parallel Feature Pyramid Network for Object Detection. In Proceedings of the 15th European Conference on Computer Vision (ECCV), Munich, Germany, 8–14 September 2018. [Google Scholar]
  16. Jiang, S.; Xu, T.; Li, J.; Huang, B.; Guo, J.; Bian, Z. IdentifyNet for Non-Maximum Suppression. IEEE Access 2019, 7, 148245–148253. [Google Scholar] [CrossRef]
  17. Bi, X.; Hu, J.; Xiao, B.; Li, W.; Gao, X. IEMask R-CNN: Information-Enhanced Mask R-CNN. IEEE Trans. Big Data 2022, 9, 688–700. [Google Scholar] [CrossRef]
  18. Cai, Z.; Ding, X.; Shen, Q.; Cao, X. Refconv: Re-parameterized refocusing convolution for powerful convnets. arXiv 2023, arXiv:2310.10563. [Google Scholar] [CrossRef] [PubMed]
  19. Cohen, T.; Welling, M. Group equivariant convolutional networks. In Proceedings of the International Conference on Machine Learning, New York, NY, USA, 19–24 June 2016. [Google Scholar]
  20. Wang, Q.; Wu, B.; Zhu, P.; Li, P.; Zuo, W.; Hu, Q. ECA-Net: Efficient channel attention for deep convolutional neural networks. In Proceedings of the IEEE/CVF Conference on Computer Vision and Pattern Recognition, Seattle, WA, USA, 13–19 June 2020. [Google Scholar]
  21. Liu, Y.; Zhang, Z.; Liu, X.; Wang, L.; Xia, X. Efficient image segmentation based on deep learning for mineral image classification. Adv. Powder Technol. 2021, 32, 3885–3903. [Google Scholar] [CrossRef]
Figure 1. Mask RCNN network structure.
Electronics 14 02025 g001
Figure 2. Improved Mask RCNN network architecture.
Electronics 14 02025 g002
Figure 3. Diagram of Re-parameterized Refocus Convolution and Efficient Channel Attention.
Electronics 14 02025 g003
Figure 4. Training and Validation Loss Curves.
Electronics 14 02025 g004
Figure 5. Comparison of results of four kinds of networks for raw ore segmentation.
Electronics 14 02025 g005
Figure 6. Segmentation results of ore detection in real-world scenes.
Electronics 14 02025 g006
Table 1. Network parameter.
Parameter NameParameter Configuration
Initial Learning Rate0.001
Momentum Factor0.9
Image Size748 × 1024
RPN_ANCHOR_SCALES (32, 64, 128, 256, 512)
Training Epochs100
Batch Size8
λ1.0
γ2.0
Table 2. Four kinds of network MIoU50, MIoU75, MIoU85, and MIoU test results.
Network Model M I o U 0.5 M I o U 0.75 M I o U 0.85 MIoU
Original Mask RCNN0.85310.85790.86560.8588
U-Net0.82570.83110.83790.8315
DeepLab v3+0.80740.81850.82230.8160
Improved Mask RCNN0.91840.92280.93940.9268
Table 3. Four kinds of network mAP 50, mAP 75, mAP 85, and mAP test results.
Network Model m A P 0.5 m A P 0.75 m A P 0.85 mAP
Original Mask RCNN0.94760.92410.89130.9210
U-Net0.91680.90320.88180.9006
DeepLab v3+0.91520.88280.87320.8904
Improved Mask RCNN0.98660.97210.95830.9723
Table 4. Comparison of prediction time between the improved algorithm and the original algorithm.
MethodAverage Prediction Time
Original Mask R-CNN0.208 s
Improved Mask RCNN0.237 s
Disclaimer/Publisher’s Note: The statements, opinions and data contained in all publications are solely those of the individual author(s) and contributor(s) and not of MDPI and/or the editor(s). MDPI and/or the editor(s) disclaim responsibility for any injury to people or property resulting from any ideas, methods, instructions or products referred to in the content.

