Article

Machine Learning-Driven Truck–Drone Collaborative Delivery for Time- and Energy-Efficient Last-Mile Deliveries

School of Electrical Engineering and Computer Science, Faculty of Engineering, University of Ottawa, 161 Louis-Pasteur Pvt, Ottawa, ON K1N 6N5, Canada
*
Author to whom correspondence should be addressed.
These authors contributed equally to this work.
Electronics 2025, 14(10), 2026; https://doi.org/10.3390/electronics14102026
Submission received: 5 April 2025 / Revised: 2 May 2025 / Accepted: 10 May 2025 / Published: 16 May 2025

Abstract

:
Truck–drone collaboration in urban last-mile deliveries offers an innovative solution to address inefficiencies in modern supply chain networks. This work leverages real drone flight data to train a machine learning-based drone energy model that accurately estimates the time and energy consumption of drones to support resource-related decisions. An AI engine is proposed that integrates the drone energy model with a self-organizing feature map algorithm, ensuring continuous drone operation without reliance on charging infrastructure. A total of 93 comprehensive scenario-based simulations over 1 week of delivery data in MATLAB offers actionable insights into resource allocation, demonstrating that deploying three drones at five truck stops results in the most energy-efficient delivery scenario, reducing energy consumption by 36% compared to the least efficient outcome, in which a single drone is deployed at four stops. The holistic and data-driven approach to truck-drone collaboration presented in this work has the potential to bridge the gap between theoretical models and real-world applications.

1. Introduction

Autonomous delivery technologies, i.e, delivery drones and robots, have some constraints, like range, speed, and payload capacity. To mitigate these shortcomings, practical solutions including electric trucks as carriage and launch platforms are becoming more common. Modern supply chain networks utilize distribution centers or microdepots (alternatively, microhubs) closer to customer locations to facilitate fast customer deliveries. This has also enabled the efficient integration of drones and robots into existing logistics networks, considering factors like accessibility, cost, and operational feasibility [1]. In the context of collaborative delivery, trucks frequently function as mobile depots for the carrying, charging, launching, and recovery of drones or robots [2]. Consequently, these vehicles can be regarded as mobile facilities, akin to relocatable drone depots.
Drones are emerging as a promising alternative for the e-commerce parcel deliveries. Major companies like Amazon, UPS, Zipline, and DHL are actively developing and testing drone delivery systems. Despite their potential, drones face challenges such as payload and battery limitations and vulnerability to adverse weather conditions. Conversely, traditional truck delivery has its own drawbacks, including traffic congestion, carbon emissions, and dependency on road networks and conditions. The Truck–Drone Collaborative Delivery (TDCD) model addresses the limitations of each delivery mode, offering significant cost savings compared to using trucks alone [3]. By having trucks transport drones closer to customer locations, energy efficiency is improved, as drones rely on batteries. There has been a substantial amount of research on truck–drone collaborative delivery, particularly in the last five years.
The truck–drone collaborative delivery problem can be split into two main problems: the carried vehicle supporting drone delivery problem (CVSDDP) and the simultaneous delivery problem of trucks and drones (SDP-TD) [4]. In the CVSDDP model, the truck acts as a mobile depot and platform for the transportation of the drone to the service area, where the drone then completes the delivery to the customer. Conversely, in the SPD-TD model, both the truck and the drone are capable of directly serving customers. In this study, we address the CVSDDP problem, where the truck serves as a support vehicle for the drone, without directly delivering to customers. Once the drone has visited all customers in its designated service area, the truck retrieves the drone and transports it to the next delivery center or back to the depot.
Synchronizing drone and truck routes in TDCD poses significant challenges in collaborative delivery systems. Hence, the majority of research has focused on routing and scheduling problems. However, recent research has been increasingly addressing the emerging challenges of identifying the optimal truck locations for drone launches [4,5], determining the optimal number of drones required to meet specific customer demands [6,7,8,9], managing the battery power of drones [8], and making drone scheduling and routing decisions [4,6,9,10]. This article takes a comprehensive approach and addresses the key challenges of TDCD in a coherent way, using realistic data and proposing a machine learning-driven drone energy model to calculate drone delivery time and energy for fleet resource decisions over one week of delivery data. This holistic approach to the problem, reinforced by process flow charts, can enhance interdisciplinary researchers’ understanding of the topic.
Figure 1 provides a high-level overview of the scope of this work. This work builds upon the customer delivery dataset developed in previous work by the authors of [11]. Utilizing machine learning techniques, optimal truck-stop locations are identified as launch points for drones tasked with delivering packages to designated customer locations within the dataset. The truck-stop and customer locations are incorporated into the proposed drone energy model as distance parameters, enabling the assessment of energy consumption and informing strategic fleet sizing decisions. Additionally, time and distance efficiencies are systematically analyzed to optimize drone scheduling and routing, ensuring operational effectiveness.
Previous research on collaborative truck–drone delivery for last-mile parcel deliveries has often relied on the drone range specified in the manufacturer’s guide to estimate battery power in problem formulation [12,13,14,15]. Additionally, the vertical movement of drones (ascending and descending) and the impact of payload on energy consumption are frequently overlooked in these calculations. To address these gaps, we developed a realistic drone energy model using machine learning techniques that account for the effects of ascending, landing, and payload on drone battery consumption.
Most current studies utilize conceptual instances from previous research, such as randomized locations within a given area or a very limited number of customer locations. In contrast, our study employs a realistic dataset for online stochastic customer demand, assuming next-day delivery, as detailed in our previous work [11]. Furthermore, while existing research on truck–drone collaboration primarily focuses on time-inefficient optimization techniques, we applied a machine learning algorithm, the Self-Organizing Feature Map (SOFM), to identify distance-optimal launch centers within seconds based on online demand. Finally, our drone energy model aids in sizing the drone fleet according to the battery levels of available drones when there is no charging facility nearby.
The primary contribution of this work lies in the development of an AI engine that supports resource decision making by integrating the SOFM algorithm with a machine learning-based drone energy model using real drone flight data, as also illustrated in the system model in Figure 2.
This paper is structured as follows: Section 2 discusses previous works in the literature and highlights the novelty of this work. Section 3 details the research methodology. Section 4 presents the context and setting of the problem. Section 5 describes the drone energy model that is proposed in this work and the drone flight dataset that is used to build the energy model. Section 6 presents the findings on the drone energy model and TDCD simulations, with insights on resource allocation and energy management. Finally, Section 7 covers the concluding remarks for this work, along with directions for future research.

2. Literature Review
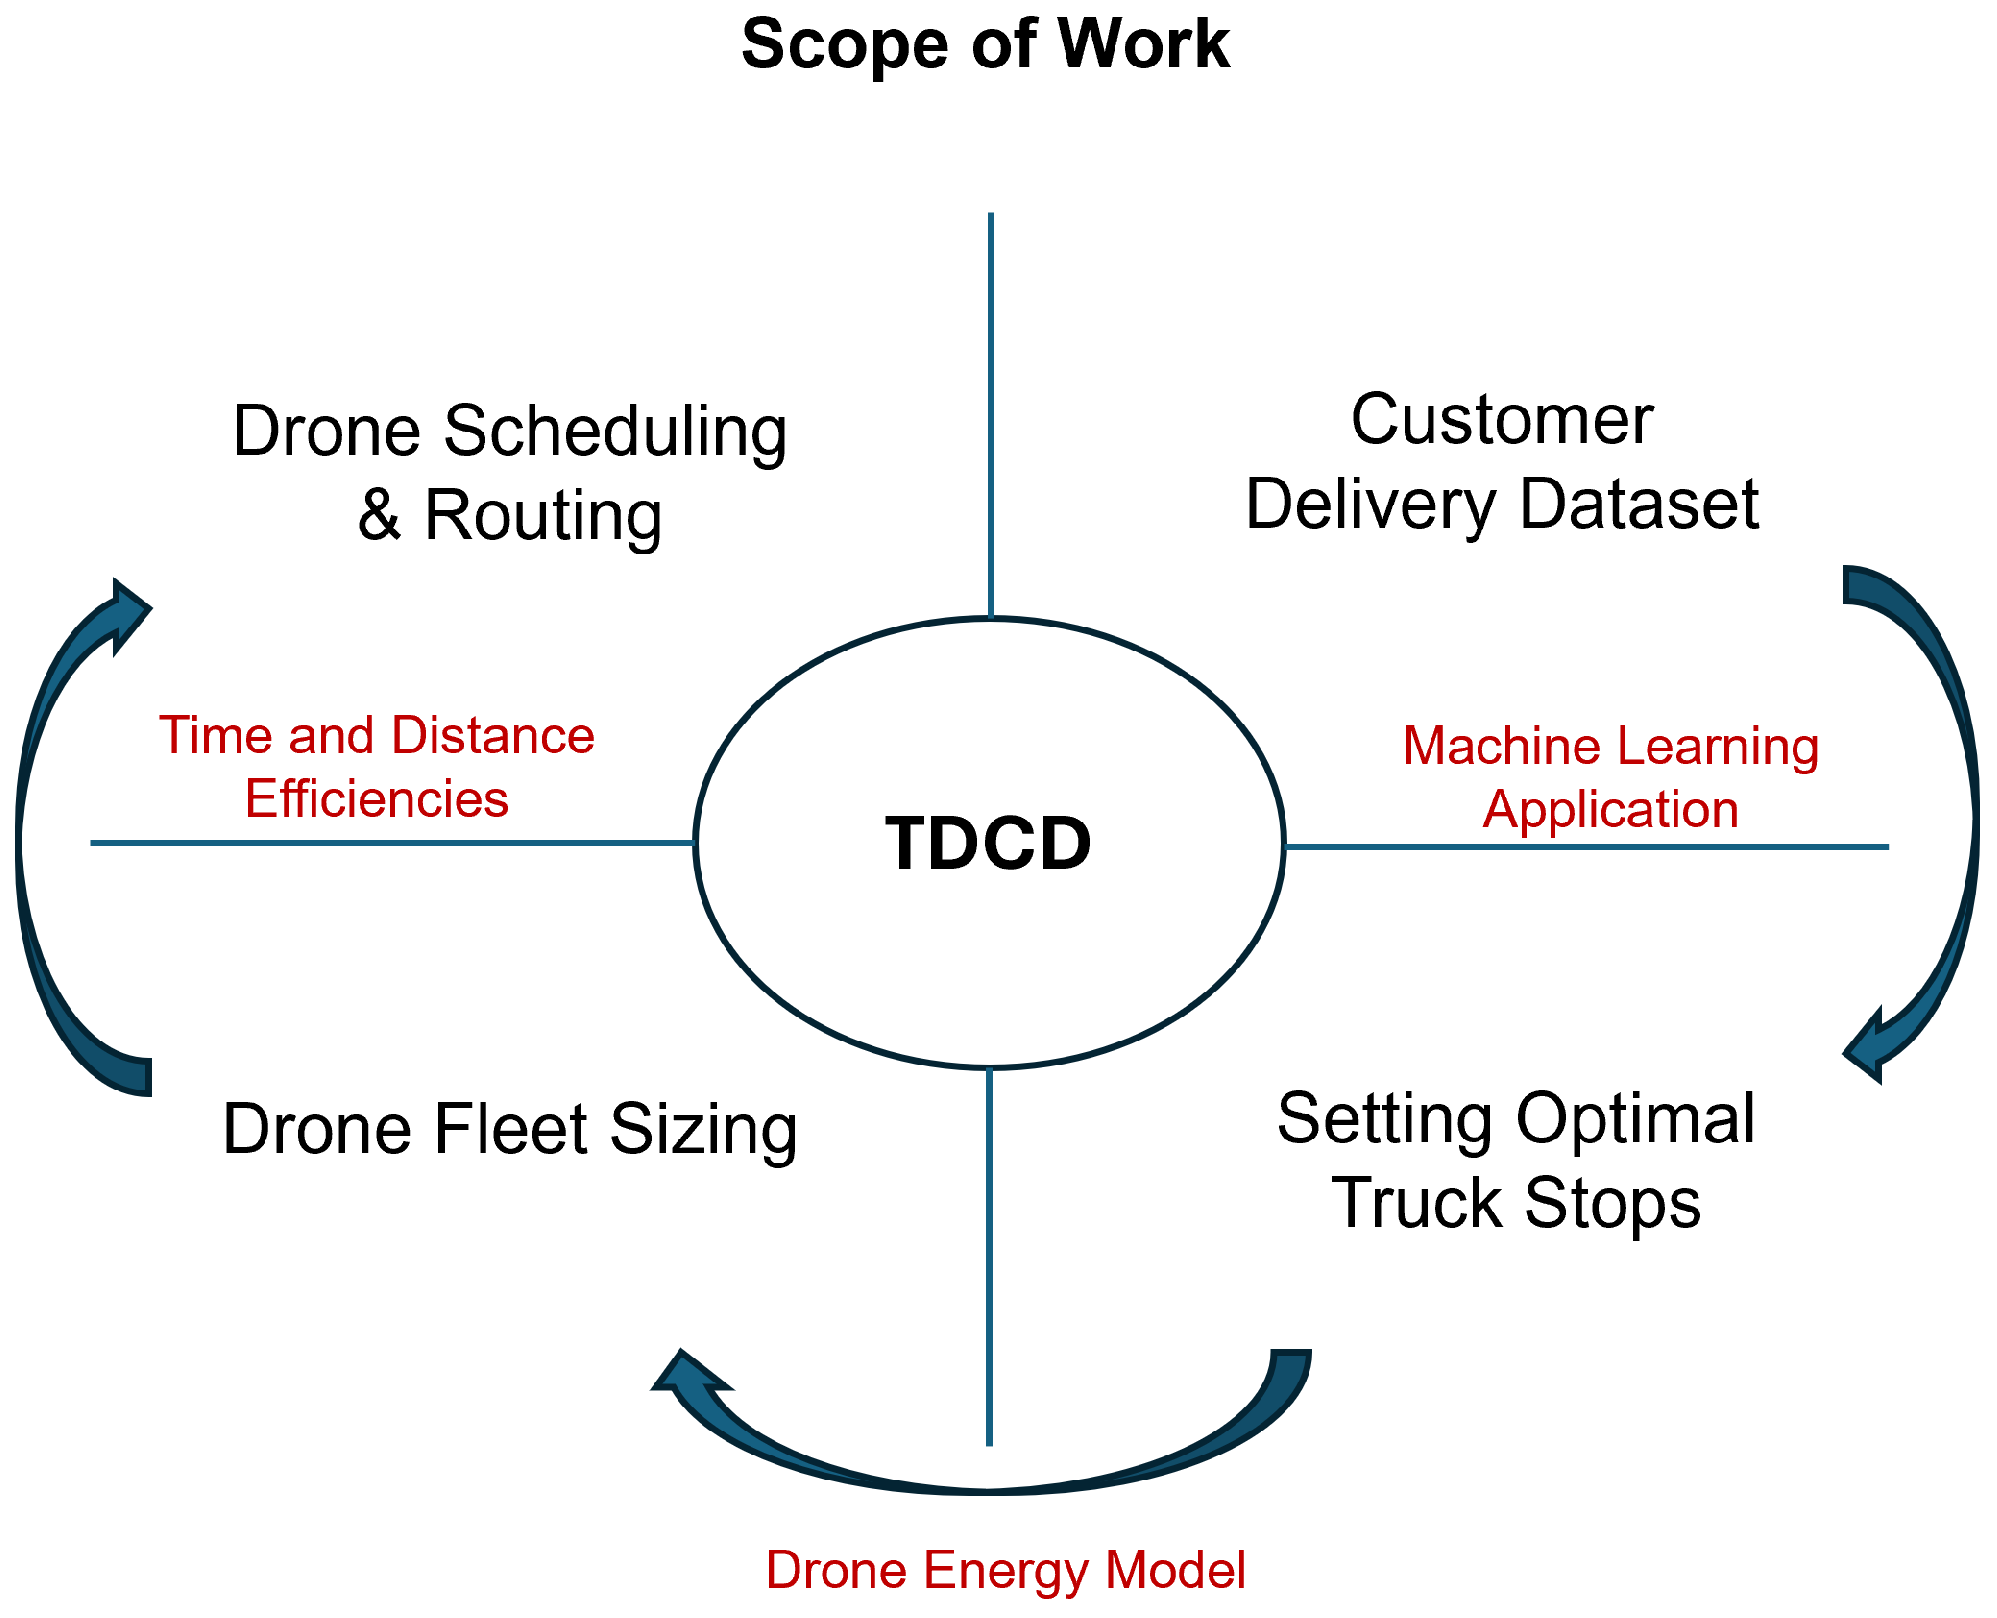
In the existing literature, numerous delivery network models have been proposed, considering variations in the number of vehicles, their distinct functions, and the number of depots. The first research on drone-assisted truck deliveries [16] formulated a flying sidekick traveling salesman problem and used mixed-integer linear programming to minimize the delivery time. In this joint delivery mode, first, the truck route is defined; then, drone sub-routes are planned, and the drone merges with the truck after serving the customer en route. Trucks can also deliver to customers when it is not feasible to deliver by drone. Researchers have extensively explored collaborative truck–drone delivery for last-mile delivery (LMD), analyzing it through the frameworks of the traveling salesman problem and vehicle routing or scheduling problems [9,17,18,19,20,21] because synchronizing both drone and truck routes introduces a significant challenge in collaborative delivery systems. Baldisseri et al. [22] performed a comprehensive life-cycle assessment analysis to estimate the greenhouse gas emission per delivered parcel and applied a total cost-of-ownership model to understand the cost performance of truck-assisted drone deliveries. The study concluded that the drone automation level and battery life cycle have significant cost impacts and that a delivery system combining an electric truck with a drone performs better than a diesel van or an electric van under varying customer densities and wind conditions.
Moreover in the recent years, optimal facility locations for drone deliveries [23] have extensively been studied. A design case study concerning healthcare delivery throughout the Birmingham, Alabama (USA), area used particle a swarm optimization method to identify the optimal number and locations of drone stations for truck–drone delivery, concluding that sorting the location of the drone stations improves customer coverage but does not necessarily improve the route distance [24]. Existing studies that deal with the facility location problem commonly use MILP (Mixed-Integer Linear Programming) [3,23,25], MINLP (Mixed-Integer Non-Linear Programming) [26], or other optimization algorithms like the particle swarm algorithm [24]. Some studies have aimed to optimally locate microdepots in a last-mile delivery network without focusing on the TDCD problem [27,28].
A qualitative comparison of this article with existing and recent research is summarized in Table 1 and discussed in this paragraph. Bi et al. [6] applied reinforcement learning, a type of agent-based machine learning to the TDCD problem, mainly to avoid drone collisionsin a multi-drone environment. Wu et al. [4] applied reinforcement learning to solve the routing problem for both the truck and the drone; however, they mainly focused on the running-time efficiency of the Machine Learning (ML) algorithm in comparison to two meta-heuristic algorithms. Figliozzi and Hadas [8] did not apply machine learning but applied distance-based policy in a dynamic stochastic demand environment to achieve energy efficiencies, and they discussed battery management in the context of charging infrastructure. Arishi et al. [10] used the K-means clustering algorithm to identify a cluster of delivery locations and set the flight range constraint between the truck and each customer as the maximum range of the drone. Bacanli et al. [5] investigated the placement of parcel delivery centers for drones using machine learning and created synthetic data for training of an ML algorithm with distribution data. Chen et al. [7] investigated a multi-fleet delivery problem using a mixed-integer linear programming (MILP) model. Similarly, Thomas et al. [9] applied an MILP model to the routing problem and analyzed the impact of drone utilization on the size of the drone fleet. While existing studies on TDCD have primarily focused on isolated aspects of the problem, our work bridges these gaps by integrating multiple critical components into a cohesive AI-driven framework. By addressing all the problems listed in the research-gap table within a unified framework, this study significantly enhances practical feasibility, efficiency, and interdisciplinary insight for TDCD implementation.

3. Methodology

The Methodology section discusses the datasets and machine learning applications used in this work, as well as the process of integrating delivery information, the drone energy model, and the machine learning algorithm within the AI engine, as shown in Figure 3. This figure clearly explains the steps followed in integrating the delivery information, drone energy model, and SOFM algorithm within the AI engine. The axes indicate the inclusion of input parameters. The following subsections detail the methodology and the flow of research work, as guided by this flow chart.

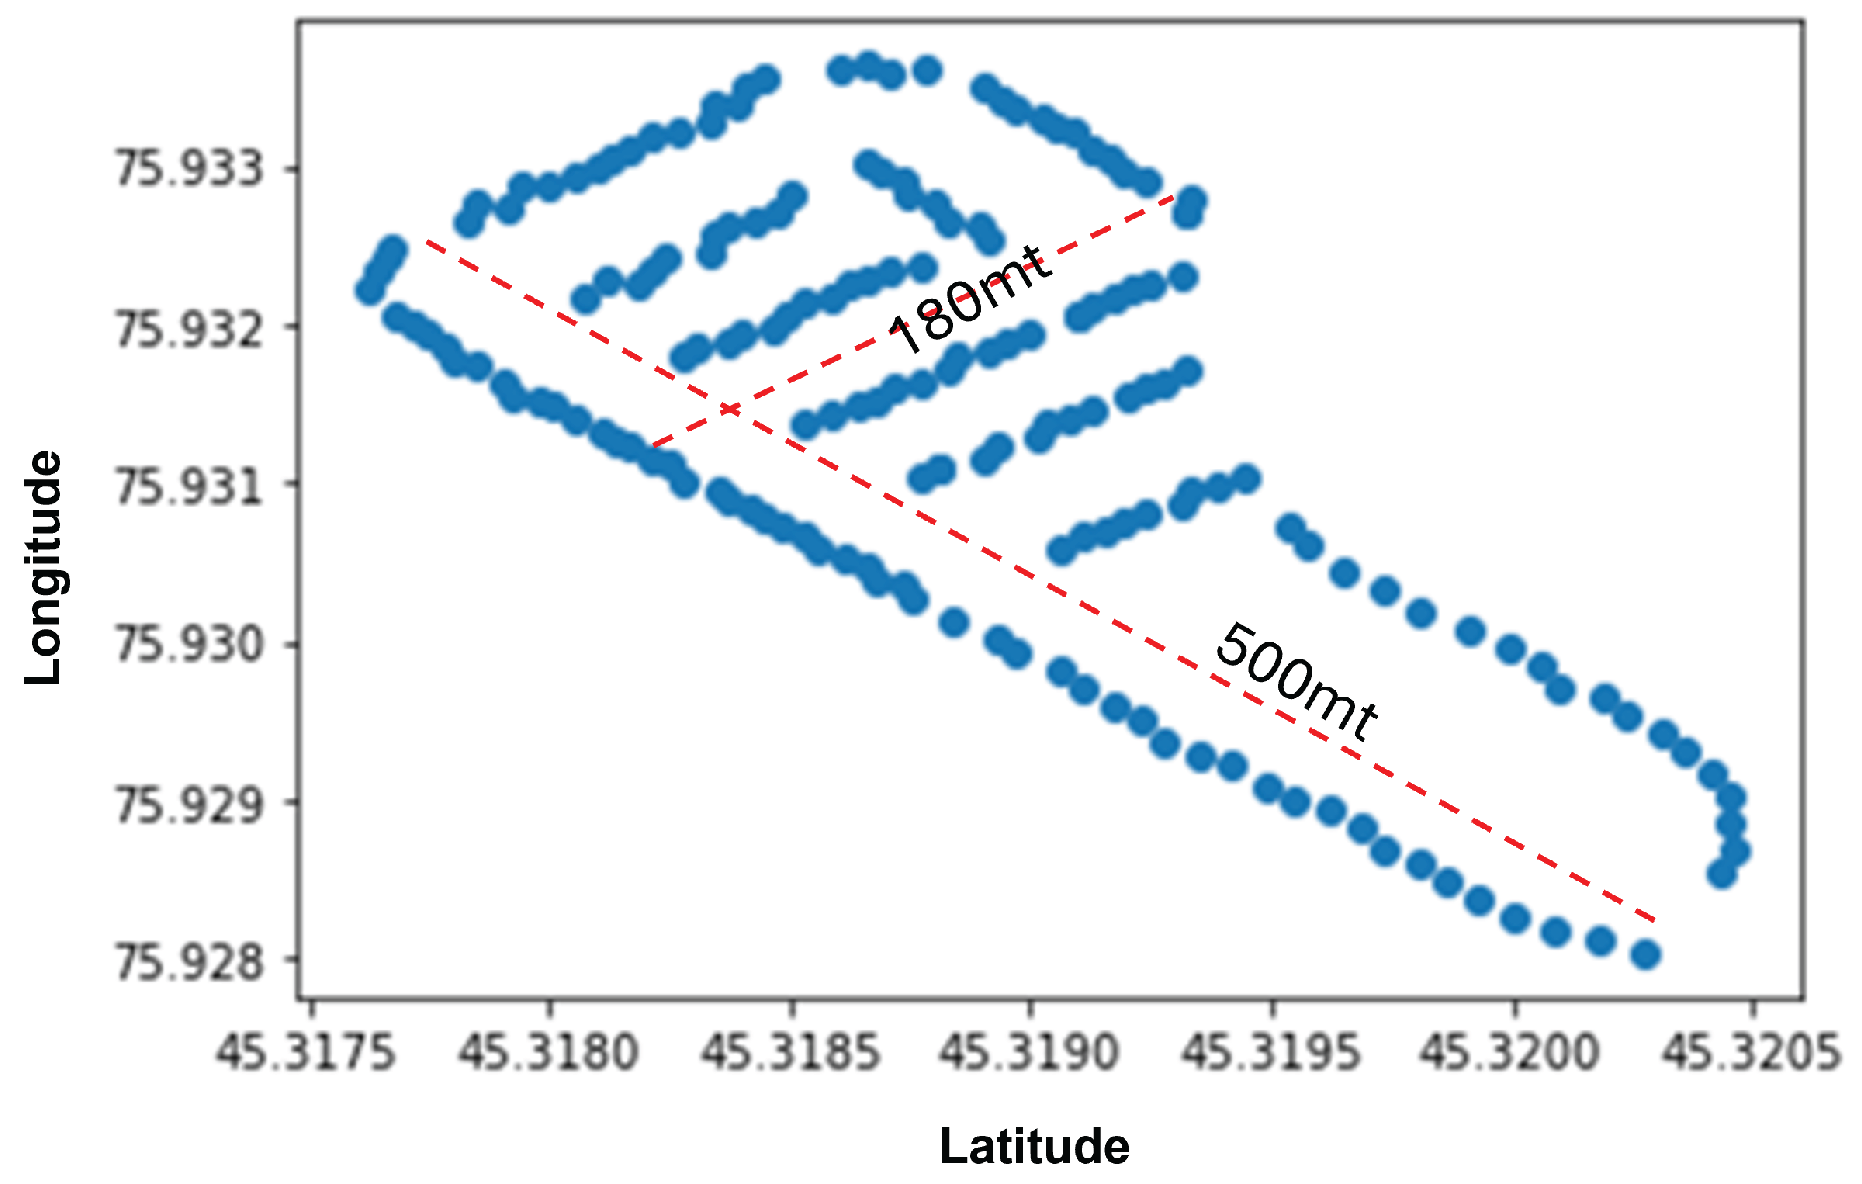
3.1. Delivery Dataset

The realistic synthetic delivery data used in this work were generated in our previous work [11], using actual customer addresses and realistic order patterns to simulate delivery scenarios. A neighborhood in Kanata, Ontario, with 191 customer locations was sampled. Online customer order data were generated for a period of one week (7 days) through randomization with MATLAB R2023a. A proportion of 55% of customer locations place one order per week, while 45% do not place any online orders. Return (backhaul) orders and package collections are not included. The dataset includes the package delivery frequency (0 or 1 per week), package delivery day (Monday to Sunday), package delivery time (6 a.m. to 6 p.m.), and package size (1—small; 2—medium; 3—large); however, only the delivery day and delivery frequency features were used in this work.

3.2. Vehicle Specifications and Parameters

The truck used in this problem is an electric truck (e-truck), and the specifications for it were obtained from the work of Balassi et al. [29], with the factory parameters noted in Table 2. The drone parameters, as noted in Table 3, were obtained from the work of Rodrigues et al. [30], as explained in Section 3.3.

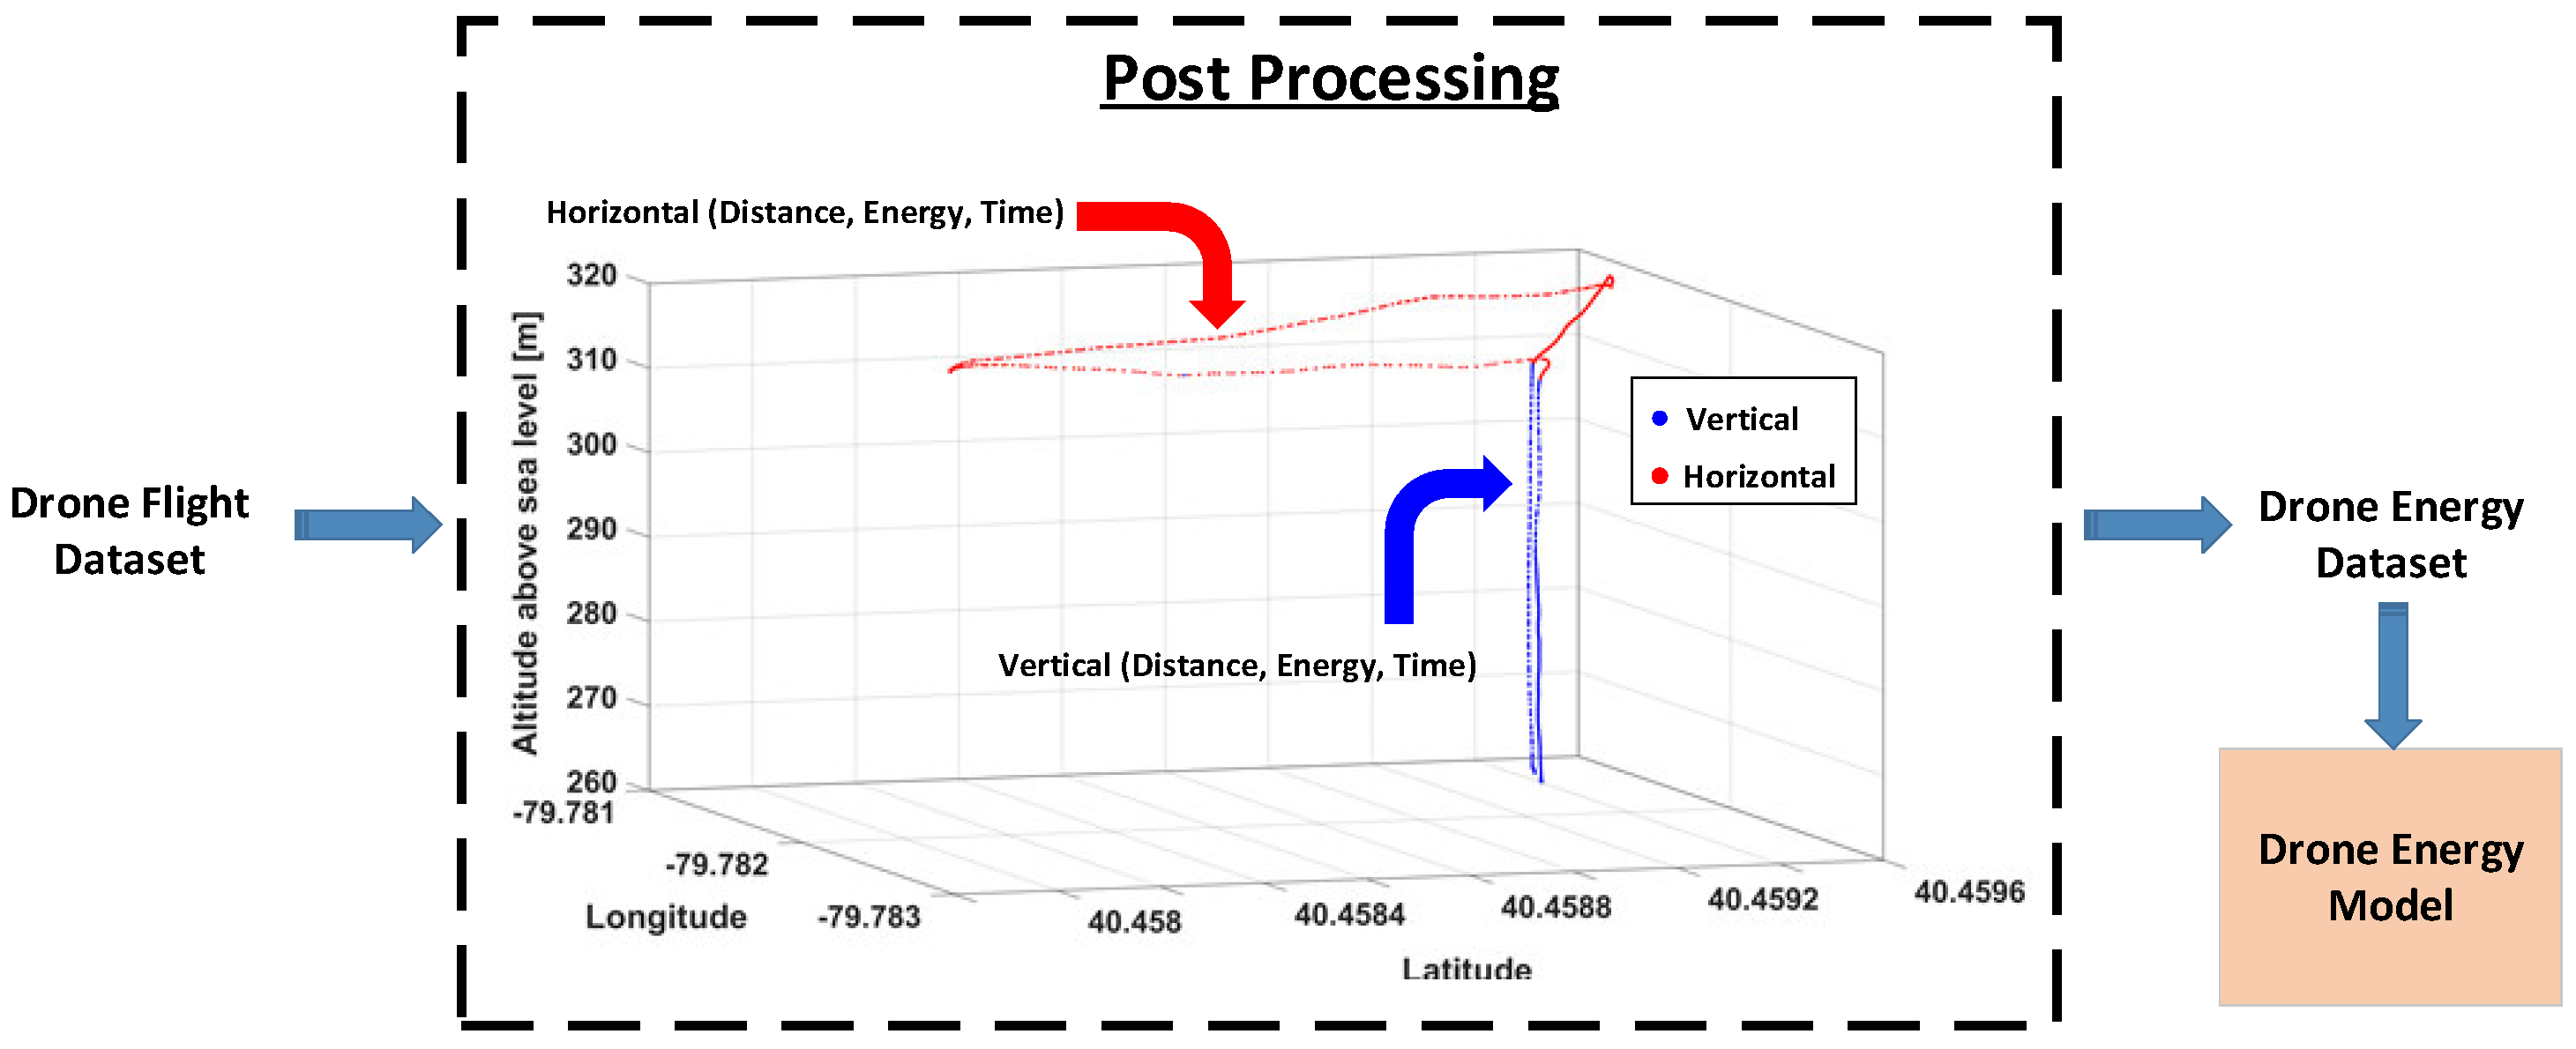
3.3. Drone Flight Dataset

In order to use drone parameters in real-life settings and to build the drone energy model proposed in this work, we used the previous work of Rodrigues et al. [30]. Their work captured accurate operational metrics over 209 drone delivery test flights using a DJI Matrice 100 model (https://www.dji.com/ca/support/product/matrice100/, accessed on 8 September 2024) for small package delivery. The battery used for the DJI Matrice 100 is a TB48D. The specifications of the drone and the battery are listed in Table 3. This in-flight positional and energy use dataset of a DJI Matrice 100 was published and made available to public in 2021. In this dataset [30], a small quadcopter package delivery drone was tasked with completing 209 flights, each involving takeoff, flying a designated route, and landing, under varying operational parameters. The drone was outfitted with sensors such as GPS, IMU, voltage, and current sensors and an ultrasonic anemometer to gather detailed data on inertial states, wind speed, and power consumption. Parameters like the commanded ground speed, payload, and cruise altitude were adjusted for each flight. This comprehensive dataset, collected from April to October 2019, includes a total flight time of 10 h and 45 min, covering around 65 km. The data were validated by comparing flights with similar parameters. This dataset is very helpful for researchers who want to contribute to the field but lack comprehensive datasets to work with. We elaborate on this issue in Section 5.

3.4. Machine Learning Applications

In this work, an unsupervised machine learning algorithm, SOFM, was employed to identify the clusters of customer locations and to find the distance-optimal truck stops to launch the drones. This novel application of this method aims to minimize the vehicle travel distance and, hence, reduce energy consumption and environmental impact.
The SOFM algorithm, introduced by Kohonen (1990) [31], is a type of artificial neural network designed for unsupervised learning and dimensionality reduction. This algorithm represents multi-dimensional data using a two-dimensional grid of neurons. In SOFM, neurons are interconnected through a predefined topology known as neighborhood connections [32]. The neuron that best matches the input data is referred to as the Best Matching Unit (BMU). The training process in SOFM is akin to the winner-take-all algorithm, utilizing vectorial distance-based competitive learning. During training, each data sample is compared to the weights of every neuron in the 2D hexagonal structure, and the Euclidean distance from each comparison is calculated independently. The BMU is then updated to minimize the distance between itself and the input data coordinates. Simultaneously, the neighborhood connections around the BMU are adjusted using a time-dependent radius function. This iterative process refines neuron positions, facilitating the formation of regional connections between neurons and input data coordinates. Training continues until a specified stopping criterion is met. SOFM has been widely applied in various domains, such as in identifying mobility patterns and clusters of residents during the COVID-19 pandemic [33] and assessing cyber risks in mobile crowdsensing systems [34]. Shahbazi et al. compared the performance of SOFM with that of K-means, a distance-based clustering algorithm, and with that of DBScan, a density-based clustering algorithm, in their work [35] and concluded that SOFM performs better than K-means, with results closer to thiose of DBScan. Since this work involves distance-based clustering, the SOFM algorithm was used.
We utilized the concept of an “AI engine”, a code-based decision-making agent, to optimize the scheduling and routing of drones, a topic commonly studied through the use of optimization algorithms in the literature. The AI engine’s main task is to decide on the next task, be it the scheduling of the drone to serve a cluster of customer locations or determining the size of the drone fleet to be employed to meet the delivery requirements. This engine is fed delivery information from the delivery dataset and drone energy information from the drone energy model. Additionally, the user inputs their selections for the number of drones, as well as their speed and altitude, into the engine.
Another key contribution of this work is the development of a drone energy model using machine learning regression models, which is detailed in Section 5.

4. Problem Setting

The problem is formulated as a truck-assisteddrone delivery problem in an urban residential setting. The truck is solely responsible for transporting and launching the drones; it does not charge the drones or deliver directly to customer locations. A residential neighborhood in Kanata, Ontario, with 191 customer locations was selected as the delivery area for this study. The polar coordinates (latitude and longitude) of these customer locations were obtained from OpenStreetMap (https://www.openstreetmap.org/, accessed on 11 October 2023) to create the delivery area, as plotted in Figure 4. The key assumptions of the problem are listed in below:
  • The truck is loaded with the parcels and drones at the distribution center and visits the delivery area selected for this problem. The distance between the distribution center and the delivery area is not considered in the calculations.
  • The truck goes to the identified stop ( S i ) , parks there, and launches the drone(s). Parking restrictions are not considered in this residential setting.
  • The truck can launch multiple drones ( D j ) at each stop based on the number of delivery locations and their distances from the truck.
  • There is no nearby charging facility for the drones, and the truck lacks charging capacity. Therefore, it is crucial to utilize the drone’s battery level ( B l ) to the maximum.
  • A drone visits each customer location ( N k ) on its route and returns to the truck to re-supply with the next parcel. The truck stays in parking mode until all the delivery tasks assigned to the drone(s) are completed.
  • The drone energy and delivery time are calculated with payload on the way to the delivery destination and without payload on the way back to the truck.
  • Drones with higher battery power are scheduled first. Drone routes are planned starting from the farthest delivery location and progressing to the closer ones.
  • The truck collects the drones and returns to the distribution center upon completion of the planned deliveries.

5. Drone Energy Model

In recent studies addressing the energy consumption of delivery drones or investigating their battery limitations, information has often been limited to the manufacturer’s specification of the drone battery, neglecting critical factors such as vertical distance (altitude), speed, and payload effects on battery consumption. To bridge these gaps, we introduced an advanced drone energy model leveraging machine learning algorithms. This model provides a more accurate estimation of battery usage by incorporating the energy costs associated with ascending, descending, and varying payload weights, thereby offering a comprehensive solution for the optimization of drone operations in real-world scenarios.
The drone features of voltage, current, time, positional data, altitude, speed, and payload were obtained from the in-flight positional and energy-use dataset [30]. To enhance the compatibility of the drone flight dataset with machine learning models, several post-processing steps were applied. Initially, the dataset reported voltage and ampere hours for each flight. To better capture energy dynamics, we calculated the energy consumption per flight in kilojoules, incorporating delivery time as a key factor. Furthermore, the dataset lacked explicit tagging for drone movement direction—whether vertical or horizontal. To address this, new features were introduced: vertical distance and horizontal distance. These refined features enable a more granular breakdown of energy consumption and delivery time, distinguishing between take-off/landing phases and cruise hovering. This segmentation ensures that energy and temporal characteristics are appropriately modeled for different flight operations, improving the dataset’s effectiveness for predictive modeling. The horizontal and vertical distance, along with the speed and payload selections, are fed into the drone energy model to ultimately produce the horizontal energy (HE), horizontal time (HT), vertical energy (VE), and vertical time (VT), as illustrated in Figure 5. The post processing of the drone flight dataset to create the drone energy dataset that we worked on for this work is illustrated in Figure 6.
The energy consumption (kjoule) is calculated as expressed below:
Energy ( kJ ) = Voltage ( V ) × Current ( Ah ) × 3600 ( s / h ) / 1000
The notations for the model parameters are defined in Table 4, and a mathematical illustration of the Delivery Energy (DE) and Delivery Time (DT) calculation of the model is presented below. Since the formulation is derived from a machine learning model, functional notations are used to capture the relationships encoded by the algorithm. Function-based notation preserves the flexibility inherent to the machine learning approach.
DE = V E + H E
Delivery Energy is calculated as the total of Vertical Energy (VE) and Horizontal Energy (HE).
V E = f V E ( d v , s v , w p ) + f V E ( d v , s v , w 0 ) 2
Vertical energy (VE) is determined by summing the energy consumption in two distinct cases: VE without payload ( w 0 ), the energy required when there is no additional weight, and VE with payload ( w p ), the energy required when carrying a payload. Since the drone follows a two-way flight path—first traveling from the truck to the customer location with the payload, then returning to the truck without the payload—the total energy consumption for a complete flight cycle is doubled.
H E = f H E ( d h , s h , w 0 ) + f H E ( d h , s h , w p )
Horizontal energy (HE) is is determined by summing the energy consumption in two distinct cases: HE without payload ( w 0 ), the energy required when there is no additional weight, and HE with payload ( w p ), the energy required when carrying a payload. The distance parameter is not fixed as for vertical energy and is obtained from the SOFM algorithm.
DT = V T + H T
Delivery time is calculated as the total of vertical time (VT) and horizontal time (HT).
H T = f H T ( d h , s h , w 0 ) + f H T ( d h , s h , w p )
Horizontal time (HT) is determined by summing the delivery time in two distinct cases: HT without payload ( w 0 ), the delivery time required when there is no additional weight, and HT with payload ( w p ), the delivery time required when carrying a payload. The distance parameter is not fixed as in the vertical time calculation and is obtained from the SOFM algorithm.
V T = f V T ( d v , s v , w 0 ) + f V T ( d v , s v , w p ) 2
Vertical time (VT) is determined by summing the energy consumption in two distinct cases: VT without payload ( w 0 ), the energy required when there is no additional weight, and VE with payload ( w p ), the energy required when carrying a payload. Since the drone follows a two-way flight path—first traveling from the truck to the customer location with the payload, then returning to the truck without the payload—the total energy consumption for a complete flight cycle is doubled.

6. Results

This section is split into two subsections to present the results obtained for the drone energy model and TDCD simulations.

6.1. Drone Energy Model

The process of predicting the continuous output variables of horizontal energy (HE), horizontal time (HT), vertical energy (VE), and vertical time (VT) based on the input variables of horizontal and vertical distance, energy, time, speed, and payload is a regression problem. Several ML models were trained to solve this problem and to come up with the best performing regression model. Out of all the ML models trained in MATLAB—linear regression models, regression trees, support vector machines, Gaussian process regression, kernel approximation regression models, ensembles of trees, and neural networks—the following models showed the best performance:
  • Regression Model 1: Optimizable GPR outperforms other models for horizontal energy (HE)
  • Regression Model 2: Optimizable GPR outperforms other models for horizontal time (HT)
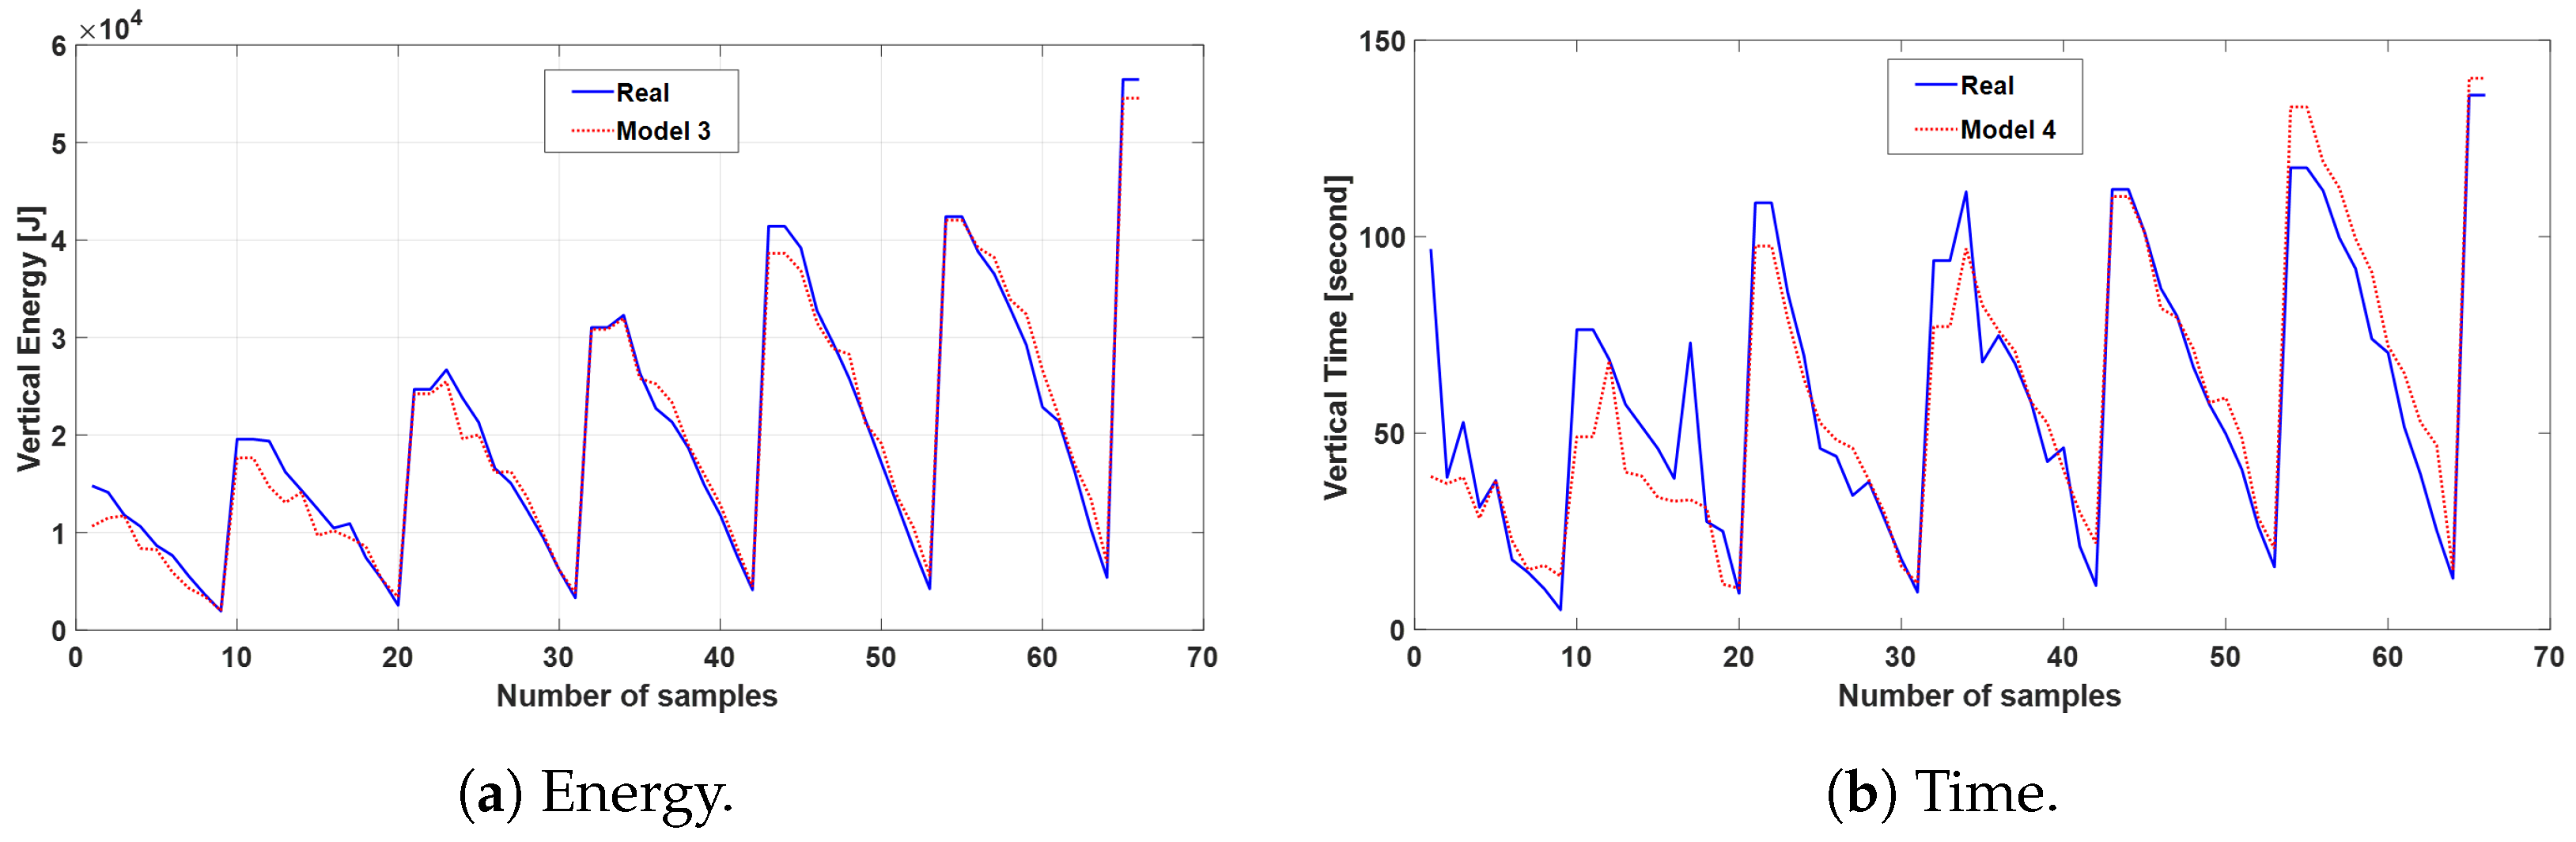
  • Regression Model 3: Optimizable ensemble outperforms other models for vertical energy (VE)
  • Regression Model 4: Optimizable GPR outperforms other models for vertical time (VT)
The optimized hyperparameters for the best performing ML Models that were used to train the drone energy model are presented in Table 5. The performance of these ML models can be found in Table 6. The model parameters for the input variables of the drone energy model, some of which are indicated as “user selections” in Figure 3, are noted in Table 7.
In a previous work [26], the battery consumption rate (BCR) was calculated using data from flight tests with DJI Mavic 3, Heavy Lift Cargo, and Phantom 4 Pro+ drones. The rate at which battery charge decreased per minute during flight was measured and a linear relationship between battery charge decrease and payload increase. In this work, through the proposed drone energy model, we calculated the required battery charge level of drones for completion of each delivery, taking into account the impact of payload, as well as take-off and landing.
Results for the vertical energy and time calculations produced by the drone energy model trained on real data are provided in Figure 7a and Figure 7b, respectively. Likewise, the energy and time calculations for horizontal flights can be found in Figure 8a and on Figure 8b. The high accuracy of the model’s performance is evident in these graphs, where the real data and model output align closely, with minimal variations. Each response shown in these figures represents the ML model’s output based on input parameters, including horizontal and vertical distances, horizontal and vertical speeds, and the presence or absence of a payload for package delivery. The difference between the real data and the ML model’s predictions is quantified using the Normalized Root Mean Square Error (NRMSE) to enable meaningful comparisons in terms of real data values.
In the drone energy model, a balanced strategy is employed to ensure equitable distribution of battery energy among the fleet of drones. This method prevents any single drone from depleting its battery while others still have excess energy, thereby optimizing overall fleet performance and longevity. In Figure 9, the required battery levels for varying drone fleet sizes and varying numbers of truck stops is calculated to complete the delivery plan for Tuesday, which consists of 30 customer deliveries. A battery requirement over 100% is indicated as infeasible. Simulations for Tuesday indicate that delivering to all customer locations with a single drone is not feasible, regardless of the number of truck stops. Even when employing all three drones, their batteries deplete if the truck remains stationary at one stop. The approach of balancing battery use across multiple drones is evident in Figure 9, where two drones (D2-1 and D2-2) have battery levels similar to those of three drones (D3-1, D3-2, and D3-3).

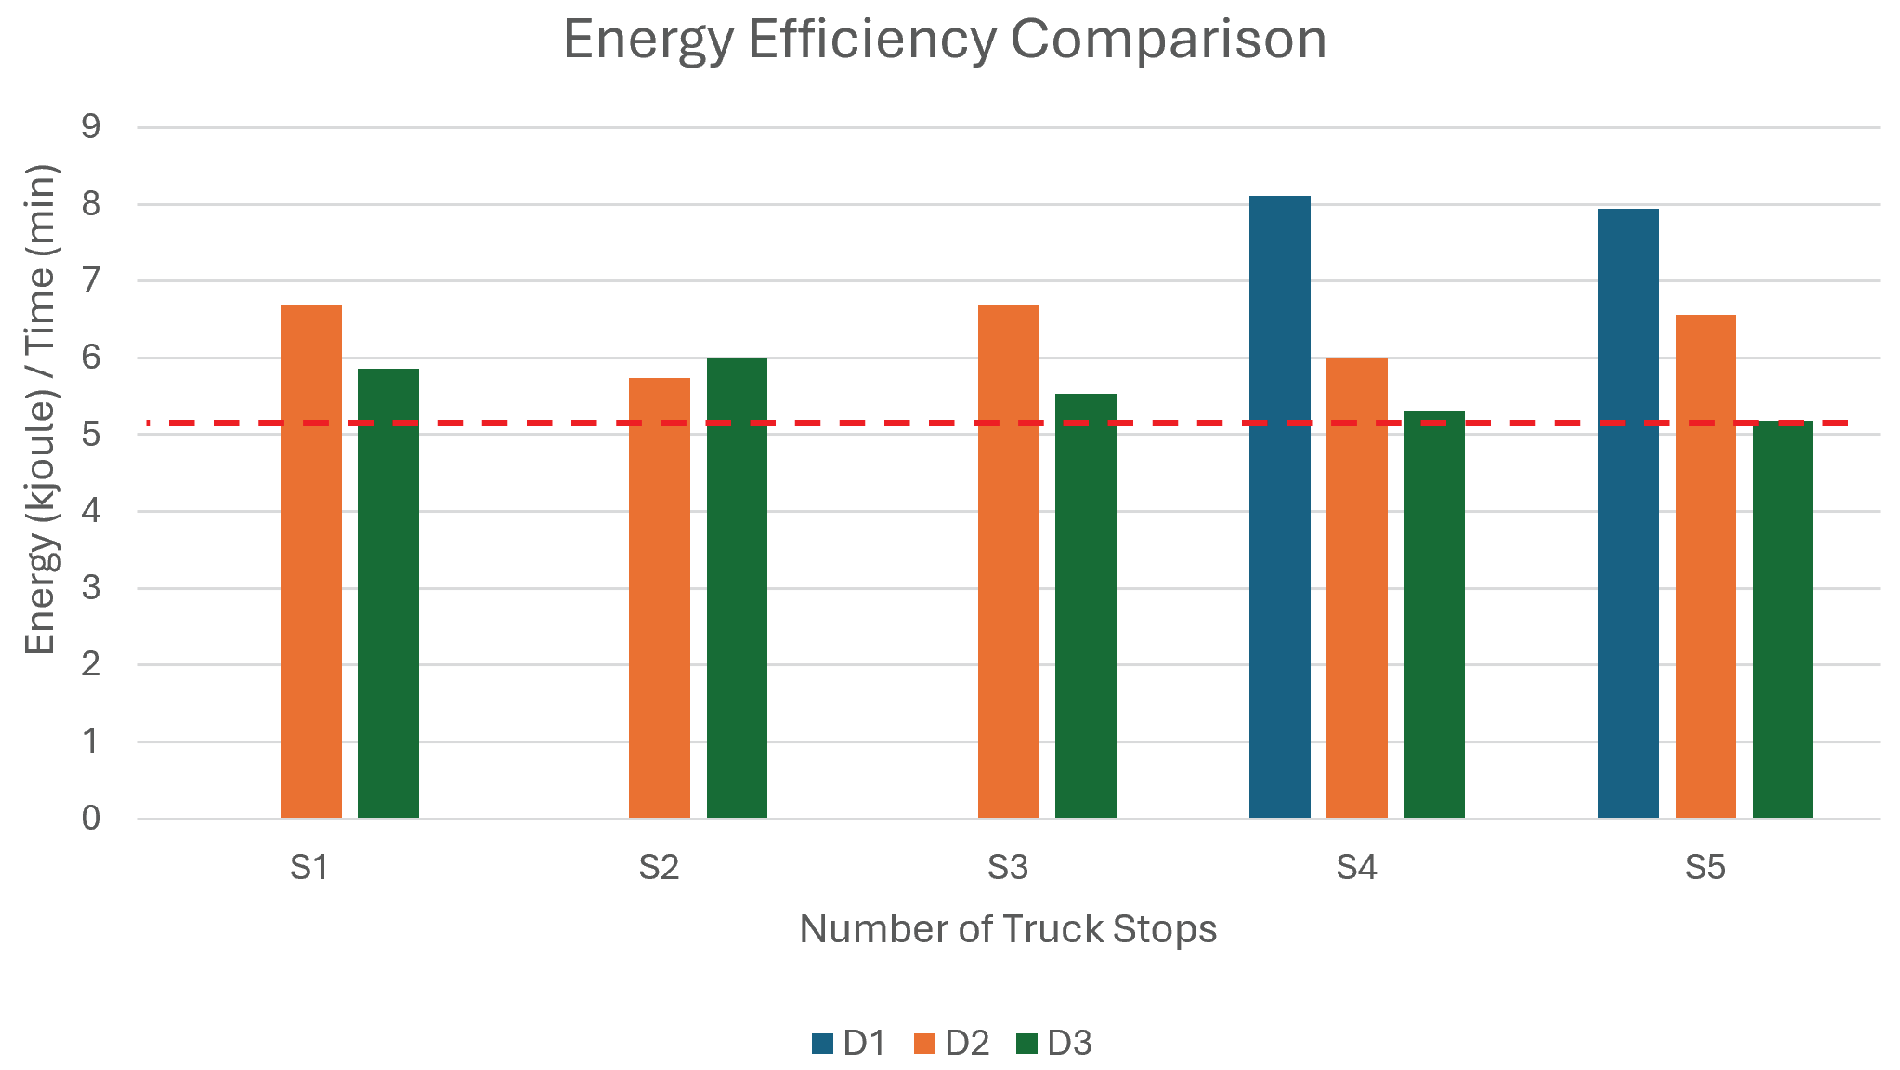
6.2. TDCD Simulation Results

A total of 93 simulation scenarios were run in MATLAB for 7 days, with varying numbers of truck stops and different fleet sizes. The simulation parameters are presented in Table 8. The payload and horizontal speed are determined as the average of the minimum and maximum values specified in the drone flight dataset [30], while the vertical speed is chosen based on the value provided in the same dataset. The vertical distance, or altitude, is set to an energy-efficient level that ensures the delivery needs are met in a residential area characterized by the absence of high-rise buildings. The number of drones and truck stops was incrementally increased during the simulations to evaluate the delivery time and energy requirements to complete the daily delivery scenarios. Based on the size of the delivery area, it is observed that a maximum of three drones and five truck stops will suffice. There was only one truck used in the delivery simulations to keep the focus on the drone fleet. The number of customer locations is the total number of households that order online, as assumed in the delivery dataset (Section 3.1).
Figure 10 shows the feasible and infeasible delivery simulations. The blank boxes in the table indicate infeasible delivery scenarios, given the distance from the truck stop to the customer delivery locations and the required battery levels of the drones, whereas the boxes with checkmarks indicate feasible delivery scenarios for the given delivery plan of the day. A total of 37 out of 93 scenarios (40%) were determined to be infeasible, meaning the drone battery level does not provide sufficient energy for the delivery without a recharge.
Figure 11 presents the clusters, customer locations, and truck stops plotted in polar coordinates for the Monday delivery plan for a total of 16 customer delivery locations. Figure 12 shows the path the truck takes to visit the five distance-optimal stops to launch the drones to the customer locations planned for Monday.
The results of the simulations conducted over a one-week period indicate a significant reduction in delivery time with the addition of an extra drone to the delivery fleet Figure 13. The introduction of a second drone reduces the delivery time by approximately 50% (Figure 13). However, the addition of a third drone yields a reduction in delivery time at a diminished rate of approximately 30%. The average delivery time for a single parcel ranges from a maximum of 101 s with one drone launched at one truck stop, to a minimum of 24 s with three drones launched at five stops (Figure 13).
The energy calculations were performed for the total week’s deliveries and for an average delivery. Only the delivery simulations, where the energy of the drone fleet would be sufficient to complete the delivery scenario, were considered in energy calculations. The plot of total energy consumption in Figure 14 presents the total of drone and truck energy and shows that delivery with one drone would not be possible unless the truck visits four different stops to launch the drone. Delivery with three drones consumes more energy with two truck stops and three truck stops, whereas it becomes more energy efficient compared to a two-drone fleet with one stop, four stops, and five stops. However, the linear increase in energy consumption with an increased number of truck stops does not reflect the trend in individual delivery scenarios. The total delivery energy increases with the number of truck stops due to the coverage of more feasible delivery scenarios as the number of stops increases and size of the drone fleet expands. Figure 14 shows the average total energy (drone+truck) required to perform one delivery. The energy consumption of the truck is calculated using distance measurements from Google Maps (https://maps.google.ca/, accessed on 5 March 2025) and the average speed and average energy consumption specifications of the Fiat Ducatio BEV model as stated in Section 3.2. A specific delivery scenario for Monday delivery data is plotted in Figure 15 for a better understanding of the relationship between the energy consumption and number of stops. We selected the Monday delivery scenario for representation because it features a reasonably complex structure, comprising 16 deliveries, 3 drones, and 5 stops. As seen in this plot, energy consumption declines with an increased number of truck stops, bringing the drones closer to customer locations. In such a case, the truck;s travel distance is increased, as plotted in the diagram.
Finally, energy efficiencies of multiple delivery scenarios are compared in Figure 16. Energy efficiency is calculated as the total vehicle energy consumed to perform the total deliveries (for one week) over the total time spent to complete the deliveries. This comparison allows for the selection of fleet resources to achieve the most energy-efficient delivery. Of all the simulations conducted in this study, the scenario involving deliveries with three drones at five truck stops prove to be the most energy-efficient, consuming 5.2 kJoule/min.

7. Conclusions

This study presents a holistic and data-driven approach to truck–drone collaboration, bridging the gap between theoretical models and real-world applications. By leveraging machine learning and battery energy considerations, we offer an AI engine framework that supports operational decisions, mainly with respect to fleet optimization. By leveraging the SOFM machine learning algorithm, we identified distance-optimal truck stops for a residential setting with realistic synthetic delivery data. We then proposed a machine learning-based drone energy model that optimizes battery usage without the need for charging facilities to complete a delivery scenario and ran 93 delivery simulations in MATLAB for one week’s data. Our comprehensive simulations identified delivery scenarios that would be infeasible without recharging of the drones. Our findings demonstrate that deploying three drones at five truck stops results in the most energy-efficient delivery scenario, consuming 5.2 kJ/min, whereas deploying one drone at four stops yields the least energy-efficient outcome, consuming 8.1 kJ/min. However, it should be noted that the results are delivery-dependent, and the approach taken in this study represents the primary contribution towards the achievement of time- and energy-efficient TDCD systems.
The immediate market adoption of this approach may face certain limitations, primarily due to the lack of consideration of complex urban environments. Factors such as parking restrictions, dynamic traffic patterns, and high-rise buildings could significantly impact the feasibility of implementation. Additionally, the absence of real-world operational logistics data may hinder the refinement of predictive models and decision-making processes, limiting the framework’s adaptability to practical deployment scenarios.
One promising direction involves scaling this approach to larger and more complex urban environments, where increased delivery density and dynamic traffic patterns may influence optimal truck-stop placement and drone deployment strategies. Further studies could integrate real-world data from operational logistics networks to refine the AI engine framework, enhancing its adaptability to various delivery conditions. Additionally, incorporating advanced machine learning techniques such as reinforcement learning or deep learning could improve decision-making models, allowing fleets to autonomously adjust routes and energy consumption based on real-time demand fluctuations.
As autonomous logistics continue to evolve, developing intelligent, self-optimizing systems will be critical for improving sustainability, responsiveness, and cost-effectiveness in fleet management. The insights gained from this research have the potential to inform future advancements in drone-based logistics, enabling more adaptive and cost-effective delivery strategies. By expanding on the foundation set in this study, future work can push the boundaries of AI-driven logistics, making drone-assisted deliveries more viable and scalable in urban and rural landscapes alike.

Author Contributions

Conceptualization, D.C., M.S. and B.K.; methodology, D.C., M.S., B.K.; software, D.C.; validation, M.S.; formal analysis, B.K.; investigation, D.C.; resources, B.K.; data curation, D.C. and M.S; writing—original draft preparation, D.C. and M.S.; writing—review and editing, B.K.; visualization, D.C. and M.S; project administration, B.K.; funding acquisition, B.K. All authors have read and agreed to the published version of the manuscript.

Funding

This research was funded in part by the Natural Sciences and Engineering Research Council (NSERC) of Canada under the DISCOVERY and CREATE TRAVERSAL programs, and in part by Ontario Research Fund-Research Excellence (ORF-RE) under grant number RE 12-026.

Data Availability Statement

Dataset available on request from the authors.

Conflicts of Interest

The authors declare no conflicts of interest.

References

  1. Rosenberg, L.N.; Balouka, N.; Herer, Y.T.; Dani, E.; Gasparin, P.; Dobers, K.; Rüdiger, D.; Pättiniemi, P.; Portheine, P.; van Uden, S. Introducing the shared micro-depot network for last-mile logistics. Sustainability 2021, 13, 2067. [Google Scholar] [CrossRef]
  2. Boysen, N. Scheduling last-mile deliveries with truck-based autonomous robots. Eur. J. Oper. Res. 2018, 271, 1085–1099. [Google Scholar] [CrossRef]
  3. Rave, A.; Fontaine, P.; Kuhn, H. Drone location and vehicle fleet planning with trucks and aerial drones. Eur. J. Oper. Res. 2023, 308, 113–130. [Google Scholar] [CrossRef]
  4. Wu, G.; Fan, M.; Shi, J.; Feng, Y. Reinforcement Learning Based Truck-and-Drone Coordinated Delivery. IEEE Trans. Artif. Intell. 2023, 4, 754–763. [Google Scholar] [CrossRef]
  5. Bacanli, S.S.; Cimen, F.; Elgeldawi, E.; Turgut, D. Placement of Package Delivery Center for UAVs with Machine Learning. In Proceedings of the 2021 IEEE Global Communications Conference (GLOBECOM), Madrid, Spain, 7–11 December 2021; pp. 1–6. [Google Scholar] [CrossRef]
  6. Bi, Z.; Guo, X.; Wang, J.; Qin, S.; Liu, G. Truck-Drone Delivery Optimization Based on Multi-Agent Reinforcement Learning. Drones 2024, 8, 27. [Google Scholar] [CrossRef]
  7. Chen, E.; Zhou, Z.; Li, R.; Chang, Z.; Shi, J. The multi-fleet delivery problem combined with trucks, tricycles, and drones for last-mile logistics efficiency requirements under multiple budget constraints. Transp. Res. Part E Logist. Transp. Rev. 2024, 187, 103573. [Google Scholar] [CrossRef]
  8. Figliozzi, M.; Hadas, Y. Drone-Truck Fleet Allocation Policies for Courier Deliveries. In Decision Sciences; Juan, A.A., Faulin, J., Lopez-Lopez, D., Eds.; Springer: Cham, Switzerland, 2025; pp. 269–280. [Google Scholar]
  9. Thomas, T.; Srinivas, S.; Rajendran, C. Collaborative truck multi-drone delivery system considering drone scheduling and en route operations. Ann. Oper. Res. 2023, 339, 693–739. [Google Scholar] [CrossRef]
  10. Arishi, A.; Krishnan, K.; Arishi, M. Machine learning approach for truck-drones based last-mile delivery in the era of industry 4.0. Eng. Appl. Artif. Intell. 2022, 116, 105439. [Google Scholar] [CrossRef]
  11. Cicek, D.; Simsek, M.; Kantarci, B. Green and Intelligent Planning of Drone Launch in Truck-Drone Collaborative Delivery. In Proceedings of the 2024 IEEE 10th World Forum on Internet of Things (WF-IoT), Ottawa, ON, Canada, 10–13 November 2024; pp. 1–6. [Google Scholar] [CrossRef]
  12. Liu, Z.; Sengupta, R.; Kurzhanskiy, A. A power consumption model for multi-rotor small unmanned aircraft systems. In Proceedings of the 2017 international conference on unmanned aircraft systems (ICUAS), Miami, FL, USA, 13–16 June 2017; pp. 310–315. [Google Scholar]
  13. Bezzo, N.; Mohta, K.; Nowzari, C.; Lee, I.; Kumar, V.; Pappas, G. Online planning for energy-efficient and disturbance-aware uav operations. In Proceedings of the 2016 IEEE/RSJ International Conference on Intelligent Robots and Systems (IROS), Daejeon, Republic of Korea, 9–14 October 2016; pp. 5027–5033. [Google Scholar]
  14. Troudi, A.; Addouche, S.A.; Dellagi, S.; Mhamedi, A.E. Sizing of the drone delivery fleet considering energy autonomy. Sustainability 2018, 10, 3344. [Google Scholar] [CrossRef]
  15. Abdilla, A.; Richards, A.; Burrow, S. Power and endurance modelling of battery-powered rotorcraft. In Proceedings of the 2015 IEEE/RSJ international Conference on Intelligent Robots and Systems (IROS), Hamburg, Germany, 28 September–2 October 2015; pp. 675–680. [Google Scholar]
  16. Murray, C.C.; Chu, A.G. The flying sidekick traveling salesman problem: Optimization of drone-assisted parcel delivery. Transp. Res. Part C Emerg. Technol. 2015, 54, 86–109. [Google Scholar] [CrossRef]
  17. Roberti, R.; Ruthmair, M. Exact methods for the traveling salesman problem with drone. Transp. Sci. 2021, 55/2, 315–335. [Google Scholar] [CrossRef]
  18. Rinaldi, M.; Primatesta, S.; Bugaj, M.; Rostáš, J.; Guglieri, G. Development of Heuristic Approaches for Last-Mile Delivery TSP with a Truck and Multiple Drones. Drones 2023, 7, 407. [Google Scholar] [CrossRef]
  19. Najy, W.; Archetti, C.; Diabat, A. Collaborative truck-and-drone delivery for inventory-routing problems. Transp. Res. Part C Emerg. Technol. 2023, 146, 103791. [Google Scholar] [CrossRef]
  20. Peng, K.; Du, J.; Lu, F.; Sun, Q.; Dong, Y.; Zhou, P.; Hu, M. A hybrid genetic algorithm on routing and scheduling for vehicle-assisted multi-drone parcel delivery. IEEE Access 2019, 7, 49191–49200. [Google Scholar] [CrossRef]
  21. Liu, Y.; Liu, Z.; Shi, J.; Wu, G.; Pedrycz, W. Two-echelon routing problem for parcel delivery by cooperated truck and drone. IEEE Trans. Syst. Man, Cybern. Syst. 2020, 51, 7450–7465. [Google Scholar] [CrossRef]
  22. Baldisseri, A.; Siragusa, C.; Seghezzi, A.; Mangiaracina, R.; Tumino, A. Truck-based drone delivery system: An economic and environmental assessment. Transp. Res. Part D Transp. Environ. 2022, 107, 103296. [Google Scholar] [CrossRef]
  23. Dukkanci, O.; Campbell, J.F.; Kara, B.Y. Facility location decisions for drone delivery with riding: A literature review. Comput. Oper. Res. 2024, 167, 106672. [Google Scholar] [CrossRef]
  24. Zhou, L.; Silva, D.F.; Smith, A.E. Locating Drone Stations for a Truck-Drone Delivery System in Continuous Space. IEEE Trans. Evol. Comput. 2023, 29, 158–171. [Google Scholar] [CrossRef]
  25. Salama, M.R.; Srinivas, S. Collaborative truck multi-drone routing and scheduling problem: Package delivery with flexible launch and recovery sites. Transp. Res. Part E Logist. Transp. Rev. 2022, 164, 102788. [Google Scholar] [CrossRef]
  26. Mishra, D.; Tiwari, M.K. Integrated truck drone delivery services with an optimal charging stations. Expert Syst. Appl. 2024, 254, 124254. [Google Scholar] [CrossRef]
  27. Novotná, M.; Švadlenka, L.; Jovčić, S.; Simić, V. Micro-hub location selection for sustainable last-mile delivery. PLoS ONE 2022, 17, e0270926. [Google Scholar] [CrossRef] [PubMed]
  28. Leyerer, M.; Sonneberg, M.O.; Heumann, M.; Breitner, M.H. Shortening the last mile in urban areas: Optimizing a smart logistics concept for e-grocery operations. Smart Cities 2020, 3, 585–603. [Google Scholar] [CrossRef]
  29. Balassa, B.E.; Koteczki, R.; Lukács, B.; Buics, L. Sustainability Aspects of Drone-Assisted Last-Mile Delivery Systems—A Discrete Event Simulation Approach. Energies 2023, 16, 4656. [Google Scholar] [CrossRef]
  30. Rodrigues, T.A.; Patrikar, J.; Choudhry, A.; Feldgoise, J.; Arcot, V.; Gahlaut, A.; Lau, S.; Moon, B.; Wagner, B.; Matthews, H.S.; et al. In-flight positional and energy use data set of a DJI Matrice 100 quadcopter for small package delivery. Sci. Data 2021, 8, 155. [Google Scholar] [CrossRef] [PubMed]
  31. Kohonen, T. The self-organizing map. Proc. IEEE 1990, 78, 1464–1480. [Google Scholar] [CrossRef]
  32. Simsek, M.; Kantarci, B.; Boukerche, A. Utility-aware legitimacy detection of mobile crowdsensing tasks via knowledge-based self organizing feature map. IEEE Trans. Mob. Comput. 2021, 22, 3706–3723. [Google Scholar] [CrossRef]
  33. Simsek, M.; Kantarci, B. Artificial intelligence-empowered mobilization of assessments in COVID-19-like pandemics: A case study for early flattening of the curve. Int. J. Environ. Res. Public Health 2020, 17, 3437. [Google Scholar] [CrossRef]
  34. Cicek, D.; Simsek, M.; Kantarci, B. AI-Driven Attack Modeling and Defense Strategies in Mobile Crowdsensing: A Special Case Study on Fake Tasks. In Mobile Crowdsourcing: From Theory to Practice; Springer: Berlin, Germany, 2023; pp. 275–297. [Google Scholar]
  35. Shahbazi, M.; Simsek, M.; Kantarci, B. Density-Based Clustering and Performance Enhancement of Aeronautical Ad Hoc Networks. In Proceedings of the 2022 International Balkan Conference on Communications and Networking (BalkanCom), Sarajevo, Bosnia and Herzegovina, 22–24 August 2022; pp. 51–56. [Google Scholar] [CrossRef]
Figure 1. Scope of work in this study.
Electronics 14 02026 g001
Figure 2. System model with block representations and input–output relationships.
Electronics 14 02026 g002
Figure 3. Integration of the delivery information, drone energy model, and SOFM algorithm within the AI engine.
Electronics 14 02026 g003
Figure 4. Simulated delivery area in OpenStreetMap.
Electronics 14 02026 g004
Figure 5. Drone energy model with data flow and input–output representations.
Electronics 14 02026 g005
Figure 6. Drone trajectory sample at 50 m altitude for the post-processing stage.
Electronics 14 02026 g006
Figure 7. Vertical energy and time sample results.
Electronics 14 02026 g007
Figure 8. Horizontal energy and time sample results.
Electronics 14 02026 g008
Figure 9. Required battery levels for drones to complete the Tuesday delivery scenario.
Electronics 14 02026 g009
Figure 10. Feasibility analysis of the TDCD simulation results.
Electronics 14 02026 g010
Figure 11. Clustering of Monday delivery locations.
Electronics 14 02026 g011
Figure 12. Truck route covering 5 stops on Monday.
Electronics 14 02026 g012
Figure 13. Weekly delivery times across different fleet sizes and numbers of truck stops. (a) Weekly drone delivery time (minutes). (b) Weekly average parcel delivery time (seconds).
Electronics 14 02026 g013
Figure 14. Energy consumption under varying fleet sizes and numbers of truck stops.
Electronics 14 02026 g014
Figure 15. Total energy for Monday deliveries.
Electronics 14 02026 g015
Figure 16. Energy efficiency comparison for varying fleet sizes and numbers of truck stops.
Electronics 14 02026 g016
Table 1. Research gap: comparison of our work with the literature. (“✓” states the topic is addressed, “X” states the topic is not addressed by the listed research).
PublicationYearRealistic
Delivery Data
Truck-Stop
Setting
Machine
Learning
Drone Battery
Management
Fleet
Sizing
Drone Sched. and
Routing
Bi et al. [6]2024XXX
Wu et al. [4]2023XXX
Figliozzi and Hadas [8]2025XXXX
Arishi et al. [10]2022XXXX
Bacanli et al. [5]2021XXX
Chen et al. [7]2024XXXX
Thomas et al. [9]2023XXXX
This Article2025
Table 2. Truck vehicle specifications [29].
Truck ModelFiat Ducatio BEV
3.5t LH2 122LE
Av Speed (per WLTP*)46.6 km/h
Operating distance (empty)357 km
Operating distance (full)317 km
Fuel tank/battery capacity79 kWh
Energy consumption (empty)221.29 Wh/km
Energy consumption (full)249.21 Wh/km
Payload capacity764.1 kg
CO2 emission (empty)0.083 kgCO2/km
CO2 emission (full)0.094 kgCO2/km
Table 3. Drone vehicle specifications.
Drone ModelDJI MATRICE 100
Weight2431 g
Max takeoff weight3600 g
Max speed (no payload)17 m/s (GPS mode)
Drone battery modelTB48D
Voltage22.8 V
Capacity5.7 A/h
Energy467.856 kJoule
Table 4. Notation table.
NotationDescriptionValue
d v Distance_vertical15 m
d h Distance_horizontalSOFM output
s v Speed_vertical2 m/s
s h Speed_horizontal8 m/s
w 0 Weight_emptyno load
w p Weight_loaded250 g
DEDelivery EnergyTotal energy to complete the delivery (kjoule)
VEVertical EnergyEnergy for take-off and landing (kjoule)
HEHorizontal EnergyEnergy cruising to and from delivery location (kjoule)
DTDelivery TimeTotal delivery time (s)
HTHorizontal TimeTime spent to and from delivery location (s)
VTVertical TimeTime spent for take-off and landing (s)
Table 5. Optimized hyperparameters for the best performing ML models to train the drone energy model.
Optimized Hyperparameters
Optimizable GPR (HE)Optimizable GPR (HT)Optimizable GPR (VT)Optimizable Ensemble (VE)
Basic Function: ConstantBasic Function: LinearBasic Function: LinearEnsemble Method: LSBoost
Kernel Function: Isotropic Squared ExponentialKernel Function: Nonisotropic Rational QuadraticKernel Function: Nonisotropic Matern 5/2Minimum Leaf Size: 5
Kernel Scale: 0.0019163Kernel Scale: 0.078043Kernel Scale: 19.2427Number of Learners: 63
Sigma: 287.3044Sigma: 0.327Sigma: 0.00035812Learning Rate: 0.26978
Standardized Data: YesStandardized Data: YesStandardized Data: NoNumber of Predictors to Sample: 3
Table 6. Performance of the ML models for the output variables.
Performance of the ML Models
Model NameNRMSE_TrainNRMSE_Test
Optimizable GPR (HE)0.01149040.0123111
Optimizable GPR (HT)0.00738210.0079420
Optimizable GPR (VT)0.00013870.1012344
Optimizable Ensemble (VE)0.02026530.0328060
Table 7. Drone energy model parameters for the input variables.
Model Parameters (Min–Max)
Input VariableTraining SetTest Set
Payload0–500 gr0–500 gr
Speed4–12 m/s4–12 m/s
Vertical Distance4.63737 m–203.51263 m4.78525 m–202.1286 m
Horizontal Distance7.020779 m–364.1334 m7.12777 m–362.0462 m
Table 8. TDCD simulation parameters.
Simulation ParameterValue
Payload (p)250 g
Horizontal speed ( s h )8 m/s
Vertical speed ( s v )2 m/s
Vertical distance (altitude) ( d v )15 m
Number of drones ( D j )j ∈ 0, 1, 2, 3
Number of truck stops ( S i )i ∈ {1, 2, …, 5}
Number of trucks ( T m )m = 1
Number of customer locations ( N k )k ∈ {1, 2, …, 143}
Disclaimer/Publisher’s Note: The statements, opinions and data contained in all publications are solely those of the individual author(s) and contributor(s) and not of MDPI and/or the editor(s). MDPI and/or the editor(s) disclaim responsibility for any injury to people or property resulting from any ideas, methods, instructions or products referred to in the content.

