Article

Insulation Defect Diagnosis Using a Random Forest Algorithm with Optimized Feature Selection in a Gas-Insulated Line Breaker

by
Gyeong-Yeol Lee
and
Gyung-Suk Kil
*
Department of Electrical and Electronics Engineering, Korea Maritime and Ocean University, Busan 49112, Republic of Korea
*
Author to whom correspondence should be addressed.
Electronics 2025, 14(10), 1940; https://doi.org/10.3390/electronics14101940
Submission received: 1 April 2025 / Revised: 1 May 2025 / Accepted: 8 May 2025 / Published: 9 May 2025
(This article belongs to the Special Issue Fault Detection Technology Based on Deep Learning)

Abstract

:
Fault diagnosis based on the partial discharge (PD) recognition has been widely applied on a gas-insulated line breaker (GILB) and gas-insulated switchgear (GIS) as a reliable online condition monitoring method. This paper dealt with insulation defect diagnosis based on a Random Forest (RF) algorithm with an optimized feature selection method. Four different types of insulation defect models, such as the free-moving particle (FMP) defect, the protrusion-on-conductor (POC) defect, the protrusion-on-enclosure (POE) defect, and the delamination defect, were prepared to simulate representative PD single pulses and PRPD patterns generated from the GILB. The PD signals generated from defect models were detected using the PRPD sensor which can detect phase-synchronized PD signals with the applied high-voltage (HV) signals without the need for additional equipment. Various statistical PD features were extracted from PD single pulses and PRPD patterns according to four kinds of PD defect models, and optimized features were selected with respect to variance importance analysis. Two kinds of PD datasets were established using all statistical features and top-ranked features. From the experimental results, the RF algorithm achieved accuracy rates exceeding 92%, and the PD datasets using only half of the statistical PD features could reduce the computational times while maintaining the accuracy rates.

1. Introduction

A GILB and a GIS have been widely used in electrical distribution systems for more than 40 years due to their operational stability and liability, excellent insulation performance, and compact structures [1,2]. They protect, control, and isolate power apparatus in the case of electrical accidents. When accidents occur in the GILB, the impacts may be huge, and a lot of time and cost may be spent on recovery. According to various operation experiences, a lot of in-service failures are related to insulation defects in the GILB and GIS [3]. Despite extensive efforts to prevent insulation faults caused by unexpected small metallic particles and vibrations or impacts during manufacturing, installation, and operation, tiny defects may still be present in the power equipment. These metallic particles can concentrate the electric fields in the insulation system, resulting in PD generation. The PD, which is a localized dielectric breakdown under HV conditions, can lead to the degradation of the electrical insulation system and eventually system failure [4]. Therefore, insulation condition monitoring using PD detection can reduce a lot of time and cost for maintenance work [5,6].
The PD detection techniques consist of the electrical detection method based on the IEC 60,270 [7] and non-electrical detection methods based on IEC 62,478 such as acoustic emission (AE) and ultra-high-frequency (UHF) methods [8]. The electrical detection method uses a coupling capacitor (CC), which can measure the quantification of PDs and has output measurements in terms of picocoulombs (pC) with high precision. However, there is still a significant challenge in installing a sufficient capacity coupling capacitor for quantitative measurements in the field measurements, particularly for diagnosing power equipment [9,10]. To overcome the shortage, alternative non-electrical detection methods have been increasingly developed with excellent sensitivity and signal-to-noise (S/N) ratio in the high-frequency range [11]. The AE method has been widely used in power equipment for its low price and easy installation compared to other sensors [12,13]. The UHF method has been adapted to the PD measurement standard of GIS by detecting electromagnetic (EM) waves induced by the PD pulses originating from insulation defects with a high-frequency range from 300 kHz to 3 GHz [6]. These alternative methods have various advantages, such as fault location estimation based on the time of flight (TOF) techniques and continuous condition monitoring in on-site measurement [14,15]. Despite these advantages, the alternative nonconventional methods still have the following limitations: the output magnitudes cannot be calibrated in terms of pC, and the signal distortions caused by the complex internal structures of power equipment must be considered [10,15,16]. Moreover, in terms of PRPD analysis, which is the most frequently used in online PD identification, those alternative detection methods need additional synchronization devices since they could not obtain phase information of the applied voltages.
Among various PD detection techniques, single-pulse analysis and PRPD analysis have been applied to the identification and classification of PD defects. Especially, the PRPD pattern analysis, which interprets repetition rates (n), amplitudes (q), and phase angles (ϕ) of PDs under alternative current (AC) conditions, is widely used for insulation condition monitoring of the gas-insulated equipment [17,18,19,20]. Since the accuracy of identification and classification of the types of insulation defects using PRPD pattern recognition is highly dependent on phase information, especially zero-crossing (ZC) points, it is essential to synchronize PD signals with the phase angles of the applied HV signals. However, in many field PD measurement cases, there are a lot of challenges in obtaining accurate phase information of the applied HV signals to identify and classify the types of insulation defects using PRPD pattern analysis methods. The phase difference between the applied HV signals on the power equipment and the AC 110/220 V signals used in the substations occurs as shown in Figure 1 [21,22]. Therefore, this study employed the PRPD sensor, which was embedded in the medium voltage (MV) class bushing for the acquisition of the phase-synchronized PD signals with applied HV signals without any additional synchronization devices.
Since PD pulse analysis has been highlighted as the most efficient insulation condition monitoring technique for PD identification and classification, a lot of studies have been conducted to enhance the accuracy of insulation defect recognition [23,24]. Generally, insulation defect recognition consists of two stages: (1) measuring accurate pulses and extracting distinguishable PD features, and (2) identifying and classifying using machine learning (ML) algorithms. A lot of research about insulation defect recognition using ML algorithms such as a neural network (NN), a support vector machine (SVM), and an RF have been studied.
Jing and his colleagues proposed a novel differentiable neural architecture search (DNAS) to overcome the complex manual construction limitations of the existing convolution neural network (CNN) algorithm for PD pattern recognition in GIS. They added the separable convolution considering the mixed depth-wise and self-attention mechanisms to the operations for enhancement of insulation defect recognition. They compared the accuracy of PD pattern recognition under various conditions to identify the optimal training options [25]. Wang and his colleagues proposed a new classification method for PD pattern recognition in GIS based on a generative adversarial network (GAN) and CNN using the unbalanced PD data samples. They applied a Wasserstein dual discriminator GAN to generate the equalized datasets and used decomposed hierarchical spaces for auto-optimized CNN algorithm configuration [26]. Wang and his colleagues conducted to extract the PD features from ultrasonic PD pulses in accordance with typical PD models and compared the recognition rates of the probabilistic neural network and SVM algorithms. They found that the recognition rate of SVM outperformed that of the probabilistic neural network, achieving recognition rates of over 85% [27]. Yin and his colleagues proposed a new PD pattern recognition technique based on multiple-feature fusion. They established PD datasets based on quasi-Hausdorff distance using statistical characteristics of the PRPD image and established modified CNN to compare with SVM in terms of the recognition rates. This study presented that increasing the number of PD datasets as a training set in SVM and CNN algorithm models could improve the PD recognition accuracy rates [28]. Yao and his colleagues proposed a new RF algorithm with a sequential forward selection method using the variance analysis for the optimized subset selection. The proposed method had distinguished features such as quantification of feature differences, reorder of out-of-bag (OBB) sample values, and selection of the optimal feature subsets using the sequential forward method. Based on this optimized selection method, the new RF model improved classification stability and accuracy for PD defects while effectively reducing feature dimensionality [29]. Peng and his colleagues introduced the RF algorithm-based feature extraction and selection method for PD pattern recognition in the HV cable. They extracted 34 types of PD features and constructed a lot of two- and three-dimensional features to find optimized feature combinations. They confirmed that the RF algorithm model was more effective than the back-propagation NN and SVM algorithm models for the PD feature selection [30]. Kartojo and his colleagues studied PD recognition in the power transformers using PRPD patterns based on the RF algorithm. They extracted various statistical features and analyzed their variance importance regarding the recognition accuracy. They successfully classified the PD defects with 94.44% accuracy [24]. Govindarajan and his colleagues studied a hypergraph-based improved RF algorithm by employing the recursive feature elimination (HG-RF-RFE) to identify PD sources with the minimum number of features. They found the hyper relationship among the features to reduce the redundancy of many features and could classify the PD sources with 99.8% accuracy by removing the uncorrelated features [31].
From the perspective of condition monitoring, four types of PD defect models, including the FMP defect, POC defect, POE defect, and delamination defect, were prepared to simulate PD signals from the GILB. Statistical features, such as time, frequency, physical shape, and phase distribution-based features, were systematically extracted from the PD single pulses and PRPD patterns. The variance importance of each statistical feature was analyzed to identify the top-ranked features according to their contributions to PD recognition. To assess the influence of feature selection on diagnostic accuracy, two PD datasets were constructed: one with all statistical features and one with the top 50% ranked features. The classification accuracies and computational efficiencies were compared using the two types of PD datasets.
Section 2 introduces the RF algorithm, as one of the typical ML algorithms, and statistical PD features which were used in this paper. Section 3 describes the PD simulation experimental setup and PD defect models to simulate typical types of insulation defects in GILB. Section 4 shows the PD simulation test results to extract the statistical features, such as time, frequency, physical shape, and phase distribution-based features, from each single pulse and PRPD pattern in accordance with the PD defect model, feature importances were analyzed to establish PD sub-datasets consisting of the top-ranked features. Finally, two types of PD datasets were constructed: one including all features and another consisting of the top 50% ranked features to compare the diagnosis accuracy and computational efficiencies.

2. PD Simulation Experimental Setup and Method

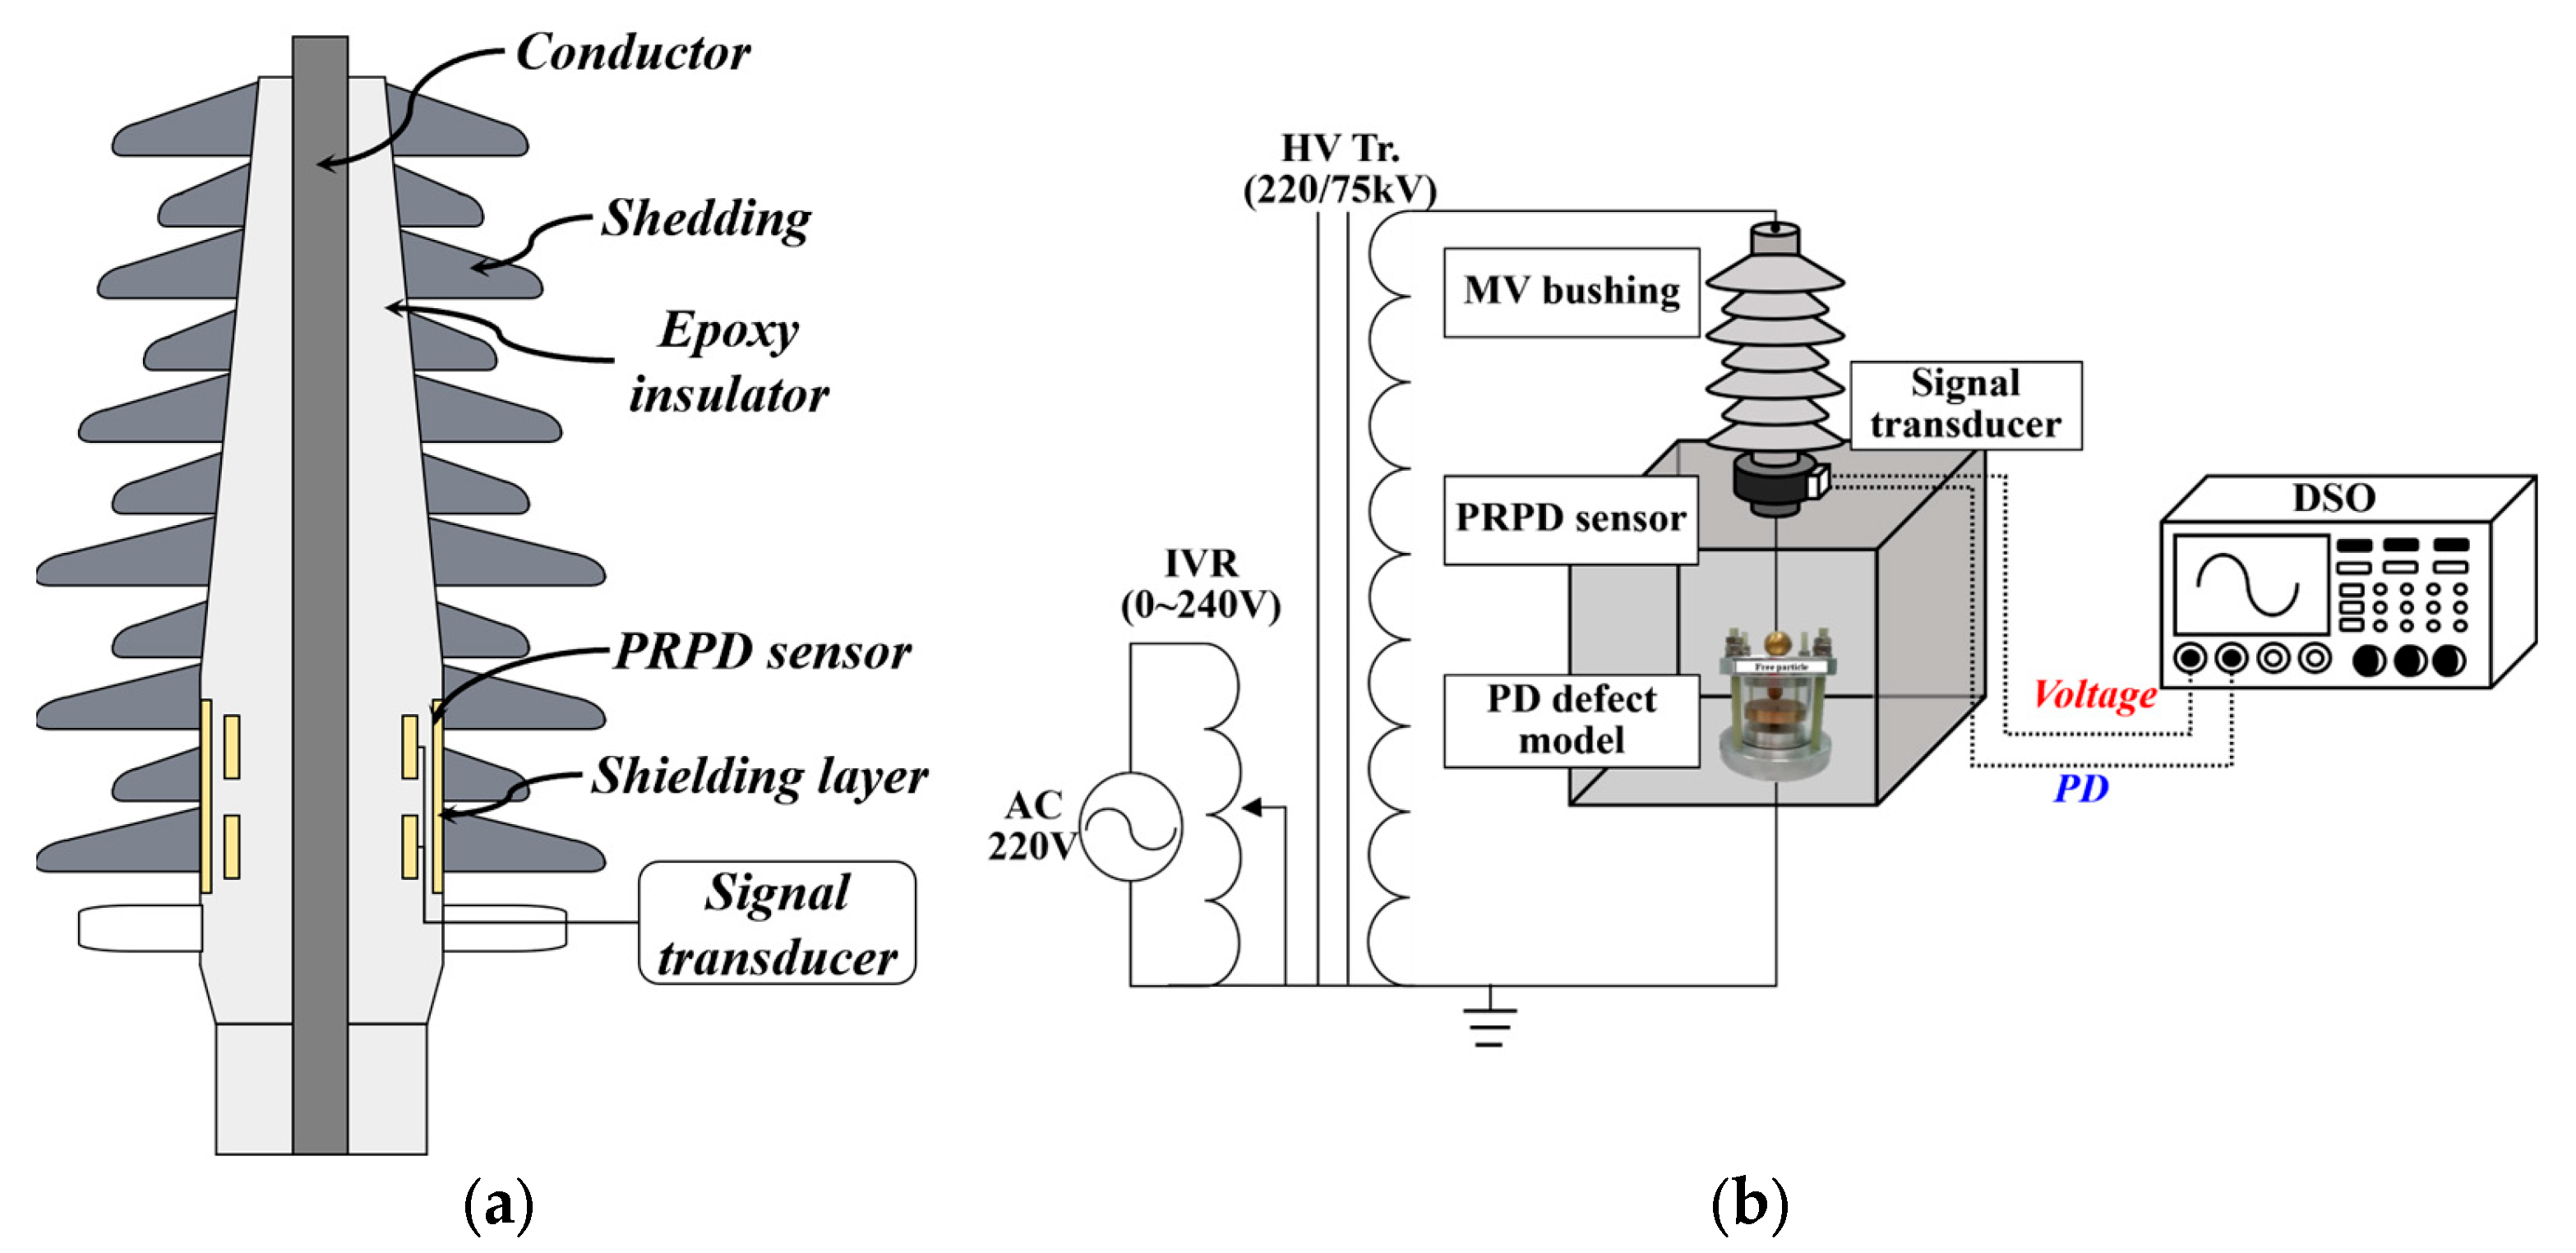
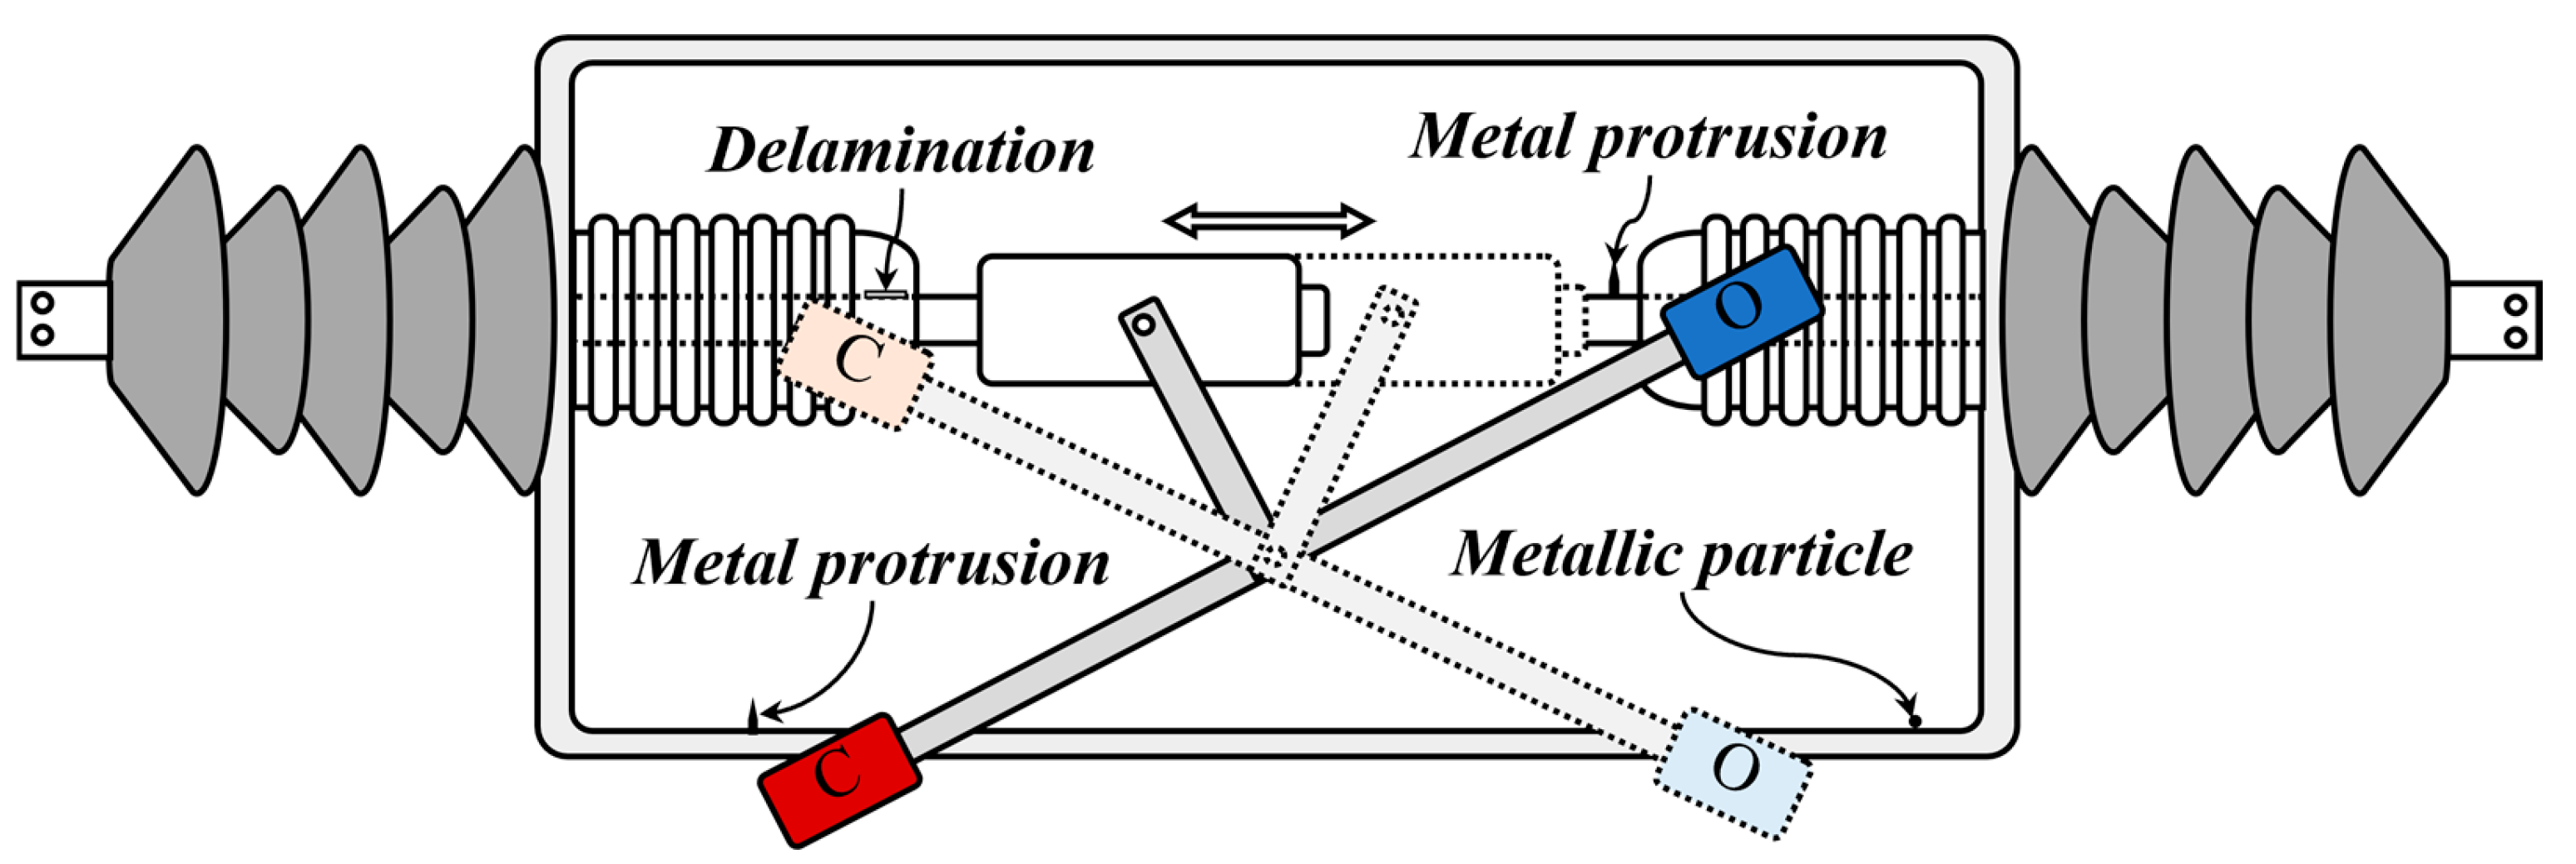
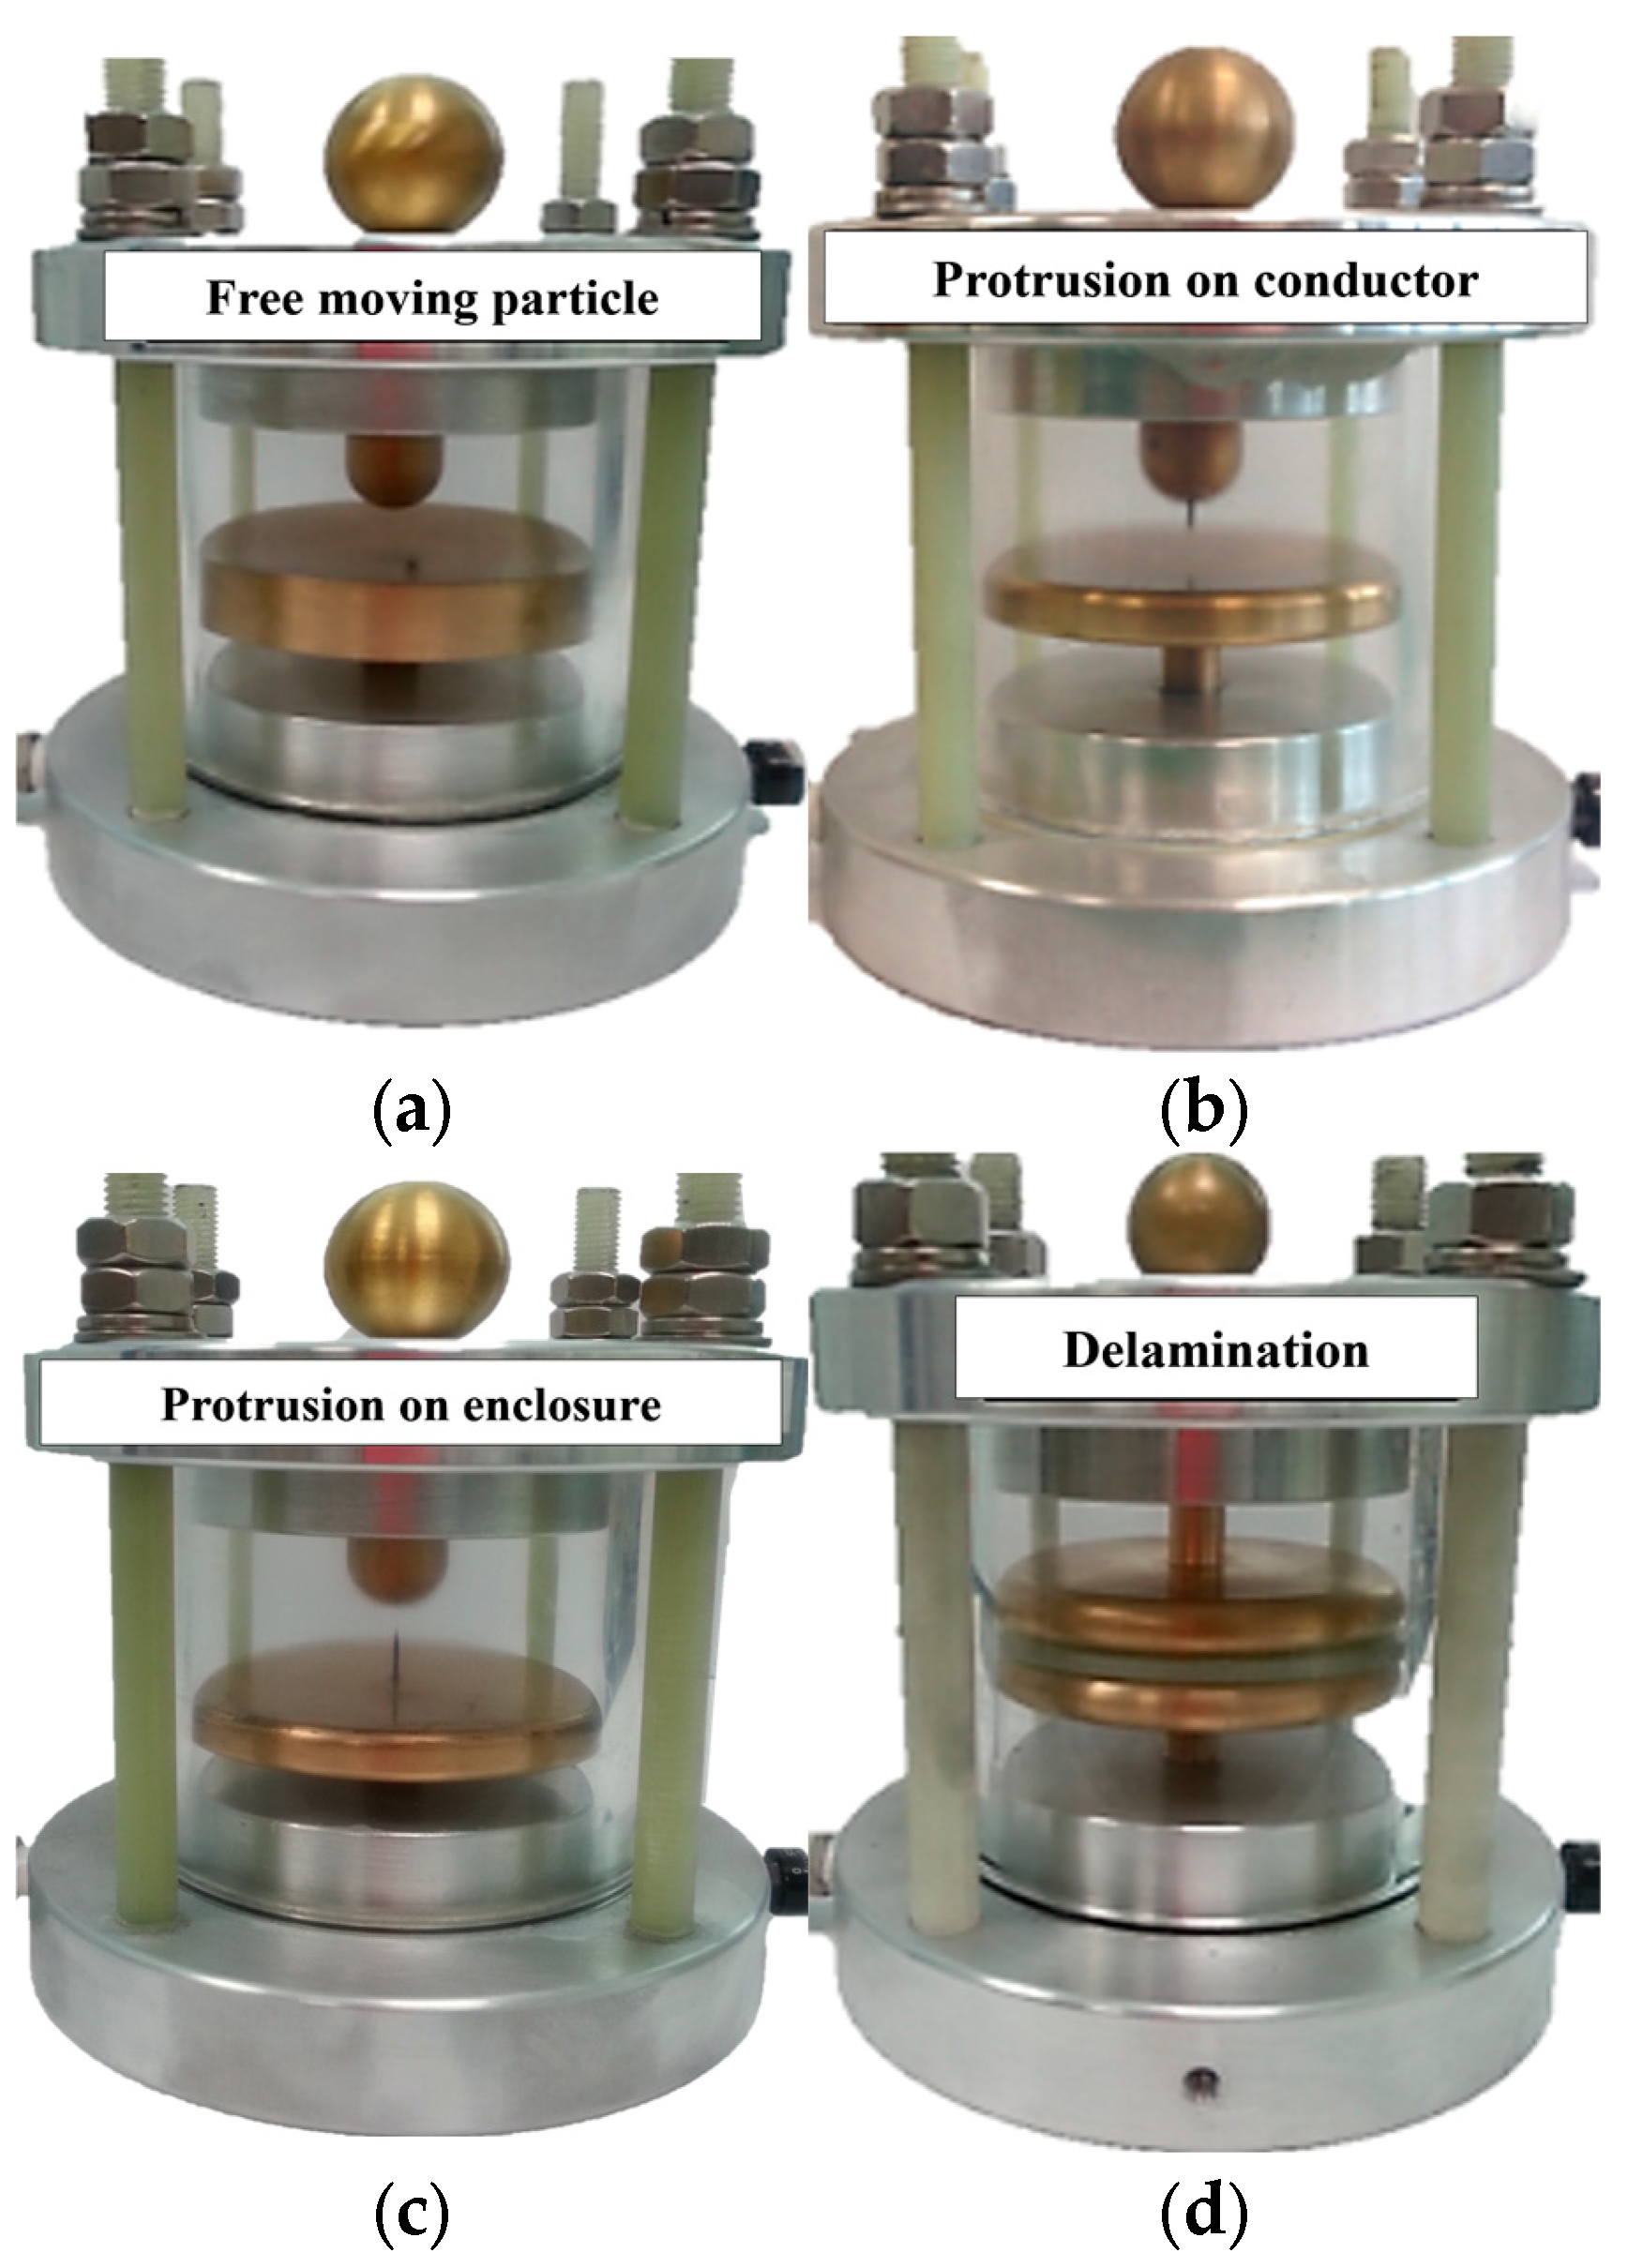
2.1. PD Simulation Test Setup

PD pattern recognition has been widely applied to predict the types of internal insulation defects in the power apparatus. As described in Section 1, it is very important to obtain PD signals phase-synchronized with the applied HV signals for improving the identification and classification of the types of insulation defects. As shown in Figure 2, the PRPD sensor was designed to measure the phase-synchronized PD signals by capturing both the discharge pulses and the applied HV signals simultaneously. This enables accurate plotting of PD occurrences with the phase cycles of HV signals to identify the regular behaviors of PD pulses under AC conditions. The PRPD sensor consisted of two sensing electrodes which were made of copper conductive tape to detect electromagnetic (EM) waves generated from the core conductor. A shielding layer was installed surrounding the PRPD sensor to block the external electromagnetic waves [32]. The PD simulation experimental setup applied HV signals using a PD-free oil-immersed HV transformer with maximum outputs of 75 kV at a capacity of 5 kVA. The magnitude of the applied HV signal was controlled by an induction voltage regulator (IVR). The PRPD sensor was installed between the HV transformer and the PD simulators. To obtain phase-synchronized PD pulses, a signal transducer with proper output impedance in accordance with IEC standards was connected to each output terminal of the PRPD sensor. All signals were recorded using a digital storage oscilloscope (DSO) with a maximum sampling rate of 10 GS/s (MSO 5204B, Tektronix, Beaverton, OR, USA). The environmental noise level of the laboratory test setup was 3 mV, and the unexpected noise signals were eliminated by increasing the threshold level of the PRPD sensor. The applied voltage level was increased by 0.5 kV and held for at least 1 min to stabilize PD activities. Once initial PD pulses were detected, the voltage level was maintained at that level, called the discharge inception voltage (DIV). The PD measurements were conducted after the stabilization of the PD occurrences [33].
The PRPD sensor was designed to measure induced PDs based on Gaussian law. The output voltage of the PRPD sensor is proportional to the derivative term of the incident displacement flux density, resulting in playing as the D-dot sensor. Therefore, the output magnitude of the PRPD sensor can be expressed as (1):
V t = d D t d t S · Z m
where S is the equivalent area of the PRPD sensor and Zm is the output impedance of the signal transducer [33].
PD detection has been carried out using an important indicator for the insulation condition monitoring of power apparatus. Figure 3 shows typical insulation defects in the GILB. Although there are a lot of cautions to prevent contamination during processes of manufacture, assembly, installation, and open and close operations, tiny particles are sometimes still present in the enclosure. When the metallic particles are forced by the electric field of the applied voltage, they can roam freely along the enclosure. It generates PD signals, and its PD characteristics, such as amplitudes, rising and falling times, and pulse width, depend on their weight, size, and shape [34,35]. If the metallic particle is stuck on the conductor by the magnetic force, the electric field can be concentrated on the tip of the protrusion, resulting in corona-type PD pulses [6,36,37]. On the other hand, a delamination defect can be produced by physical impact by electrical or mechanical stress or thermal expansion and contraction [38,39,40]. If an insulator with the delamination defect is In the HV equipment and the electric field by the applied voltage Is sufficiently high, the PD signals are generated by the electron avalanche phenomenon of free electrons inside the delamination. Once the electric field is concentrated on the delaminated area, it can deteriorate the dielectric strength of the insulation material. These discharges initiate electrical tree propagation, the insulation layers can be degraded and deteriorated, and it can finally lead to the failure of the insulation system [41,42].
Figure 4 shows the photographs of PD defect models used in this study. The types of insulation defect were set as follows: an iron ball with a diameter of 1 mm was positioned on a concave plane for the FMP defect as shown in Figure 4a; an iron tip with a curvature of 5 μm was fixed on a hemispherical conductor as a HV electrode or a plane conductor as a ground electrode for the POC defect or the POE defect as shown in Figure 4b,c, respectively; and an epoxy delamination specimen with a depth gap of 300 μm was placed on an epoxy insulation layer between two plane electrodes. The cavities of the PD defect models were filled with SF6 gas of 5 Mpa as shown in Figure 4d. All edges were rounded to minimize unexpected electric field concentrations.

2.2. Random Forest (RF) Algorithm

The RF algorithm is an ensemble learning algorithm that is a combination of a set of tree predictors and has been widely used for identification and classification tasks for insulation defects due to its effectiveness in handling non-linear and high-dimensional datasets. Each decision tree is constructed using randomly sampled datasets of feature spaces, ensuring the diversity and robustness of the algorithm. Typically, the RF algorithm operates on the majority voting across the trees, thereby improving generalization and reducing overfitting. This mechanism can reduce variance while maintaining a low bias [43,44,45]. Figure 5 shows the general structure of the RF algorithm.
A decision tree is a fundamental hierarchical structure of the RF algorithm. The decision tree optimizes the split at each node using Gini impurity or entropy. The Gini impurity G and entropy H are calculated using Equations (2) and (3), respectively [46].
G = 1 k = 1 K p k 2
H = k = 1 K p k log 2 p k
where pk is the rates of samples k at the nodes, and k is the total number of samples.
The key characteristics of the RF algorithm are bootstrap aggregation (bagging) for training each decision tree by replacing randomly sampled subsets of the dataset, feature randomness for random determination of each split in the decision trees for increasing diversity, and majority voting and regression for prediction by aggregating the results of decision trees. The RF algorithm achieves better generalization performance compared to individual decision trees by aggregating the outputs of numerous weak learners [47].
The RF algorithm has several hyperparameters that control the classification accuracy, performance, and computational efficiency. The key hyperparameters are the number of estimators, the maximum depth of the decision tree, and the minimum number of samples per split [48].
  • The number of estimators N:
This hyperparameter influences the overall stability of the RF algorithm. The final prediction y ^ is determined by the major voting process and calculated by Equation (4).
y ^ = a r g m a x i = 1 N h i x
where hi(x) is the prediction of each decision tree. Increasing the number of decision trees can reduce the variances, but it can increase the computational time and cost.
2.
The maximum depth of decision trees D:
This hyperparameter defines the maximum number of levels to implement recursively each decision tree can have. It determines the complexity by controlling the recursive splits performed in each decision tree. The theoretical maximum depth D of the decision tree can be approximately calculated using Equation (5) [49].
D = log 2 N
where N is the number of training samples, but the depth is practically determined by empirical tests and cross-validation. As the maximum depth increases, the decision tree becomes more complex, allowing it to capture complicated patterns in the training data. However, too much depth can lead to overfitting, where the decision trees memorize the training data rather than generalize the new inputs. Conversely, too low depth may not be able to capture patterns in the data, resulting in underfitting [50,51].
3.
The minimum number of samples per split:
This hyperparameter specifies the minimum number of samples required to split an internal node in each tree. Limiting unnecessary node splitting helps control the complexity of the RF algorithm and prevents overfitting caused by sensitivity to data fluctuations. This hyperparameter plays a critical role in the generalization of the RF algorithm; too low may lead to overly deep trees and overfitting, but too high may lead to shallow trees and underfitting by insufficient pattern learning [52,53].

3. Statistical PD Feature Extraction

Extraction of statistical PD features is an important pre-processing step of insulation defect diagnosis before applying the RF algorithm classifier. Since each PD pulse contains a lot of informative data, various types of statistical features, such as time-domain, frequency-domain, physical shape-domain, and phase distribution-domain features, were extracted from the PD single pulses and PRPD patterns in accordance with four different defect models.
Typically, the PD single-pulse analysis method has been used due to its ease of application and quick identification with intuitive interpretation, while the PRPD pattern analysis method has been widely applied to insulation defect recognition with high accuracy by expert analysis systems with advanced capabilities [33,54,55,56]. According to the oscillating appearance of PD single pulses with EM wave detection characteristics [57], the first and second half-cycles of the single pulses have distinguishable information. On the other hand, due to the periodic polarity reversal of the sinusoidal waves in AC voltage [58], the PRPD pattern varies with the phases of the applied HV signals. Thus, the acquisition of PD pulses at regular phase intervals provides critical information for distinguishing among different types of insulation defects.

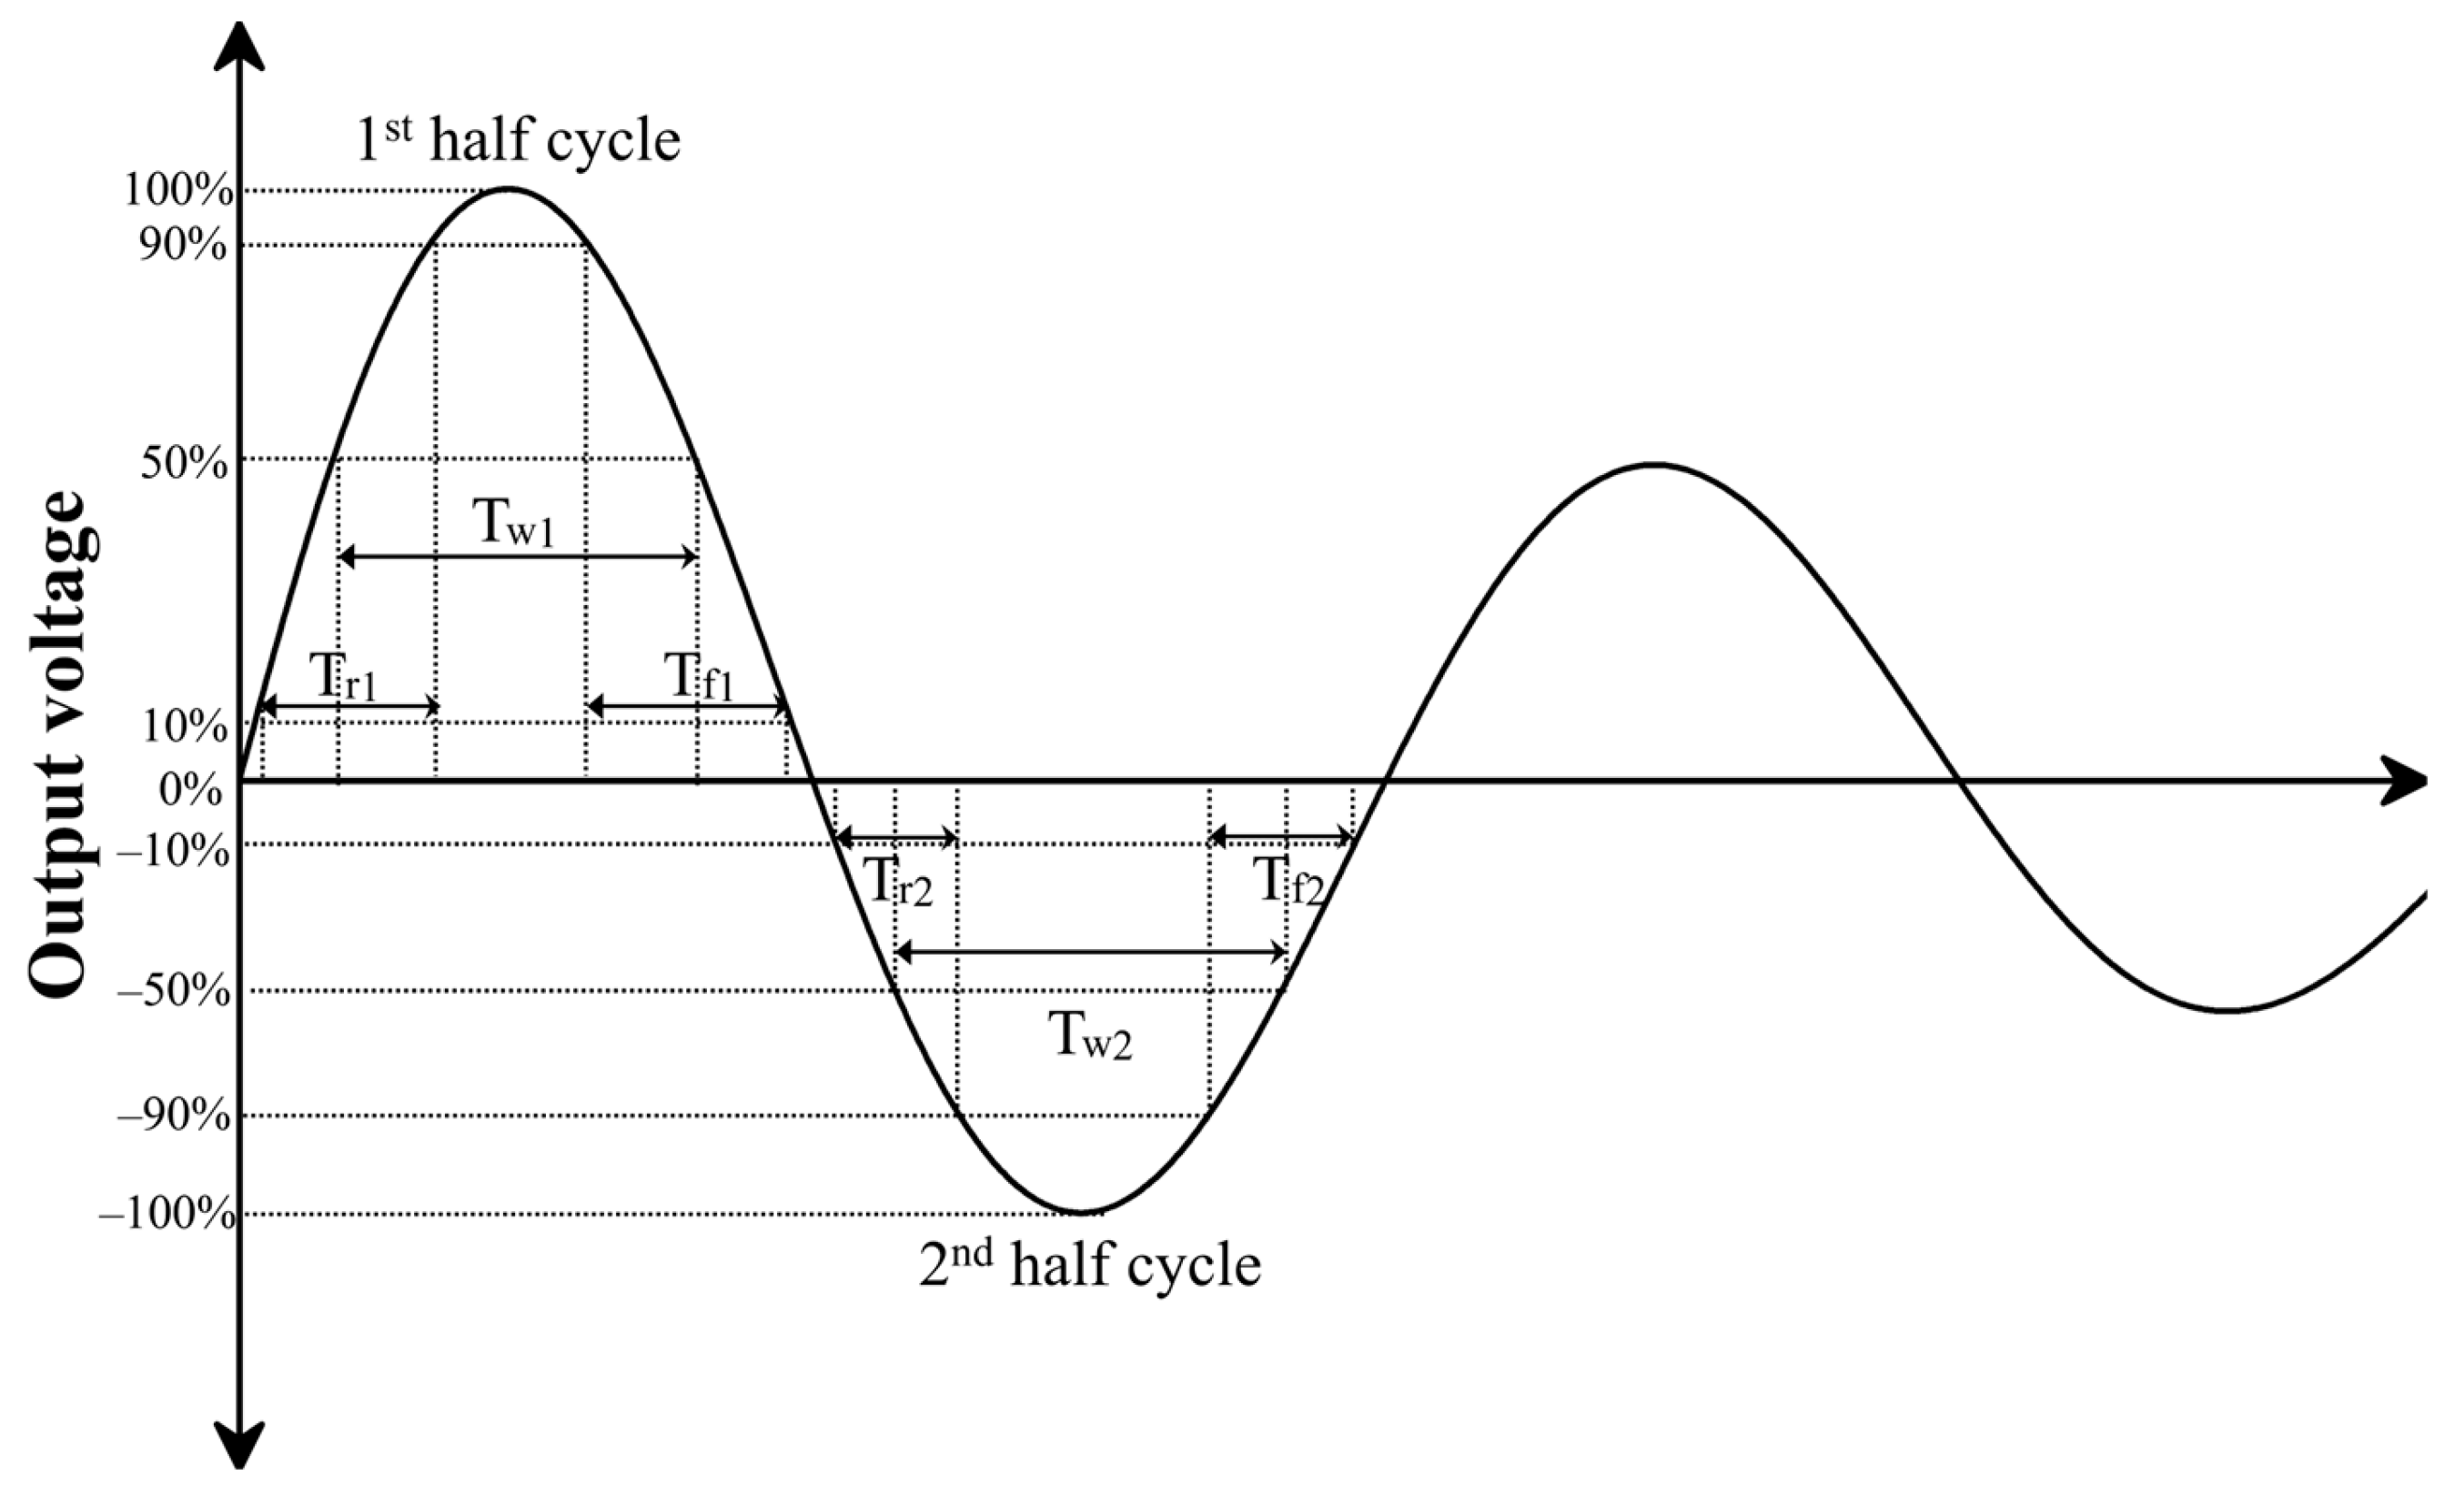
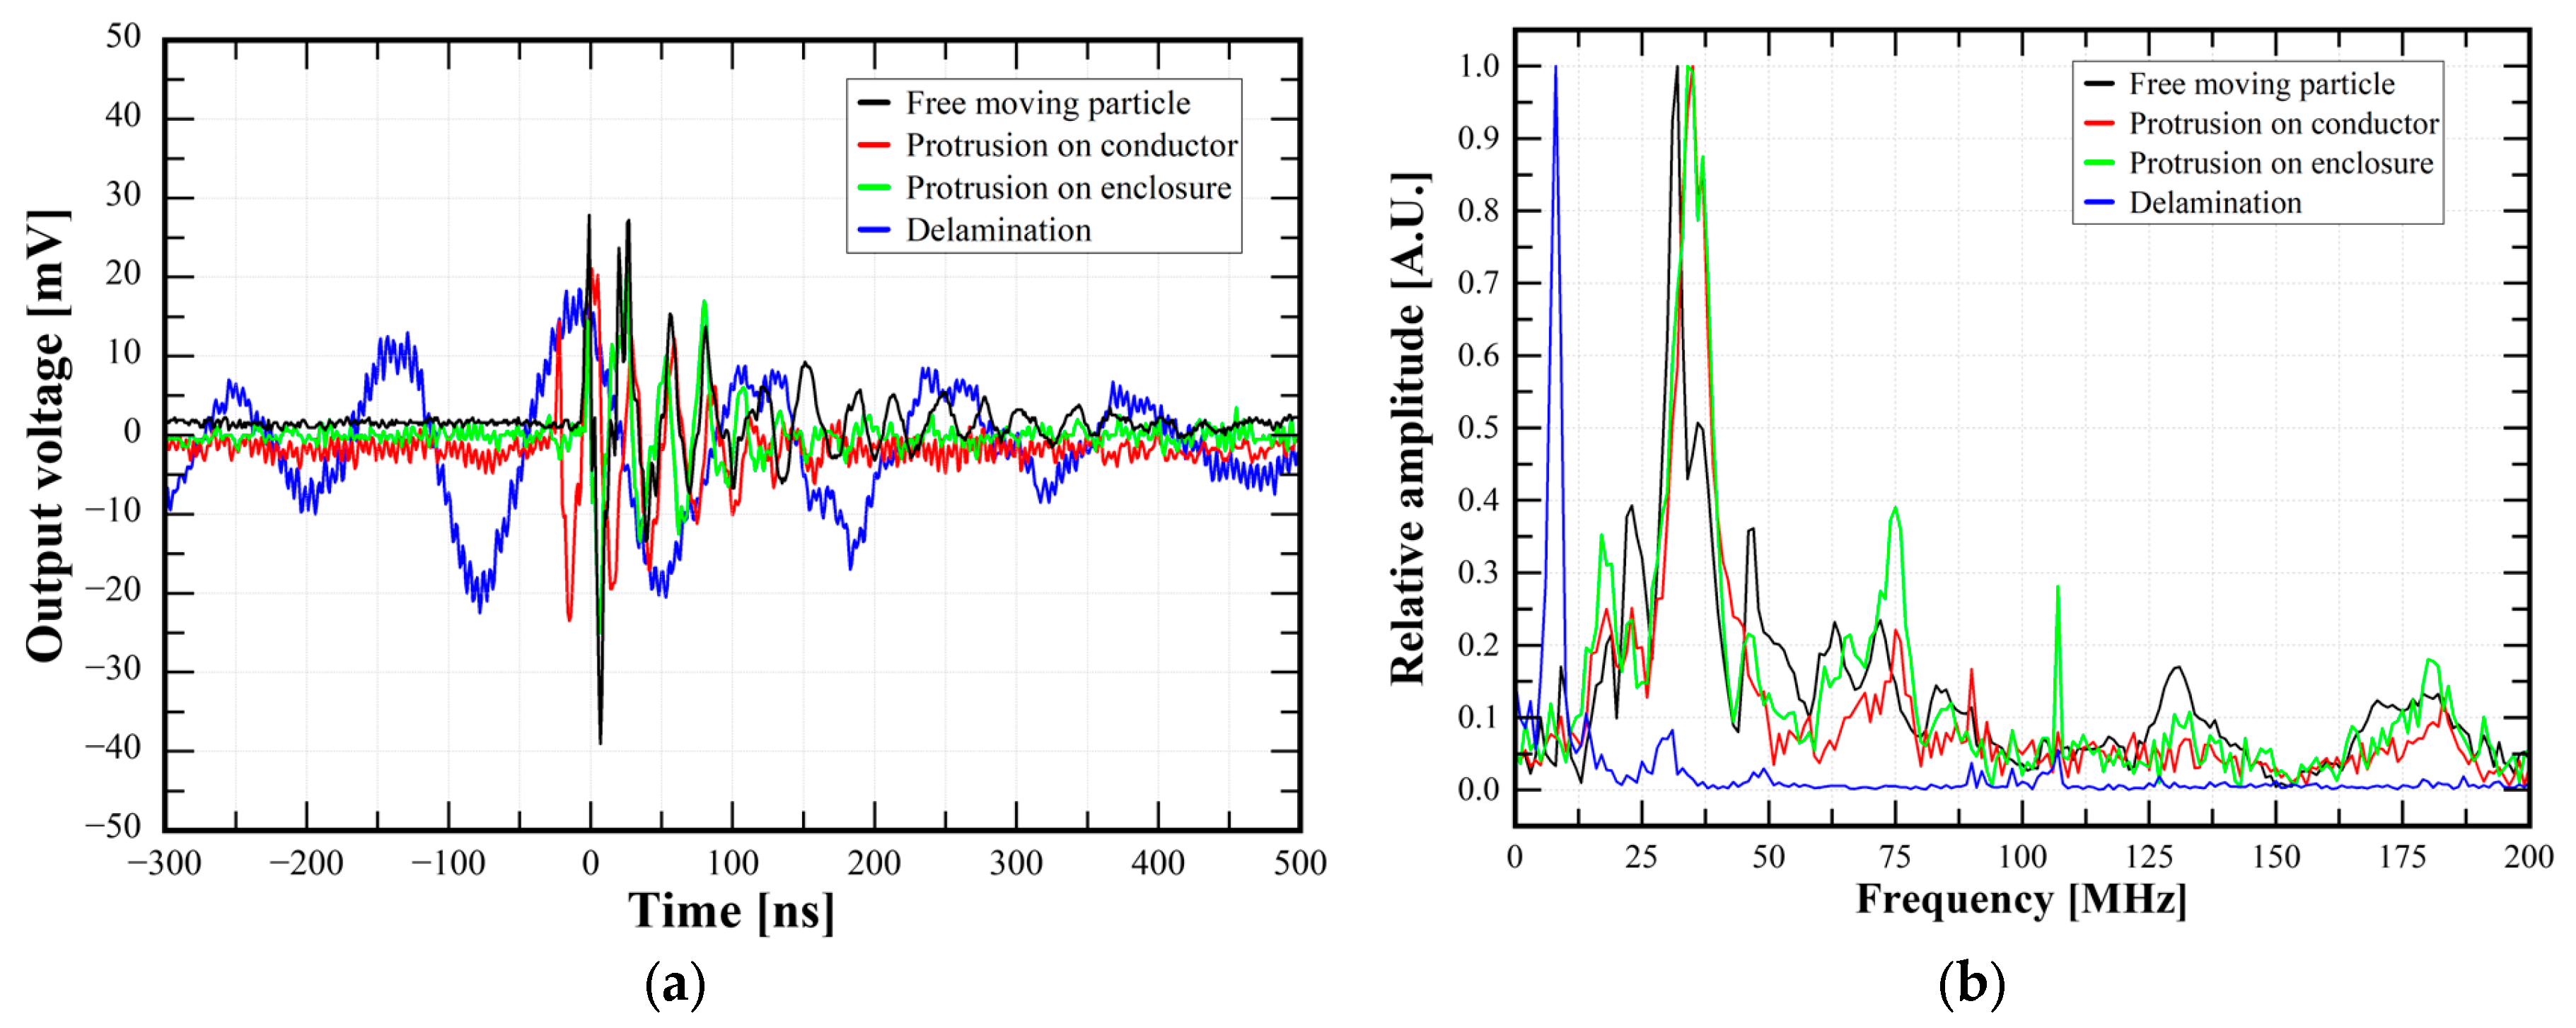
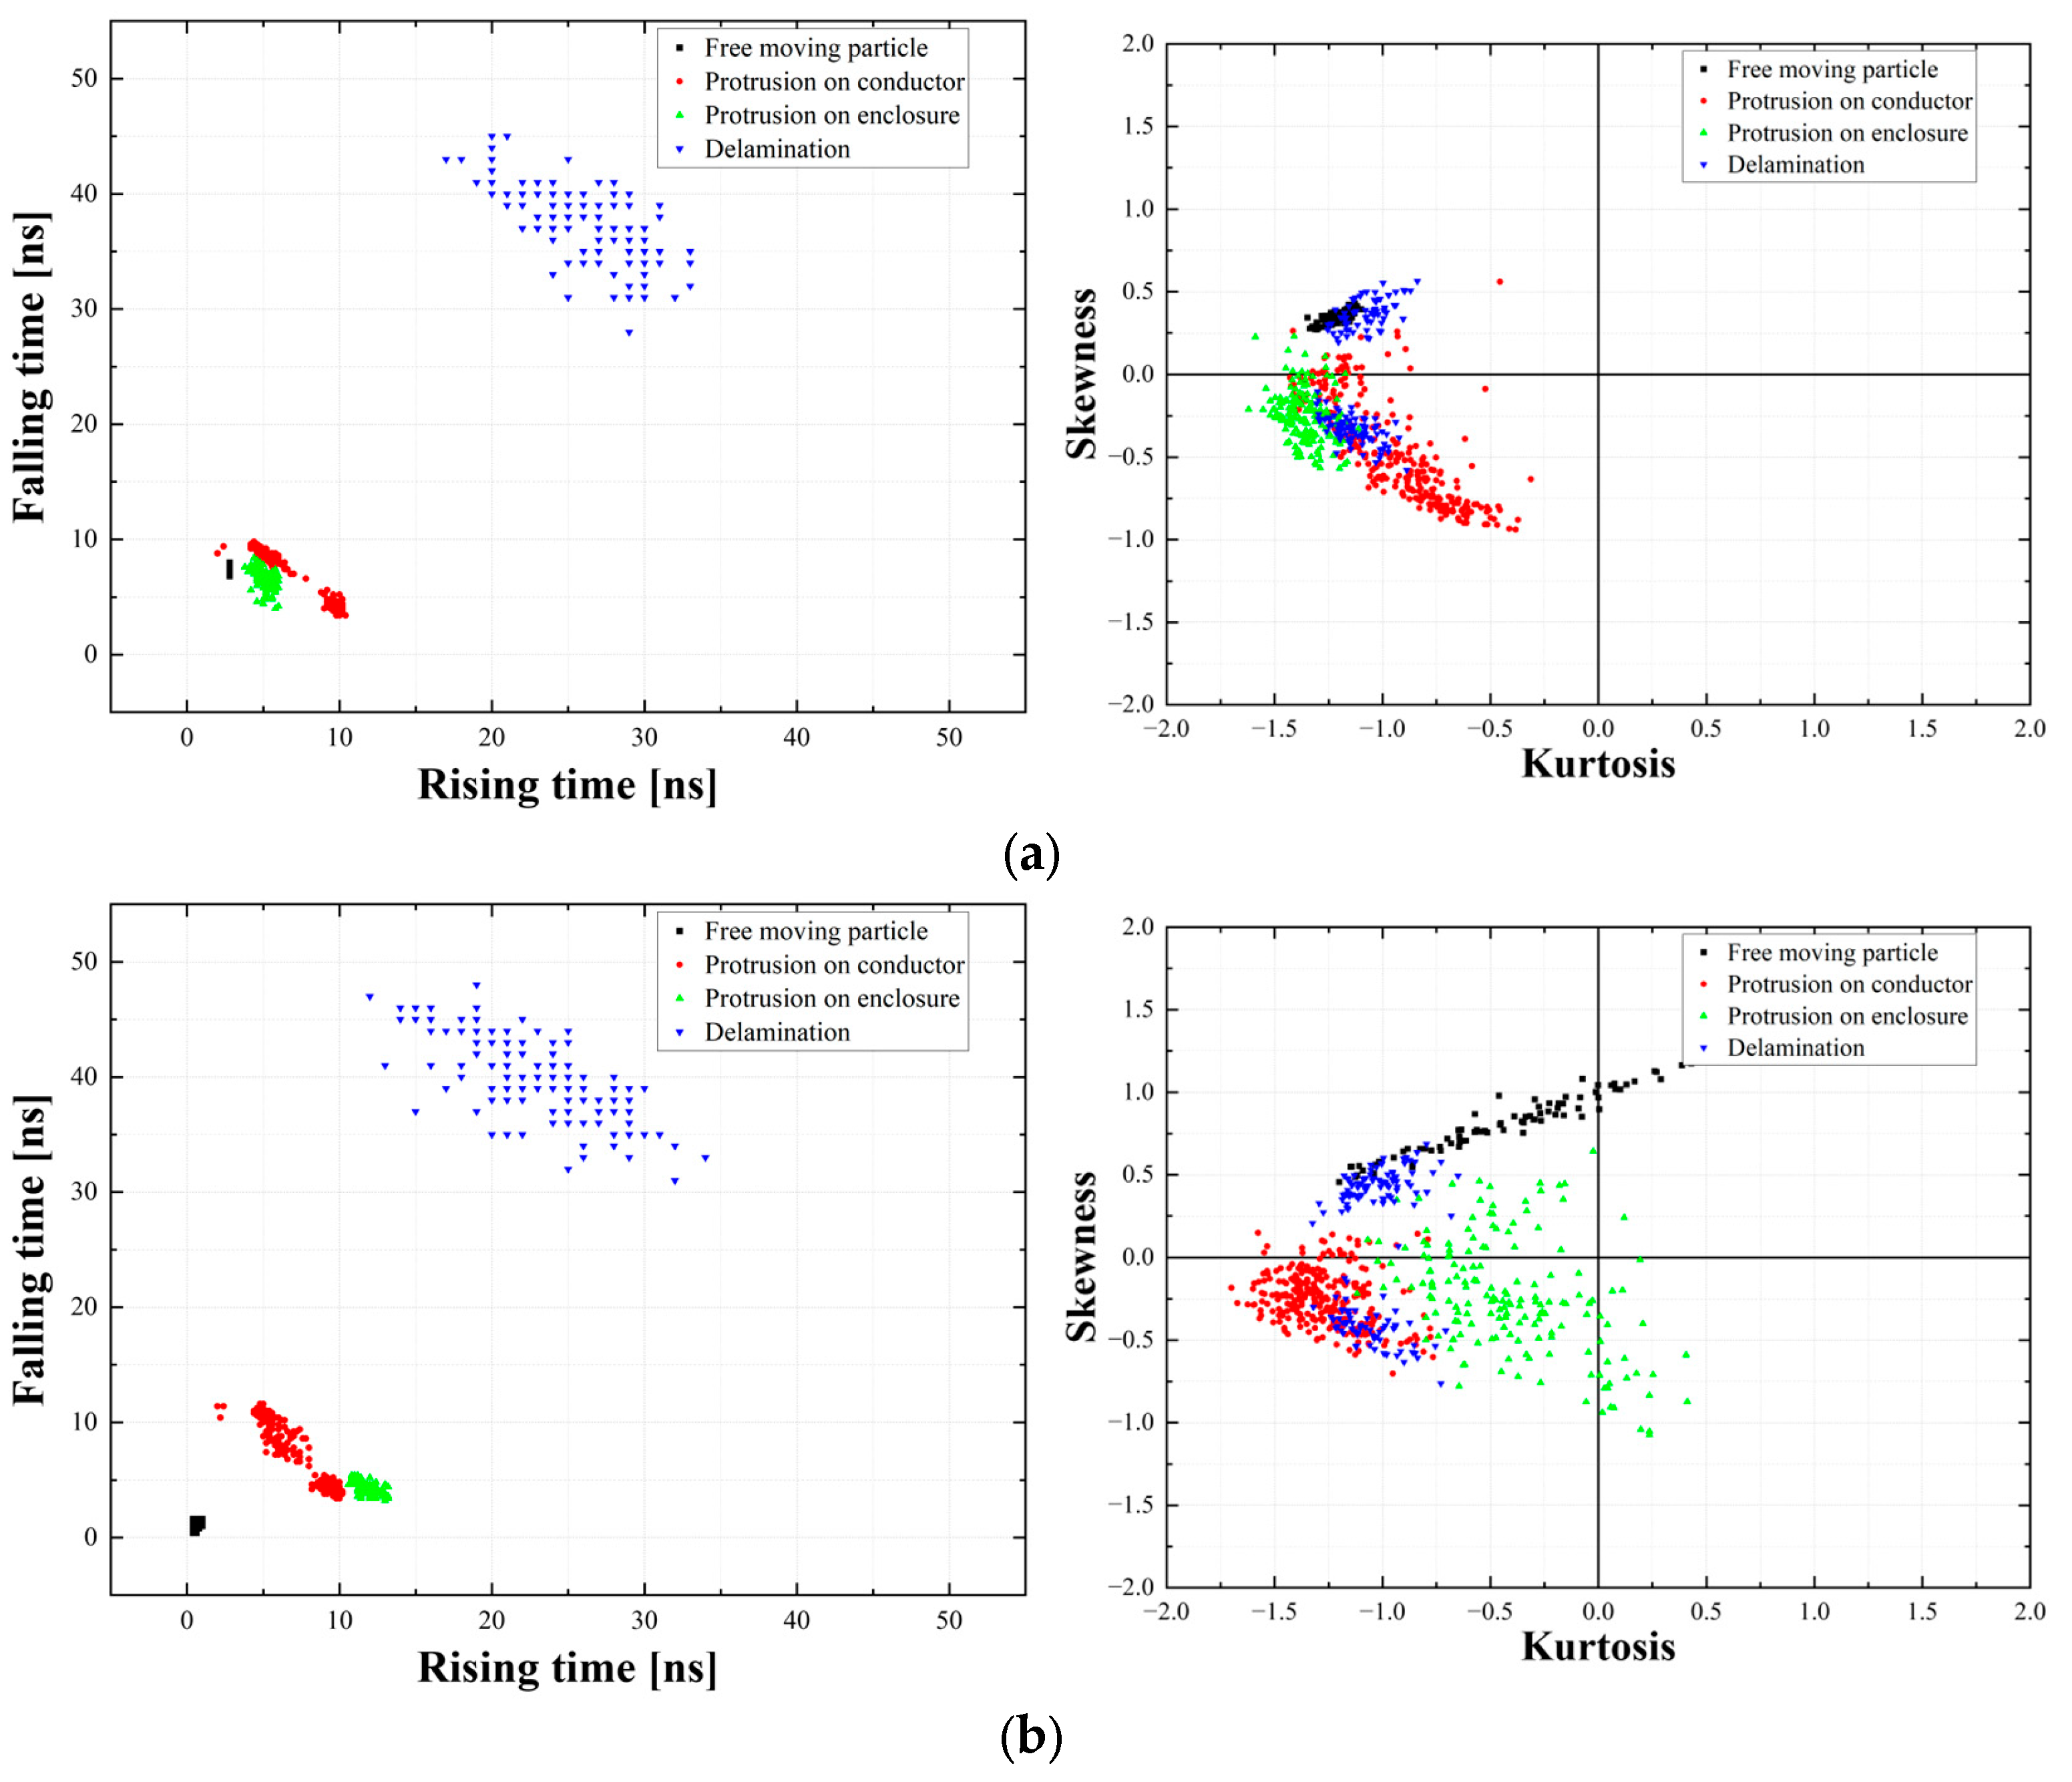
3.1. Time-Domain Features

Figure 6 shows the time-domain features of a typical PD single-pulse waveform. Due to the oscillatory behavior of PD signals in the EM waves, PD single pulses exhibit different intervals and durations in the first and second half-cycles in accordance with insulation defects. In this study, the first half-cycle was defined as the peak magnitude of the PD single pulses, while the second half-cycle was defined as the immediately following the first half-cycle. The following three features were extracted for both half-cycles [59]:
  • Rising time (Tr, RT): time durations increase from 10% to 90% of peak magnitudes.
  • Falling time (Tf, FT): time durations decrease from 90% to 10% of peak magnitudes.
  • Pulse width (Tw, PW): time durations between 50% of peak magnitudes.

3.2. Frequency-Domain Features

To analyze frequency-domain features of PD single pulses, the fast Fourier transform (FFT) analysis method was applied. The FFT is a mathematical analysis technique that converts the discrete-time PD single pulses to the frequency-domain waveforms consisting of discrete frequency components. The FFT is an optimized method of the discrete Fourier transform (DFT). The main distinction between DFT and FFT is the computational efficiency. The FFT significantly reduces the number of operations by eliminating redundant calculations, allowing faster processing of multiple datasets. The FFT especially reduces computation by a factor of N/log2N. Despite this improvement, the FFT makes results that are mathematically identical to those of the DFT. The equation of FFT Xk of signal xn is defined as Equation (6) [60,61,62].
X k = n = 0 N 1 x n e i 2 π k n N     k = 0 , , N 1
Figure 7 shows a typical PD pulse and its FFT waveform. In this study, the FFT was applied to the PD single pulses in the discrete-time domain, where N denotes the total amount of sampled data. The PD signal was measured with a maximum sampling frequency of 2 GHz, ensuring sufficient resolution for PD signals with high-frequency components. Two dominant peak frequencies were extracted from the FFT spectra:
  • First peak frequency (1st Pk): the frequency at the highest FFT spectral magnitude
  • Second peak frequency (2nd Pk): the frequency at the second highest FFT spectral magnitude

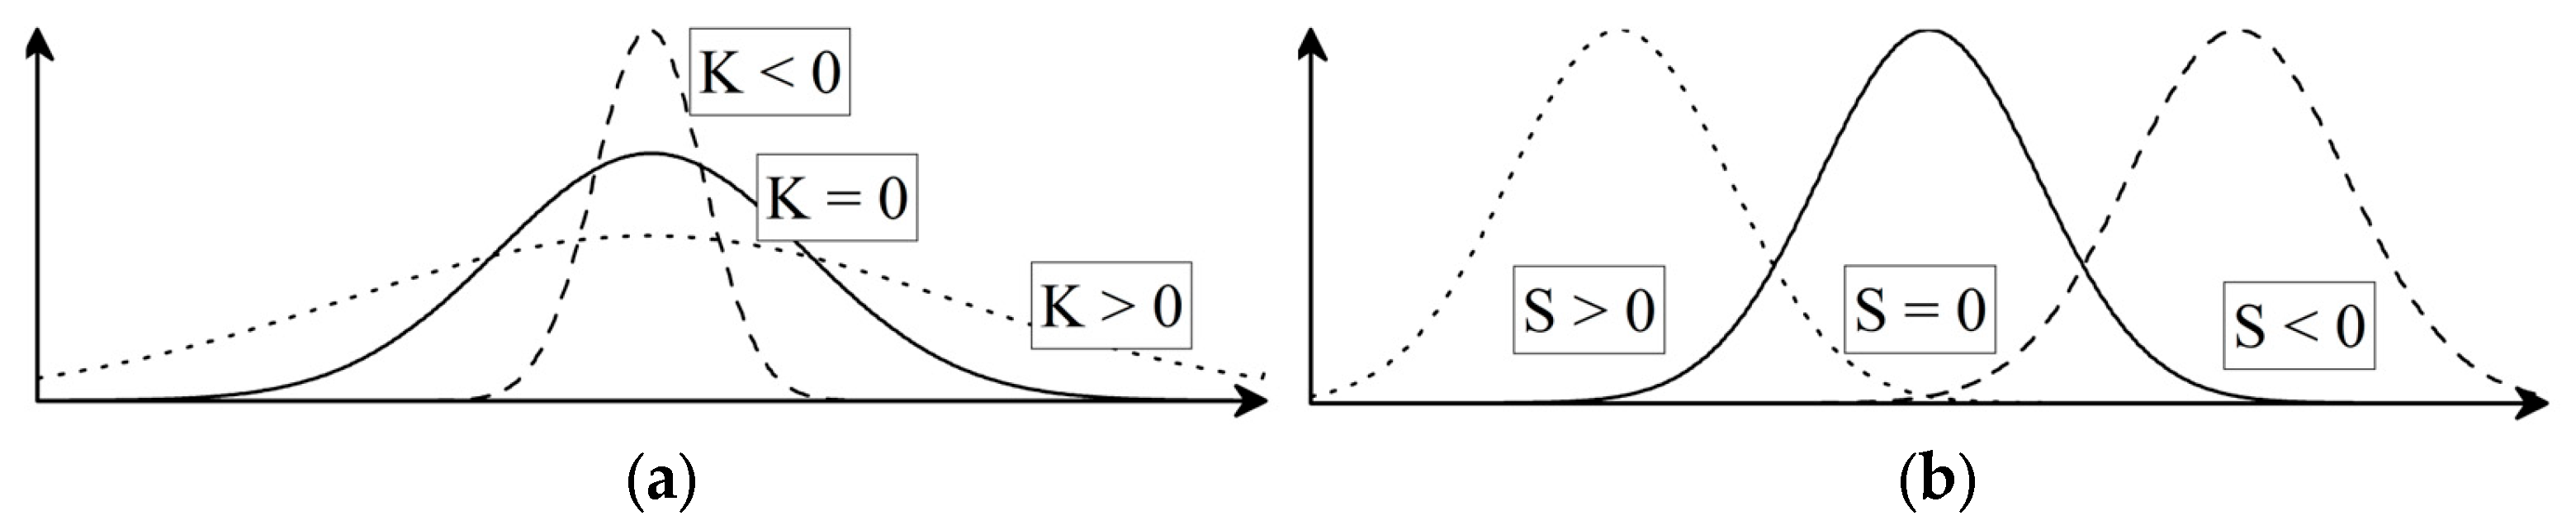
3.3. Physical Shape-Domain Features

To understand the physical shapes of the PD single pulse as statistical measures, kurtosis (K) and skewness (S) were applied to the data distribution of the first and second half-cycles. Figure 8 shows typical data distributions of different conditions of kurtosis and skewness [63,64].
Kurtosis is a statistical value for how spread out the data distribution is. It is an indicator of the steepness of a probability distribution and can be calculated by Equation (7).
K = i = 1 n ( x i μ ) 4 n · σ 4 3
Under a normal data distribution condition, the value of kurtosis is zero. If the data are centered, the kurtosis value is positive. This data distribution is called leptokurtic. Conversely, if the data are evenly distributed, the kurtosis value represents negative values. This is known as a platykurtic.
On the other hand, skewness presents a statistical value for how symmetrical the data distribution is. It is an indicator of the lack of symmetry or straightness in the distribution and can be calculated by Equation (8).
S = i = 1 n ( x i μ ) 3 n · σ 3  
For a centralized data distribution, the skewness value is zero. If the data are heavily right-tailed and skewed to the left, the skewness value is positive. Conversely, if the data are left-tailed and skewed to the right, the skewness value is negative [65].

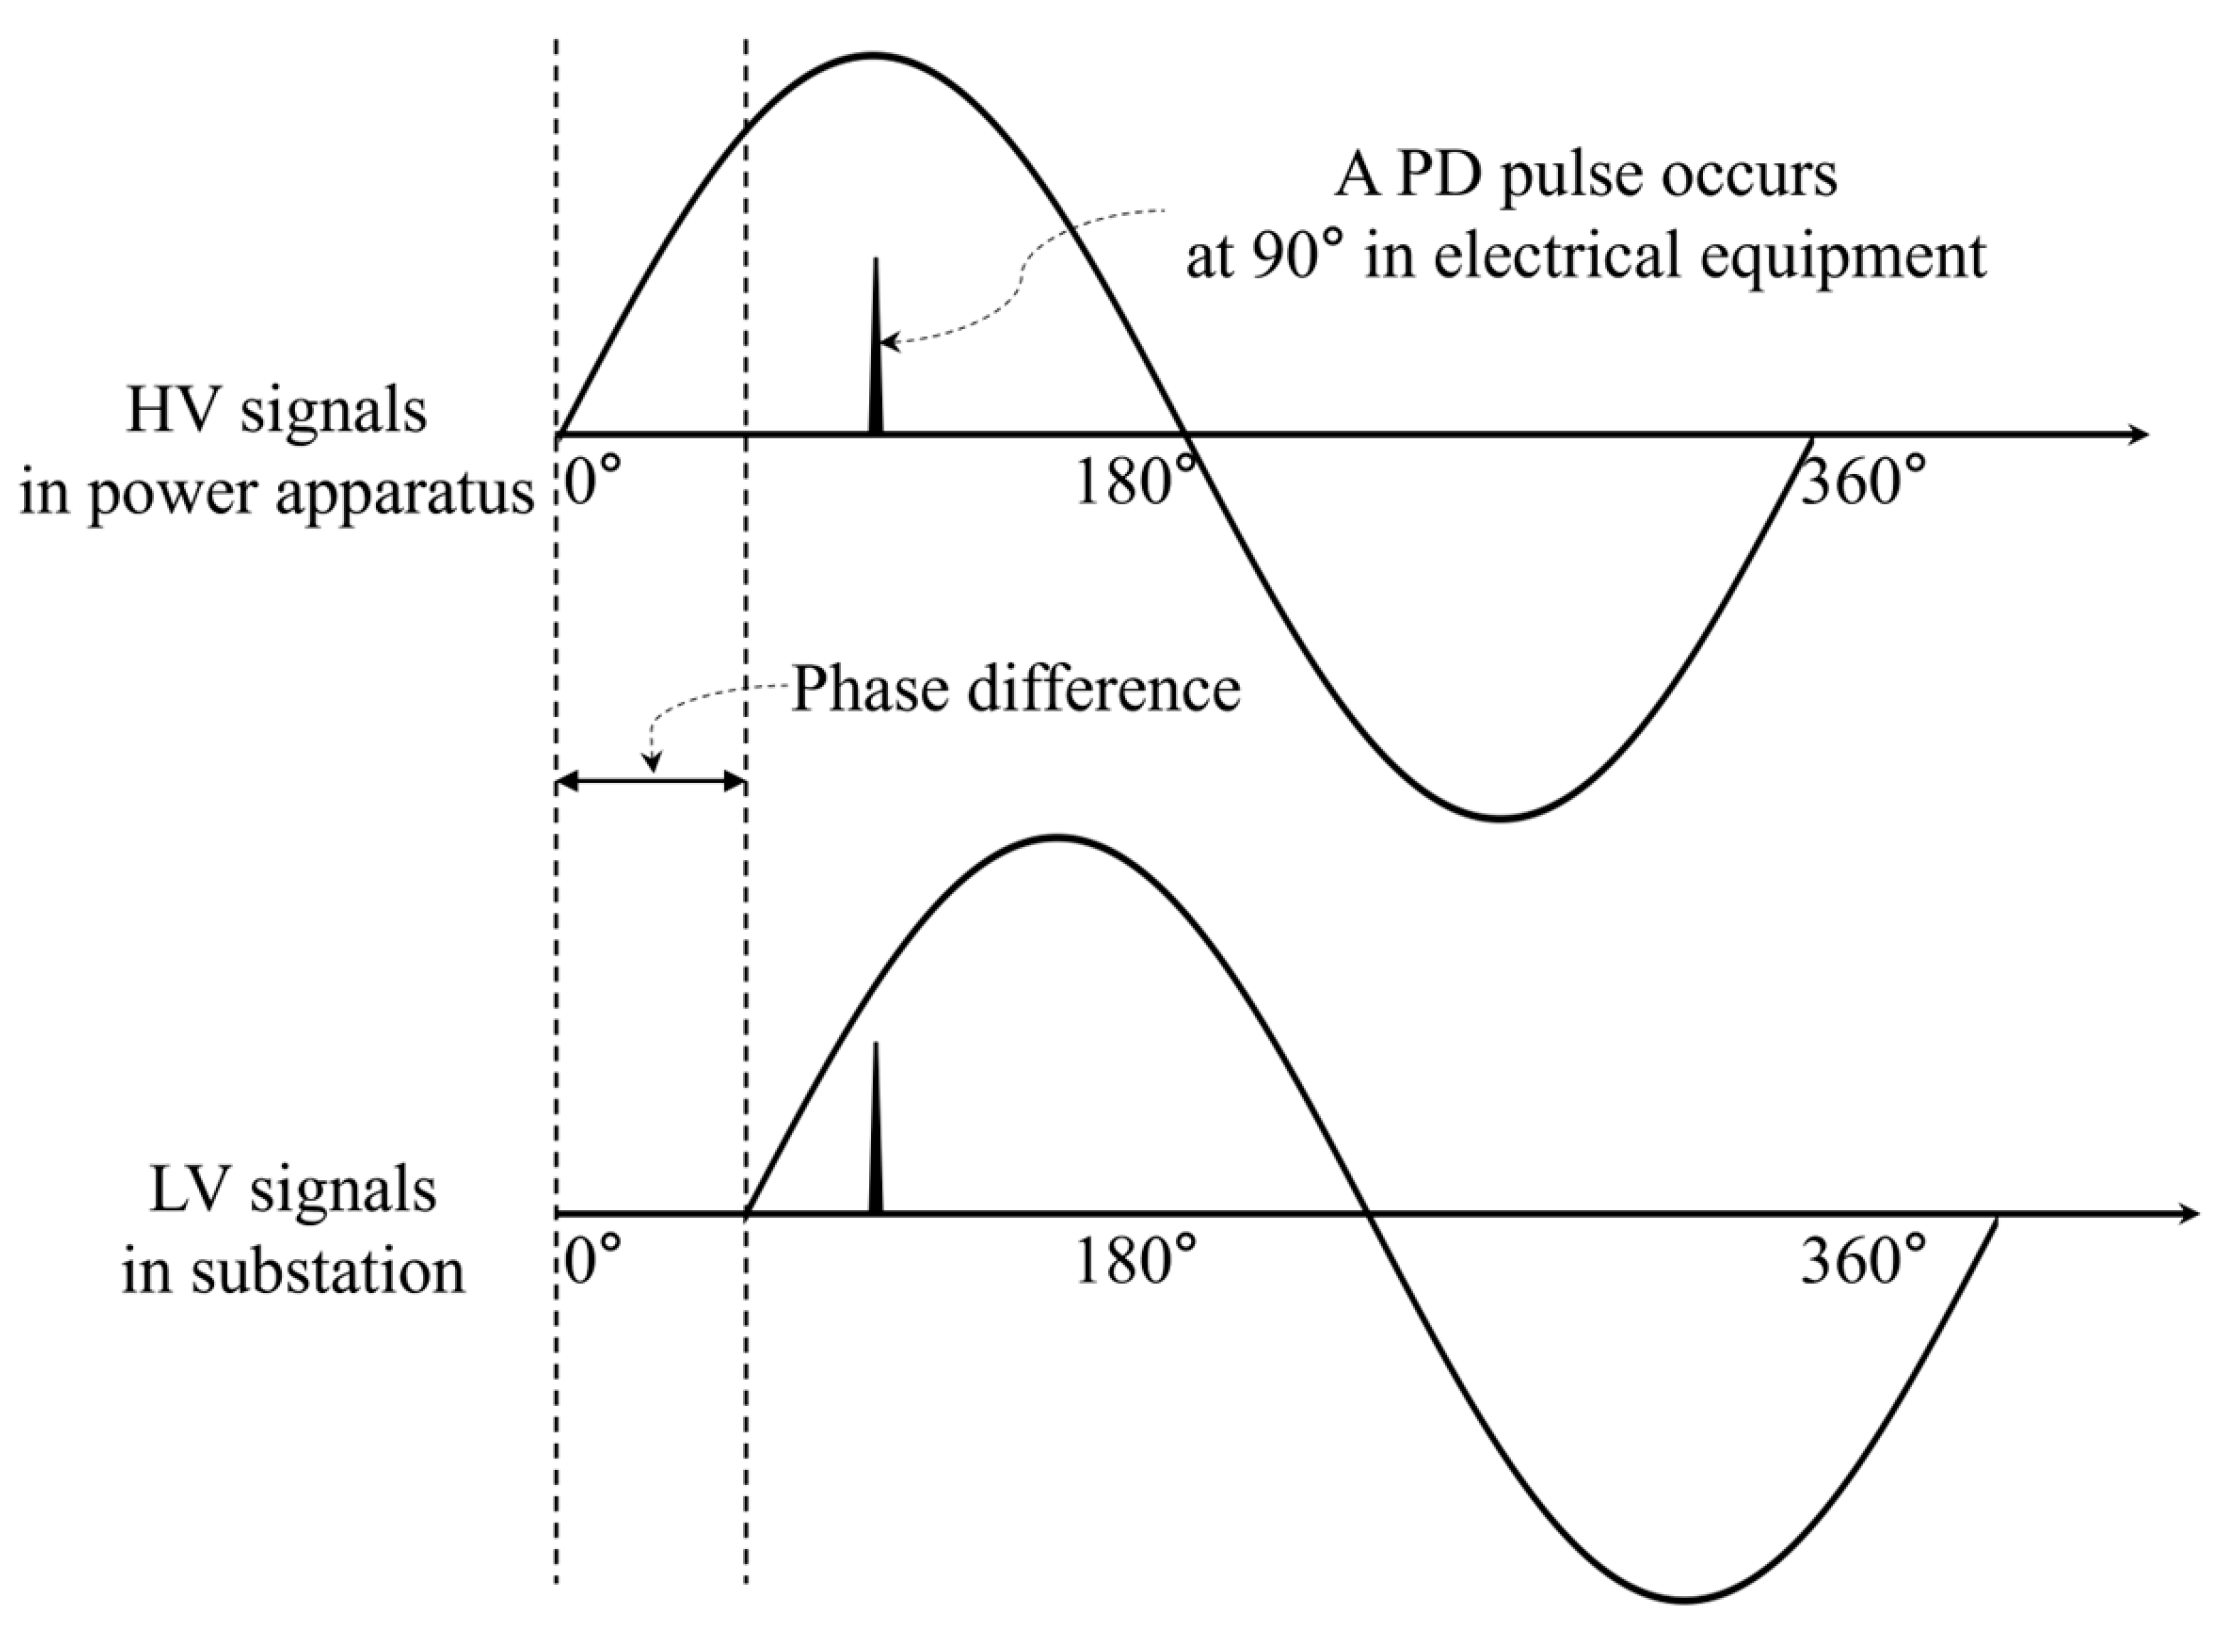
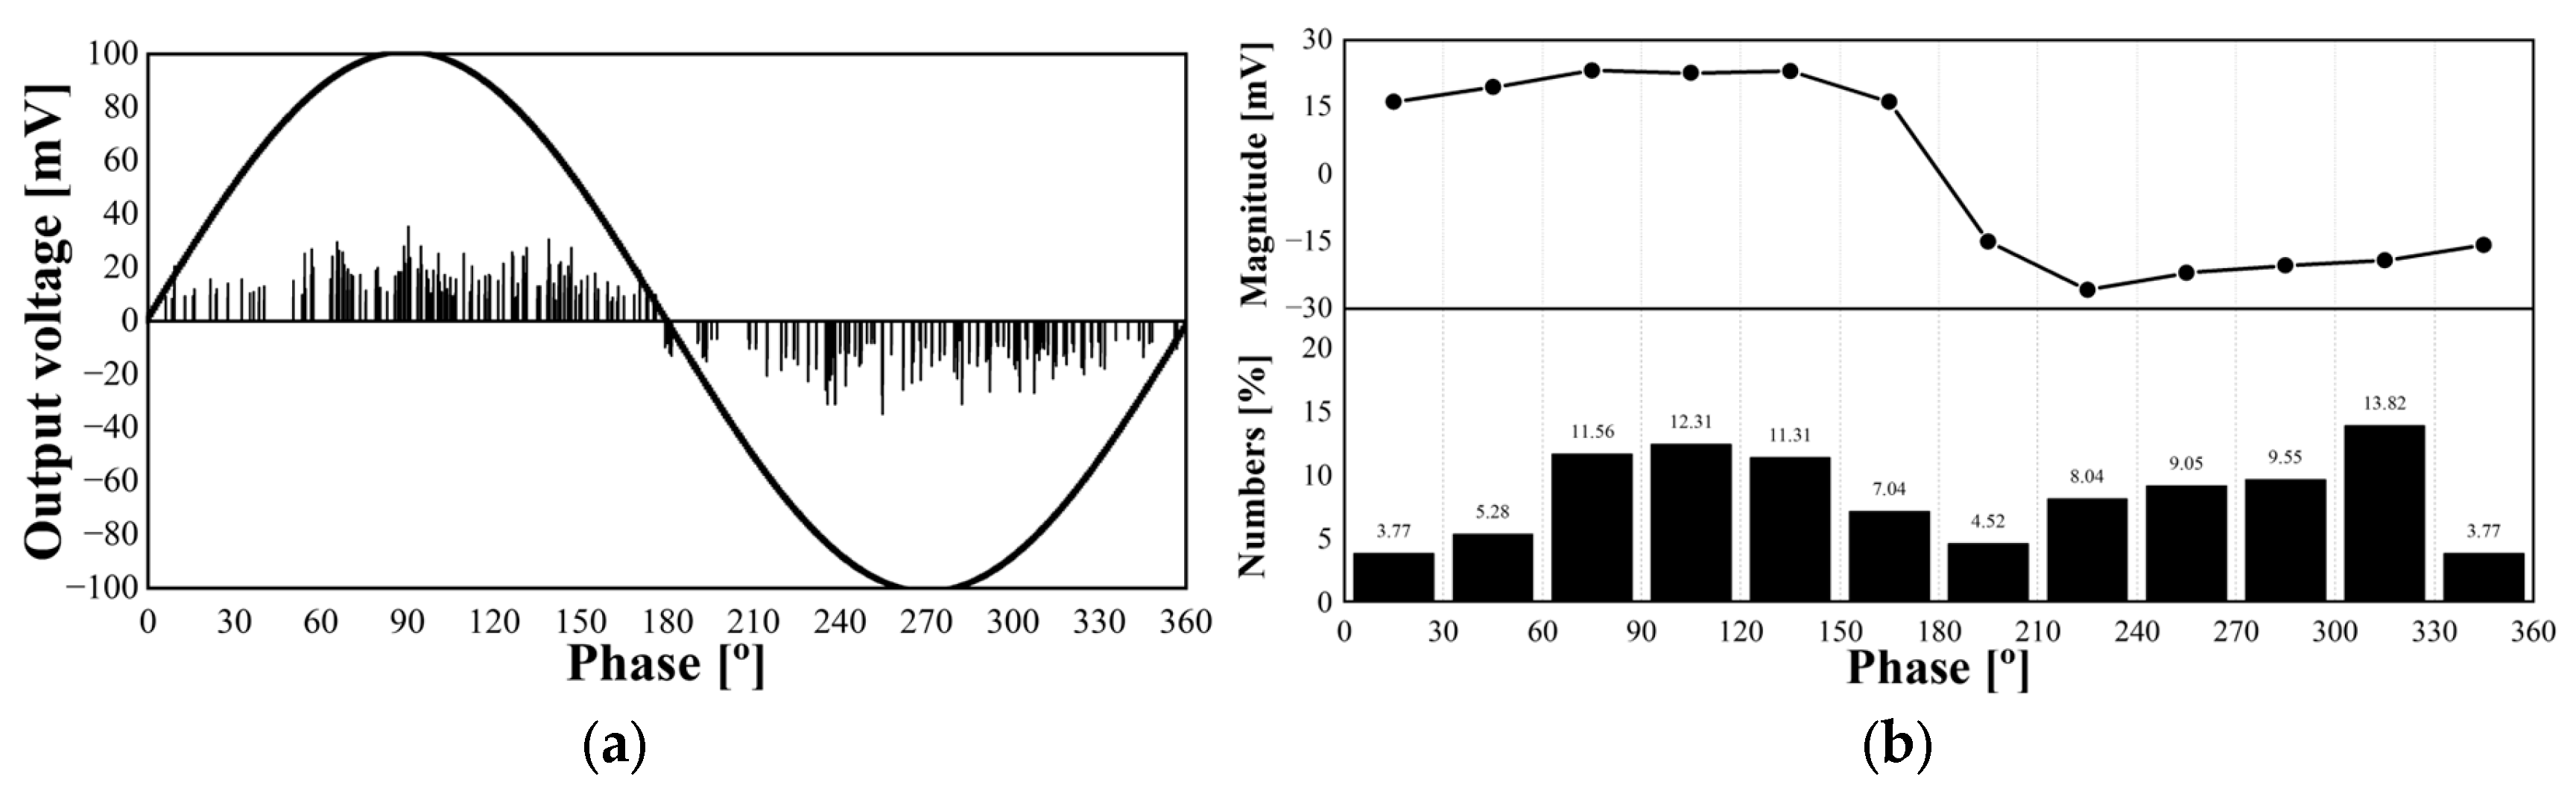
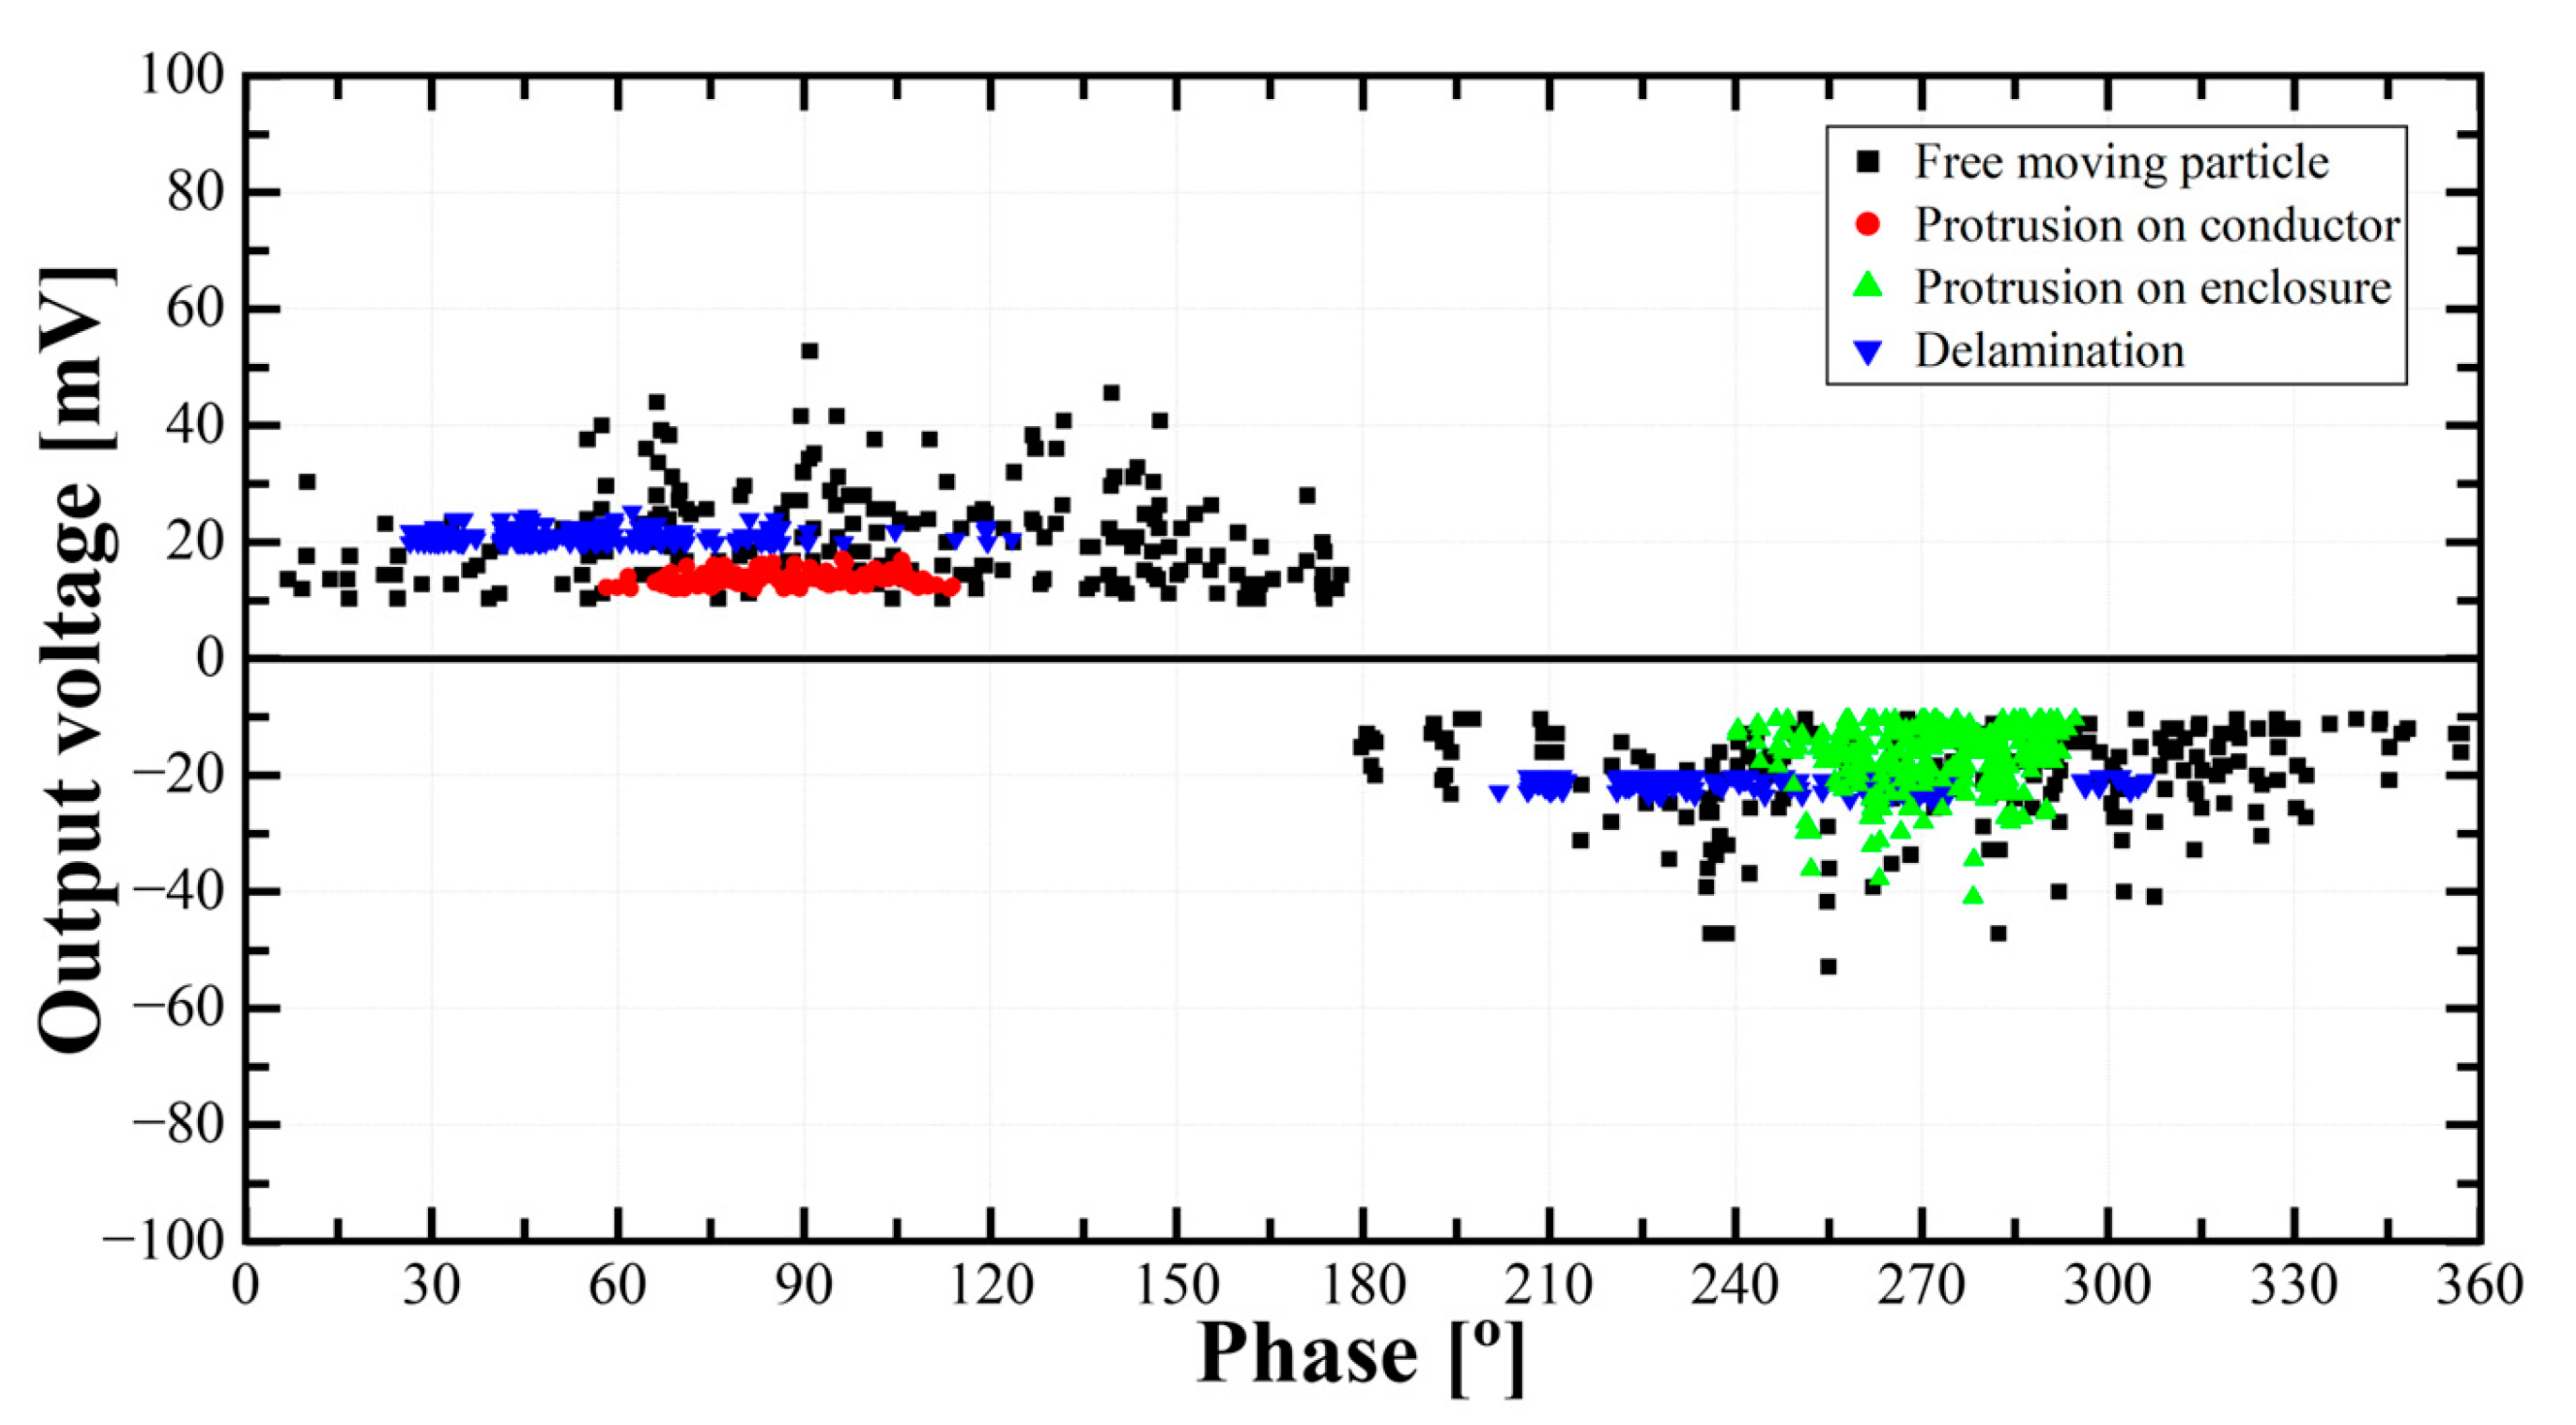
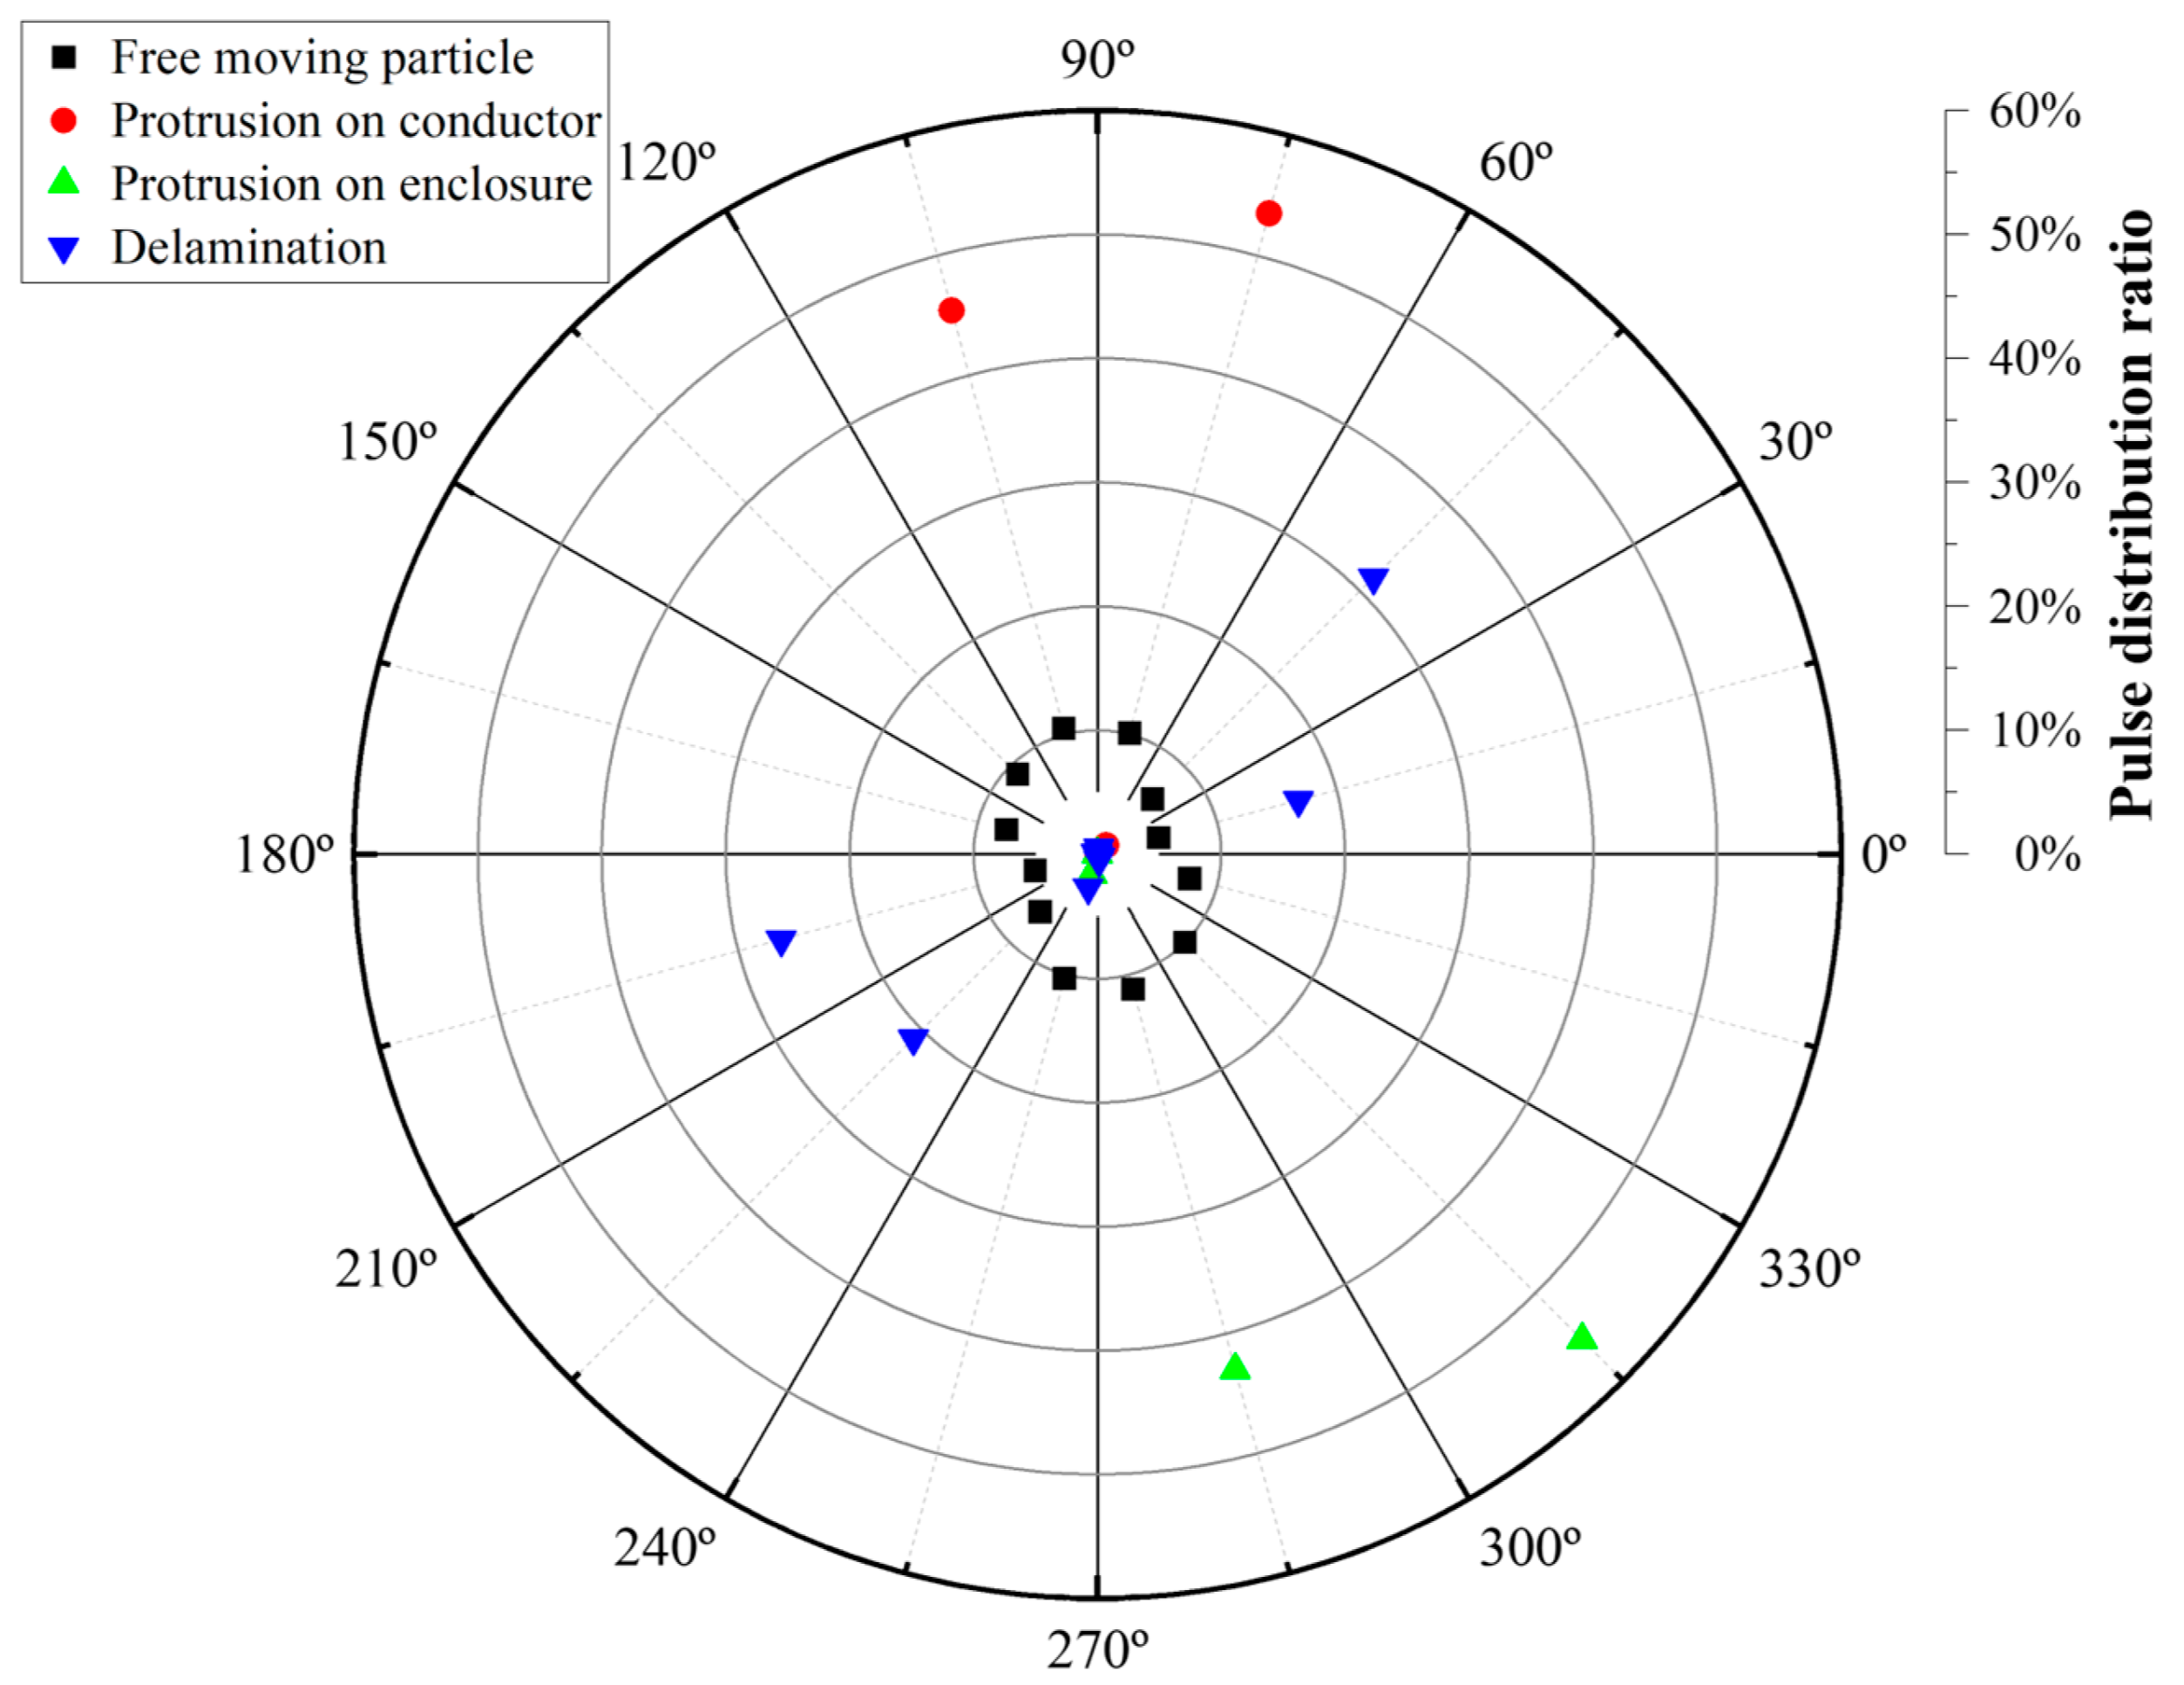
3.4. Phase Distribution-Domain Features

PRPD pattern analysis has been used as one of the most efficient recognition techniques for recognizing insulation defects in the GIS and GILB. The PRPD pattern obtains PD pulses with reference to phase angles of the applied voltages and consists of three key components: magnitude (q), phase (ϕ), and numbers (n) of the occurrence of PD pulses under AC voltage conditions [66]. In this paper, the PRPD patterns were divided into 30-degree phase angle intervals based on the ϕ-q-n representation to analyze the pulse distribution characteristics. Figure 9 shows the PRPD pattern and its phase distribution-domain features, average magnitudes, and number of PD pulses over 30-degree intervals.

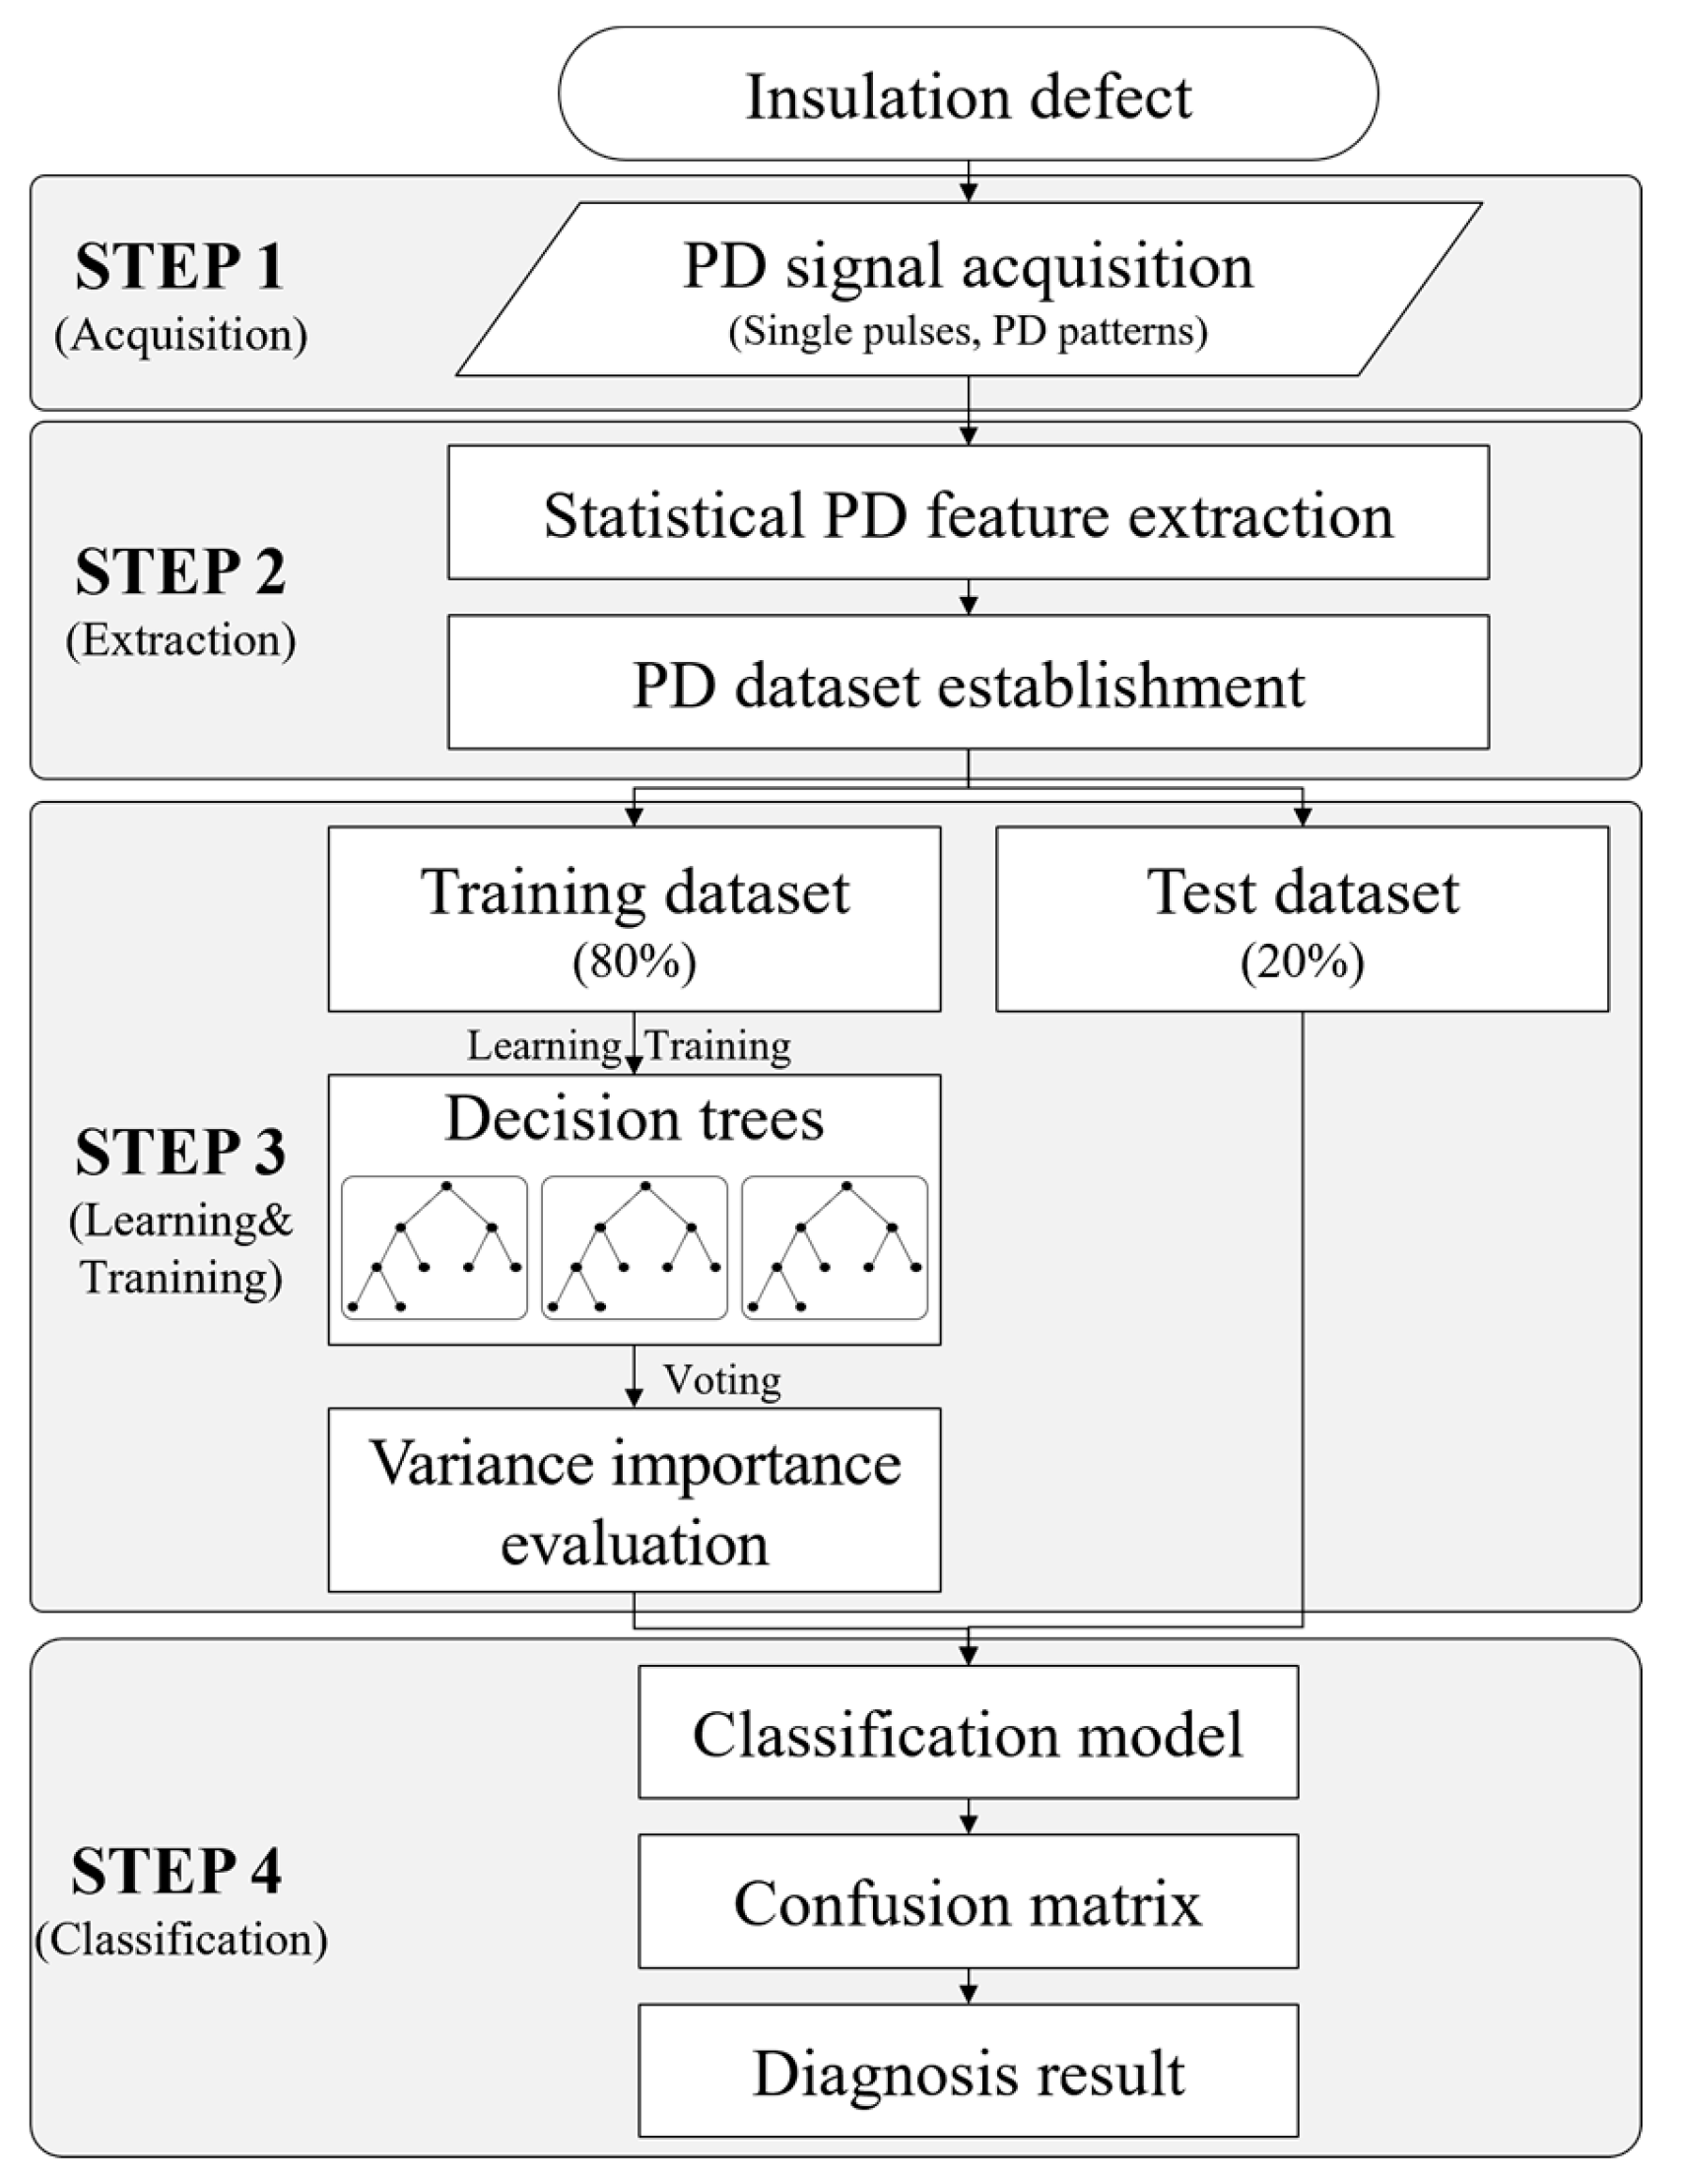
4. Insulation Defect Recognition Using Random Forest Algorithm

In this paper, the RF algorithm was applied to classify and identify the different types of insulation defects in GILB. Figure 10 shows the proposed diagnostic process for insulation defects using the RF algorithm used in this paper. The process consisted of four steps. The first step was the acquisition of PD signals corresponding to various PD defect models. In the second step, statistical PD features were extracted, and PD datasets were constructed. As explained in Section 3, PD pulses contain a lot of informative characteristics, including time-domain, frequency-domain, physical shape-domain, and phase distribution-domain features. In the third step, the constructed PD datasets were divided into training (80%) and test (20%) subsets for the RF algorithm development [31,67,68]. The RF algorithm, consisting of multiple decision trees, was trained using the training subsets. Each decision tree in the ensemble was independently trained and learned, and a voting mechanism aggregated individual predictions. In addition, variance importance analysis for identifying the greatest influences on the performance of the RF algorithm was conducted. Top-ranked features were selected to improve the efficiency of the RF algorithm by reducing computational times and costs without compromising the accuracy of PD identification and classification. In this study, the RF algorithm was employed to classify the insulation defect types using statistical PD features. The third and fourth steps were only conducted with the RF classifier algorithm to identify the insulation defect types.

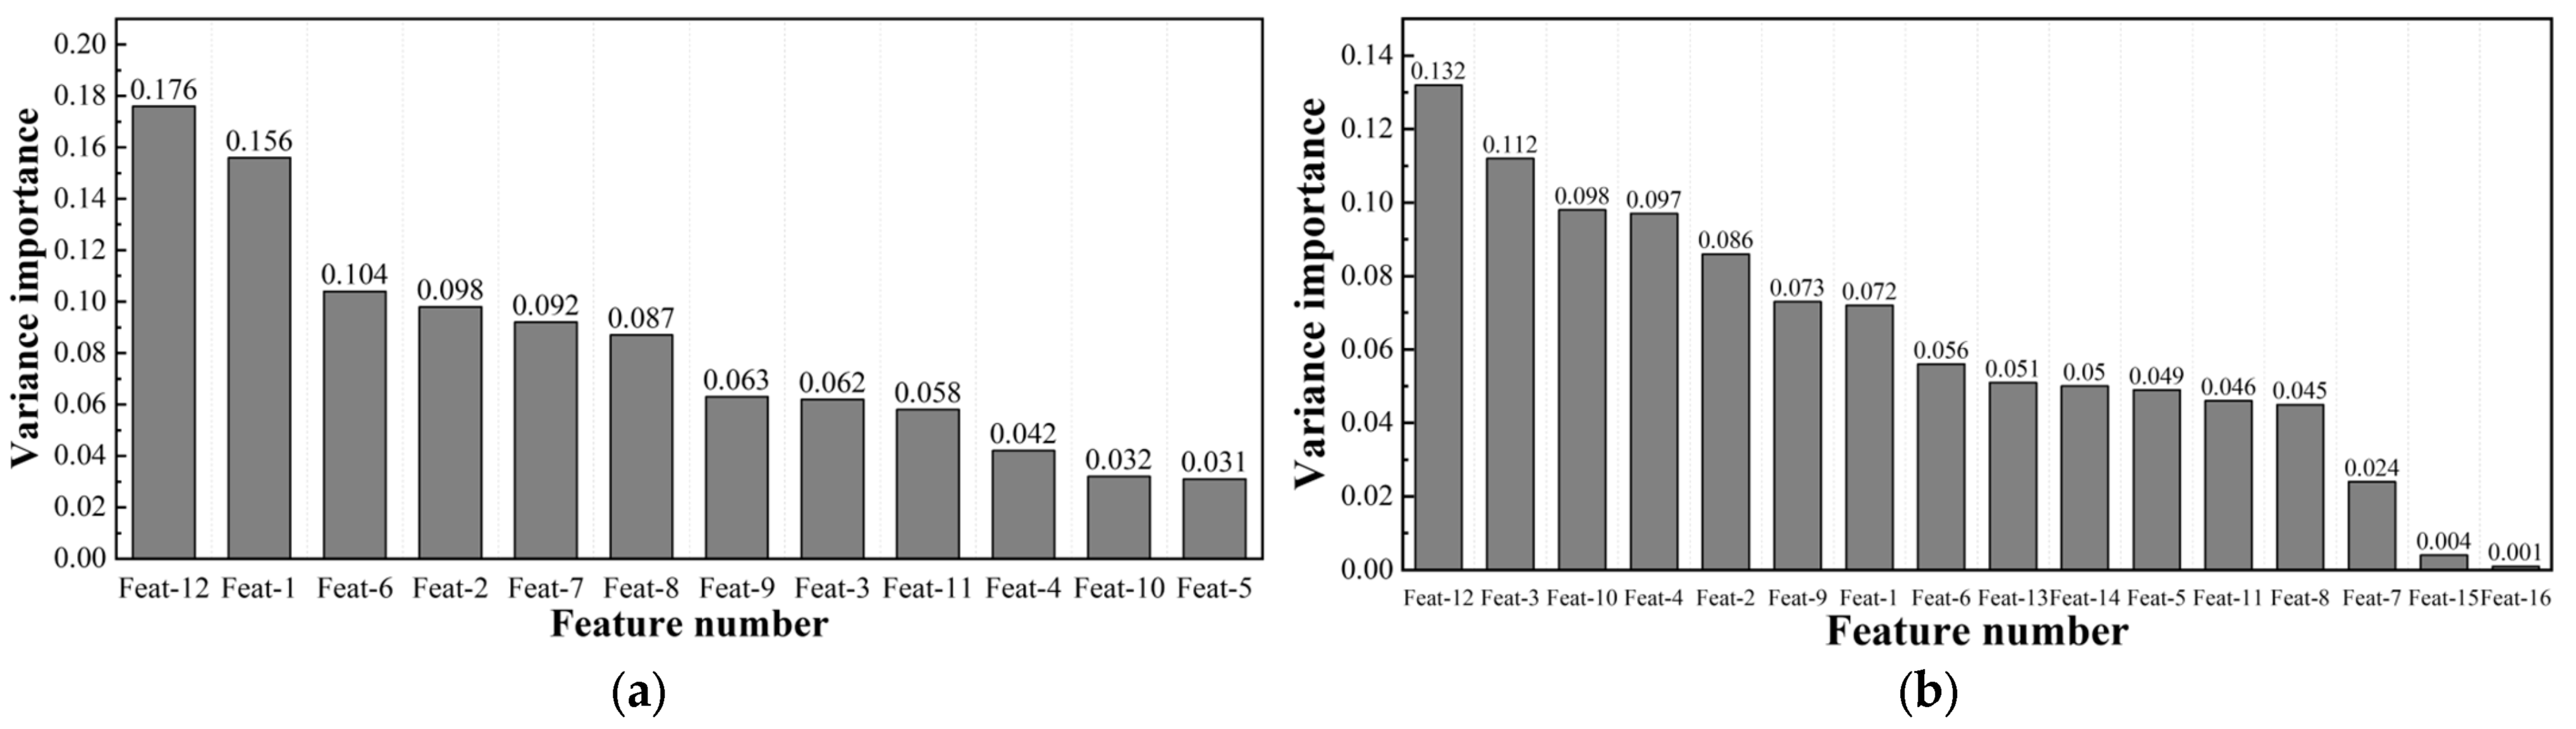
4.1. Feature Extraction

Feature extraction is the most important preprocessing step for insulation defect recognition. The accuracy of identification and classification of insulation defect recognition depends on how the PD feature datasets are well configured. PD single pulses and PRPD patterns according to each PD defect were measured and PD distinguishable features were analyzed. Typical PD single pulses were systematically measured at the discharge inception voltage (DIV) levels for each PD defect model to ensure stable and intrinsic PD characteristics. Representative PD single pulses and their FFTs and the typical PRPD patterns are shown in Figure 11 and Figure 12. The features were systematically derived and extracted across over 100 cases for each defect model under consistent conditions to ensure the reliability of the PD simulation experiment results.
Table 1 shows the summaries of the statistical features extracted from PD single pulses. In terms of time-domain features, the FMP defect model had the shortest durations in both the first and second half cycles. This behavior was due to the abrupt onset of discharge triggered by localized electric field enhancement and the short discharge path due to rapid charge neutralization [69]. In contrast, the delamination defect had the longest durations, primarily due to the Townsend-like PD mechanism, where discharge gradually occurs [40]. For frequency-domain features, only the delamination defect exhibited a low-frequency range of 7–8 MHz, whereas other defect models were concentrated at 30–35 MHz. Figure 13 presents scatter plots of PD single-pulse features, where each defect exhibited distinct clustering patterns, forming zoning distributions. Notably, the delamination defect model had a significantly wider dispersion pattern compared to other defects, forming a well-separated cluster. In terms of the phase distribution-domain features, the four defect models had their own different PD pulse distribution ratios across 30-degree phase angle intervals.
Table 2 shows the statistical features extracted from PRPD patterns. The FMP defect shows a uniform distribution over all phase ranges, with the pulse ratios increasing with the magnitudes of the applied voltage. On the other hand, PD pulses were captured only as positive or negative polarities in the POC and POE defects, respectively. For the delamination defect, almost 99% of the total discharge pulses were measured in the rising voltage ranges of both positive and negative polarities. Figure 14 shows the scatter plot of phase distribution-based features. As described, each defect model exhibited distinct pulse distribution patterns.

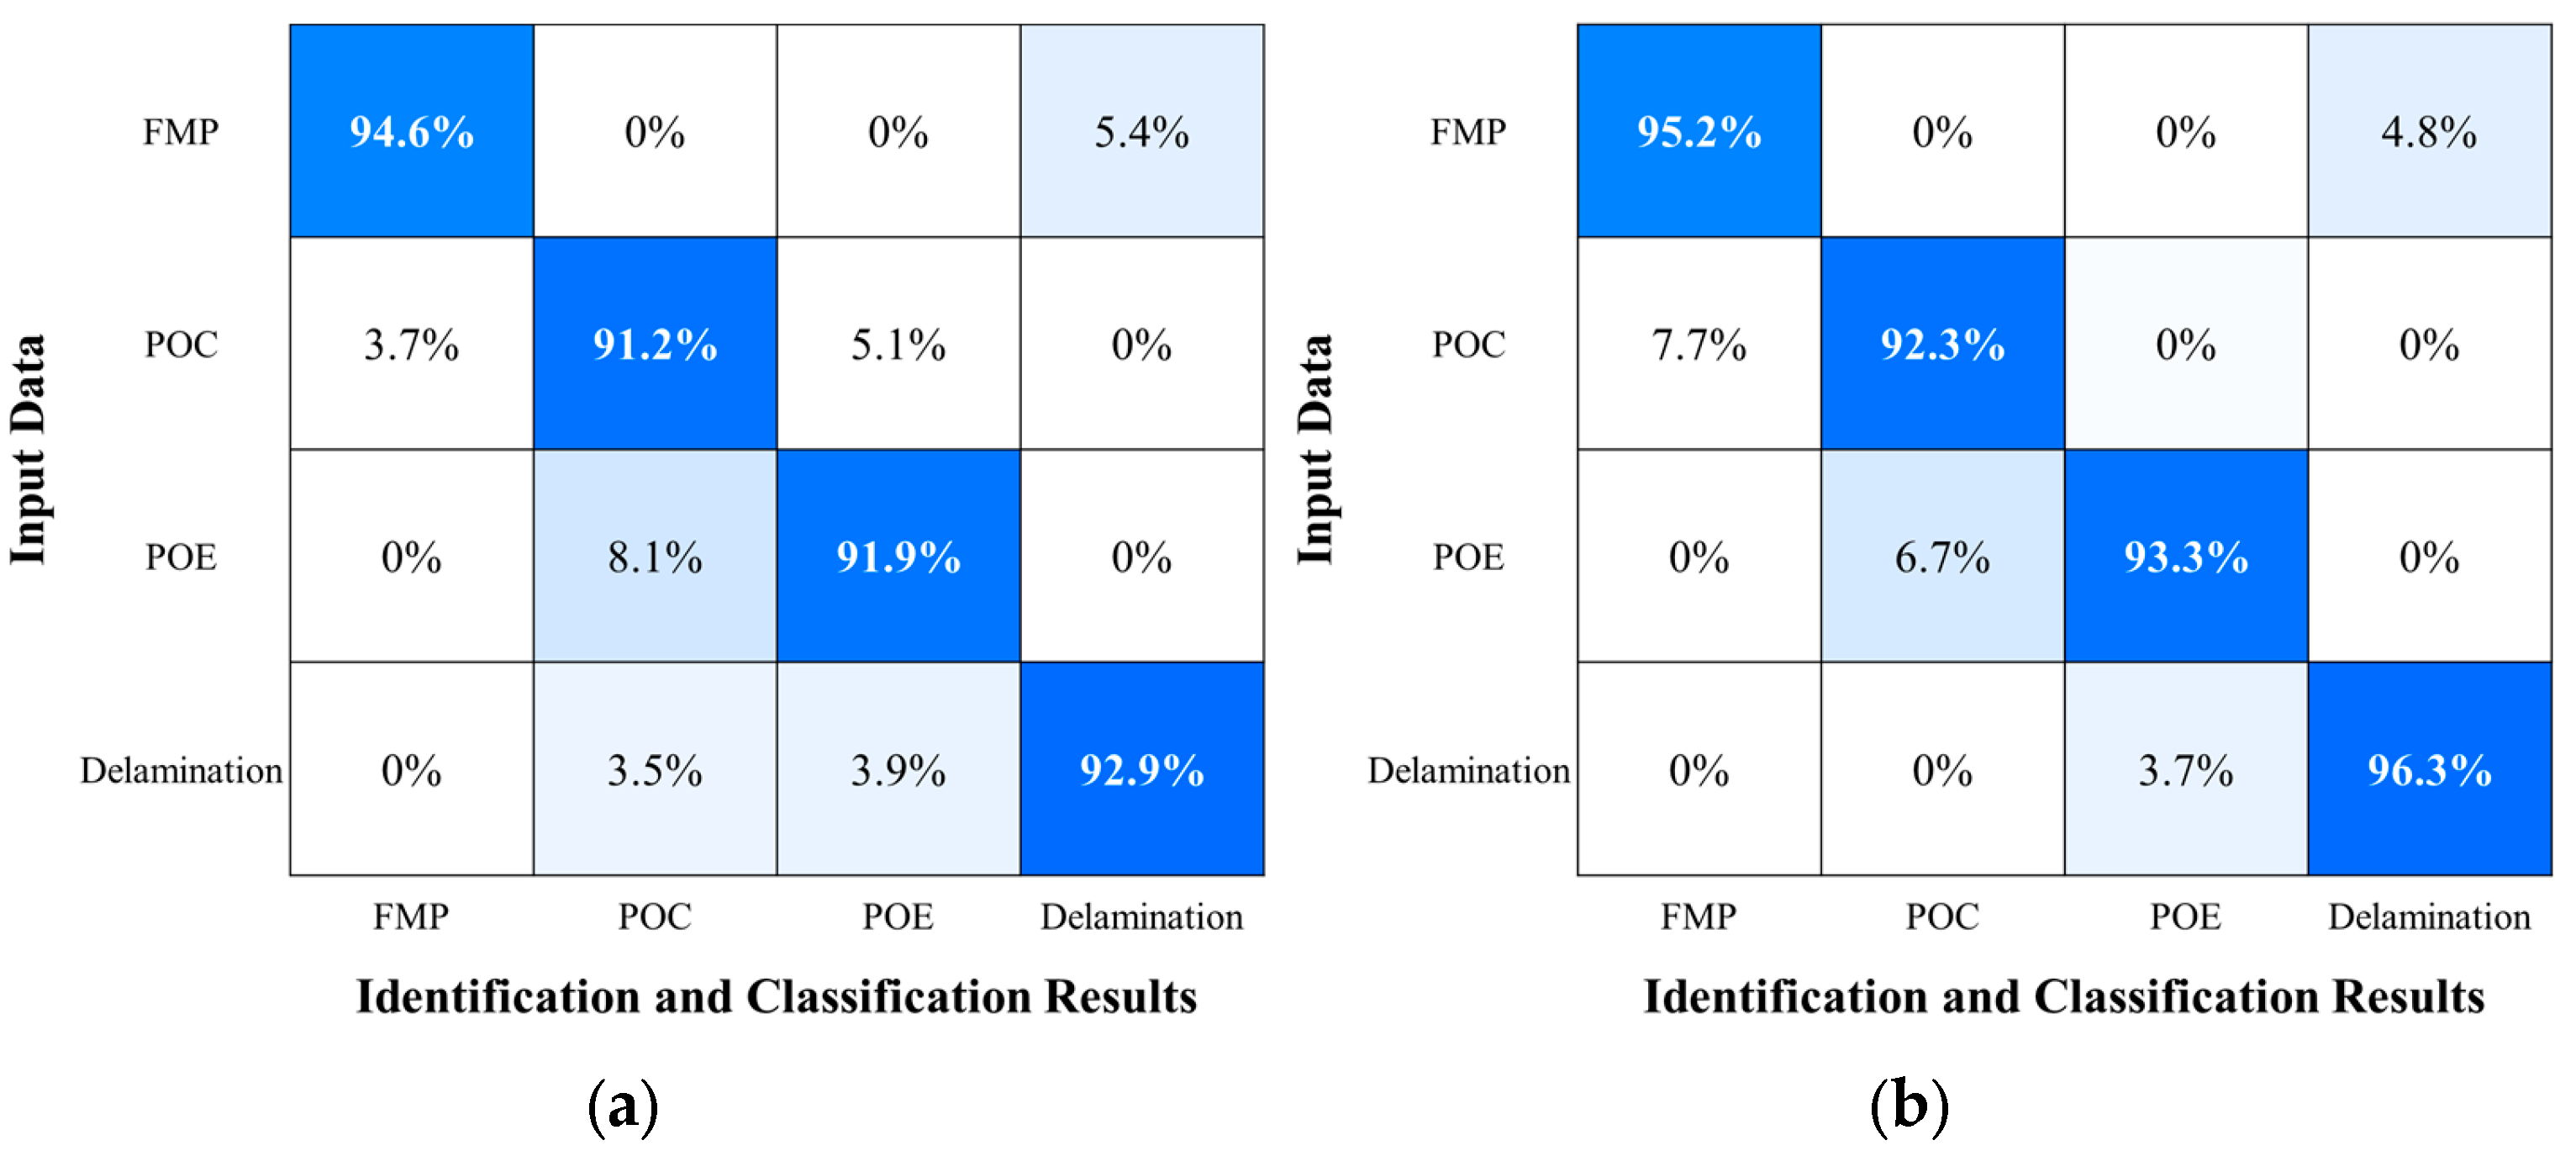
4.2. PD Defect Recognition

To evaluate the effectiveness and performance in the recognition of insulation defects, the RF algorithm was applied to the PD datasets. The RF algorithm demonstrated high reliability and robustness, primarily due to its ensemble architecture incorporating bootstrap aggregation and feature selection. This mechanism enhances the structural diversity of individual decision trees, reduces the variance of the RF algorithm model, and mitigates the overfitting. To optimize the recognition performance of the RF algorithm model, key hyperparameters such as the number of estimators in a range of 100 to 500, the maximum depth of the decision trees in a range of none and 10 to 50, and the minimum number of samples per split 0 to 10 were systematically tuned to identify the optimal configuration.
Figure 15 shows the variance importance of the PD datasets acquired from both PD single pulses and PRPD patterns. The contributions of each statistical PD feature were analyzed to identify the top-ranked features within each PD dataset, serving as the basis for optimized feature selection. As shown in Figure 15a, the top six features of PD datasets extracted from PD single pulses that exceeded 10% of the variance importance, were Feat-12 (2nd pk), Feat-1 (1-RT), Feat-6 (2-RT), Feat-2 (1-FT), Feat-7 (2-FT), and Feat-8 (2-PW). These features demonstrated the highest contributions to the performance of the RF algorithm model. On the other hand, as shown in Figure 15b, the top eight features of PD datasets extracted from PRPD patterns were Feat-12 (NE-4), Feat-3 (PO-3), Feat-10 (NE-2), Feat-4 (PO-4), Feat-2 (PO-2), Feat-9 (NE-1), Feat-1 (PO-1), and Feat-6 (PO-6). In total, 62.5% of the top-ranked features were related to phase distribution ratios in the positive polarity, indicating their significant influence on the classification process. Given the experimental setup and methodology, the physical shape-domain features such as kurtosis and skewness were found to have negligible impacts on the identification and classification process.
In the PD single-pulse analysis, the computational times using the top six optimized features (181 to 213 ms) were reduced by 133 ms on average compared to those times using all 12 features (220–474 ms). Similarly, in the PRPD pattern analysis, the computational times using the top eight optimized features (139 to 496 ms) were reduced by 296 on average ms compared to those times using all 16 features (131–837 ms). From the comparison of the computational times, it was confirmed that the establishment of PD sub-datasets using optimized feature selection techniques can reduce the computational times.
Figure 16 and Figure 17 show the identification and classification results using all features and top-ranked key features extracted from PD single pulses and PRPD patterns. In the confusion matrix, a darker color intensity represents a higher classification accuracy. In the PD single-pulse analysis, the accuracy scores were 92.99% using all features and 94.32% using the top six key features. The hyperparameter combinations of the number of estimators, the minimum samples per split, and the maximum depth of decision trees were 100, 2, and none and 10–50 using all features and 200 and 300, 2 and 4, and none and 10–50 using the top-ranked features, respectively. In the PRPD pattern analysis, the accuracy scores were 92.58% using all features and 94.29% using the top eight key features. The proposed RF algorithm with various PD datasets achieved over 90% identification and classification accuracy. The hyperparameter combinations were 200 and 300, 2–6, and none and 10–50 using all features, and 400 and 500, 8 and 10, and none and 10–50 using the top-ranked features, respectively. In addition, the accuracy scores slightly increased when using the top key features. Through the systematic exploration of the hyperparameter combinations, it was found that the number of estimators and the minimum number of samples per split had a significant impact on the identification and classification results. However, the variations in the maximum depth of decision trees within the range (none and 10–50) had no impact on the accuracy.

5. Conclusions

From the perspective of insulation condition monitoring using PD detection, this paper dealt with the insulation defect diagnosis using the RF algorithm based on optimized key features in GILB. The PRPD sensor was employed to detect PD signals generated from the PD defect models. Various types of statistical PD features—time, frequency, physical shape, and phase distribution-domain features—were defined and extracted from the PD signals. PD datasets were analyzed to evaluate the variance importance of each statistical PD feature, and the top-ranked features were subsequently selected based on their contribution to the performance. It was confirmed that the RF algorithm achieved the accuracy of identification and classification exceeding 92%. Furthermore, the PD sub-datasets using the top-ranked key features could reduce the computational times and slightly improve the insulation diagnosis accuracy. It should be noted that the proposed methodology demonstrated feasibility and effectiveness in identifying the types of insulation defects under laboratory environmental conditions. All statistical PD features used in this study were extracted from idealized PD waveforms in accordance with insulation defect models. Thus, the experiment results should be interpreted with consideration of the inherent limitations of laboratory-based tests. To extend the applicability to the operational environments, future research has to focus on the validation of PD measurement using the PRPD sensor from actual GILB under operating conditions and PD classification based on the RF algorithm model. Furthermore, additional experiments have to be conducted to enhance the accuracy of the insulation defect recognition: (1) acquisition of PD single pulses and PRPD patterns under various applied voltage levels; (2) analysis of the influences of external electric fields from adjacent phases and equipment; and (3) investigation of PD behaviors under multiple PD defect models. In addition, field application tests are required to verify the performance of the proposed RF-based insulation diagnostic method.

Author Contributions

Conceptualization, G.-S.K.; writing—original draft preparation, G.-S.K. and G.-Y.L.; review and editing, G.-S.K.; supervision, G.-S.K.; methodology and software, G.-Y.L.; validation, G.-Y.L.; formal analysis, G.-Y.L.; data curation, G.-Y.L.; visualization, G.-Y.L. All authors have read and agreed to the published version of the manuscript.

Funding

This research received no external funding.

Data Availability Statement

Data are contained within the article.

Conflicts of Interest

The authors declare no conflicts of interest.

References

  1. Zachariades, C.; Shuttleworth, R.; Giussani, R. A Dual-Slot Barrier Sensor for Partial Discharge Detection in Gas-Insulated Equipment. IEEE Sensors J. 2020, 20, 860–867. [Google Scholar] [CrossRef]
  2. Fang, Y.; Fang, J.; Cui, Z.; Mao, S.; Zhang, G.; Li, G.; Zhang, X. Discharge Characteristics of Typical Defects in GIS Based on Electro-Thermal Coupling. IEEE Trans. Dielectr. Electr. Insul. 2025, 32, 561–570. [Google Scholar] [CrossRef]
  3. Thi, N.-D.T.; Do, T.-D.; Jung, J.-R.; Jo, H.; Kim, Y.-H. Anomaly Detection for Partial Discharge in Gas-Insulated Switchgears Using Autoencoder. IEEE Access 2020, 8, 152248–152257. [Google Scholar] [CrossRef]
  4. Chang, Y.; Liu, Z.; Li, Q.; Xue, N.; Wang, J.; Hadad, M. Capture Mechanism and Optimal Design of Micro-Particle Traps in HVAC/HVDC Gas Insulated Equipment. IEEE Trans. Power Deliv. 2022, 37, 4700–4710. [Google Scholar]
  5. Azam, S.M.K.; Chan, J.Q.; Othman, M.; Raymond, W.J.K.; Illias, H.A.; Latef, T.A.; Hossain, A.K.M.Z.; Vettikalladi, H.; Almuhlafi, A.M.; Himdi, M.; et al. Electromagnetic Characteristics Interpretation of Partial Discharge Phenomena at Variable Distance in High-Voltage Systems. IEEE Access 2024, 12, 127718–127730. [Google Scholar] [CrossRef]
  6. Shin, G.-C.; Kim, S.-W.; Kil, G.-S. Comparison between the PD Characteristics of g3 and Dry Air for Gas-Insulated Switchgears. Energies 2022, 15, 7043. [Google Scholar] [CrossRef]
  7. IEC 60270; High Voltage Test Techniques–Partial Discharge Measurements. International Electrotechnical Commission: Geneva, Switzerland, 2000.
  8. IEC TS 62478; High Voltage Test Techniques–Measurement of Partial Discharges by Electromagnetic and Acoustic Methods. International Electrotechnical Commission: Geneva, Switzerland, 2016.
  9. Kreuger, F.H. Partial Discharge Detection in High-voltage Equipment; Butterworths: Carlisle, UK, 1989; pp. 129–152. [Google Scholar]
  10. Wu, M.; Cao, H.; Cao, J.; Nguyen, H.-L.; Gomes, J.B.; Krishnaswamy, S.P. Krishnaswamy, An overview of state-of-the-art partial discharge analysis techniques for condition monitoring. IEEE Elect. Insul. Mag. 2015, 31, 22–35. [Google Scholar] [CrossRef]
  11. Gulski, E.; Koltunowicz, W.; Ariaans, T.; Behrmann, G.; Jongen, R.; Garnacho, F.; Kornhuber, S.; Ohtsuka, S.; Petzold, F.; Sánchez-Urán, M.A.; et al. Guidelines for Partial Discharge Detection using Conventional (IEC60270) and Unconventional Methods; CIGRE WG D1.37; CIGRE: Paris, France, 2016; p. 288. [Google Scholar]
  12. Kil, G.-S.; Kim, I.K.; Park, D.-W.; Choi, S.-Y.; Park, C.-Y. Park, Measurements and analysis of the acoustic signals produced by partial discharges in insulation oil. Curr. Appl. Phys. 2009, 9, 296–300. [Google Scholar] [CrossRef]
  13. Ilkhechik, H.D.; Samimi, M.H. Applications of the Acoustic Method in Partial Discharge Measurement: A Review. IEEE Trans. Dielectr. Electr. Insul. 2021, 28, 42–51. [Google Scholar] [CrossRef]
  14. Kim, S.-W.; Kim, N.-H.; Kim, D.-E.; Kim, T.-H.; Jeong, D.-H.; Chung, Y.-H.; Kil, G.-S. Experimental Validation for Moving Particle Detection Using Acoustic Emission Method. Energies 2021, 14, 8516. [Google Scholar] [CrossRef]
  15. Mondal, M.; Kumbhar, G. Partial Discharge Localization in a Power Transformer: Methods, Trends, and Future Research. IETE Tech. Rev. 2019, 34, 504–513. [Google Scholar] [CrossRef]
  16. CIGRE WG D1.33. High-Voltage On-Site Testing with Partial Discharge Measurement. Electra 2012, 262, 83–93. [Google Scholar]
  17. Imburgia, A.; Di Fatta, A.; Romano, P.; Rizzo, G.; Vigni, V.L.; Ala, G. A Study on Partial Discharges Pattern Recognition Under DC Voltage Through Clustering Algorithms and Cross Correlation Filter. IEEE Trans. Dielectr. Electr. Insul. 2023, 30, 2543–2550. [Google Scholar] [CrossRef]
  18. Wang, L.; Cavallini, A.; Montanari, G.C.; Testa, L. Evolution of PD Patterns in Polyethylene Insulation Cavities under AC Voltage. IEEE Trans. Dielectr. Electr. Insul. 2012, 19, 533–542. [Google Scholar] [CrossRef]
  19. Fan, X.; Luo, H.; Liang, F.; Ma, T.; Hu, J.; Li, C.; He, J. Feature Fusion of Pulse Current, Ultrahigh Frequency, and Photon Count Signal: A Novel Discharge Pattern Recognition Method of Metal Particles in GIS/GIL. IEEE Sensors J. 2024, 24, 36979–36986. [Google Scholar] [CrossRef]
  20. Kim, S.-W. Identification of Partial Discharge Defect Detection in Cast-Resin Power Transformers Using Back-Propagation Algorithm. J. Inf. Commun. Converg. Eng. 2024, 22, 231–236. [Google Scholar] [CrossRef]
  21. Kim, S.-W.; Jung, J.-R.; Kim, Y.-M.; Kil, G.-S.; Wang, G. New Diagnosis Method of Unknown Phase-shifted PD Signals for Gas Insulated Switchgears. IEEE Trans. Dielectr. Electr. Insul. 2018, 25, 102–109. [Google Scholar] [CrossRef]
  22. Lee, J.-H.; Hozumi, N.; Okamoto, T. Discrimination of phase-shifted partial discharge patterns by neural network using standardization method. In Proceedings of the 1994 IEEE International Symposium on Electrical Insulation, Pittsburgh, PA, USA, 5–8 June 1994. [Google Scholar]
  23. Sun, S.; Sun, Y.; Xu, G.; Zhang, L.; Hu, Y.; Liu, P. Partial Discharge Pattern Recognition of Transformers Based on the Gray-Level Co-Occurrence Matrix of Optimal Parameters. IEEE Access 2021, 9, 102422–102432. [Google Scholar] [CrossRef]
  24. Kartojo, I.H.; Wang, Y.-B.; Zhang, G.-J. Suwarno, Partial Discharge Defect Recognition in Power Transformer using Random Forest. In Proceedings of the 2019 IEEE 20th International Conference on Dielectric Liquids (ICDL), Roma, Italy, 23–27 June 2019. [Google Scholar]
  25. Jing, Q.; Yan, J.; Wang, Y.; He, R.; Lu, L. A novel differentiable neural network architecture automatic search method for GIS partial discharge pattern recognition. Measurement 2022, 195, 111154. [Google Scholar] [CrossRef]
  26. Wang, Y.; Yan, J.; Yang, Z.; Jing, Q.; Wang, J.; Geng, Y. GAN and CNN for imbalanced partial discharge patterner cognition in GIS. High Volt. 2022, 7, 452–460. [Google Scholar] [CrossRef]
  27. Wang, Z.; Liu, Z.; Qiao, L.; Qian, D.; Chen, Z.; Gao, C.; Wang, W. Research on partial discharge pattern recognition in GIS based on EFPI sensor. J. Electr. Eng. Technol. 2024, 19, 577–584. [Google Scholar] [CrossRef]
  28. Yin, K.; Wang, Y.; Liu, S.; Li, P.; Xue, Y.; Li, B.; Dai, K. GIS Partial Discharge Pattern Recognition Based on Multi-Feature Information Fusion of PRPD Image. Symmetry 2022, 14, 2464. [Google Scholar] [CrossRef]
  29. Yao, R.; Li, J.; Hui, M.; Bai, L.; Wu, Q. Feature selection based on random forest for partial discharges characteristic set. IEEE Access 2020, 8, 159151–159161. [Google Scholar] [CrossRef]
  30. Peng, X.; Li, J.-S.; Wang, G.; Wu, Y.; Li, L.; Li, Z.; Bhatti, A.A.; Zhou, C.; Hepburn, D.M.; Reid, A.J.; et al. Random Forest Based Optimal Feature Selection for Partial Discharge Pattern Recognition in HV Cables. IEEE Trans. Dielectr. Electr. Insul. 2019, 34, 1715–1724. [Google Scholar] [CrossRef]
  31. Govindarajan, S.; Ardila-Rey, J.A.; Krithivasan, K.; Subbaiah, J.; Sannidhi, N.; Balasubramanian, M. Development of Hypergraph Based Improved Random Forest Algorithm for Partial Discharge Pattern Classification. IEEE Access 2021, 9, 96–109. [Google Scholar] [CrossRef]
  32. Selvan, K.T. A Revisiting of Scientific and Philosophical Perspectives on Maxwell’s Displacement Current. IEEE Antennas Propag. Mag. 2009, 51, 36–46. [Google Scholar] [CrossRef]
  33. Lee, G.-Y.; Kim, N.-H.; Kim, D.-E.; Kil, G.-S.; Kim, S.-W. The Design, Fabrication, and Evaluation of a Phase-Resolved Partial Discharge Sensor Embedded in a MV-Class Bushing. Sensors 2023, 23, 9844. [Google Scholar] [CrossRef]
  34. Shahsavarian, T.; Pan, Y.; Zhang, Z.; Pan, C.; Naderiallaf, H.; Guo, J.; Li, C.; Cao, Y. A Review of Knowledge-Based Defect Identification via PRPD Patterns in High Voltage Apparatus. IEEE Access 2021, 9, 77705–77728. [Google Scholar] [CrossRef]
  35. Li, X.; Liu, W.; Xu, Y.; Ding, D. Partial Discharge and Movement Characteristics of Micron-sized Metal Particles on Insulator Surface in Gas-Insulated Switchgear with Long-time AC Stress. IEEE Trans. Dielectr. Electr. Insul. 2021, 28, 2152–2160. [Google Scholar] [CrossRef]
  36. Wang, G.; Kim, W.-H.; Kil, G.-S.; Kim, S.-W.; Jung, J.-R. Green Gas for a Grid as An Eco-Friendly Alternative Insulation Gas to SF6: From the Perspective of Partial Discharge Under AC. Appl. Sci. 2019, 9, 651. [Google Scholar] [CrossRef]
  37. Illias, H.; Yuan, T.S.; Baker, A.H.A.; Mokhlis, H.; Chen, G.; Lewin, P.L. Partial Discharge Patterns in High Voltage Insulation. In Proceedings of the 2012 IEEE International Conference on Power and Energy (PECon), Kota Kinabalu Sabah, Malaysia, 2–5 December 2012. [Google Scholar]
  38. Mansour, D.-E.A.; Taha, I.B.; Farade, R.A.; Wahab, N.I.B.A. Partial Discharge Diagnosis in GIS based on Pulse Sequence Features and Optimized Machine Learning Classification Techniques. Electr. Power Syst. Res. 2022, 211, 108162. [Google Scholar] [CrossRef]
  39. Li, C.; Peng, X.; Wang, H.; Chen, Y.; Ling, P.; Liu, T.; Zhang, Y.; Zhou, J. Dynamic Partial Discharge Characteristics of Generator Stator Bar with Four Typical Defects. IEEE Trans. Dielectr. Electr. Insul. 2025, 32, 494–503. [Google Scholar] [CrossRef]
  40. Mansour, D.-E.A.; Kojima, H.; Hayakawa, N.; Hanai, M.; Okubo, H. Physical mechanisms of partial discharges at nitrogen filled delamination in epoxy cast resin power apparatus. IEEE Trans. Dielectr. Electr. Insul. 2013, 20, 454–461. [Google Scholar] [CrossRef]
  41. Su, M.-S.; Chia, C.-C.; Chen, C.-Y.; Chen, J.-F. Classification of partial discharge events in GILBS using probabilistic neural networks and the fuzzy c-means clustering approach. Int. J. Electr. Power Energy Syst. 2014, 16, 173–179. [Google Scholar] [CrossRef]
  42. Ogliari, E.; Sakwa, M.; Wei, J.; Liu, W.; Schubert, B.; Palo, M. General Machine Learning-Based Approach to Pulse Classification for Separation of Partial Discharges and Interference. IEEE Sensors J. 2023, 23, 26839–26849. [Google Scholar] [CrossRef]
  43. Breiman, L. Random Forests. Mach. Learn. 2001, 45, 5–32. [Google Scholar] [CrossRef]
  44. Hussein, R.; Shaban, K.B.; El-Hag, A.H. Robust Feature Extraction and Classification of Acoustic Partial Discharge Signals Corrupted with Noise. IEEE Trans. Instrum. Meas. 2017, 66, 405–413. [Google Scholar] [CrossRef]
  45. Dai, B.; Gu, C.; Zhao, E.; Qin, X. Statistical model optimized random forest regression model for concrete dam deformation monitoring. Struct. Contr. Health Monit. 2018, 25, e2170. [Google Scholar] [CrossRef]
  46. Basha, G.A.; Gupta, K.L. Ramakrishna, Expectation of Radar Returns from Ionosphere Using Decision Tree Technique. In Advances in Data Science and Management, 1st ed.; Borah, S., Balas, V.E., Polkowski, Z., Eds.; Springer: Singapore, Singapore, 2020; pp. 209–214. [Google Scholar]
  47. Juhn, M.; Johnson, K. Applied Predictive Modeling, 1st ed.; Springer: New York, NY, USA, 2013; pp. 173–220. [Google Scholar]
  48. Chang, E.; Zavarin, M.; Beverly, L.; Wainwright, H. A chemistry-informed hybrid machine learning approach to predict metal adsorption onto mineral surfaces. Appl. Geochem. 2023, 155, 105731. [Google Scholar] [CrossRef]
  49. Liu, C.H.B.; Chamberlain, B.P.; Little, D.A.; Cardoso, A. Generalising random forest parameter optimisation to include stability and cost. In Proceedings of the Machine Learning and Knowledge Discovery in Databases: European Conference, Skopje, Macedonia, 18–22 September 2017. [Google Scholar]
  50. Hastie, T.; Friedman, J.; Tibshirani, R. The Elements of Statistical Learning, 1st ed.; Springer: New York, NY, USA, 2013; pp. 33–36. [Google Scholar]
  51. Murphy, K.P. Machine Learning: A Probabilistic Perspective, 1st ed.; MIT Press: London, UK, 2012; pp. 553–587. [Google Scholar]
  52. Mitchell, T.M. Machine Learning, 1st ed.; McGraw-Hill: New York, NY, USA, 1997; pp. 66–87. [Google Scholar]
  53. Breiman, L.; Friedman, J.; Olshen, R.; Stone, C. Classification and Regression Trees, 1st ed.; CRC Press: Boca Raton, FL, USA, 1984. [Google Scholar]
  54. Iorkyase, E.T.; Tachtatzis, C.; Glover, I.A.; Lazaridis, P.; Upton, D.; Saeed, B.; Atkinson, R.C. Improving RF-Based Partial Discharge Localization via Machine Learning Ensemble Method. IEEE Trans. Power Deliv. 2019, 34, 1478–1489. [Google Scholar] [CrossRef]
  55. Tian, J.; Song, H.; Sheng, G.; Jiang, X. Knowledge-Driven Recognition Methodology of Partial Discharge Patterns in GIS. IEEE Trans. Power Deliv. 2022, 37, 3335–3344. [Google Scholar] [CrossRef]
  56. Bartnikas, R. Partial Discharges: Their Mechanism, Detection and Measurement. IEEE Trans. Dielectr. Electr. Insul. 2002, 9, 763–808. [Google Scholar] [CrossRef]
  57. Cheng, Y.; Wang, T.; Xu, C.; Guo, Q.; Peng, G.-D. Measurement and simulation of partial discharge using optical signal based on crystal fluorescent fiber. Opt. Fiber Technol. 2024, 82, 103626. [Google Scholar] [CrossRef]
  58. Romano, P.; Imburgia, A.; Rizzo, G.; Ala, G.; Candela, R. A New Approach to Partial Discharge Detection Under DC Voltage Application to Different Materials. IEEE Electr. Insul. Mag. 2021, 37, 18–32. [Google Scholar] [CrossRef]
  59. Rostaghi-Chalaki, M.; Yousefpour, K.; Klüss, J.; Kurum, M.; Donohoe, J.P.; Park, C. Classification and comparison of AC and DC partial discharges by pulse waveform analysis. Int. J. Electr. Power Energy Syst. 2021, 125, 106518. [Google Scholar] [CrossRef]
  60. Cochran, W.T.; Cooley, J.W.; Favin, D.L.; Helms, H.D.; Kaenel, R.A.; Lang, W.W. What is the fast Fourier transform? Proc. IEEE 1967, 55, 1664–1674. [Google Scholar] [CrossRef]
  61. Rajaby, E.; Sayedi, S.M. A structured review of sparse fast Fourier transform algorithms. Digit. Signal Process. 2022, 123, 103403. [Google Scholar] [CrossRef]
  62. Lu, L.; Ren, W.-X.; Wang, S.-D. Fractional Fourier transform: Time-frequency representation and structural instantaneous frequency identification. Mech. Syst. Signal Process. 2022, 178, 109305. [Google Scholar] [CrossRef]
  63. Carvalho, I.F.; da Costa, E.G.; Nobrega, L.A.M.M.; Silva, A.D.D.C. Identification of Partial Discharge Sources by Feature Extraction from a Signal Conditioning System. Sensors 2024, 24, 2226. [Google Scholar] [CrossRef]
  64. Chen, Y.; Hao, Y.; Huang, T.; Xiao, J.; Hui, B.; Chen, Y. Voltage Equivalence of Partial Discharge Tests for XLPE Insulation Defects. IEEE Trans. Dielectr. Electr. Insul. 2022, 29, 683–692. [Google Scholar] [CrossRef]
  65. Xu, Z.; Zheng, L.; Liu, R.; Peng, C.; Zhang, Z.; Gao, P.; Liang, L.; Lei, Z. Research on Characteristics of Typical Partial Discharge Pattern in GIS Based on SiPM. In Proceedings of the 2024 IEEE 5th ICD, Toulouse, France, 30 June–4 July 2024. [Google Scholar]
  66. Chang, C.-K.; Chang, H.-H.; Boyanapalli, B.K. Application of Pulse Sequence Partial Discharge Based Convolutional Neural Network in Pattern Recognition for Underground Cable Joints. IEEE Trans. Dielectr. Electr. Insul. 2022, 29, 1070–1078. [Google Scholar] [CrossRef]
  67. Sarathi, R.; Umamaheswari, R. Understanding the partial discharge activity generated due to particle movement in a composite insulation under AC voltages. Int. J. Electr. Power Energy Syst. 2013, 48, 1–9. [Google Scholar] [CrossRef]
  68. Seitz, S.; Götz, T.; Lindenberg, C.; Tetzlaff, R.; Schlegel, S. Towards Generalizable Classification of Partial Discharges in Gas-Insulated HVDC Systems Using Neural Networks: Protrusions and Particle. IEEE Trans. Power Deliv. 2024, 39, 1491–1499. [Google Scholar] [CrossRef]
  69. Gupta, A.; Sahoo, R.; Rao, C.V.; Karmakar, S. Partial Discharge Source Classification Using Random Forest Model. In Proceedings of the 2024 IEEE International Conference on Smart Power Control and Renewable Energy (ICSPCRE), Rourkela, India, 19–21 July 2024. [Google Scholar]
Figure 1. Phase difference in the field PD measurement case.
Electronics 14 01940 g001
Figure 2. Configurations: (a) PRPD sensor embedded in MV bushing and (b) experimental setup.
Electronics 14 01940 g002
Figure 3. Typical internal defect types of the GILB.
Electronics 14 01940 g003
Figure 4. PD defect models: (a) FMP defect; (b) POC defect; (c) POE defect; and (d) delamination defect.
Electronics 14 01940 g004
Figure 5. General structure of the Random Forest algorithm.
Electronics 14 01940 g005
Figure 6. Typical PD single pulse with time-domain features.
Electronics 14 01940 g006
Figure 7. Typical PD single pulse and its FFT result: (a) an example PD single pulse; and (b) its FFT spectra.
Electronics 14 01940 g007
Figure 8. Data distributions: (a) kurtosis; and (b) skewness.
Electronics 14 01940 g008
Figure 9. An example PRPD pattern and its phase distribution-domain features: (a) an example PRPD pattern; and (b) its phase distribution-domain features.
Electronics 14 01940 g009
Figure 10. Diagnostic process for insulation defects using the RF algorithm.
Electronics 14 01940 g010
Figure 11. PD single pulses and their FFTs in accordance with PD defect models: (a) PD single pulses; and (b) their FFT spectra.
Electronics 14 01940 g011
Figure 12. PRPD patterns in accordance with PD defect models.
Electronics 14 01940 g012
Figure 13. Scatter plots in accordance with time and physical-domain features in accordance with PD defect models: (a) 1st half cycle; and (b) 2nd half cycle.
Electronics 14 01940 g013
Figure 14. Scatter plots of phase distribution-domain features in accordance with PD defect models.
Electronics 14 01940 g014
Figure 15. Variance importances of each PD dataset: (a) PD single pulses; and (b) PRPD patterns.
Electronics 14 01940 g015
Figure 16. Confusion matrices of PD single pulses: (a) all features; and (b) top-ranked key features.
Electronics 14 01940 g016
Figure 17. Confusion matrices of PRPD patterns: (a) all features; and (b) top-ranked key features.
Electronics 14 01940 g017
Table 1. Statistical features of PD single pulses in accordance with PD defect models.
Types of PD Defect Models1st Half Cycle2nd Half CycleFrequency
1-RT1-FT1-PW1-KUR1-SKE2-RT2-FT2-PW2-KUR2-SKE1st Pk2nd Pk
FMP2.98 ns7.51 ns4.89 ns−1.130.21.51 ns1.86 ns2.22 ns−0.490.5334.65 MHz30.42 MHz
POC7.43 ns7.96 ns6.42 ns−0.93−0.417.46 ns7.24 ns8.48 ns−1.2−0.2134.13 MHz35.25 MHz
POE5.79 ns7.18 ns5.93 ns−1.24−0.0910.57 ns5.96 ns10.96 ns−0.44−0.2334.03 MHz30.53 MHz
Delamination25.12 ns37.74 ns39.48 ns−1.1−0.0121.42 ns36.86 ns38.23 ns−1.020.068.02 MHz7.18 MHz
Table 2. Statistical features of PRPD patterns in accordance with PD defect models.
Types of PD Defect ModelsPositive Half CycleNegative Half Cycle
PO-1PO-2PO-3PO-4PO-5PO-6PO-KURPO-SKENE-1NE-2NE-3NE-4NE-5NE-6NE-KURNE-SKE
FMP5.1%6.3%10.1%10.5%9.1%7.6%7.622.625.2%6.5%10.3%11.2%10.0%7.7%7.00−2.51
POC0.0%1.0%53.5%45.4%0.0%0.0%2.081.78-
POE-0.0%0.0%1.7%43.0%55.3%0.0%15.44−3.57
Delamination16.8%31.5%0.5%0.1%0.1%0.0%11.042.7126.4%21.0%2.8%0.5%0.3%0.0%8.90−2.58
Disclaimer/Publisher’s Note: The statements, opinions and data contained in all publications are solely those of the individual author(s) and contributor(s) and not of MDPI and/or the editor(s). MDPI and/or the editor(s) disclaim responsibility for any injury to people or property resulting from any ideas, methods, instructions or products referred to in the content.

