Article

Current Ripple and Dynamic Characteristic Analysis for Active Magnetic Bearing Power Amplifiers with Eddy Current Effects

National Key Laboratory of Electromagnetic Energy, Naval University of Engineering, Wuhan 430033, China
*
Author to whom correspondence should be addressed.
Electronics 2025, 14(10), 1936; https://doi.org/10.3390/electronics14101936
Submission received: 21 March 2025 / Revised: 26 April 2025 / Accepted: 7 May 2025 / Published: 9 May 2025

Abstract

:
Active magnetic bearings (AMBs), pivotal in high-speed rotating machinery for their frictionless operation and precise control, demand power amplifiers with exceptional dynamic performance and minimal current ripple. However, conventional amplifier designs often overlook eddy current effects, a critical oversight given the high-frequency switching inherent to pulse-width modulation (PWM). These induced eddy currents distort output waveforms, amplify ripple, and degrade system bandwidth. This paper bridges this critical gap by proposing a comprehensive methodology to model, quantify, and mitigate eddy current impacts on three-level half-bridge power amplifiers. A novel mutual inductance-embedded circuit model was developed, integrating winding–eddy current interactions under PWM operations, while a discretized transfer function framework dissects frequency-dependent ripple amplification and phase hysteresis. A voltage selection criterion was analytically derived to suppress nonlinear distortions, ensuring stable operation in high-precision applications. A Simulink simulation model was established to verify the accuracy of the theoretical model. Experimental validation demonstrated a 212% surge in steady-state ripple (48 mA to 150 mA at 4 A DC bias) under a 20 kHz PWM operation, aligning with theoretical predictions. Dynamic load tests (400 Hz) showed a 6.28% current amplitude reduction at 80 V DC bus voltage compared to 40 V, highlighting bandwidth degradation. This research provides a paradigm for optimizing AMB power electronics, enhancing precision in next-generation high-speed systems.

1. Introduction

Active magnetic bearings (AMBs) have revolutionized high-speed rotating machinery by enabling frictionless rotor levitation through electromagnetic forces. Their unparalleled advantages—including zero mechanical wear, extended operational lifespan, and adaptive controllability—have positioned AMBs as critical components in advanced industrial applications such as turbomachinery, aerospace gyroscopes, and energy storage flywheels [1,2]. Central to AMB performance is the power amplifier, which governs the precision and dynamics of current delivery to electromagnetic coils. To achieve stable levitation and vibration suppression in high-speed regimes, these amplifiers must satisfy stringent requirements—wide bandwidth for dynamic stability, minimal current ripple to ensure force accuracy, and high energy efficiency for industrial scalability [3,4,5].
Modern AMB systems increasingly adopt pulse-width-modulation (PWM)-based switching amplifiers to address power density and efficiency demands. However, the high-frequency switching inherent to PWM induces eddy currents in laminated cores—a critical yet often overlooked phenomenon in conventional amplifier designs. These parasitic currents generate counteracting magnetic fields, distorting output waveforms, amplifying current ripple, and introducing phase hysteresis. Consequently, system bandwidth degrades, and control accuracy diminishes, posing significant challenges for applications requiring micron-level precision [6]. Existing studies predominantly neglect the interplay between time-varying reluctance effects and PWM-specific nonlinearities under dynamic loads. For instance, prior studies primarily focused on static eddy current losses or idealized linear models [7,8], whereas recent advances address dynamic interactions in practical switching architectures. The authors of [9] established a theoretical framework for dynamic reluctance analysis by modeling eddy current effects on thrust-bearing stiffness; [10] proposed a 3-DOF magnetic bearing design integrating eddy current and leakage effects, critical for high-speed motor applications; [11] developed an adaptive quasi-three-level PWM method to suppress overvoltage in switching amplifiers, validated experimentally; and [12] introduced an adaptive control strategy to enhance bandwidth and stability in AMB power amplifiers under variable loads. This gap between idealized analyses and industrial implementations underscores the urgent need for a holistic framework that integrates eddy current dynamics into amplifier design.
The proposed methodology, including theoretical modeling, experimental design, and validation protocols, is detailed in Section 2. The remainder of this paper is organized as follows: Section 3 details the working principles and ideal modeling of three-level amplifiers. Section 4 derives current ripple expressions with and without eddy currents, while Section 5 validates theoretical findings through simulations and experiments. Conclusions are discussed in Section 6.

2. Methodology

2.1. Theoretical Framework

This study proposes a mutual inductance-embedded circuit model to characterize the dynamic interactions between magnetic bearing windings and eddy current paths under PWM operations. The model is established based on the following core equations: (1) circuit equations; (2) time domain response synthesis; and (3) voltage selection criterion.

2.2. Experimental Design

A three-level half-bridge power amplifier (switching frequency: 20 kHz) coupled with a silicon steel laminated magnetic bearing (airgap: 0.5 mm) was used. An LCR impedance analyzer (10 Hz), a high-precision current probe (100 MHz bandwidth), and a data acquisition system (1 MS/s sampling rate) were also used.
System identification was performed using the Adaptive Gauss–Newton Algorithm (GNA). A sinusoidal excitation current was applied, and voltage/current phase hysteresis was measured. Then, a second-order transfer function (Equation (40)) was fitted to extract eddy current parameters.

2.3. Validation Protocol

(1) Steady-State Ripple Analysis
Procedure: fix DC bias (e.g., 4 A) and measure current ripple amplitude under 20 kHz PWM.
(2) Dynamic Bandwidth Testing
Frequency sweep: apply sinusoidal reference currents from 100 Hz to 1 kHz and record amplitude–frequency responses.

3. The Working Principle and Ideal Model of the Three-Level Power Amplifier System

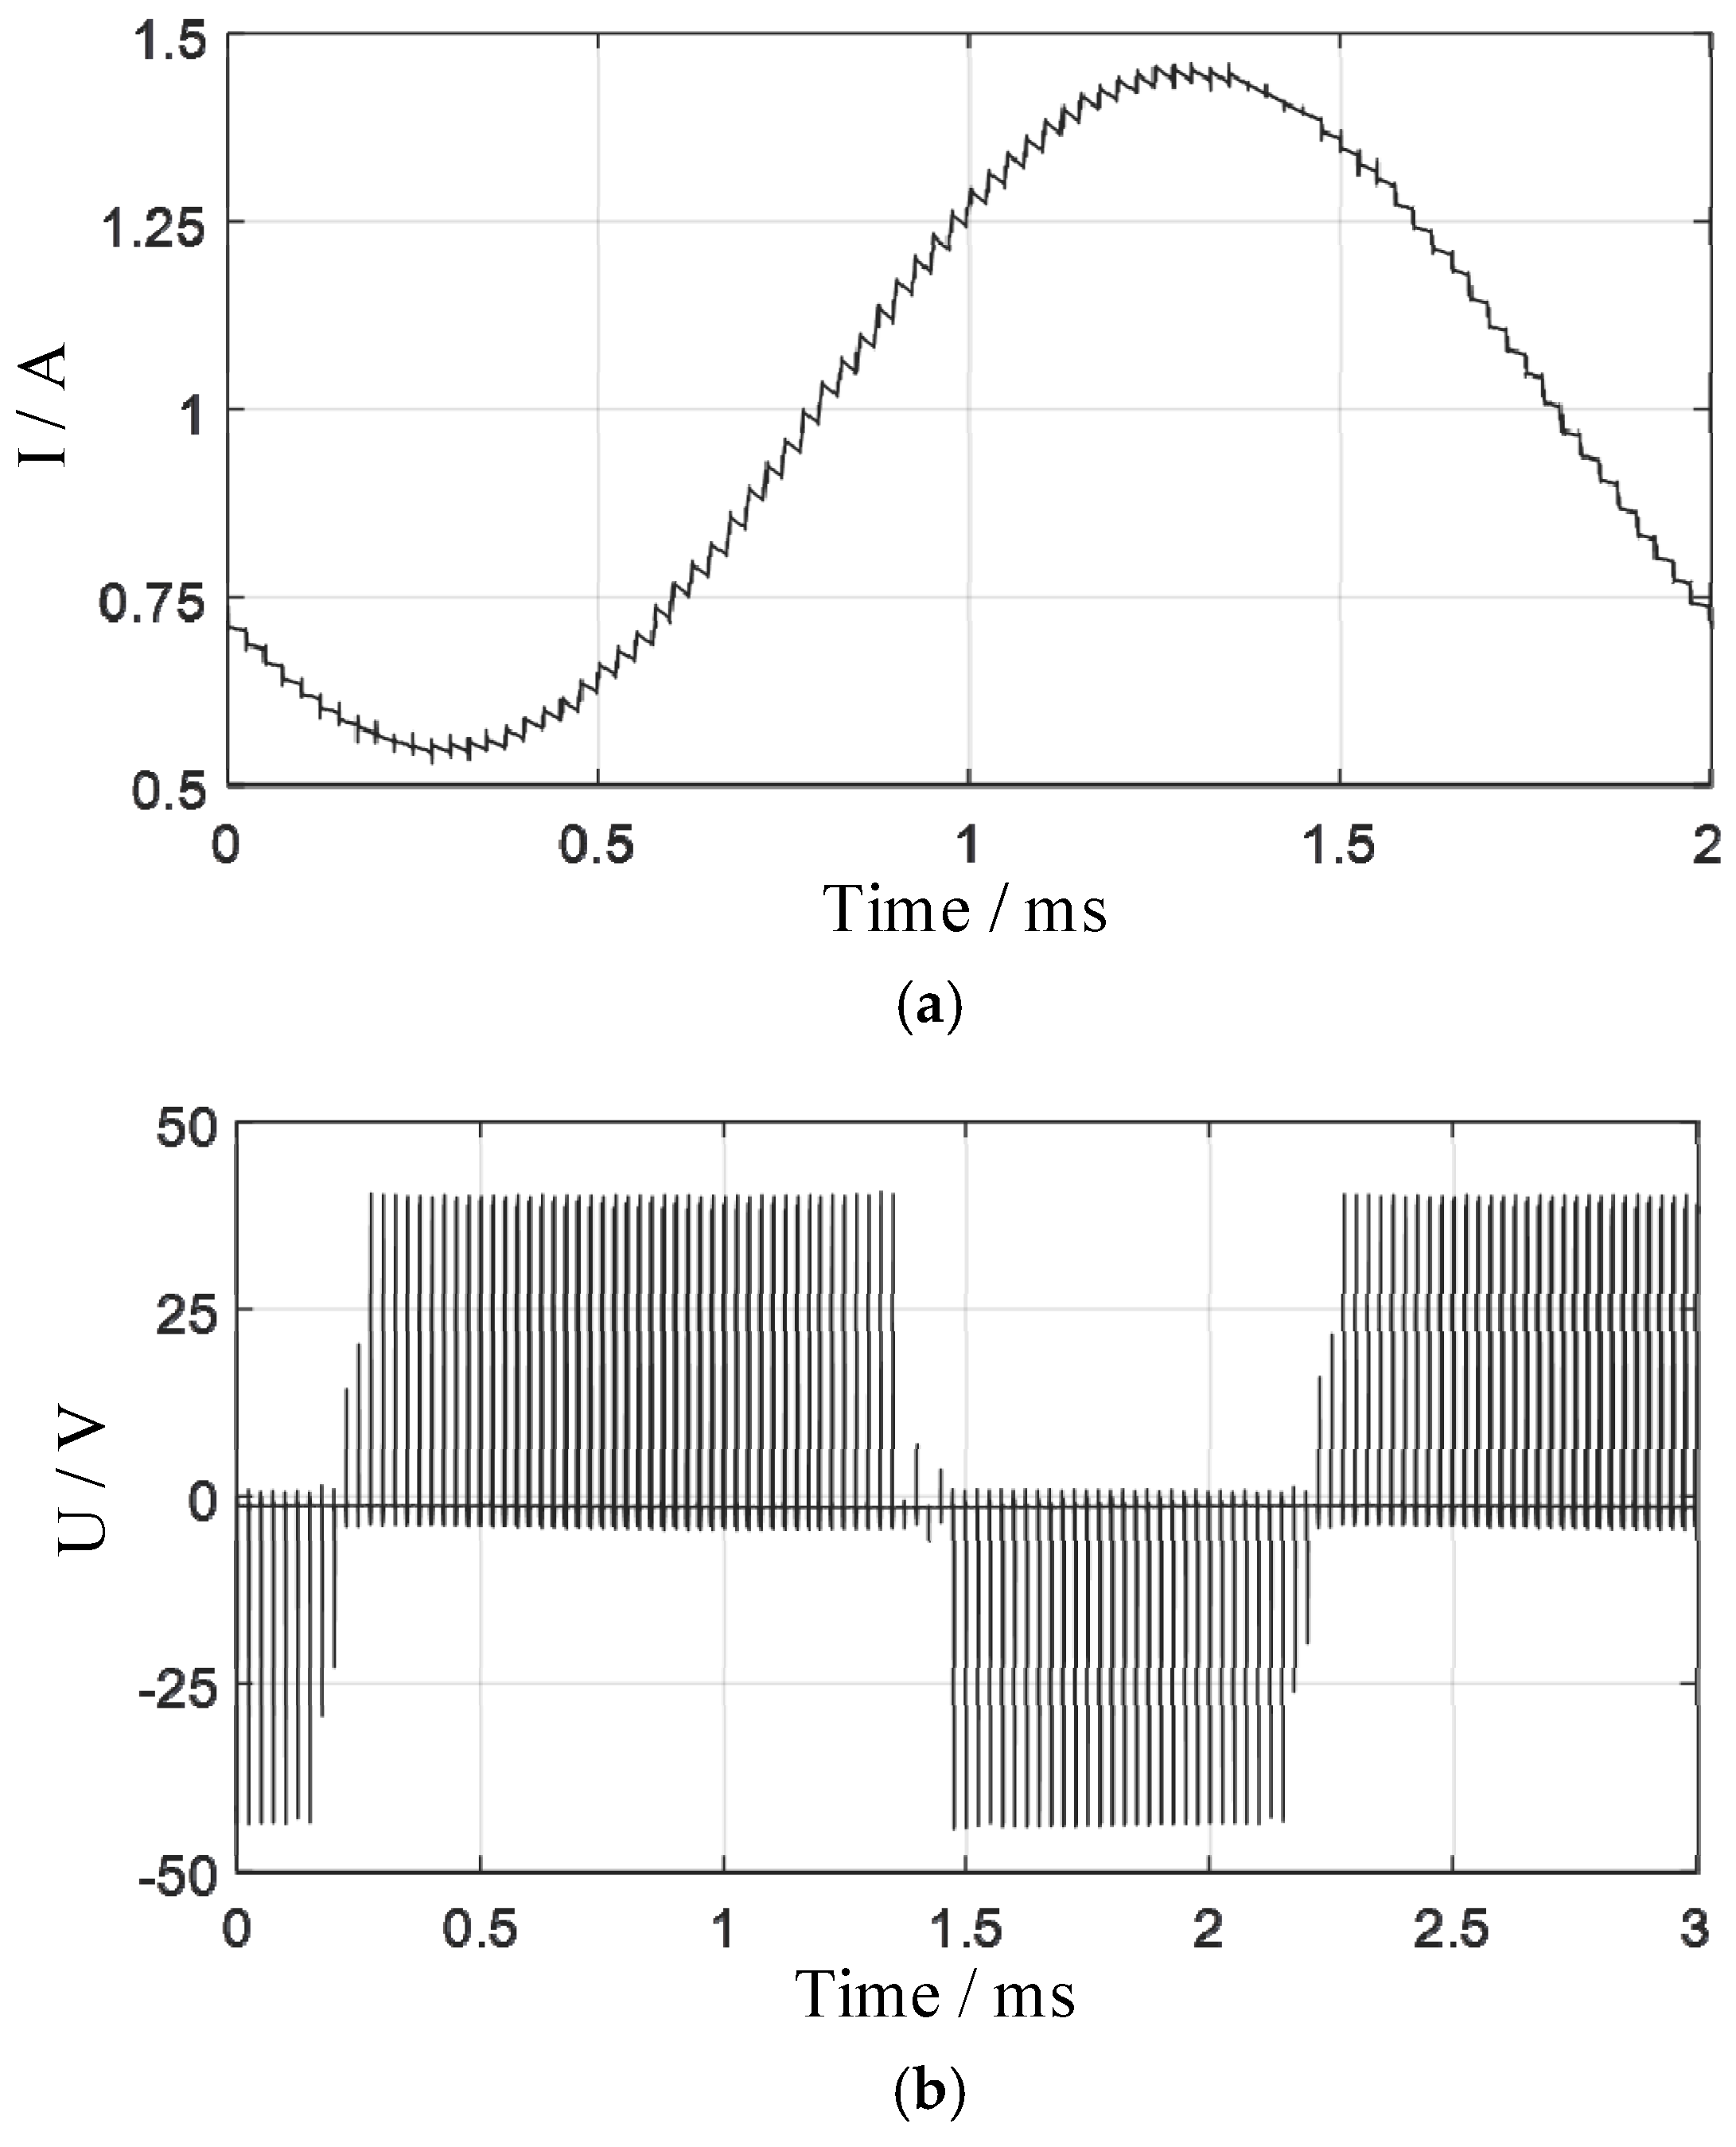
3.1. Working Principle

Building on the methodology in Section 2, the working principle of the three-level amplifier is illustrated in Figure 1. Here, T1 and T2 are switching power transistors (typically MOSFETs or IGBTs), D1–D4 are freewheeling diodes, S1 and S2 are switching signals with a 180° phase shift and a time delay of T/2; the load is resistance and inductance (RL), and the forward load current is denoted as io.
When the switching signal S = 1, the corresponding transistor T is turned on; when S = 0, the transistor is turned off. The system employs three-state level control, where the switching signals satisfy the following relationships:
S 1 = 1 0.5 + 0.5 u c u Δ 0 0.5 + 0.5 u c < u Δ
S 2 = 1 0.5 0.5 u c u Δ 0 0.5 0.5 u c > u Δ
where uc is the output signal of the current controller, and uΔ is the triangular carrier signal.
Based on Equations (1) and (2), the power amplifier operates in four distinct states:
State (1): S1 = S2 = 1. Transistors T1 and T2 are both on. The electromagnetic bearing coil forms a charging loop via the DC power supply, T1, and T2, causing the coil current to increase rapidly.
State (2): S1 = 1, S2 = 0. T1 is on, T2 is off, and freewheeling diode D3 conducts. The coil current flows through T1 and D3, forming a freewheeling path. The coil discharges through its internal resistance, resulting in a slow current decay.
State (3): S1 = 0, S2 = 1. T1 is off, T2 is on, and freewheeling diode D4 conducts. Similarly to State (2), the current flows through T2 and D4, leading to a slow current decay.
State (4): S1 = S2 = 0. Both T1 and T2 are off, while D3 and D4 conduct. The coil current flows through D3, D4, and the DC power supply, reversing the voltage polarity across the coil and causing the current to decrease rapidly.

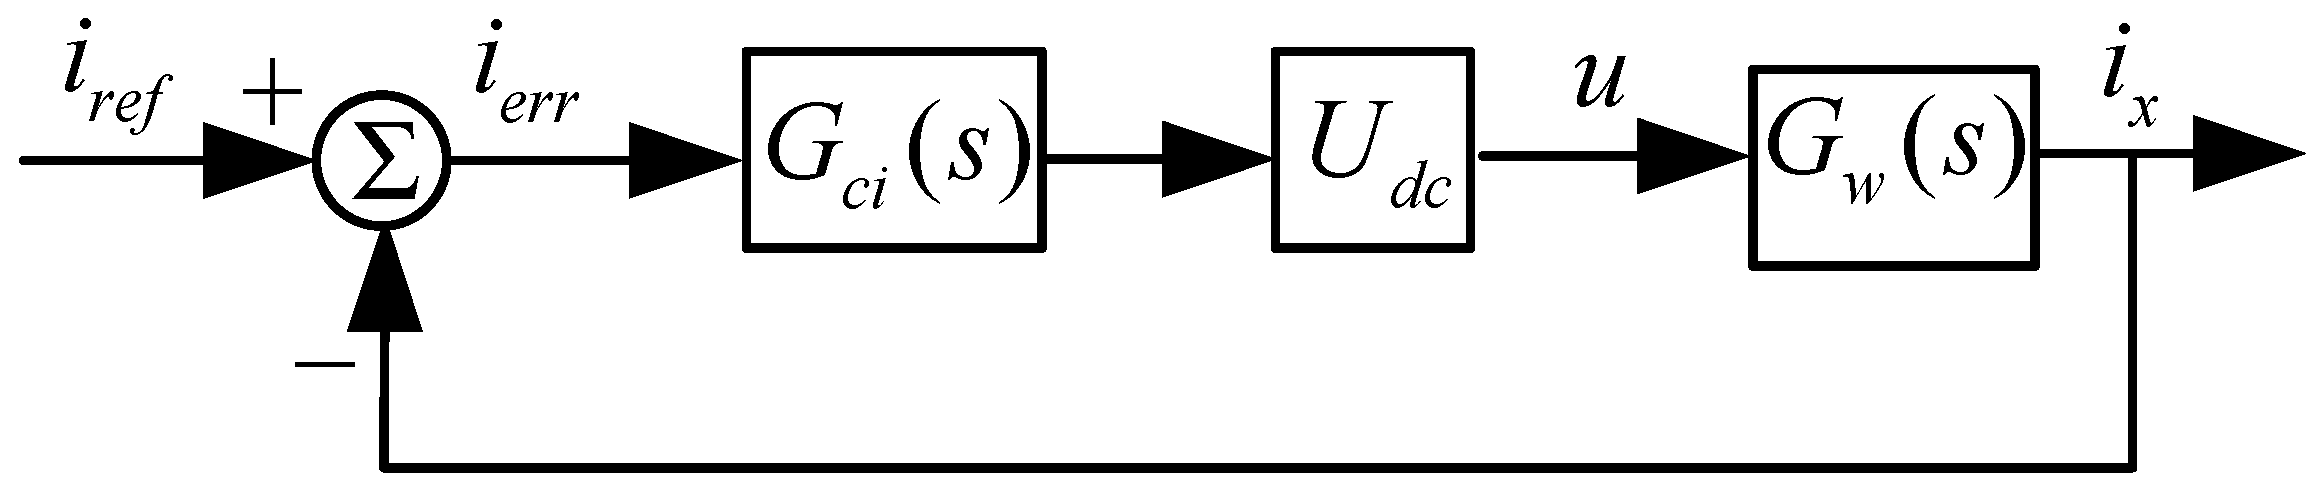
3.2. Linearized Power Amplifier Model

Based on operating principles of the magnetic bearing switching power amplifier, a linearized control model is established. Under ideal conditions, ignoring circuit dynamics and load characteristic variations, the switching circuit model is replaced by a proportional element to construct the current closed-loop control block diagram, as shown in Figure 2. Here, Gci (s) is the current controller, implemented using a discrete PI algorithm. Udc is the DC bus voltage. Gw (s) is the load transfer function.
The current controller adopts the PI control algorithm, and its transfer function expression is
G c i ( s ) = k p i + k i i s
where Kp and Ki are the proportional and integral coefficients, respectively.
From Figure 2, the closed-loop transfer function of the magnetic bearing power amplifier current loop is derived as
G i _ s ( s ) = U d c G c i G w 1 + U d c G c i G w = U d c ( k p i s + k i i ) L 0 s 2 + ( R + U d c k p i ) s + U d c k i i
For the magnetic bearing amplifier with discrete control, the z-domain representation of the load dynamics is
G w ( z ) = 1 e R L 0 t s R z 2 1 z 1 e R L 0 t s
In this equation, the time constant L/R of the exponential term is much larger than the switching period T, allowing for approximate linearization.
The digital PI controller is discretized using the backward difference method, yielding its z-domain expression, as follows:
G c i ( z ) = k p i + k i i t s 1 z 1
The discrete transfer function of the power amplifier is therefore
G i _ z ( z ) = U d c G c i ( z ) G w ( z ) 1 + U d c G c i ( z ) G w ( z )

4. Current Ripple and Dynamic Characteristic Analysis for AMB Power Amplifier

4.1. Ideal Load Current Ripple Calculation

Figure 3 illustrates the operation of the magnetic bearing winding at a steady-state current, including the switching signals and the voltage/current waveforms across the magnetic bearing.
Based on the waveforms in Figure 3: During one switching period T, the winding current reaches its minimum value imin at time t1. From t1 to t2, the power amplifier operates in State (1), and the current rises to its maximum value imax at t2. From t2 to t3, the power amplifier operates in State (2), and the current decreases back to imin at t3. Subsequent charging/discharging processes follow the same pattern.
For the switching process: If t1 is defined as the initial time (t1 = 0), t3 corresponds to half the switching period (T/2). Within one switching period T, the two charging/discharging processes exhibit identical current variations.
Assuming t1 = 0 and t3= T/2, the net current change over one steady-state switching period must be zero. This implies that the current variation during the rising phase equals that during the falling phase.
Using the linear current variation model, we derive
i T 2 = i 0 + k 1 t 2 + k 2 T 2 t 2
k 1 = U DC R i L , k 2 = U D R i L
wherein
k 1 t 2 + k 2 T 2 t 2 = 0
t2 can be calculated as
t 2 U D + I 0 R 2 ( U DC + U D ) T
where I0 is the steady-state current value, and I0i(0).
The current ripple ΔI is then expressed as
Δ I = k 1 t 2 ( U D + I 0 R ) ( U DC I 0 R ) T 2 L ( U DC + U D )
When I0R << UDC and UD << UDC, Equation (12) can be approximated as
Δ I ( U VD + I 0 R ) T 2 L
From Equation (13), it is evident that when the DC bus voltage UDC is sufficiently large, the current ripple becomes independent of UD.

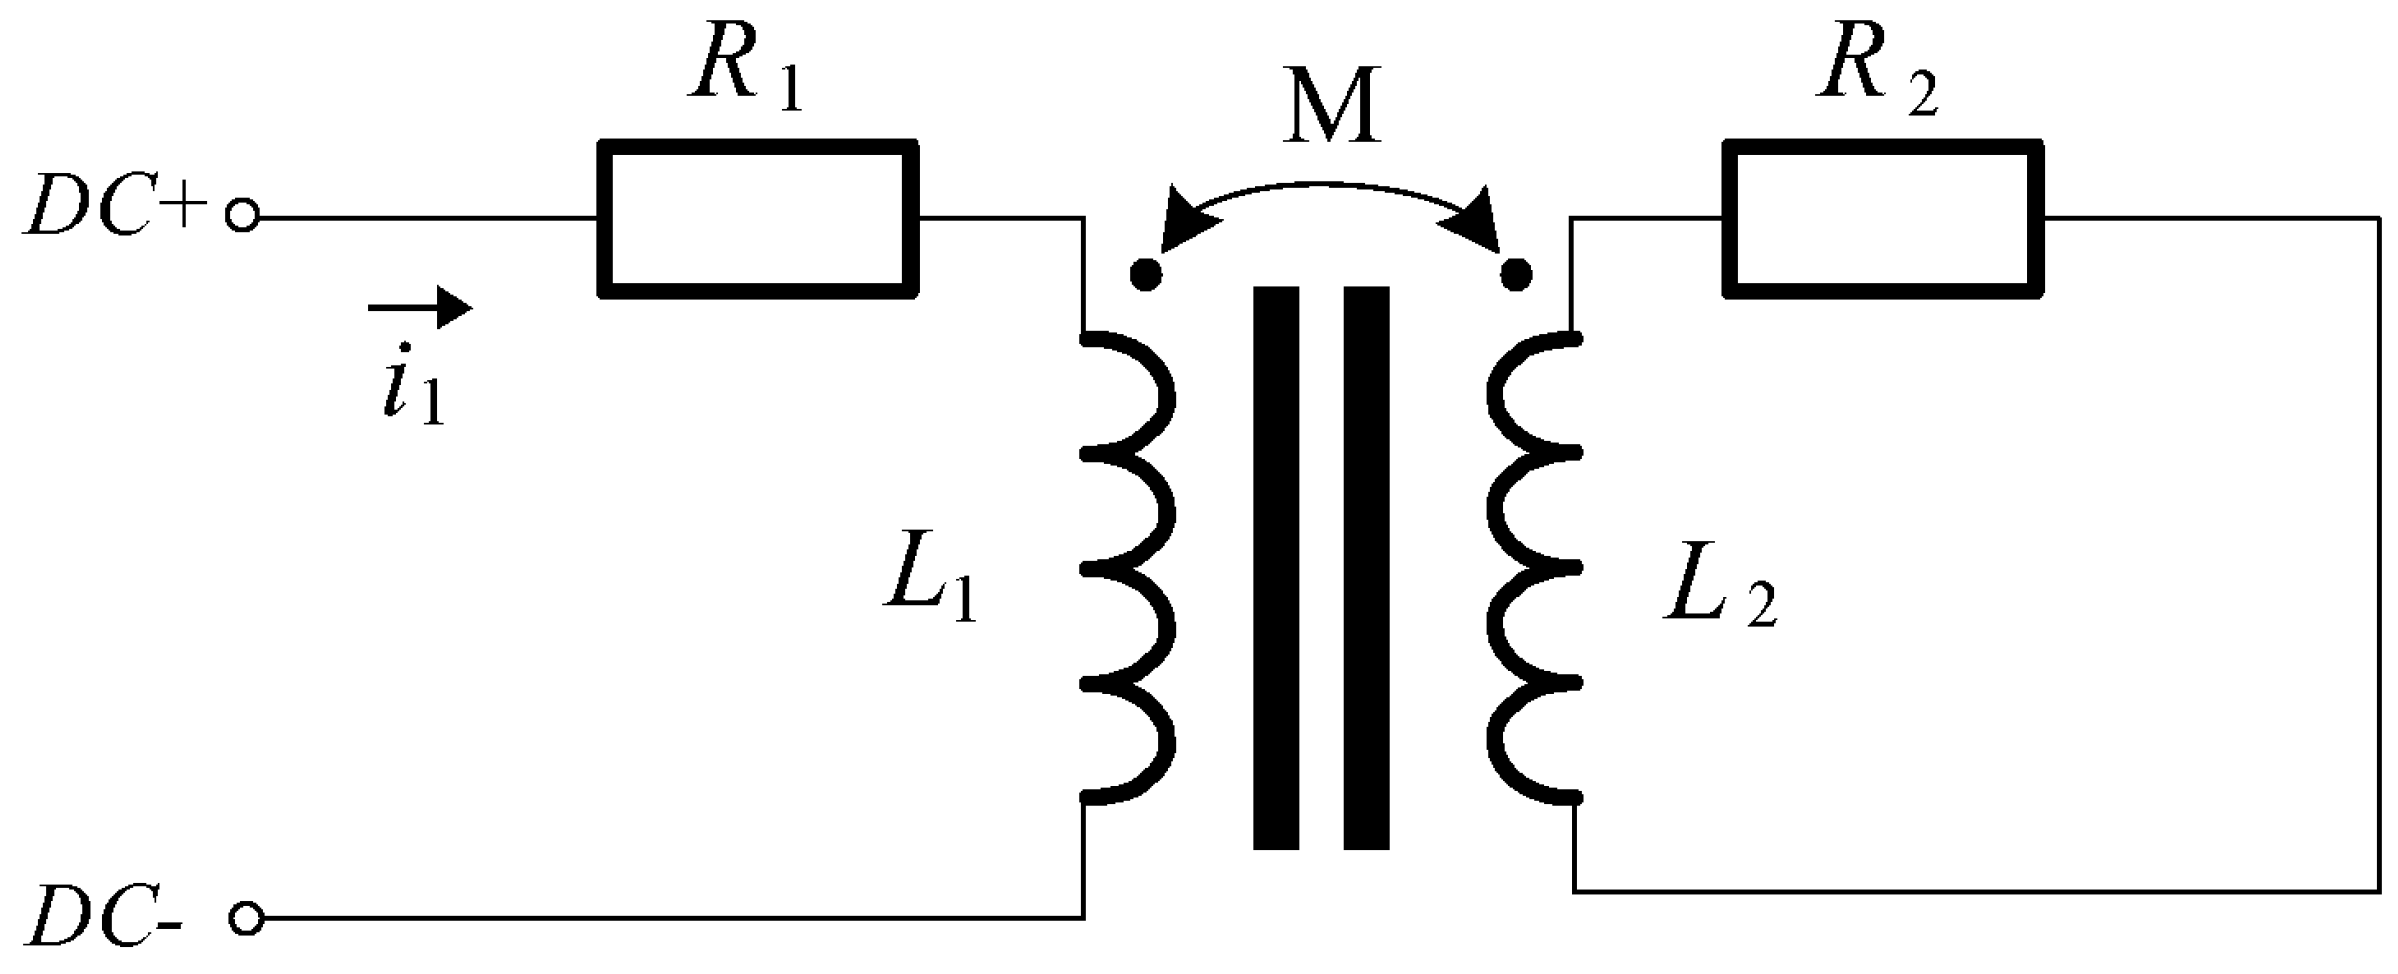
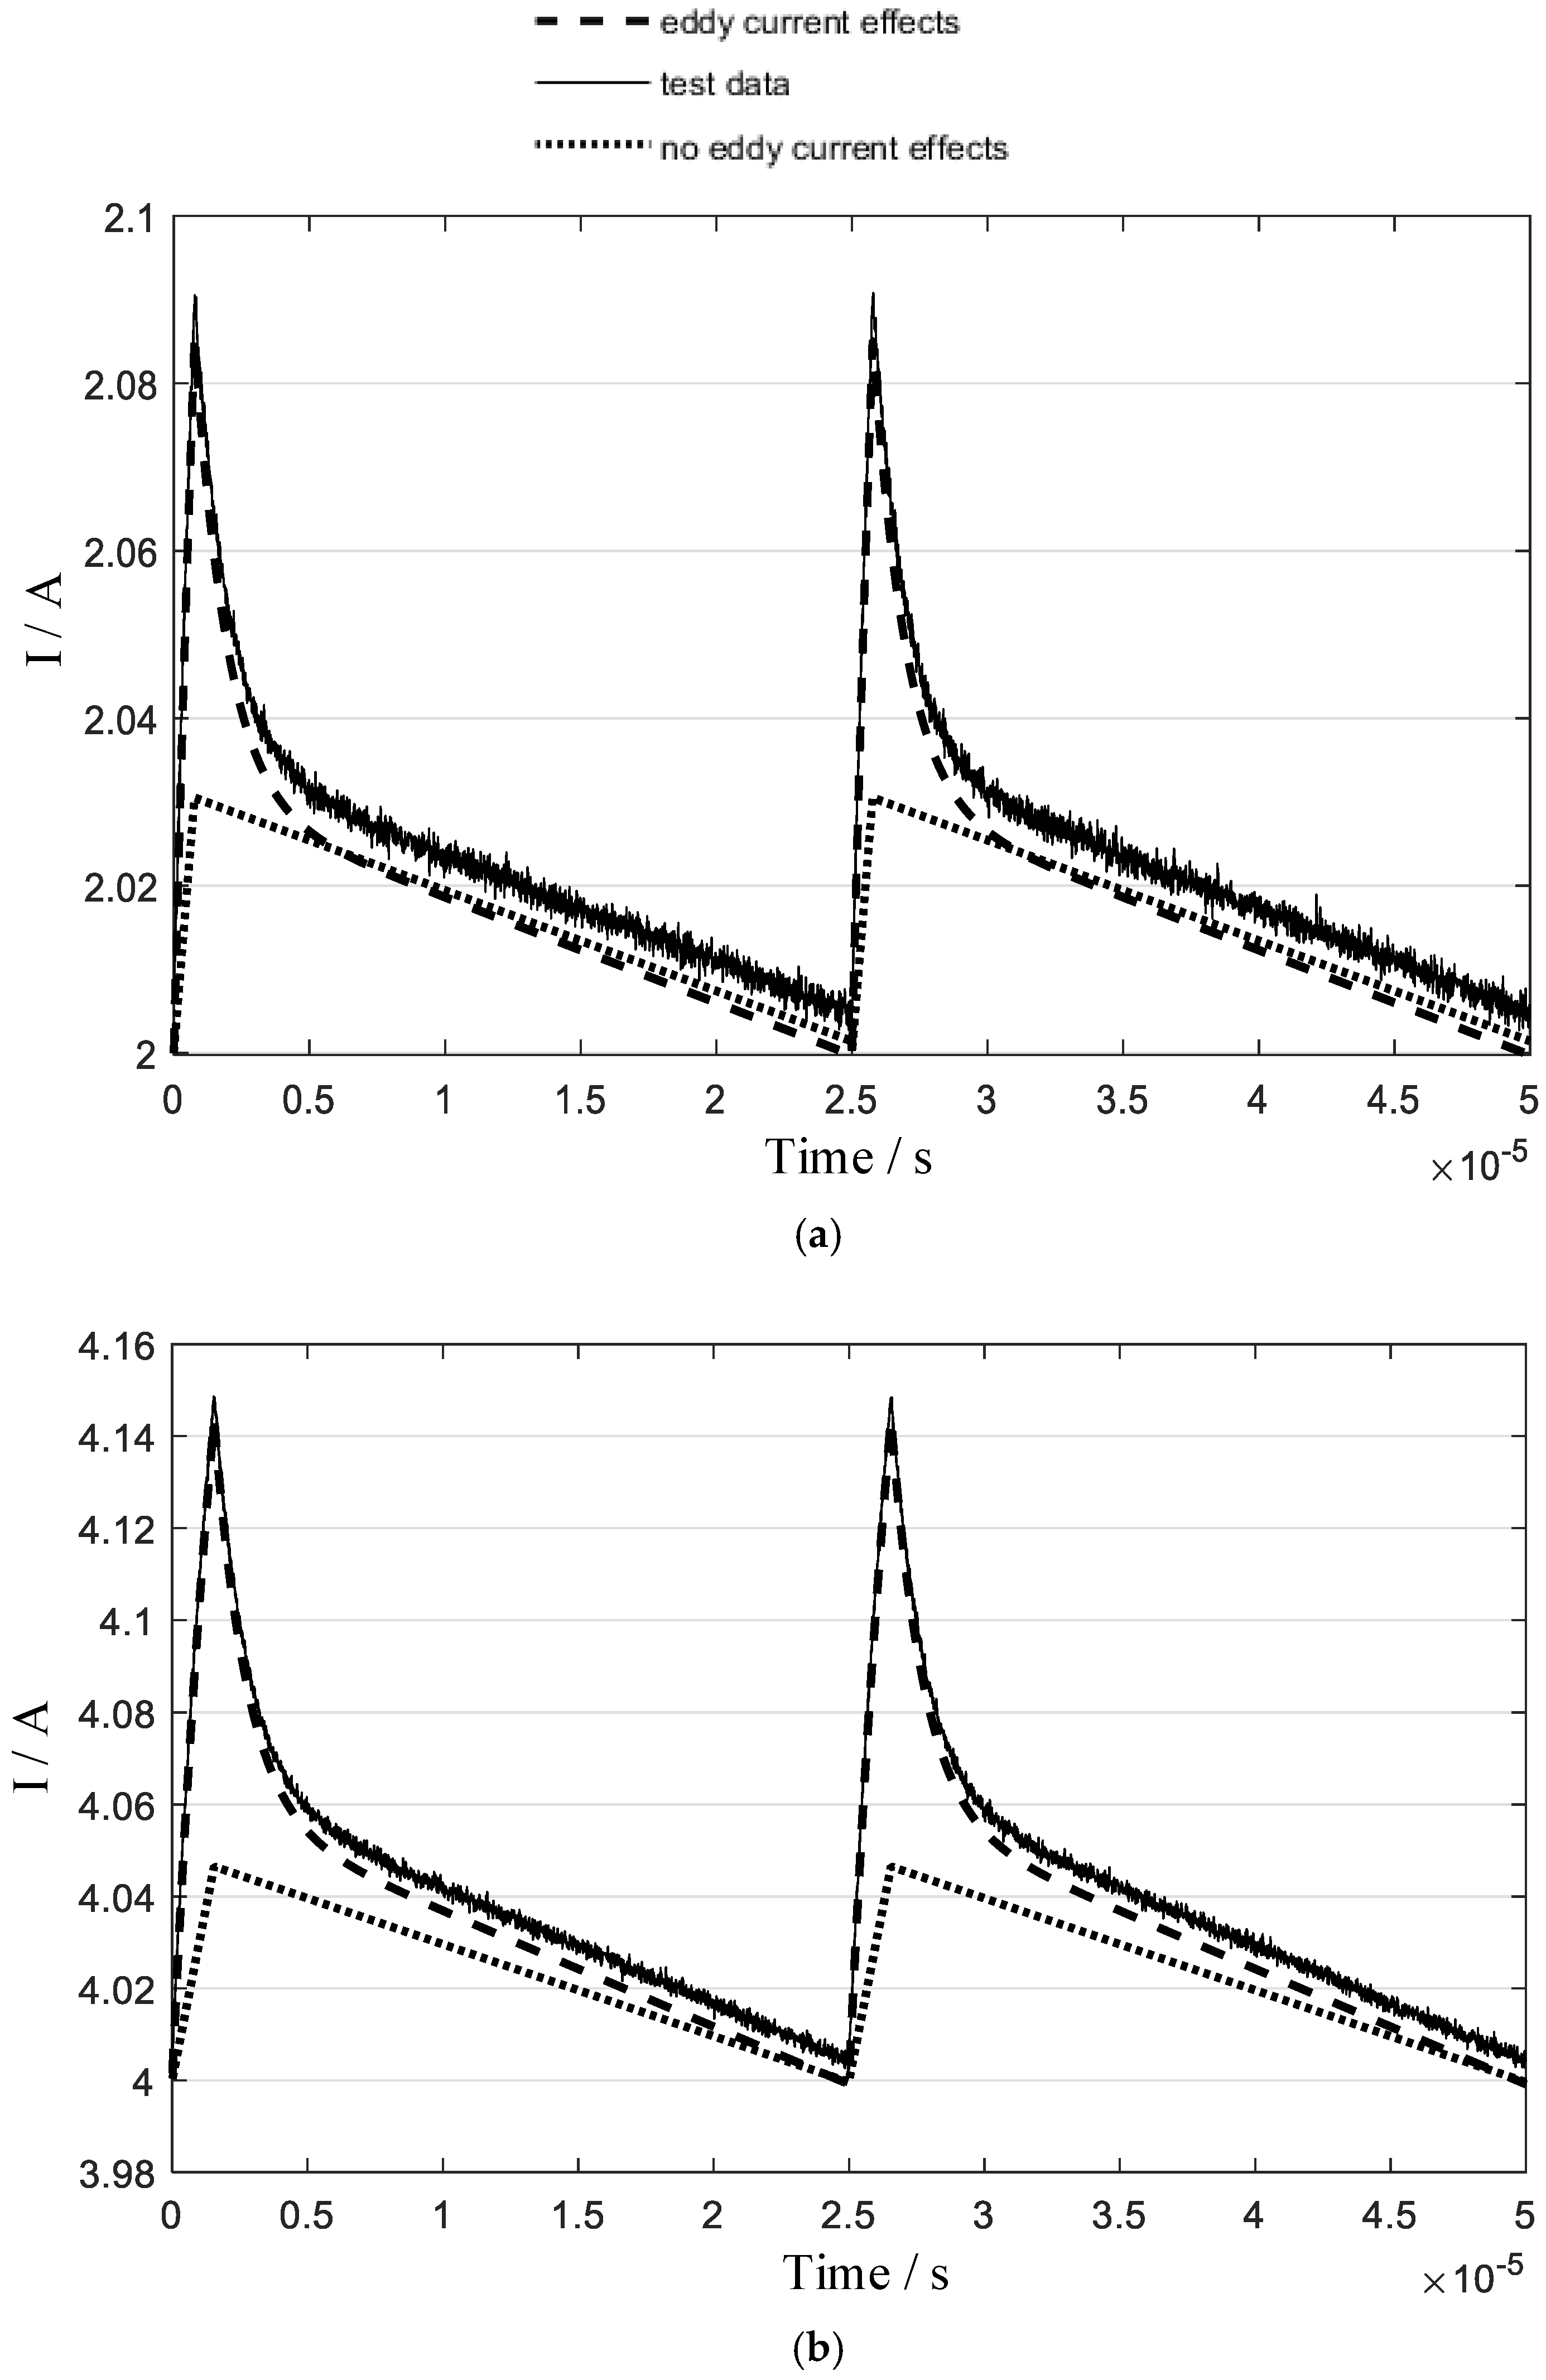
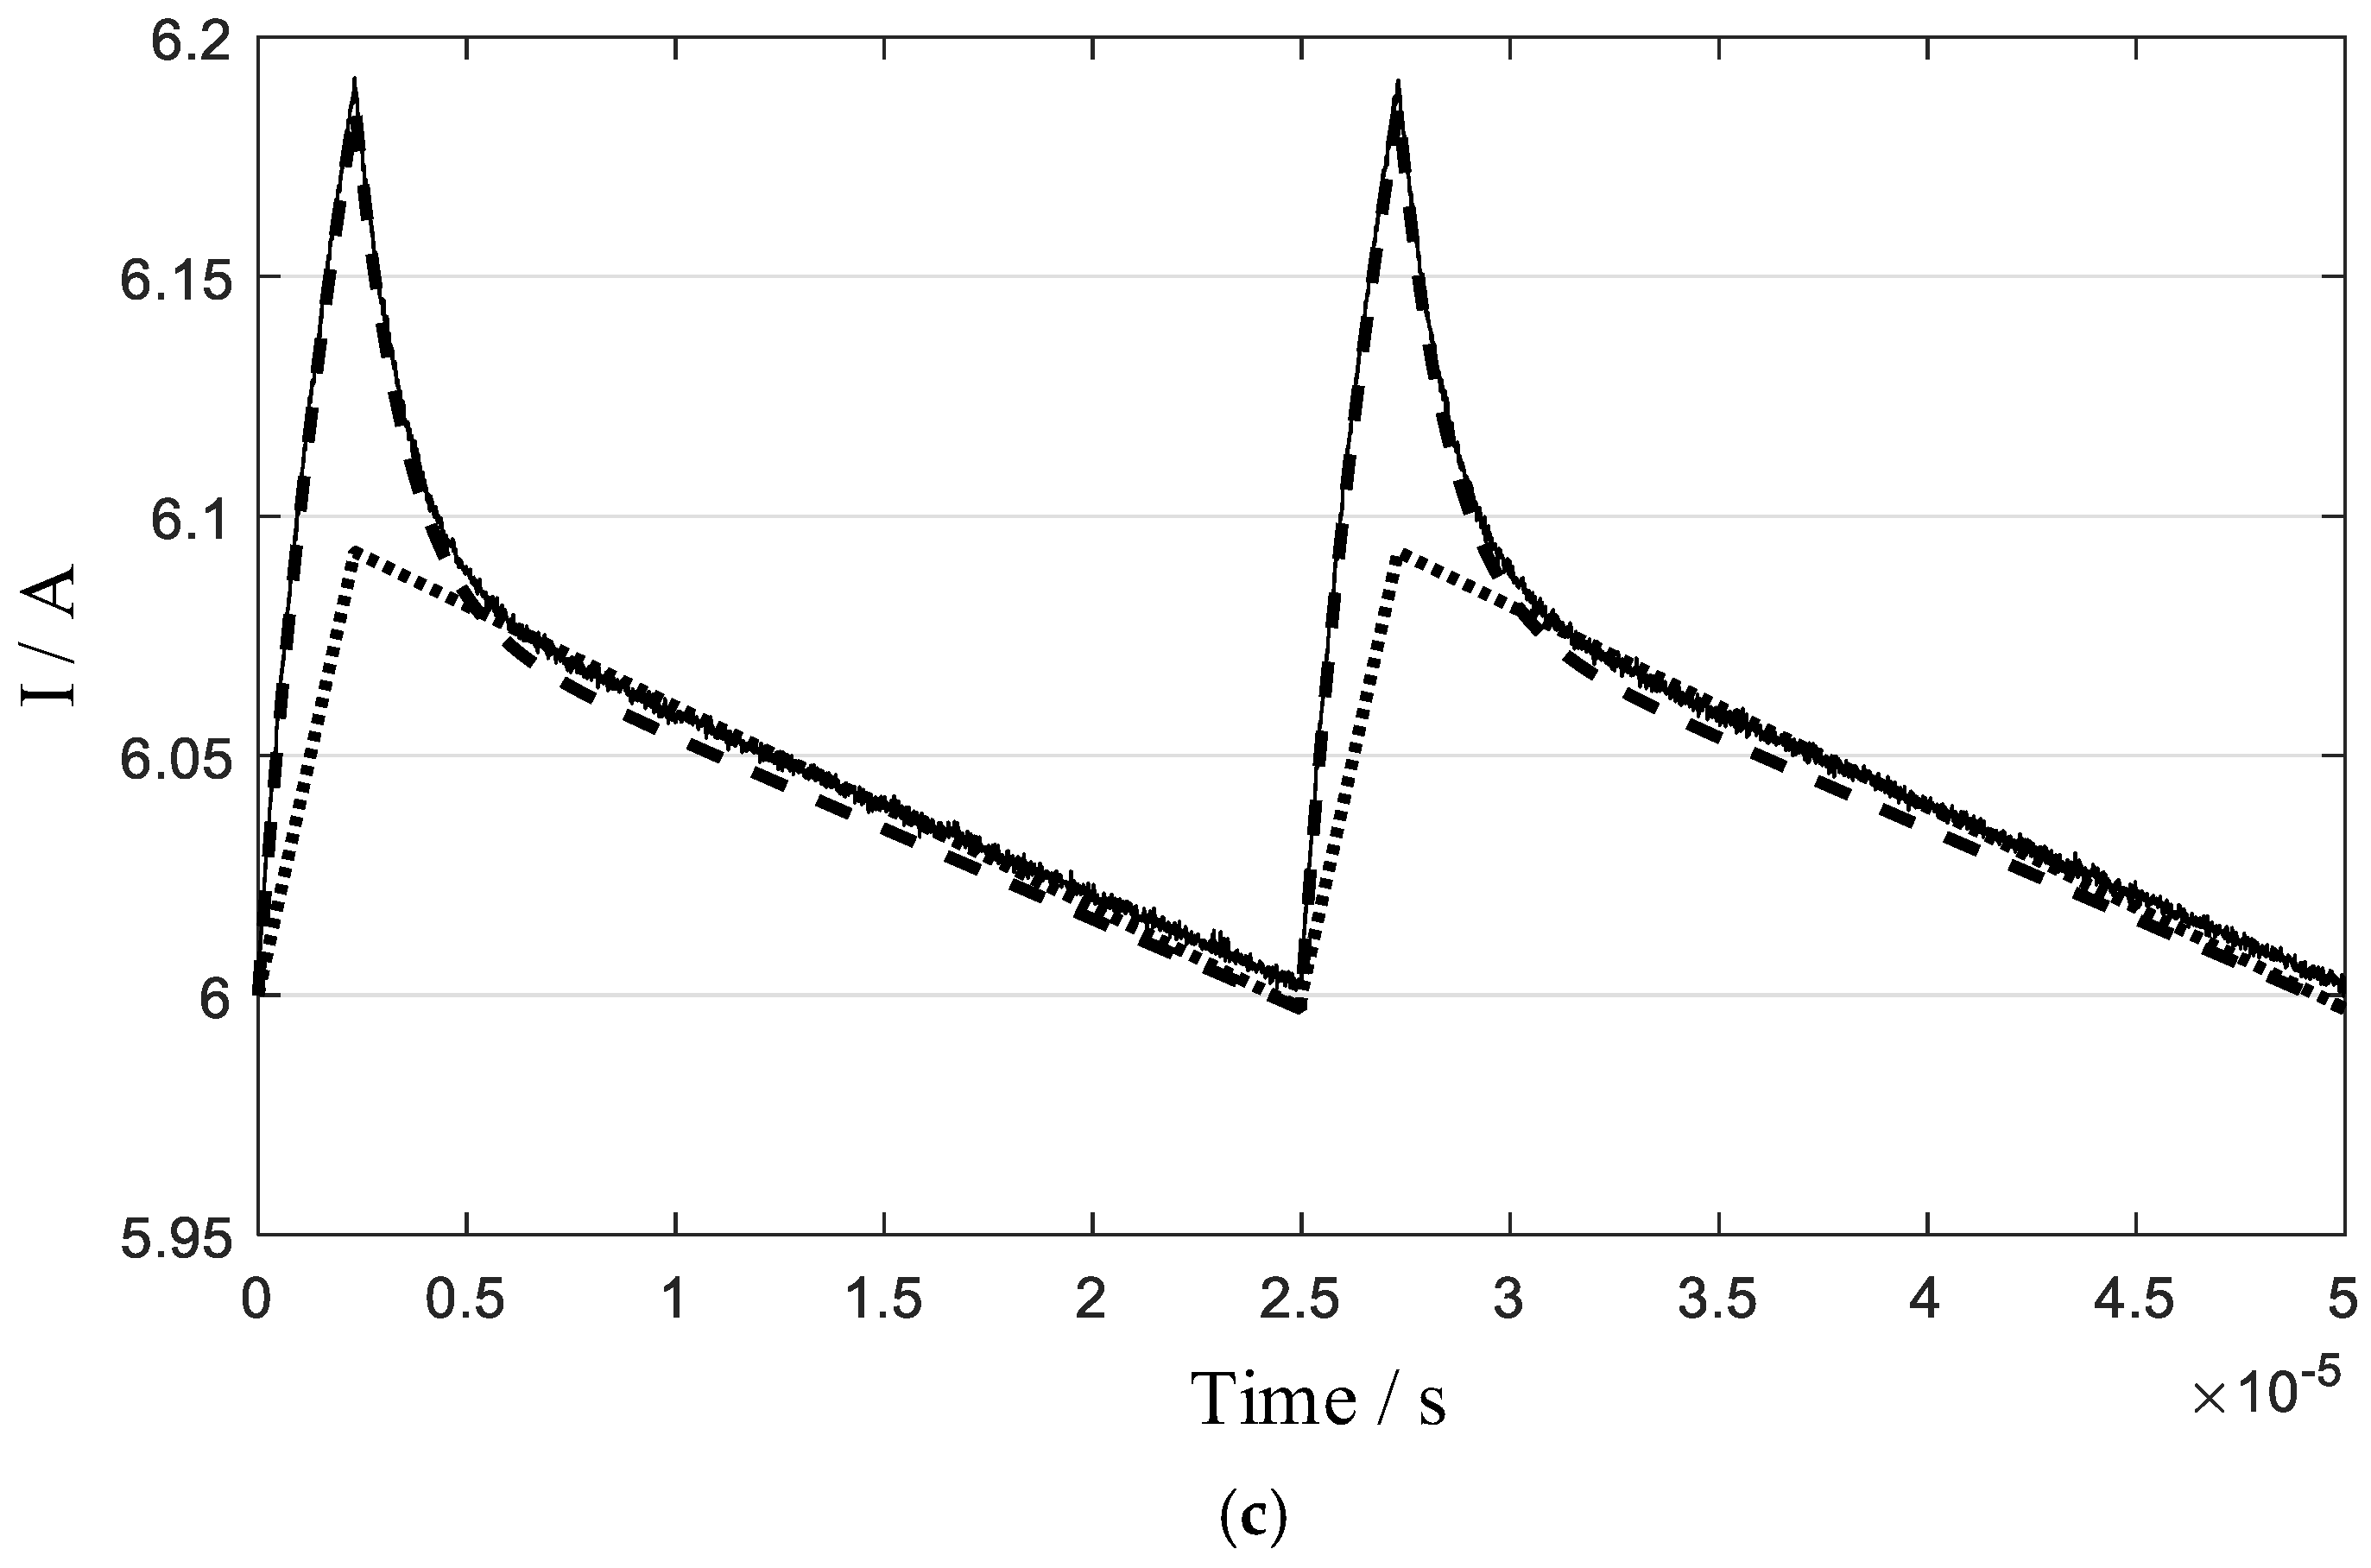
4.2. Ripple Calculation Considering Eddy Current Effects

For practical magnetic bearing loads, although laminated cores are used in both the stator and rotor to mitigate eddy current effects, the high-frequency current ripple generated by the power amplifier’s switching inevitably induces high-frequency eddy currents in the magnetic bearing windings. These eddy currents form closed loops and generate magnetic fields opposing the winding current, thereby altering the current ripple magnitude.
To analyze eddy current effects, the eddy current path is modeled as an RL circuit, where the eddy current inductance L2 and the winding self-inductance L1 share mutual inductance M. The equivalent circuit is shown in Figure 4.
In the model, L1 and R1 represent the winding self-inductance and internal resistance. L2 and R2 represent the equivalent inductance and resistance of the eddy current path. M is the mutual inductance between L1 and L2.
According to electromagnetic theory, the eddy current self-inductance L2 and mutual inductance M depend on current frequency, core permeability, core conductivity, and airgap reluctance. For fixed parameters, the eddy current influence remains constant.
For the circuit in Figure 4, with an input voltage U across the load, the governing equations are
L 1 d i 1 d t + M d i 2 d t + R 1 i 1 = U L 2 d i 2 d t + M d i 1 d t + R 2 i 2 = 0 0 < t r T
where i1 is the winding current, i2 is the eddy current, r is the duty ratio, and T is the switching period.
Assuming initial currents i1(0) = Im and i2(0) = In, the total current response is
L 1 s I 1 I m + M s I 2 I n + R 1 I 1 = U s L 2 s I 2 I n + M s I 1 I m + R 2 I 2 = 0
The s-domain response of the output current I1 is
I 1 s = U ( s L 2 + R 2 ) s s L 1 + R 1 ( s L 2 + R 2 ) s 2 M 2 1 + s L 1 L 2 M 2 + R 2 L 1 I m + R 2 M I n s L 1 + R 1 ( s L 2 + R 2 ) s 2 M 2 2
where part 1 is the Zero-state response, and part 2 is the Zero-input response.
Applying inverse Laplace transform, the time-domain zero-state response is
I 1 t = U R 1 1 exp ( R 1 L 1 t ) + M L 1 L 2 M 2 0 t exp R 2 L 2 t τ i 2 τ d τ
and then
I 1 t = U R 1 1 exp σ 3 σ 1 t cosh σ 2 σ 1 t + sinh σ 2 σ 1 t L 1 R 2 + L 2 R 1 2 σ 2 U R 1 1 1 M 2 R 1 R 2 4 σ 2 2 exp σ 3 σ 2 σ 1 t M 2 R 1 R 2 4 σ 2 2 exp σ 3 + σ 2 σ 1 t
where
σ 1 = L 1 L 2 M 2 , σ 2 = L 1 R 2 L 2 R 1 2 2 + M 2 R 1 R 2 , σ 3 = L 1 R 2 + L 2 R 1 2
For laminated-core magnetic bearings, R2 >> R1 and M~L1. Simplifying σ2 and the exponential terms leads to the following:
σ 2 L 1 R 2 L 2 R 1 2 , σ 3 σ 2 σ 1 1 τ 1 , σ 3 + σ 2 σ 1 1 τ 2
Let
exp R 1 L 1 t = e 1 t , exp L 1 R 2 L 1 L 2 M 2 t = e 2 t
The zero-state response becomes
I 1 t U R 1 1 1 M 2 R 1 L 1 2 R 2 e 1 t M 2 R 1 L 1 2 R 2 e 2 t
The zero-input response in the time domain is
I 1 t = I m exp σ 3 σ 1 t cosh σ 2 σ 1 t + sinh σ 2 σ 1 t L 1 R 2 + L 2 R 1 M R 2 I n / I m 2 σ 2
simplified to
I 1 t I m 1 M 2 R 1 L 1 2 R 2 + M I n L 1 I m e 1 t + M L 1 M R 1 I m L 1 R 2 I n e 2 t
Let
k 1 = U R 1 I m , k 2 = M 2 R 1 L 1 2 R 2
combining zero-state and zero-input responses, approximating
I 1 t U R 1 k 1 e 1 t + k 1 k 2 e 1 t e 2 t
The current variation during turn-on is
Δ I o p e n = I 1 r T I m
During turn-off, only the zero-input response exists. Neglecting resistive voltage drops, Im remains approximately constant, and In is
I n = I 2 r T = M U L 1 R 2 e 1 r T e 2 r T
Current variation during turn-off is
Δ I c l o s e = I 1 1 r T I m
Combining turn-on and turn-off phases leads to the following:
I 1 t = U R 1 U R 1 I m e 1 t + M 2 R 1 L 1 2 R 2 U R 1 I m e 1 t e 2 t 0 , r T I m e 1 t k 2 e 1 t e 2 t + M I n L 1 I m e 1 t e 2 t r T , T
The current ripple expression is
Δ I U r T R 1 I m T L 1 2 M 2 R 1 L 1 2 R 2 I m U M 2 L 1 2 R 2 e r T τ 2
PWM-based switching amplifiers rely on the volt-second balance principle, equating voltage variations to duty ratio changes. However, due to the nonlinear term τ2 (related to eddy current parameters), the control model cannot be simplified to the structure in Figure 2. For different magnetic bearing systems, the current variation can be generalized as follows:
Δ I U r T R 1 I m T L 1 2 M 2 R 1 L 1 2 R 2 I m U M 2 L 1 2 R 2 τ 2 > > r T U r T R 1 I m T L 1 2 M 2 R 1 L 1 2 R 2 I m τ 2 < < r T

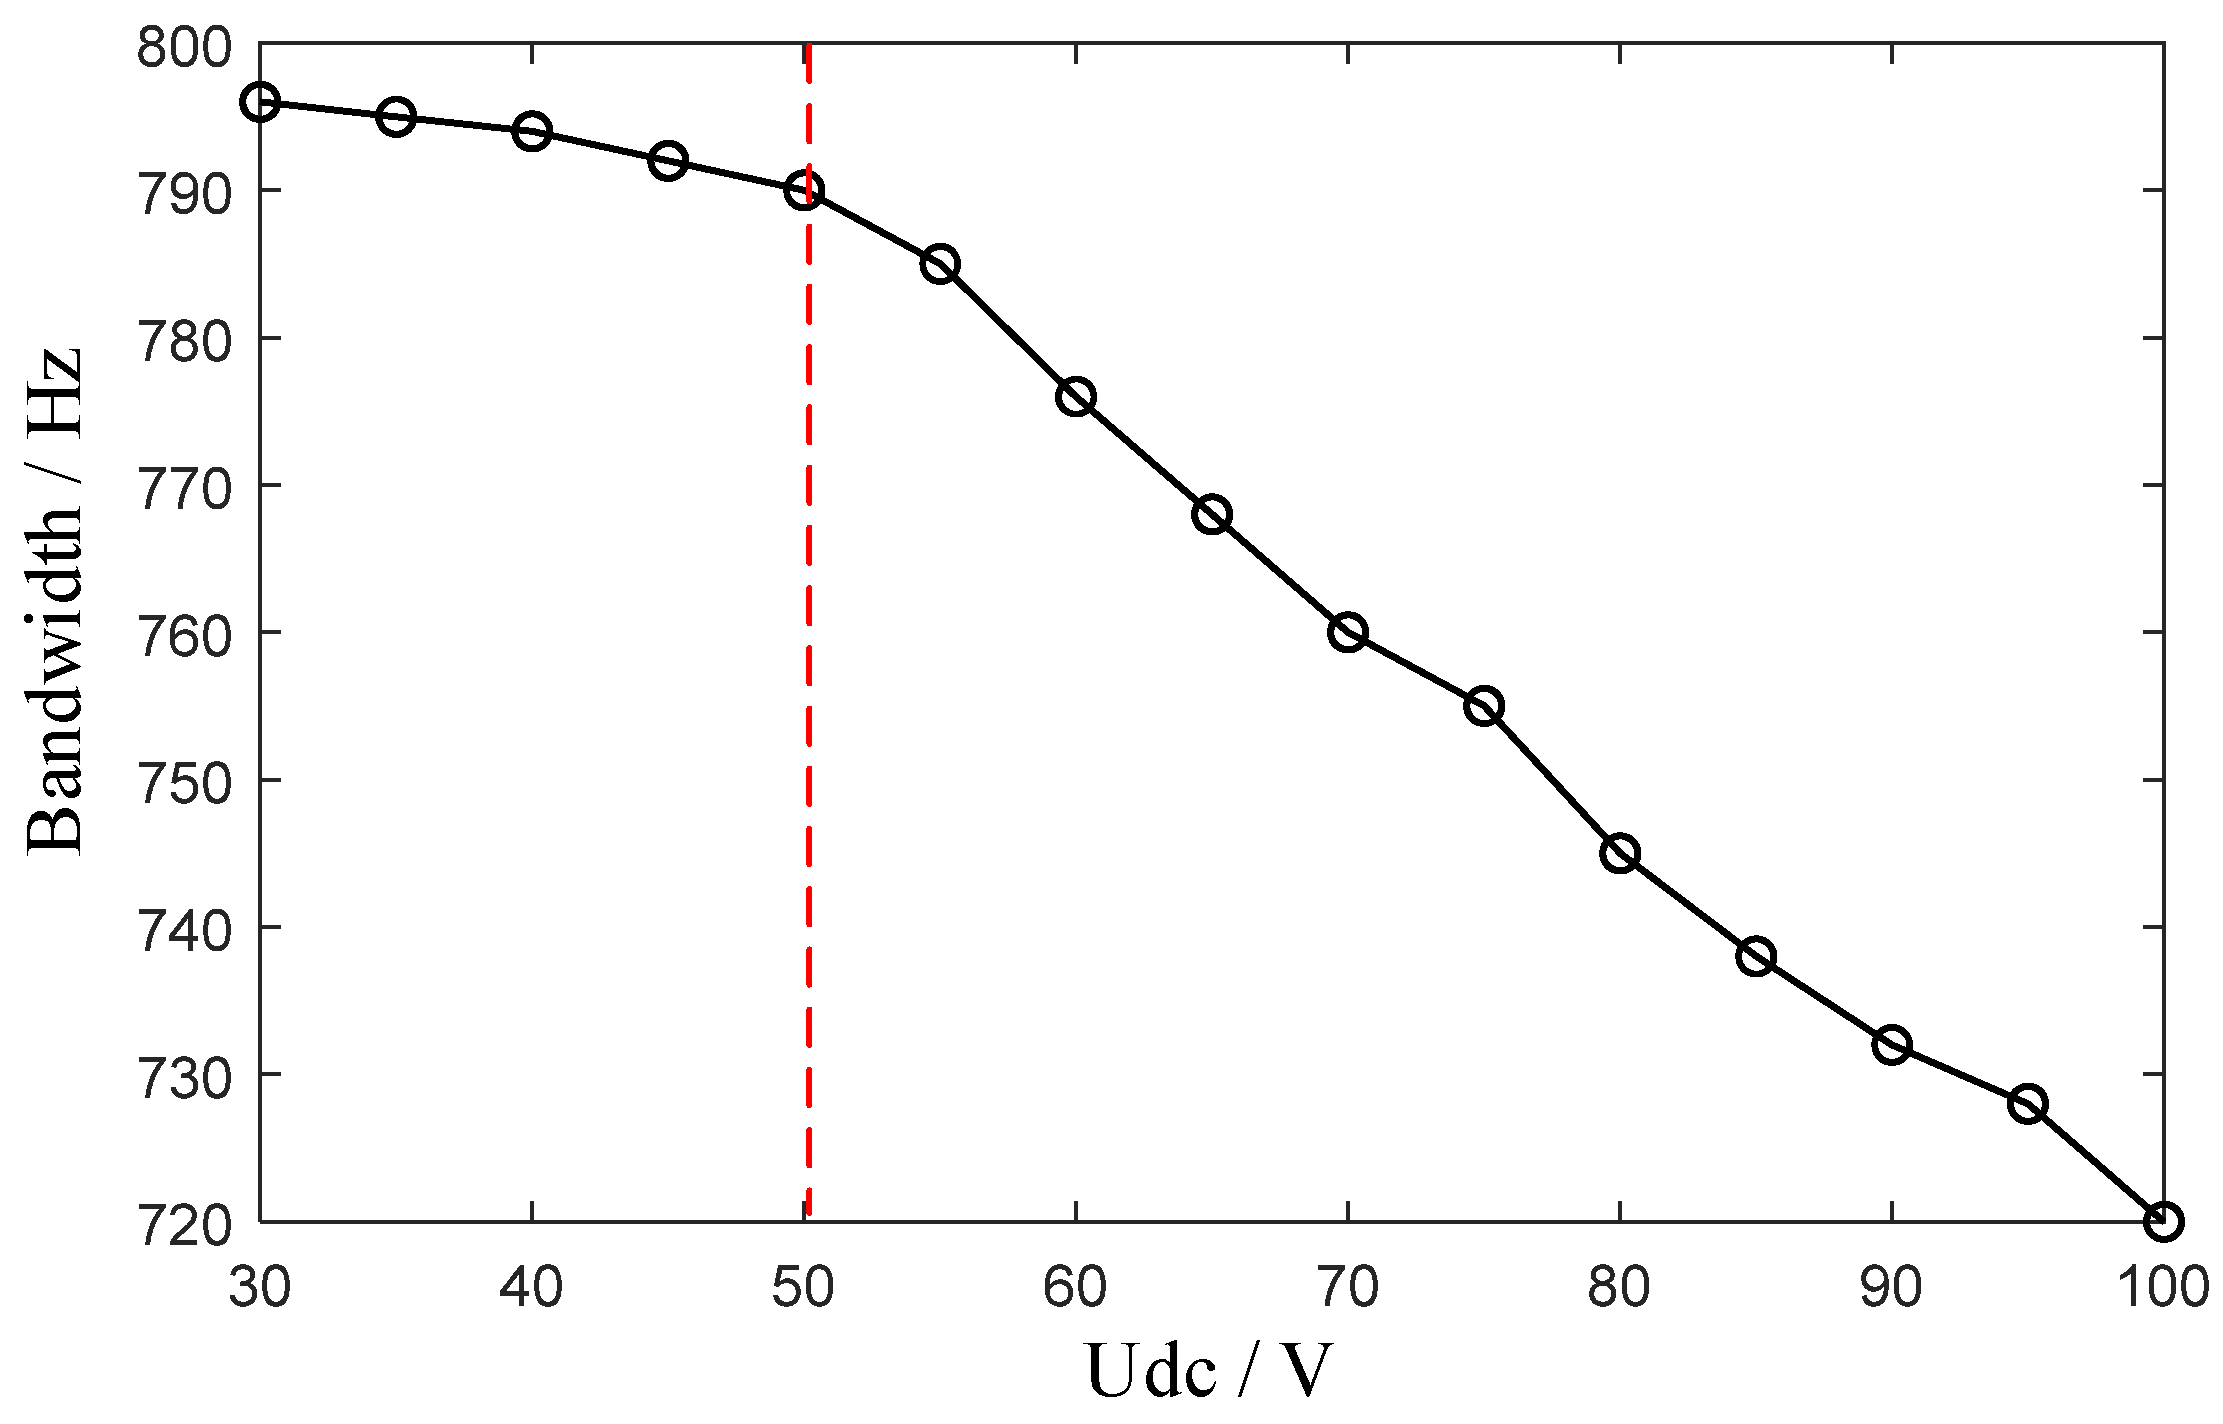
4.3. Impact of Eddy Current Effects on Power Amplifier Bandwidth

For an ideal magnetic bearing RL load, we have
L d i d t + R i = U
Due to the output saturation limits of the power amplifier, it typically operates within a linear output range, satisfying the following:
ω 2 L 2 + R i m a g U D C
where ω is the operating current frequency, and Imag is the current amplitude.
Ignoring the effects of current inner-loop control parameters, the amplifier bandwidth is defined as the corner frequency under fixed output current conditions.
ω s a t = U D C i m a g 2 R 2 L 2
For an ideal load (ImagR << UDC), the bandwidth simplifies to
ω s a t = k 1 i m a g U D C L i m a g
Here, k1 represents the maximum current slew rate, given by
k 1 = d I m a g d t max U D C L
With constant L, k1 depends solely on the DC bus voltage UDC. For fixed load parameters, bandwidth is approximately proportional to UDC; a higher DC bus voltage increases bandwidth. Bandwidth is inversely proportional to Imag; a larger current amplitude reduces bandwidth.
Considering eddy current effects, combining Equation (29), the effective current slew rate k2 becomes the following:
k 2 = Δ I T U D C r R 1 I m L 1 2 M 2 R 1 L 1 2 R 2 I m T U D C M 2 L 1 2 R 2 e r T τ 2 T
where r is the duty ratio calculated by the PI controller.
This indicates a nonlinear relationship between k2, UDC, Imag, and r. When the magnetic bearing amplifier operates in the unsaturated region, r approximates
r R 1 I m a g 2 U D C
Key observations:
Higher UDC and lower Imag lead to a smaller r. From Equation (36), smaller r reduces k2, causing reduced current response amplitude, phase lag, and lower inner-loop control bandwidth.
When the system’s equivalent bandwidth is maximized, the single-period current variation reaches its maximum, and the nonlinear components are approximately zero. Using the condition exp(−5) ≈ 0.006, the requirements for selecting the DC bus voltage UDC at a working current I1 are derived as follows:
U D C < L 1 R 2 I 1 R 1 10 L 1 L 2 M 2 T

5. Simulation and Experimental Verification

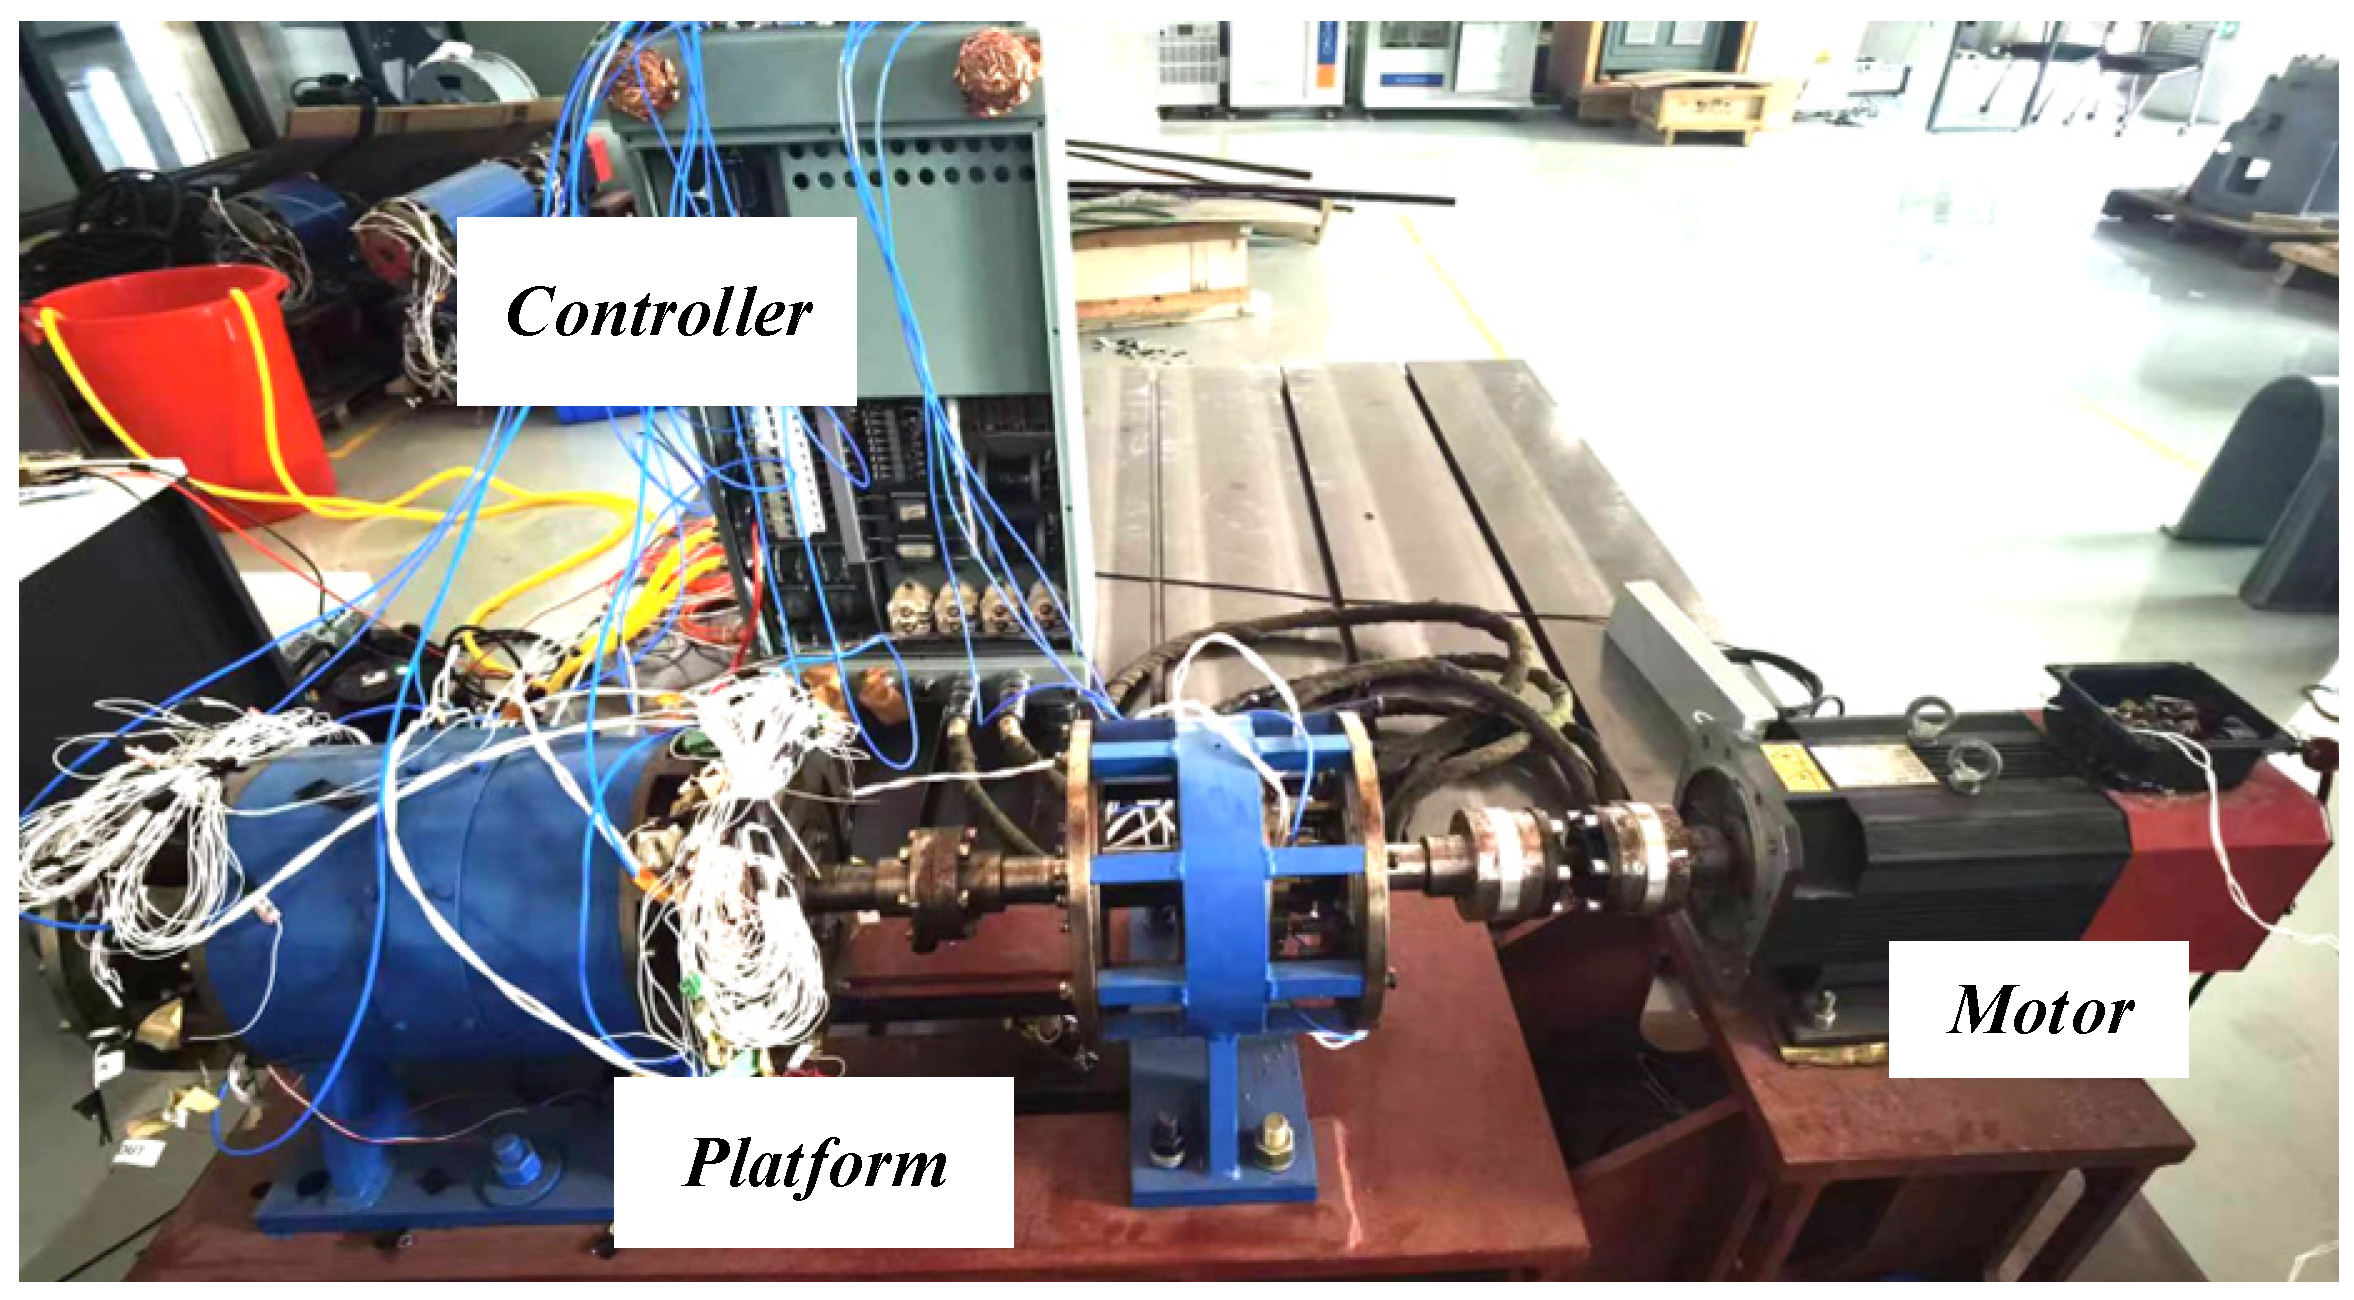
5.1. Test Platform and Parameters

To validate the accuracy of the theoretical analysis, experimental verification was conducted on a practical magnetic bearing system. Figure 5 shows the prototype test platform.
Key parameters of the power amplifier are listed in Table 1. The load parameters were measured using an LCR impedance analyzer (measurement frequency: 10 Hz).
Due to the difficulty in directly measuring eddy current-related parameters, system identification was performed experimentally. A sinusoidal current was generated in the magnetic bearing winding by the power amplifier, while the voltage across the load and the current through it were simultaneously measured. The test conditions included a DC bias i0 = 1 A, AC amplitude I0 = 0.5 A, and frequency f = 500 Hz. The measured output waveforms are shown in Figure 6.
Using the Adaptive Gauss–Newton (GNA) method, the system transfer function was fitted by treating the load voltage as the input and the load current as the output. The second-order transfer function of the load was derived as
G w ( s ) = 242.5 s + 9.719 e 4 s 2 + 474.95 s + 3.747 e 4
The identified load parameters under eddy current effects are listed in Table 2.

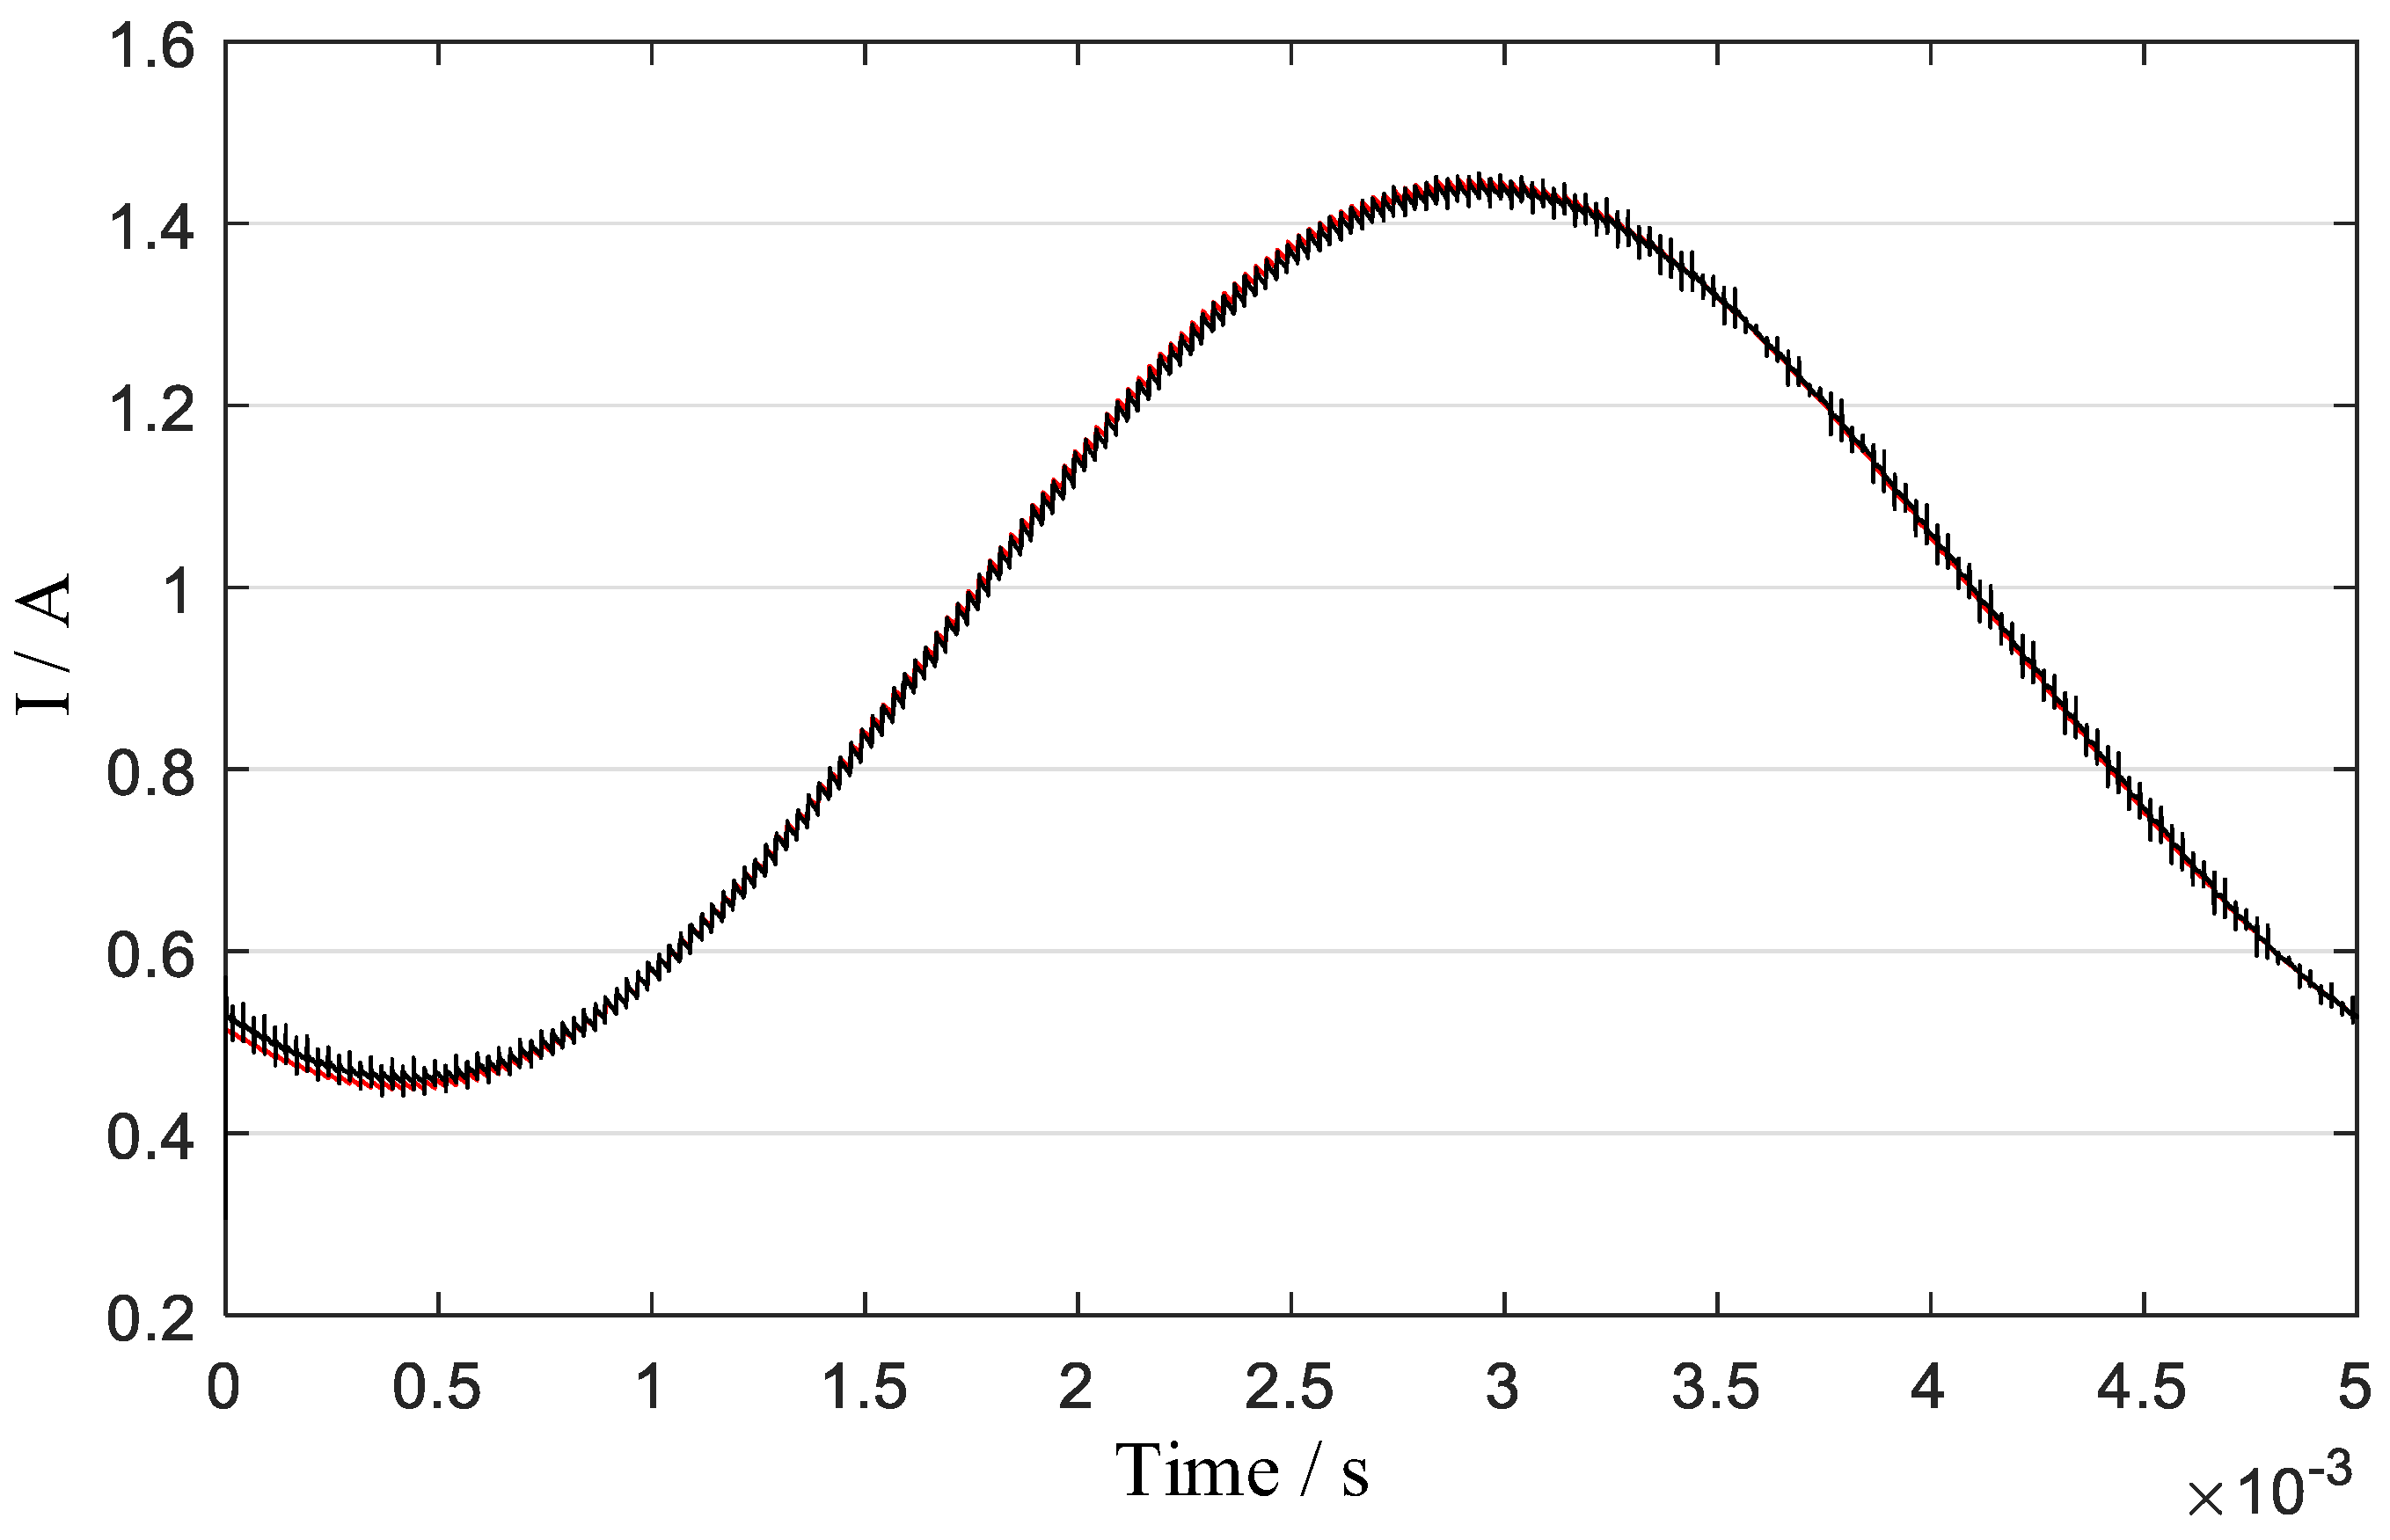
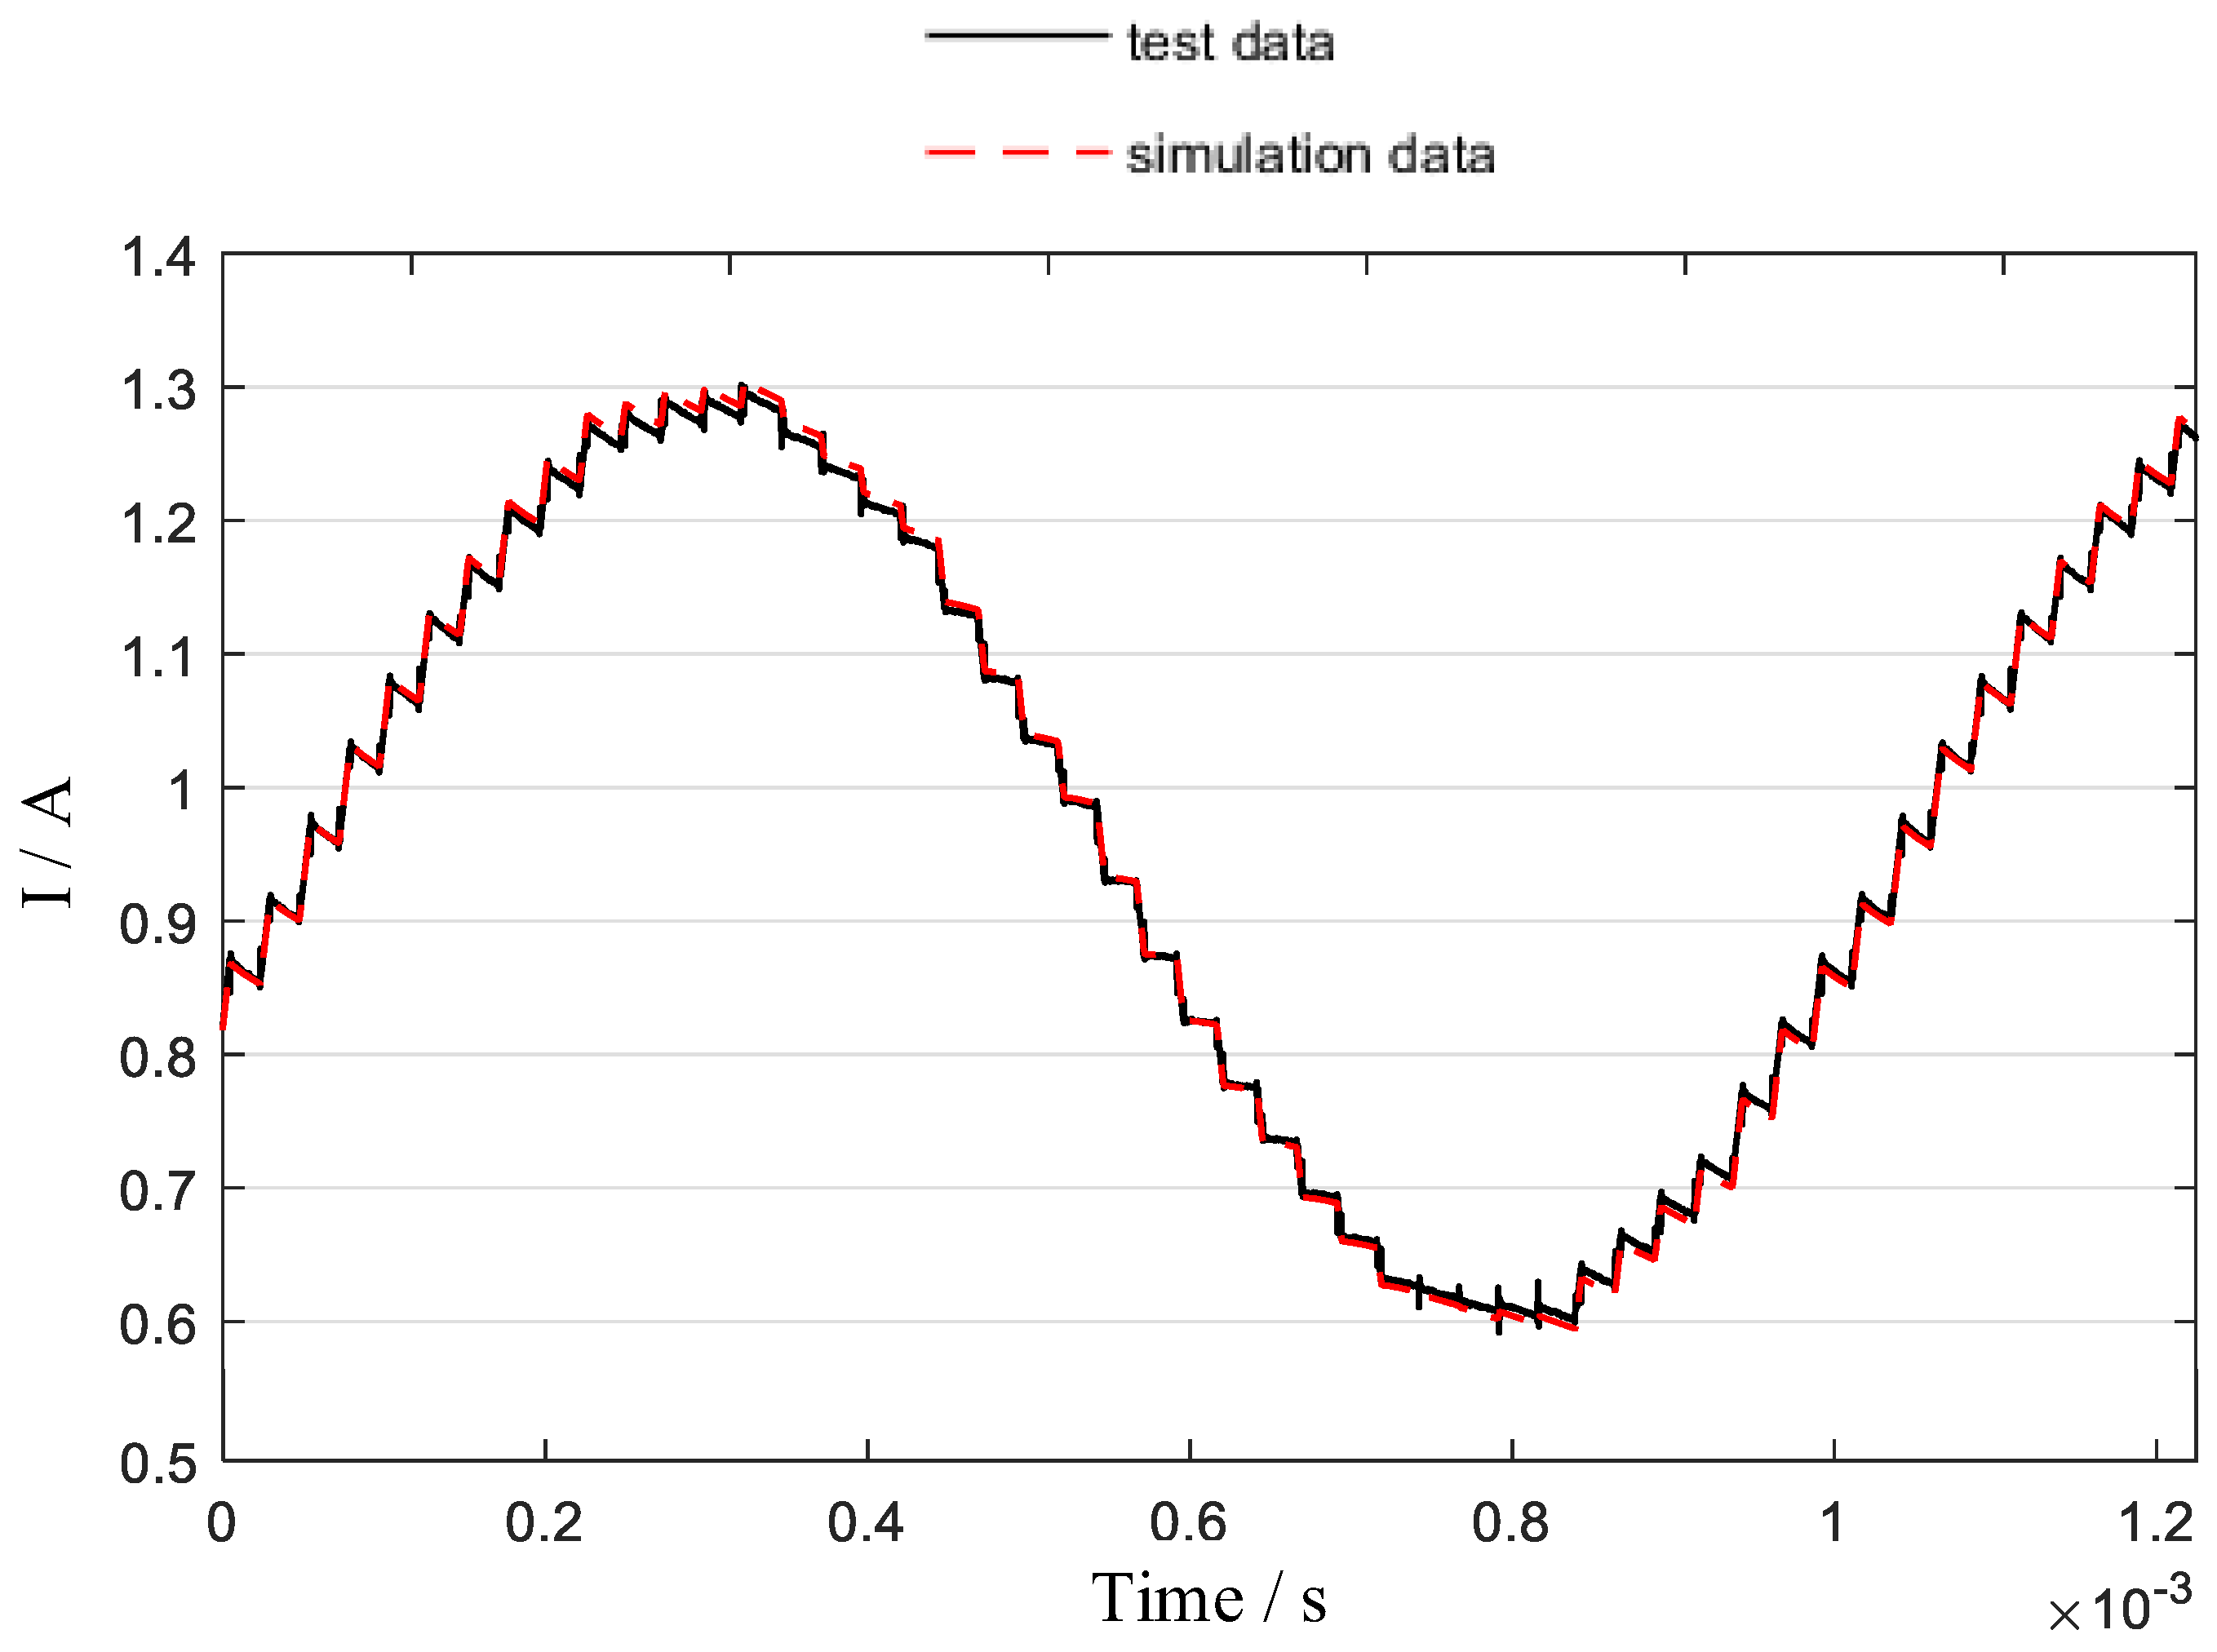
5.2. Results and Analysis

(1) Steady-state current ripple analysis:
Under different DC bias currents, the experimental and theoretical current ripple results are compared in Figure 7.
As illustrated in Figure 7, the current ripple amplitude increased when eddy current effects were considered, compared to the scenario where these effects were neglected. Additionally, the current waveform exhibited significant distortion due to the influence of eddy currents. The eddy-inclusive theoretical model aligns closely with experimental data, validating the accuracy of the analysis. The ripple data are shown in Table 3.
(2) Simulation model:
A Simulink model incorporating eddy current effects was developed. For dynamic testing, the reference current was set to DC bias = 1 A, AC amplitude = 0.5 A, and frequency = 1000 Hz, with identical references applied to both current loops. The experimental and simulation results are shown in Figure 8. And the data for 200 Hz frequency tests are provided in Appendix A.
The results reveal that the current ripple varies with the rising and falling edges of the dynamic current, attributed to energy storage in the mutual inductance path representing eddy currents. Using the signal processing toolbox in Matlab R2024b to compare and analyze the simulation and test data, the mutual inductance-embedded framework achieves 98.8% simulation–experiment correlation. The dynamic current test results validated the accuracy of the Simulink simulation model developed based on theoretical analysis.
(3) Dynamic characteristics in different DC bus voltages:
Tests were conducted with DC bias = 1 A, AC amplitude = 0.5 A, frequency = 400 Hz, and DC bus voltages of 40 V and 80 V. Control parameters were scaled proportionally with UDC to eliminate controller influence. Results are shown in Figure 9.
FFT analysis was performed on the experimentally measured current waveform data to calculate the current amplitude. The results show that at a bus voltage of 40 V, the current amplitude was approximately 0.462 A, while at 80 V, it decreased to 0.433 A. The increase in bus voltage led to a 6.28% reduction in current amplitude. These experimental findings confirm the conclusion in Section 4.3 that the amplitude of the current response decreases with higher bus voltages.
(4) Frequency Response Analysis:
Figure 10 shows the amplitude–frequency and phase–frequency response curves under varying UDC and working currents.
Based on the experimental results in Figure 10, the 0.707 bandwidth of the current response under different operating conditions was calculated and summarized in Table 4.
Experimental results confirm that higher UDC or lower working currents further reduce output current amplitude, thereby degrading the amplifier’s bandwidth.
Figure 11 shows the bandwidth with 1 A amplitude under varying UDC.
Figure 11 demonstrates that bandwidth collapses exceed 50 V at 1 A load (the red line in Figure 11), directly validating Equation (39)’s predictive capability. This empirical evidence bridges theoretical design criteria with practical operational limits.

5.3. Future Research Directions

(1) Adaptive control strategies for real-time eddy current compensation.
(2) Material innovations (e.g., low-conductivity laminations) to minimize losses.
(3) Multi-physics integration addressing thermal and mechanical interactions.

6. Conclusions

This study systematically investigates the detrimental effects of eddy currents on the performance of three-level power amplifiers in active magnetic bearing (AMB) systems. Through theoretical modeling, simulation, and experimental validation, the following key conclusions are drawn: eddy currents exacerbate current ripple due to mutual inductance coupling; higher UDC or lower working currents further reduce output current amplitude, thereby degrading the amplifier’s bandwidth.
These findings not only advance the understanding of eddy current impacts in switching amplifiers but also offer actionable design principles for enhancing the precision and reliability of next-generation AMB systems.

Author Contributions

Conceptualization, Z.L.; methodology, Z.L. and Q.L.; software, Z.L. and Q.L.; formal Analysis, Z.L.; writing—Original Draft, Z.L.; investigation, Z.S.; data curation, Z.S. and H.J.; writing—Review and Editing, Z.S., Q.L. and J.H.; funding acquisition, H.J.; supervision and project administration, H.J. All authors have read and agreed to the published version of the manuscript.

Funding

This research was funded in part by the National Natural Science Foundation of China under Grant 52425701, Grant 52477046, and in part by the Hubei Provincial Natural Science Foundation of China under Grant JCZRQN202400724.

Data Availability Statement

The original contributions presented in this study are included in the article. Further inquiries can be directed to the corresponding author.

Conflicts of Interest

The authors declare no conflicts of interest. The funding source provided financial support for equipment procurement and experimental validation but had no involvement in study design, data interpretation, or manuscript preparation.

Appendix A

For dynamic testing, the reference current was set to DC bias = 1 A, AC amplitude = 0.5 A, and frequency = 200 Hz, with identical references applied to both current loops.
Figure A1. Dynamic current ripple: simulation and experimental results (200 Hz).
Electronics 14 01936 g0a1

References

  1. Schweitzer, G.; Maslen, E.H. Magnetic Bearing: Theory, Design, and Application to Rotating Machinery; Springer: Berlin/Heidelberg, Germany, 2009. [Google Scholar]
  2. Breńkacz, Ł.; Witanowski, Ł.; Drosińska-Komor, M. Research and applications of active bearings: A state-of-the-art review. Mech. Syst. Signal Process. 2021, 151, 107423–107461. [Google Scholar] [CrossRef]
  3. Soni, T.; Dutt, J.K.; Das, A.S. Parametric stability analysis of active magnetic bearing supported rotor system with a novel control law subject to periodic base motion. IEEE Trans. Ind. Electron. 2020, 67, 1160–1170. [Google Scholar] [CrossRef]
  4. Fonseca, C.A.; Santos, I.; Weber, H.I. An experimental and theoretical approach of a pinned and a conventional ball bearing for active magnetic bearings. Mech. Syst. Signal Process. 2020, 138, 106541. [Google Scholar] [CrossRef]
  5. Le, Y.; Wang, K. Design and optimization method of magnetic bearing for high-speed motor considering eddy current effects. IEEE/ASME Trans. Mechatron. 2016, 21, 2061–2072. [Google Scholar] [CrossRef]
  6. Tian, Y.; Sun, Y.; Yu, L. Effects of Eddy Current on Ripple Current of the Switching Power Amplifier for Magnetic Bearings. Proc. CSEE 2009, 29, 110–114. [Google Scholar]
  7. Zhu, L.; Knospe, C.R.; Maslen, E.H. Analytic model for a nonlaminated cylindrical magnetic actuator including eddy currents. IEEE Trans. Magn. 2005, 41, 1248–1258. [Google Scholar]
  8. Zhu, L.; Knospe, C.R. Modeling of nonlaminated electromagnetic suspension systems. IEEE/ASME Trans. Mechatron. 2010, 15, 59–69. [Google Scholar]
  9. Sun, Y.; Ho, Y.; Yu, L. Dynamic stiffnesses of active magnetic thrust bearing including eddy-current effects. IEEE Trans. Magn. 2009, 45, 139–149. [Google Scholar] [CrossRef]
  10. Le, Y.; Sun, J.; Han, B. Modeling and design of 3-DOF magnetic bearing for high-speed motor including eddy-current effects and leakage effects. IEEE Trans. Ind. Electron. 2016, 63, 3656–3665. [Google Scholar] [CrossRef]
  11. Zhang, Y.; Zhang, W.; Yu, J. Adaptive Quasi-Three-Level PWM Control Method for Suppressing Overvoltage at Load Coil Terminal of Switching Power Amplifier. IEEE Trans. Ind. Electron. 2024, 71, 7570–7579. [Google Scholar] [CrossRef]
  12. Yang, D.; Xing, W.; Gao, X. An adaptive control for switching power amplifier of AMB. IEEE Trans. Transp. Electrific. 2022, 8, 2374–2383. [Google Scholar] [CrossRef]
Figure 1. Structure of the three-level power amplifier for AMB.
Electronics 14 01936 g001
Figure 2. Linearized current closed-loop control block diagram.
Electronics 14 01936 g002
Figure 3. Switching signals and the voltage/current waveforms.
Electronics 14 01936 g003
Figure 4. Power amplifier load circuit considering eddy current effects.
Electronics 14 01936 g004
Figure 5. The prototype test platform.
Electronics 14 01936 g005
Figure 6. Experimental results: (a) power amplifier output current; (b) load voltage waveform.
Electronics 14 01936 g006
Figure 7. Steady-state current ripple experimental and theoretical results: (a) 2 A; (b) 4 A; (c) 6 A.
Electronics 14 01936 g007aElectronics 14 01936 g007b
Figure 8. Dynamic current ripple: simulation and experimental results (1000 Hz).
Electronics 14 01936 g008
Figure 9. Power amplifier output current under different DC bus voltages: (a) full data range, (b) data at sinusoidal maximum, (c) data at sinusoidal minimum.
Electronics 14 01936 g009
Figure 10. Current frequency response under different DC bus voltages and working currents: (a) amplitude–frequency response; (b) phase–frequency response.
Electronics 14 01936 g010
Figure 11. Bandwidth variation in different bus voltages.
Electronics 14 01936 g011
Table 1. Power amplifier parameters.
ParameterValueParameterValue
Kp3.6Bus voltage UDC/V80
Ki/s−12000Inductance L/mH4.03
Switching frequency f/Hz20kResistance R0.461
Table 2. Load parameters.
ParameterValueParameterValue
Load inductance L1/mH2.139Eddy current inductance L2/mH2.47
Load resistance R11.3395Eddy current resistance R2702
Mutual inductance M/mH1.8716--
Table 3. Comparative ripple data under varying DC biases.
DC Bias/ARipple (No Eddy)/mARipple (Eddy)/mAIncrease
23293227%
448150212%
694191110%
Table 4. Bandwidth calculation results.
Operating Conditions
(Varying UDC and Working Currents)
Bandwidth (Hz)
30 V, 0.5 A734
30 V, 1 A796
120 V, 0.5 A512
120 V, 1 A728
Disclaimer/Publisher’s Note: The statements, opinions and data contained in all publications are solely those of the individual author(s) and contributor(s) and not of MDPI and/or the editor(s). MDPI and/or the editor(s) disclaim responsibility for any injury to people or property resulting from any ideas, methods, instructions or products referred to in the content.

