1. Introduction
Nowadays, heavy trucks are being more widely used in the logistics industry. The cockpit is the primary space for drivers to work and rest, and its environmental quality directly affects driving safety and personnel health. The utilization of parking air conditioning (PAC), which functions via an independent power supply, has been demonstrated to offer a number of benefits when employed by drivers while parking, waiting, or resting. These benefits include the potential to reduce engine idling, enhance fuel efficiency, reduce energy consumption, and improve convenience. However, the cockpit space is always narrow and confined. It has the characteristics of low thermal inertia and a short reverberation time of the sound field. This makes human comfort particularly sensitive to dynamic changes in the acoustic and thermal environments. The operation of PAC has been shown to modify the thermal environment within the cockpit, thereby affecting the driving experience. Additionally, PAC has been observed to generate noise, which can impact the acoustic quality of the cockpit. Conversely, this configuration is accompanied by the generation of noise that can compromise the acoustic quality of the cockpit.
In recent years, there have been several studies on the law of action of composite environments on human integrated comfort. These include the effect of acoustic-thermal environments on comfort and the effect of colored light on thermal sensation [
1,
2]. Yang et al. [
3] explored the combined effect of different types and sound pressure levels of noise on the human perception of indoor environments under different thermal conditions in the laboratory. Lu Zhang [
4] further explored the mechanisms of acoustic-thermal composite environments on the regulation of human heart rate and skin temperature. Tsai and Lin [
5] investigated the effects of noise and thermal environments on park visitors by using equivalent continuous sound pressure levels. The study found that thermal perception was affected by both thermal conditions and sound pressure. Furthermore, an increase in noise level resulted in subjects reporting higher temperatures. However, no significant relationship was found between noise level and the physiological responses of the subjects. Geng et al. [
6] stated that broadcasting music improves subjective thermal comfort voting of individuals and that a comfortable acoustic environment helps to reduce subjective thermal sensation voting of individuals. Tiller et al. [
7] found that noise affects thermal comfort, but temperature does not affect acoustic sensation. However, it should be noted that the majority of the aforementioned results are based on the construction of rooms or open spaces. The lorry cab, as a typical narrow and confined space, has a low thermal inertia (the rate of temperature change is 3–5 times higher than that of the building) and nonlinear reverberation characteristics of the acoustic field [
8,
9]. This has the effect of significantly decreasing the prediction accuracy of the established models. It is yet to be constructed for the acoustic-thermal composite environment inside the lorry cockpit to build a dedicated evaluation system.
Furthermore, studies have indicated that physiological characteristic parameters have the potential to indicate comfort. For instance, the standard ISO 9886 stipulates that physiological parameters can be employed to assess thermal comfort. Choi et al. [
10] demonstrated that both heart rate and heart rate variability exhibited considerable alterations in response to thermal conditions. Chaudhuri et al. [
11] utilized data from physiological parameters, including heart rate, skin temperature, and so forth. Furthermore, blood pressure and heart rate have been employed to predict the human comfort state. Nkurikiyeyezu et al. [
12] utilized the description of the successive heartbeat interval changes in HRV metrics as a predictor variable to predict thermal comfort. Additionally, Sally Chen [
13] demonstrated that there is a close link between human peripheral physiological signals, such as skin temperature, cardiac electricity and emotional state. Zhai Yingni et al. [
14] demonstrated that physiological parameters such as heart rate and skin temperature were closely related to driving cognitive ability through experiments. However, the majority of extant studies rely on a single environmental parameter or physiological indicator, lack a multimodal data fusion framework, and have not taken into account the nonlinear perturbation of the autonomic nervous system (ANS) by acoustic-thermal coupling (e.g., noise interferes with the thermoregulatory function of heart-rate variability (HRV) via the auditory-sympathetic neural pathway), which constrains the reliability of comfort prediction in complex dynamic environments.
To address the above gaps, this study proposes an experimental method for the evaluation of human annoyance in acoustic-thermal compound environments. This method involves the synchronous collection of acoustic-thermal environmental parameters and human physiological signals during the evaluation test process. The environmental parameters and physiological parameters are then taken together as the predictor variables. The random forest algorithm is then used to establish an annoyance prediction model. This model provides a guide to the design and control strategy for noise reduction in the parking air conditioning.
2. Materials and Methods
2.1. Human Subjects
This study strictly followed the ethical guidelines of the Declaration of Helsinki and was reviewed by the Ethics Committee of Wuhan University of Science and Technology during the experimental design phase. The proportion of males among lorry driver practitioners is more than 90% [
15]. High-temperature exposure experiments need to consider physiological adaptability thresholds. This study was approved by the Ethics Committee. Subjects were recruited using a tiered screening mechanism. Firstly, 20 healthy male practitioners were screened by an occupational adaptability assessment. Their anthropometric information is shown in
Table 1. The screening process was meticulous in its adherence to the following ethical protection measures:
(1) Multi-dimensional health screening: a three-level medical assessment system was adopted, which included a basic questionnaire survey (history of cardiovascular/respiratory/skin diseases), a second-level clinical examination (resting electrocardiogram, skin sensitivity test), and a third-level high-temperature acclimatization pre-experiment (30-min tolerance test in a 40 °C environment), to ensure that the physiological conditions of the subjects were in line with the experimental safety standards.
(2) Dynamic informed consent: a written consent form is signed prior to the experiment, covering experimental risks, data use and voluntary withdrawal mechanisms, and the right to information is reiterated through concise prompts at each stage.
(3) Long-term protection system: establish a database of subjects’ health records and provide 3-year tracking and follow-up services after the experiment, including quarterly cardiovascular function assessment and skin health monitoring. At the same time, a special protection fund will be set up to provide medical support for possible delayed health effects, and encrypted storage and controlled access to experimental data will be realized through blockchain technology [
16].
The research team would like to make a special note: although the gender of the subjects is limited for safety reasons at this stage, a pre-study on the physiological characteristics of female drivers has been carried out at the same time, so as to lay the foundation for the subsequent research on gender-differentiated protection. It is imperative to note that all subjects possess the inherent right to withdraw from participation at any time and to receive an experimental allowance that meets international standards. This is in order to ensure the rights and welfare of the subjects.
2.2. Measurements
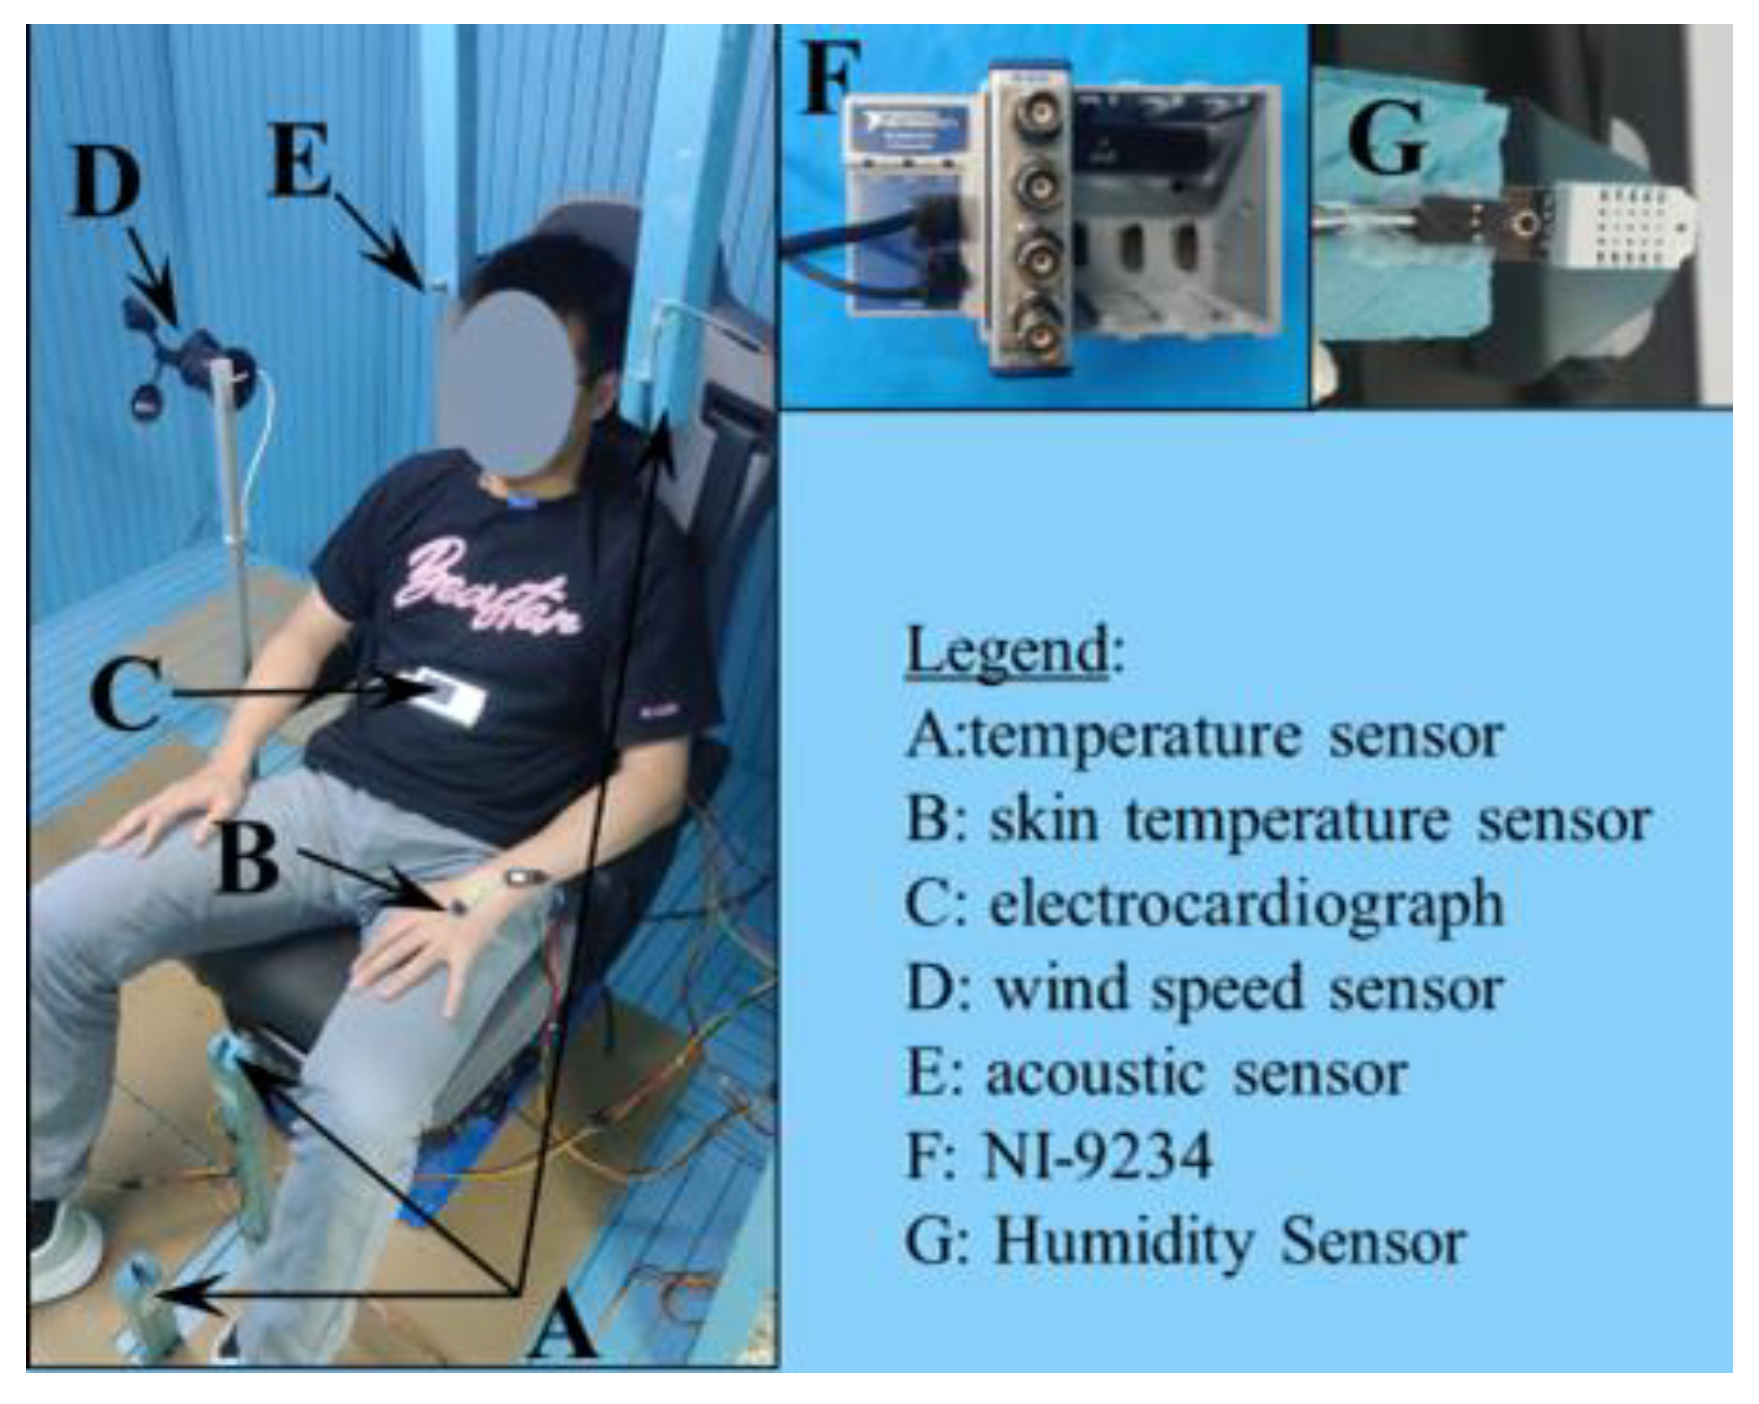
The test was conducted in a 2 × 2 × 2 m cabin, similar to the truck cabin, and the schematic diagram of the cabin and the sensor arrangement are shown in
Figure 1. To simulate a lorry parked in a summer environment, the air conditioning system was activated and set to one of the cooling modes when the subject entered the cab. The temperature was set to 24 °C. The measurements were obtained concurrently with the activation of the air conditioning system and concluded after a period of fifteen minutes. The air conditioner under consideration is equipped with four distinct cooling modes. Consequently, the subject is required to repeat the aforementioned test on four separate occasions. Subsequent to each mode, the thermal and acoustic environments are restored to their initial state by means of an auxiliary electric heating device and adjustable acoustic panels. Thereafter, the subsequent mode is measured. When the parked air conditioning on the top of the cockpit is in operation, the wind noise of the air vents and pipelines, and the noise of the compressor, cooling fan and blower are the primary sources of noise in the cockpit. The test measured and recorded a range of environmental and physiological parameters within the cockpit. The environmental parameters included noise levels around the ears, air temperature at the ankles, hips and brain, air humidity at the air conditioning return vents, and air flow rate at the face. The physiological parameters included electrocardiographic signals of the subjects and skin temperatures of the subjects’ necks, right scapulae, left hands, and right tibiae. The air temperature was calculated using the weighting scheme in GB/T 50785-2012 to determine the average air temperature, while the skin temperature was calculated using the 4-point weighting scheme in ISO 9886:2004 to calculate the average skin temperature. The parameters of the sensors employed are presented in
Table 2. The air temperature, humidity, wind speed and skin temperature sensors are connected to the Arduino board, while the acoustic sensors are linked to the NI-9234 acquisition card. During the test, the acoustic signals and thermal environment parameters are acquired in real-time using a signal acquisition platform developed based on LabVIEW. The test image is presented in
Figure 2.
The location of each sensor measurement point is arranged as follows:
(1) Acoustic sensor measurement point location:
According to the national standard GB/T 18697-2002 requirements, the noise measurement in the cab needs to ensure that the measurement point can reflect the noise level next to the driver’s ear. The acoustic sensor measurement points are set according to this standard, as shown in
Figure 3.
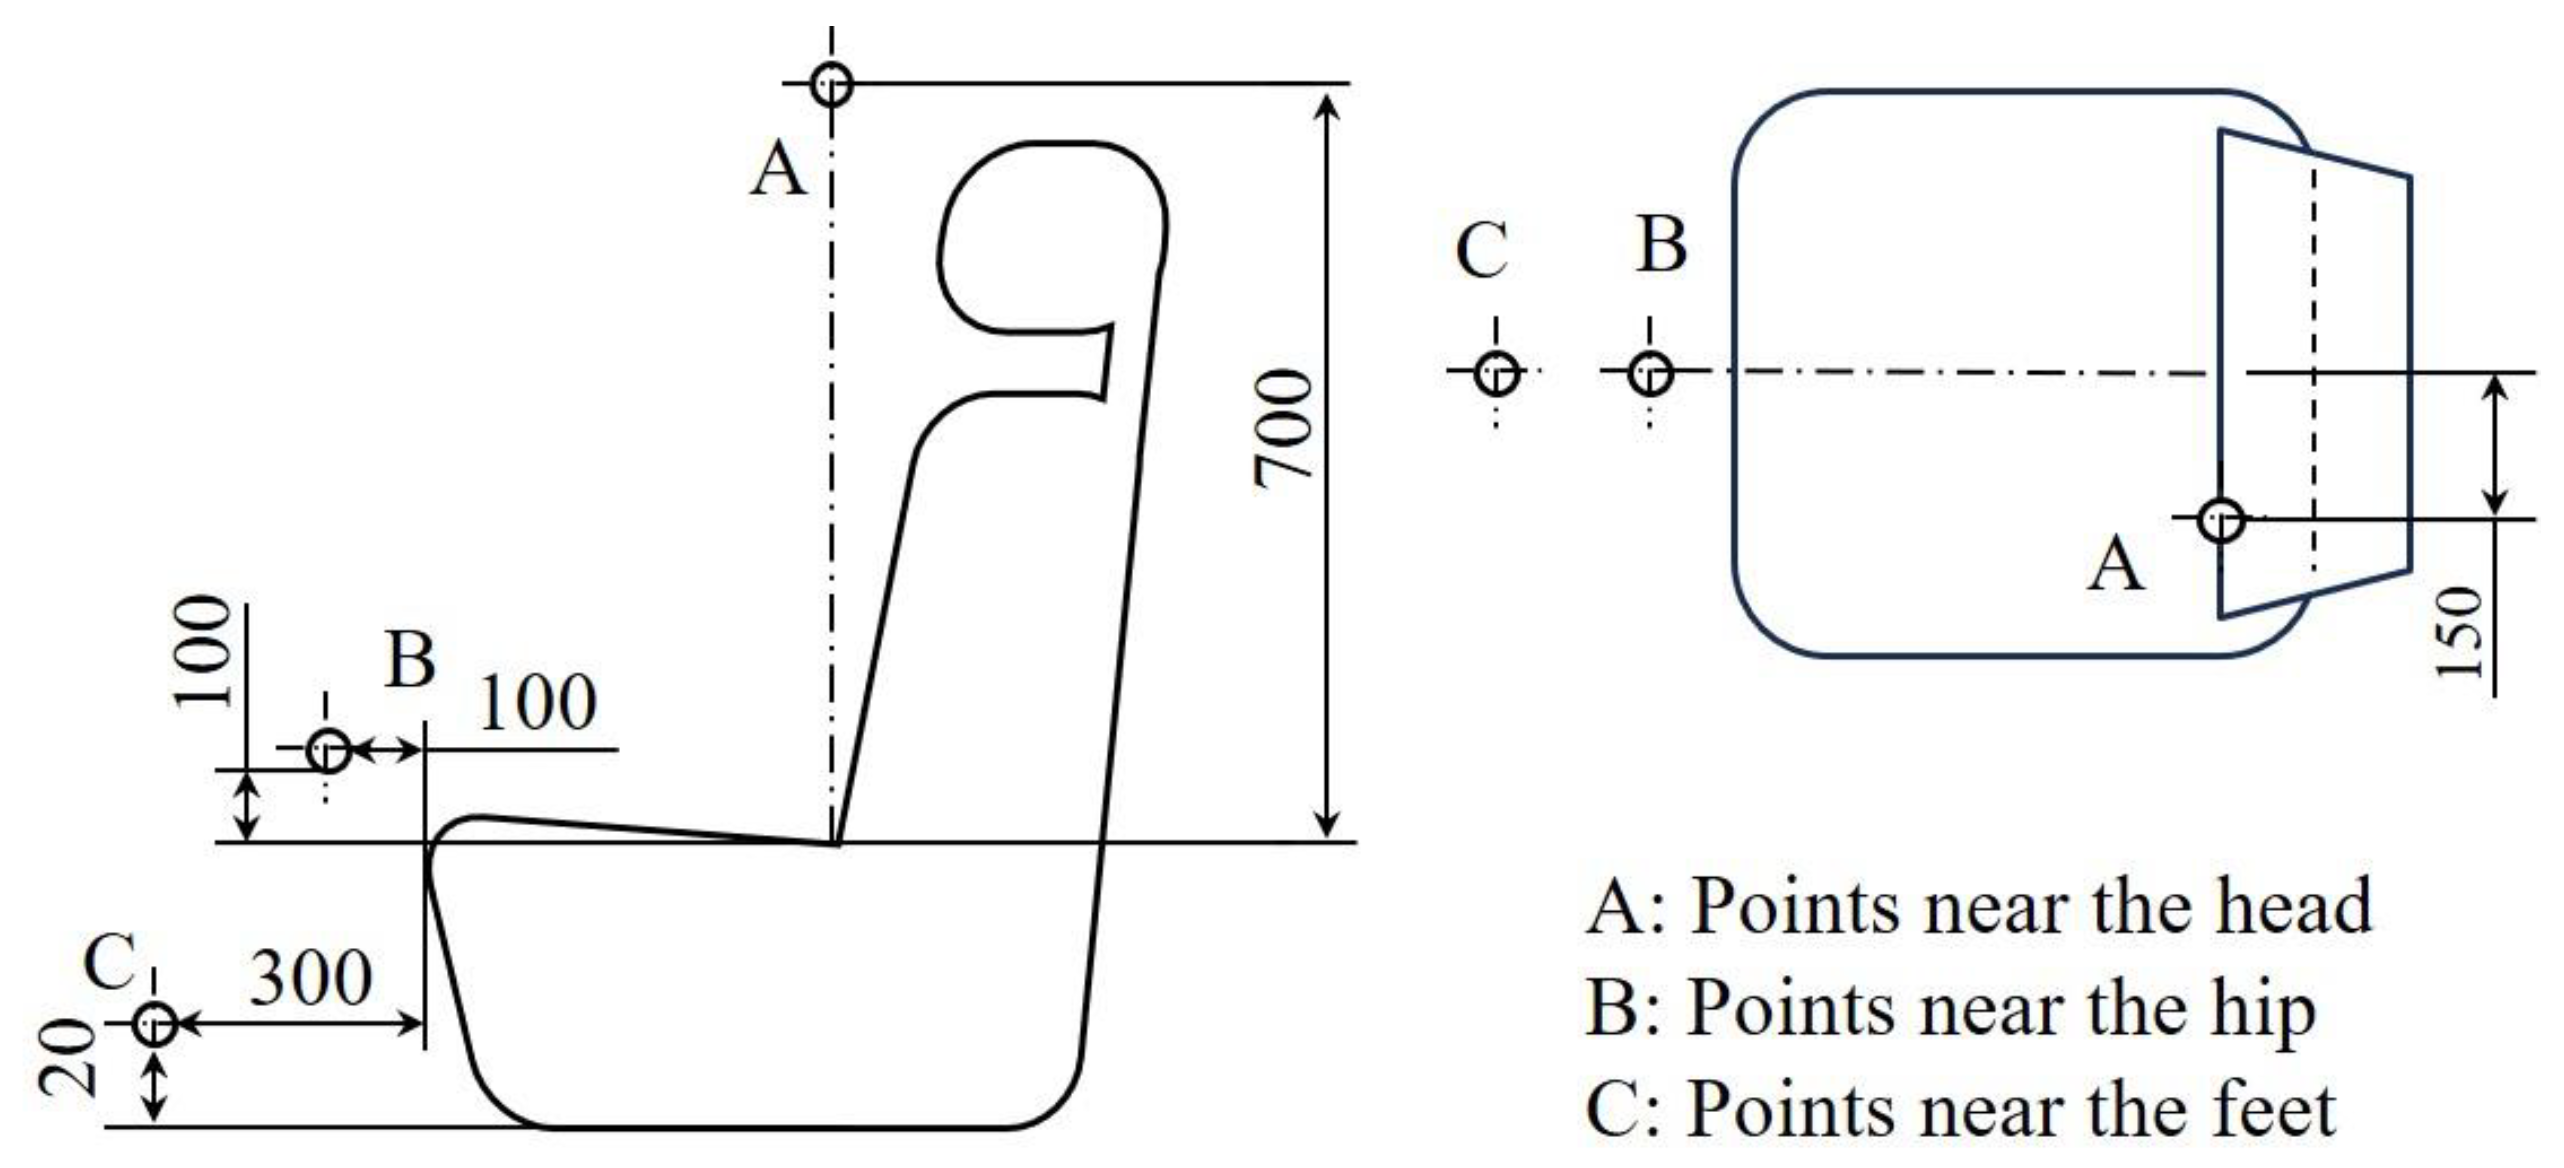
(2) Thermal environment measurement point setting
According to the GB/T 50785-2012 standard, the air temperature in the cab should be measured at the ankle, hip and brain, all weighted by 1:1:1 to calculate the average value, and the temperature measurement points are shown in
Figure 4. Humidity and wind speed were measured according to the requirements of QC/T 658-2009 to measure the humidity in the center surface of the air-conditioning return air outlet at the distance of 100 ± 10 mm, and the wind speed near the face of the test subject.
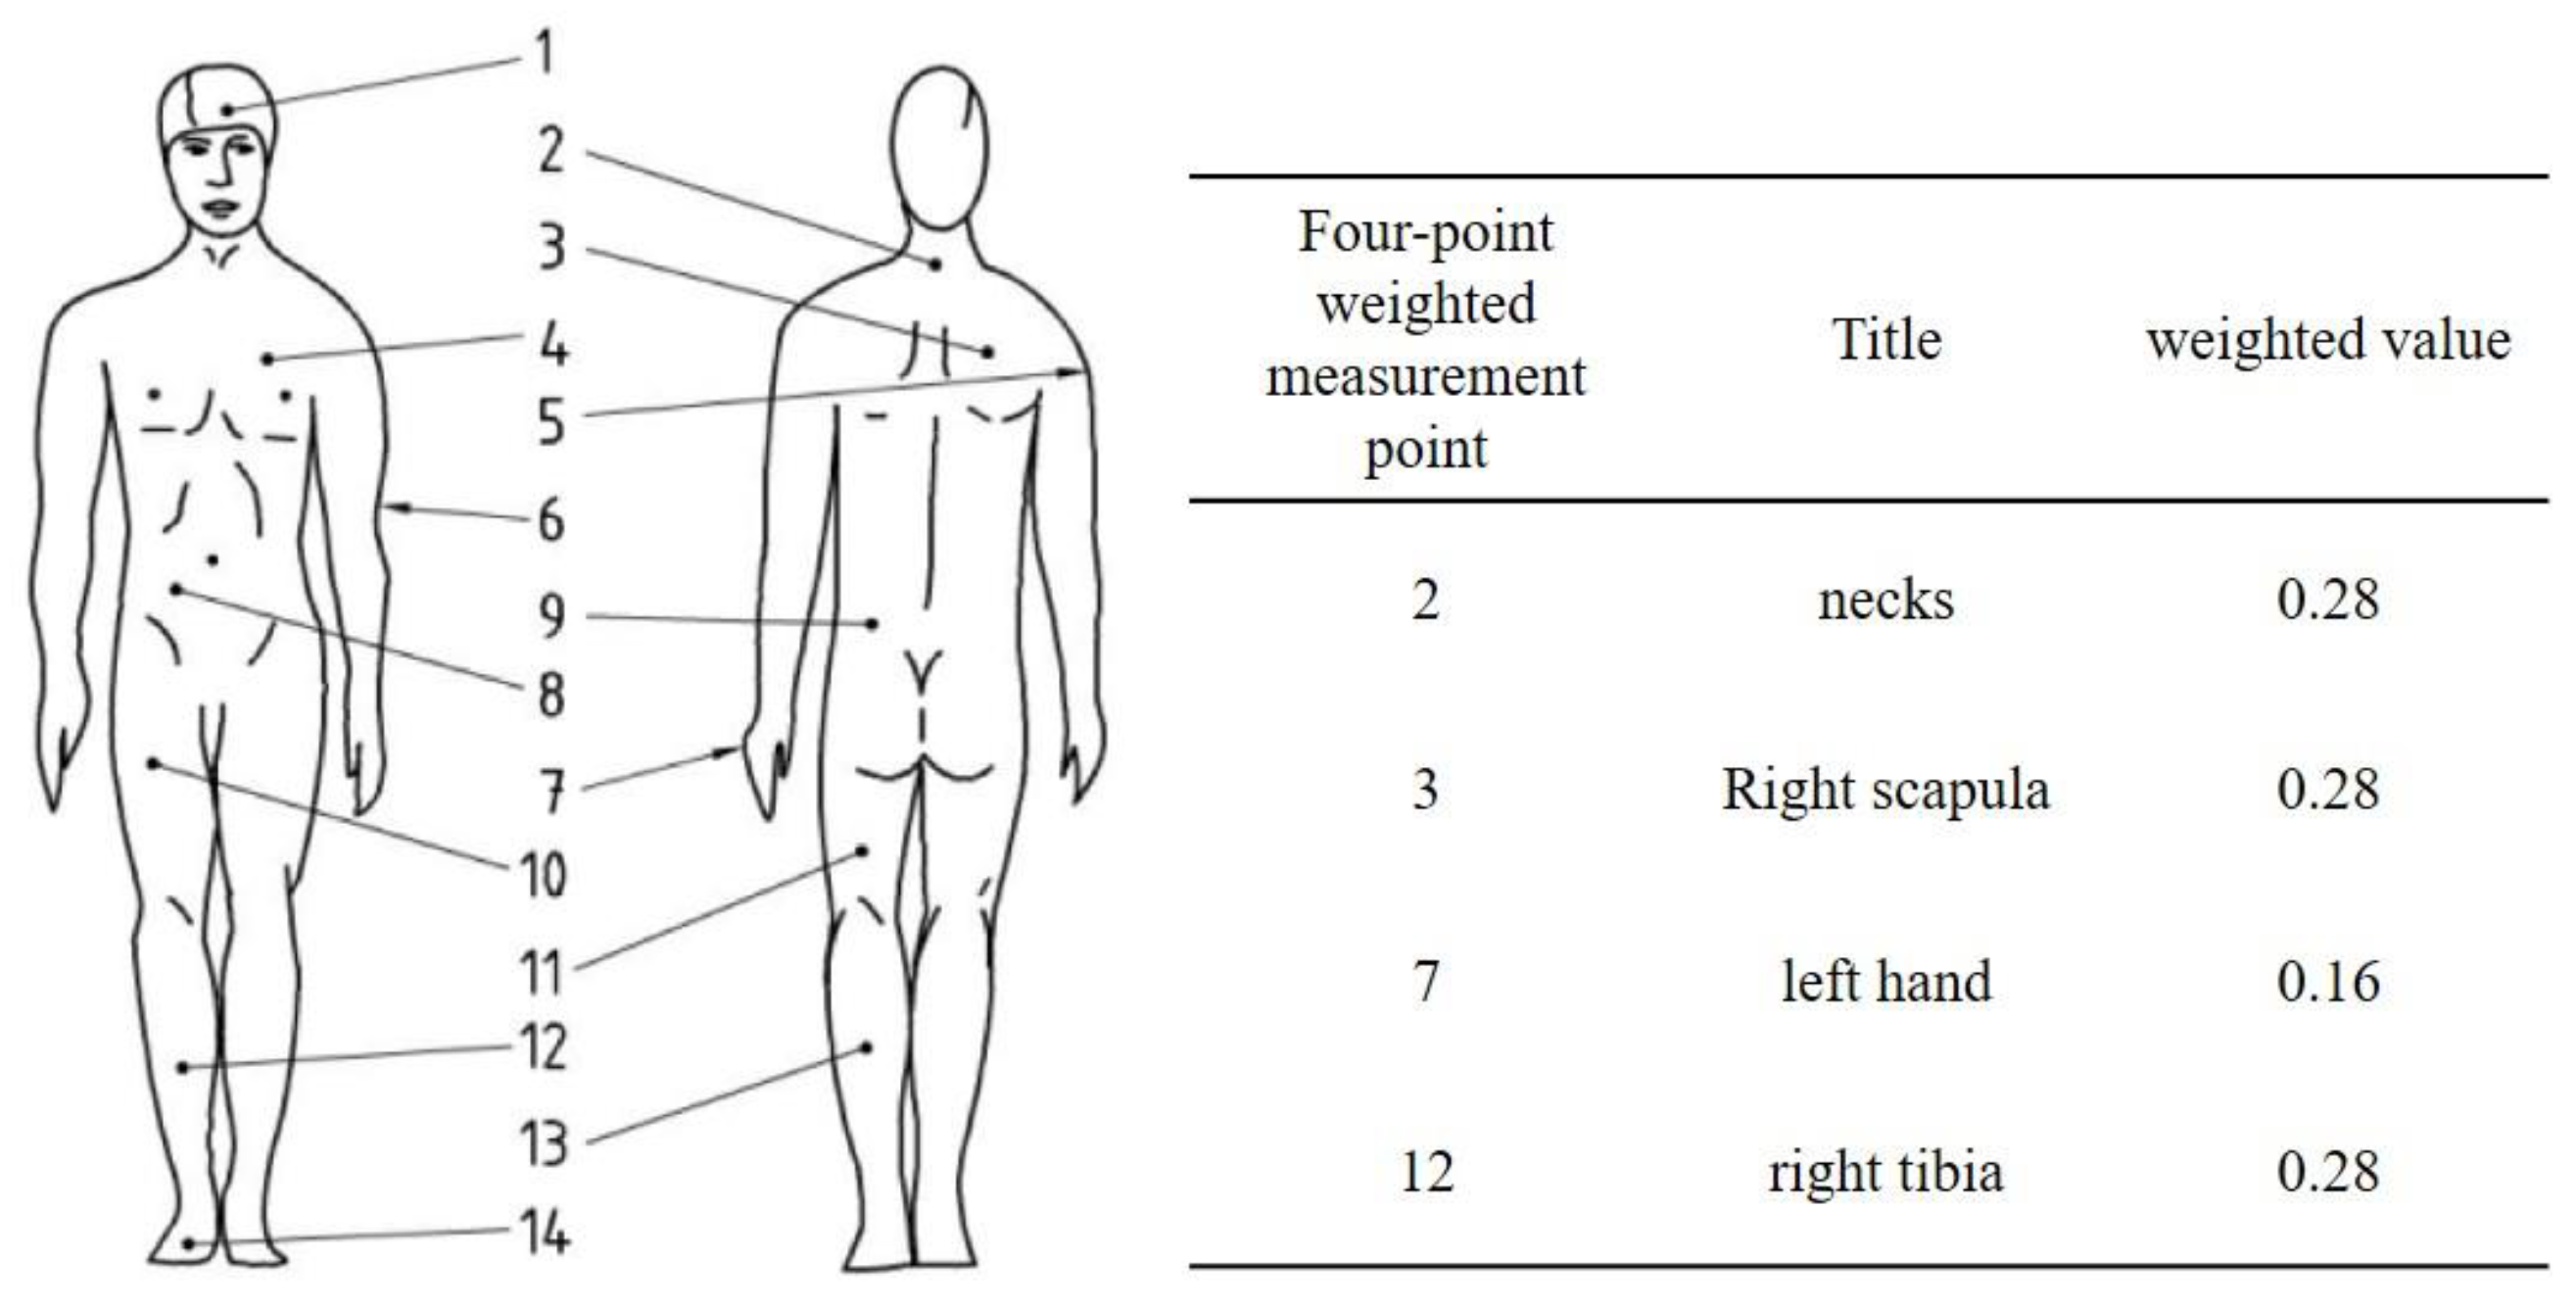
(3) Skin temperature measurement point setting:
According to the ISO 9886:2004 standard, a 4-point weighting scheme is used for warm/hot environments (more measurement points are needed for cold environments). In this experiment, temperatures were measured at the neck, right scapula, left hand, and right tibia (weights 0.28/0.28/0.16/0.28), and the locations of the measurement points are shown in
Figure 5.
(4) ECG signal measurement point setting:
The DiCare-m1CC ECG collector (Dicare Medical Technologies, Shenzhen, China) was used, where the right electrode was placed below the right clavicle and the left electrode was placed below the left chest according to the V5 lead method, as shown in
Figure 6.
2.3. Subjective Measurements
Subjects were asked to score the subjective annoyance level of the acoustic-thermal composite environment in the chamber during the experiment. Zhang Lu posited that the human body’s overall annoyance is influenced by both temperature and noise, and employed an annoyance scale to evaluate the annoyance. Guan H et al. [
17] utilized a comparable total annoyance assessment scale to describe the annoyance in a thermo-acoustic composite environment in their paper. In this paper, a 5-degree unipolar scale was employed to describe the overall annoyance as follows: “not annoying”, “slightly annoying”, “annoying”, “very annoying” and “unbearable”, as shown in
Table 3.
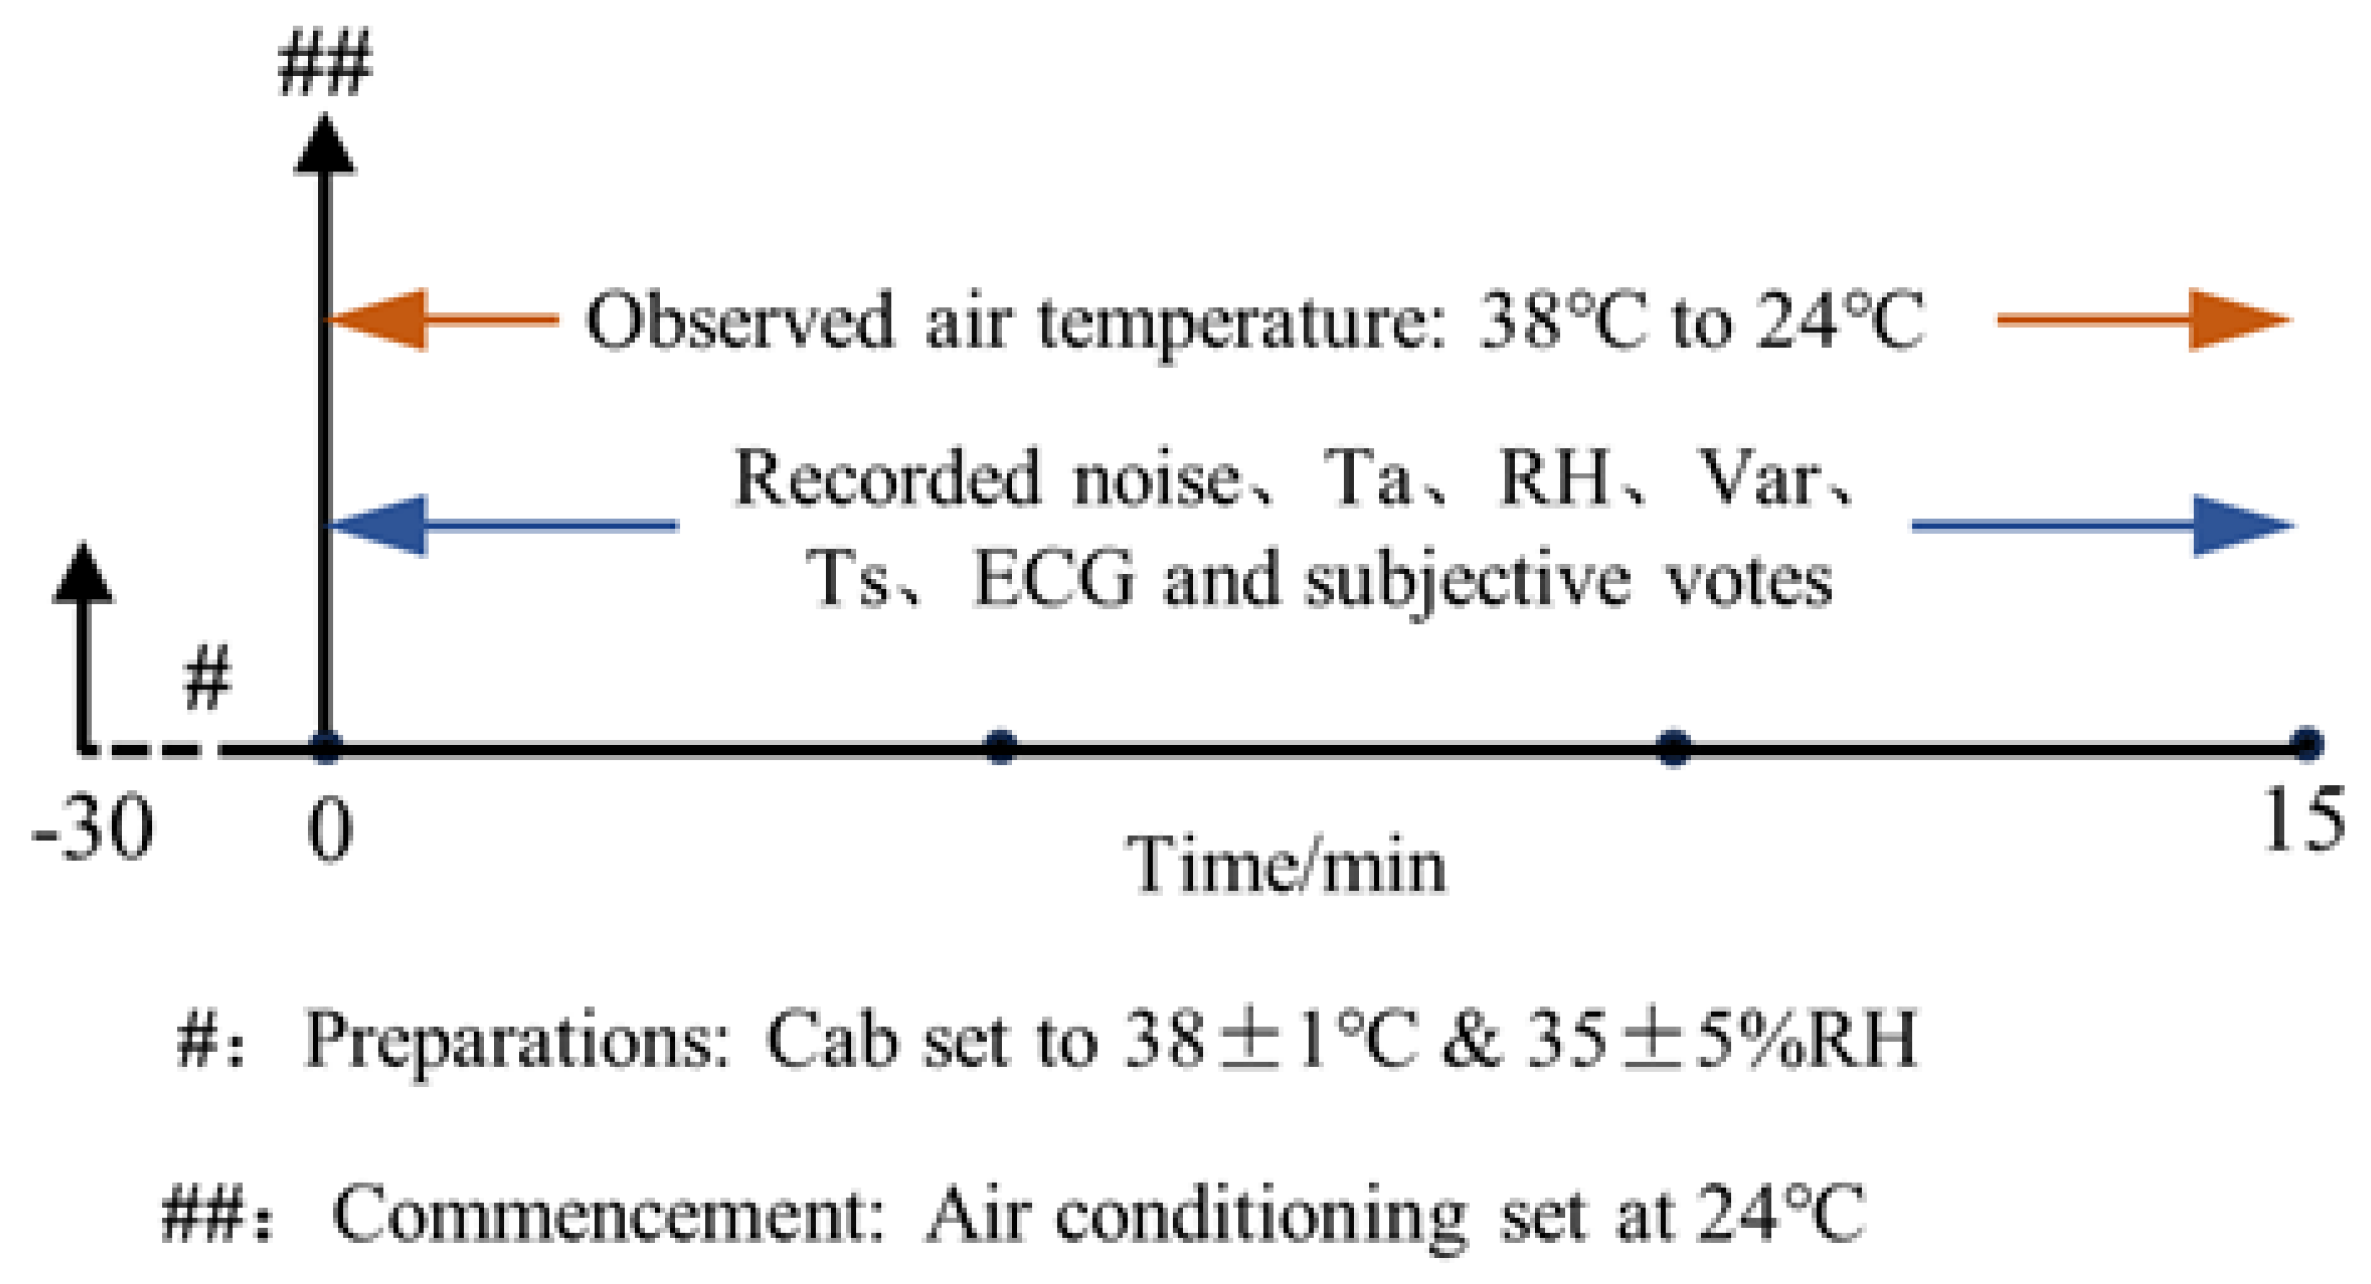
2.4. Experiment Procedure
The test was conducted in a cockpit in order to simulate the use of the parked air conditioner when the truck is parked and stationary in the summer day. The top parking air conditioner has four cooling modes in four gears, each for one operating condition, with the four modes corresponding to four noise levels and cooling capacities. Prior to the commencement of the experiment, the temperature and humidity within the cockpit were adjusted to 38 °C and 35% relative humidity, respectively. It was assumed that the average radiant temperature was equal to the air temperature, and that the temperature was uniformly distributed throughout the cockpit. Concurrently, the subjects were positioned in the thermally neutral room for a minimum of 15 min to preclude any potential bias resulting from their previous exposure to the environment. Additionally, the subjects were informed of the test procedure, their personal details were recorded, and the cardiac equipment and skin temperature sensors were connected. Subjects were instructed to refrain from eating, drinking coffee, or smoking for a minimum of two hours prior to the commencement of the trial, and were permitted to engage in only light physical activity. To control for potential experimental variables, subjects were instructed to dress in a uniform manner, as outlined in
Table 4, with a total clothing thermal resistance of 0.57 clo.
The subjects entered the cabin, started the air-conditioner and set the temperature to 24 °C. They then proceeded to drive for 15 min at four different working conditions. The subjects were in a sedentary reading state during the test period, at which time their active metabolic rate was 1.1 met. The environmental signal acquisition system and ECG collector were employed to monitor the noise, thermal environmental parameters, subjects’ skin temperatures, and ECG signals in the cockpit continuously. The noise sampling frequency was 10,240 Hz, the thermal environmental parameters and the average skin temperature sampling frequency was 1 Hz, and the ECG signals were sampled at a sampling frequency of 400 Hz. Additionally, the subjects were asked to score the overall annoyance level of the whole space every minute in the cabin.
Wu Qingqing and colleagues [
18] observed that the PMV (Predicted Mean Vote) model is essentially analogous to the actual thermal comfort poll at vehicle idling. This paper, however, focuses on the overall sensation of the cockpit environment and the spatial distribution of the temperature within the truck cab. The PMV index and physiological parameters can be used to assess the thermal environment of a vehicle in accordance with the standards ISO 14505-1 and ISO 9886. These standards state that the PMV index and physiological parameters can be used to assess the thermal environment of a vehicle. In this paper, PMV values are employed to describe the cockpit thermal environment, with the addition of ECG signals and skin temperature. The thermal environment parameters and skin temperature obtained from the test were averaged every minute, after which the PMV values were calculated from the average thermal environment parameters. The noise signal and ECG signal were also used to calculate the acoustic objective parameters and HRV index according to every minute. Finally, 1200 samples of annoyance degree (4 working conditions × 15 min × 20 subjects) were obtained, paired with acoustic and thermal environmental parameters and physiological parameters. The experimental design diagram is shown in
Figure 7.
3. Data Analytics
3.1. Data Preprocessing
In order to improve the data quality and model robustness, the following preprocessing processes are implemented on the original dataset:
(1) Outlier removal: the Tukey criterion was used to identify and process the outlier data points. For continuous parameters (e.g., skin temperature, PMV value, etc.), the upper and lower quartiles (Q1/Q3) of each parameter were calculated, the outlier thresholds were defined as Q1 − 1.5 × IQR (interquartile range) and Q3 + 1.5 × IQR, and data points exceeding the thresholds were rejected after manual review, with a total of 12 outlier samples (accounting for 1% of the total sample size) rejected.
(2) Data standardization: as the environmental parameters (e.g., PMV values), acoustic parameters (e.g., roughness R) and physiological parameters (e.g., SNS index) have different scales, the input variables were normalized using the Z-score standardization method with the formula:
where μ is the variable mean and σ is the standard deviation. The mean value of each parameter is 0 and the variance is 1 after standardization to ensure that the feature weights are balanced during model training.
(3) Timing alignment: for the acoustic, thermal, and physiological parameter acquisition frequency differences (10,240 Hz for noise signals and 1 Hz for skin temperature), the high-frequency signals are downsampled with a 1 min time window, and the equivalent values of the acoustic parameters are calculated for each minute and synchronously aligned with the low-frequency parameters to form a time-stamped matched multimodal dataset.
3.2. Heart Rate Variability Analysis
The HRV is typically described using time-domain, frequency-domain, and nonlinear indices. The time-domain analysis indices quantify the variability of interbeat interval measurements, while the frequency-domain analysis indices calculate the absolute or relative power within the component bands. Finally, the nonlinear indices quantify the unpredictability and complexity of the HRV. A range of beat-to-beat intervals. The PNS indices are based on the MeanRR, the RMSSD, and the SD1, while the SNS indices are based on the MeanHR, stress index and SD2, which were calculated by certain weights [
19]. The RR interval of the ECG signals was extracted using the ECG Viewer software v1.7 when calculating the HRV indexes. The RR interval data were then imported into the Kubios HRV Standard software Version 3.5.0 for HRV analysis. As shown in
Table 5.
3.3. Calculation of Acoustic Parameters
The objective evaluation of sound quality commonly employs objective parameters, which may be broadly classified into the following categories: A-weighted sound pressure level (A), loudness (L), sharpness (S), roughness (R), fluctuation (F). The cockpit noise was characterized using the aforementioned five parameters in order to analyze the characteristics of cockpit noise under different operating conditions and operating times. Loudness was calculated using the Zwicker loudness model, sharpness was calculated using the standard DIN 45692, and roughness and fluctuation were calculated using the Zwicker & Fastl model. All of the above calculations were realized in MATLAB R2021b.
3.4. Calculation of the PMV Index
Professor Fanger developed a PMV/PPD model based on the heat balance of the human body [
20]. The formula for the PMV index is shown below:
where M is the metabolic rate, W/m
2;
Icl is the clothing insulation, m
2·K/W;
fcl is the clothing surface area factor;
ta is the air temperature, °C;
tr is the mean radiant temperature, °C;
var is the relative air velocity, m/s; Pa is the water vapor partial pressure, Pa;
hc is the convective heat transfer coefficient, W/(m
2·K);
tcl is the clothing surface temperature, °C.
3.5. Statistical Analysis
A two-factor repeated measures ANOVA (Analysis of Variance) was conducted on subjective ratings, HRV indicators, and Ts to assess the effect on the dependent variable, with working conditions and time serving as independent variables. LSD was employed as a post-hoc test to determine the specific group in which a difference existed if there was a significant difference between the groups. If the interaction was significant, a simple effects analysis was performed to investigate the difference between factor 2 when factor 1 was at a certain level. The Pearson linear correlation coefficient method was used to calculate the correlation coefficients among objective parameters and between subjective evaluations and objective parameters. A two-tailed significance test was used to determine whether the correlation coefficients were statistically significant. The above analytical calculations were conducted using the statistical software SPSS19.0, with a significance level of 95% employed.
As shown in
Table 6, for the correlation analyses between subjective annoyance and continuous-type parameters, Pearson, Spearman, and Kendall correlation coefficients are also reported. As the scale scores conformed to normal distribution and the assumption of linearity was valid, the Pearson coefficients were used as the main results of the analyses, and the results of the non-parametric tests were used as a robustness check.
4. Analysis and Results
4.1. Environmental Parameters Analysis
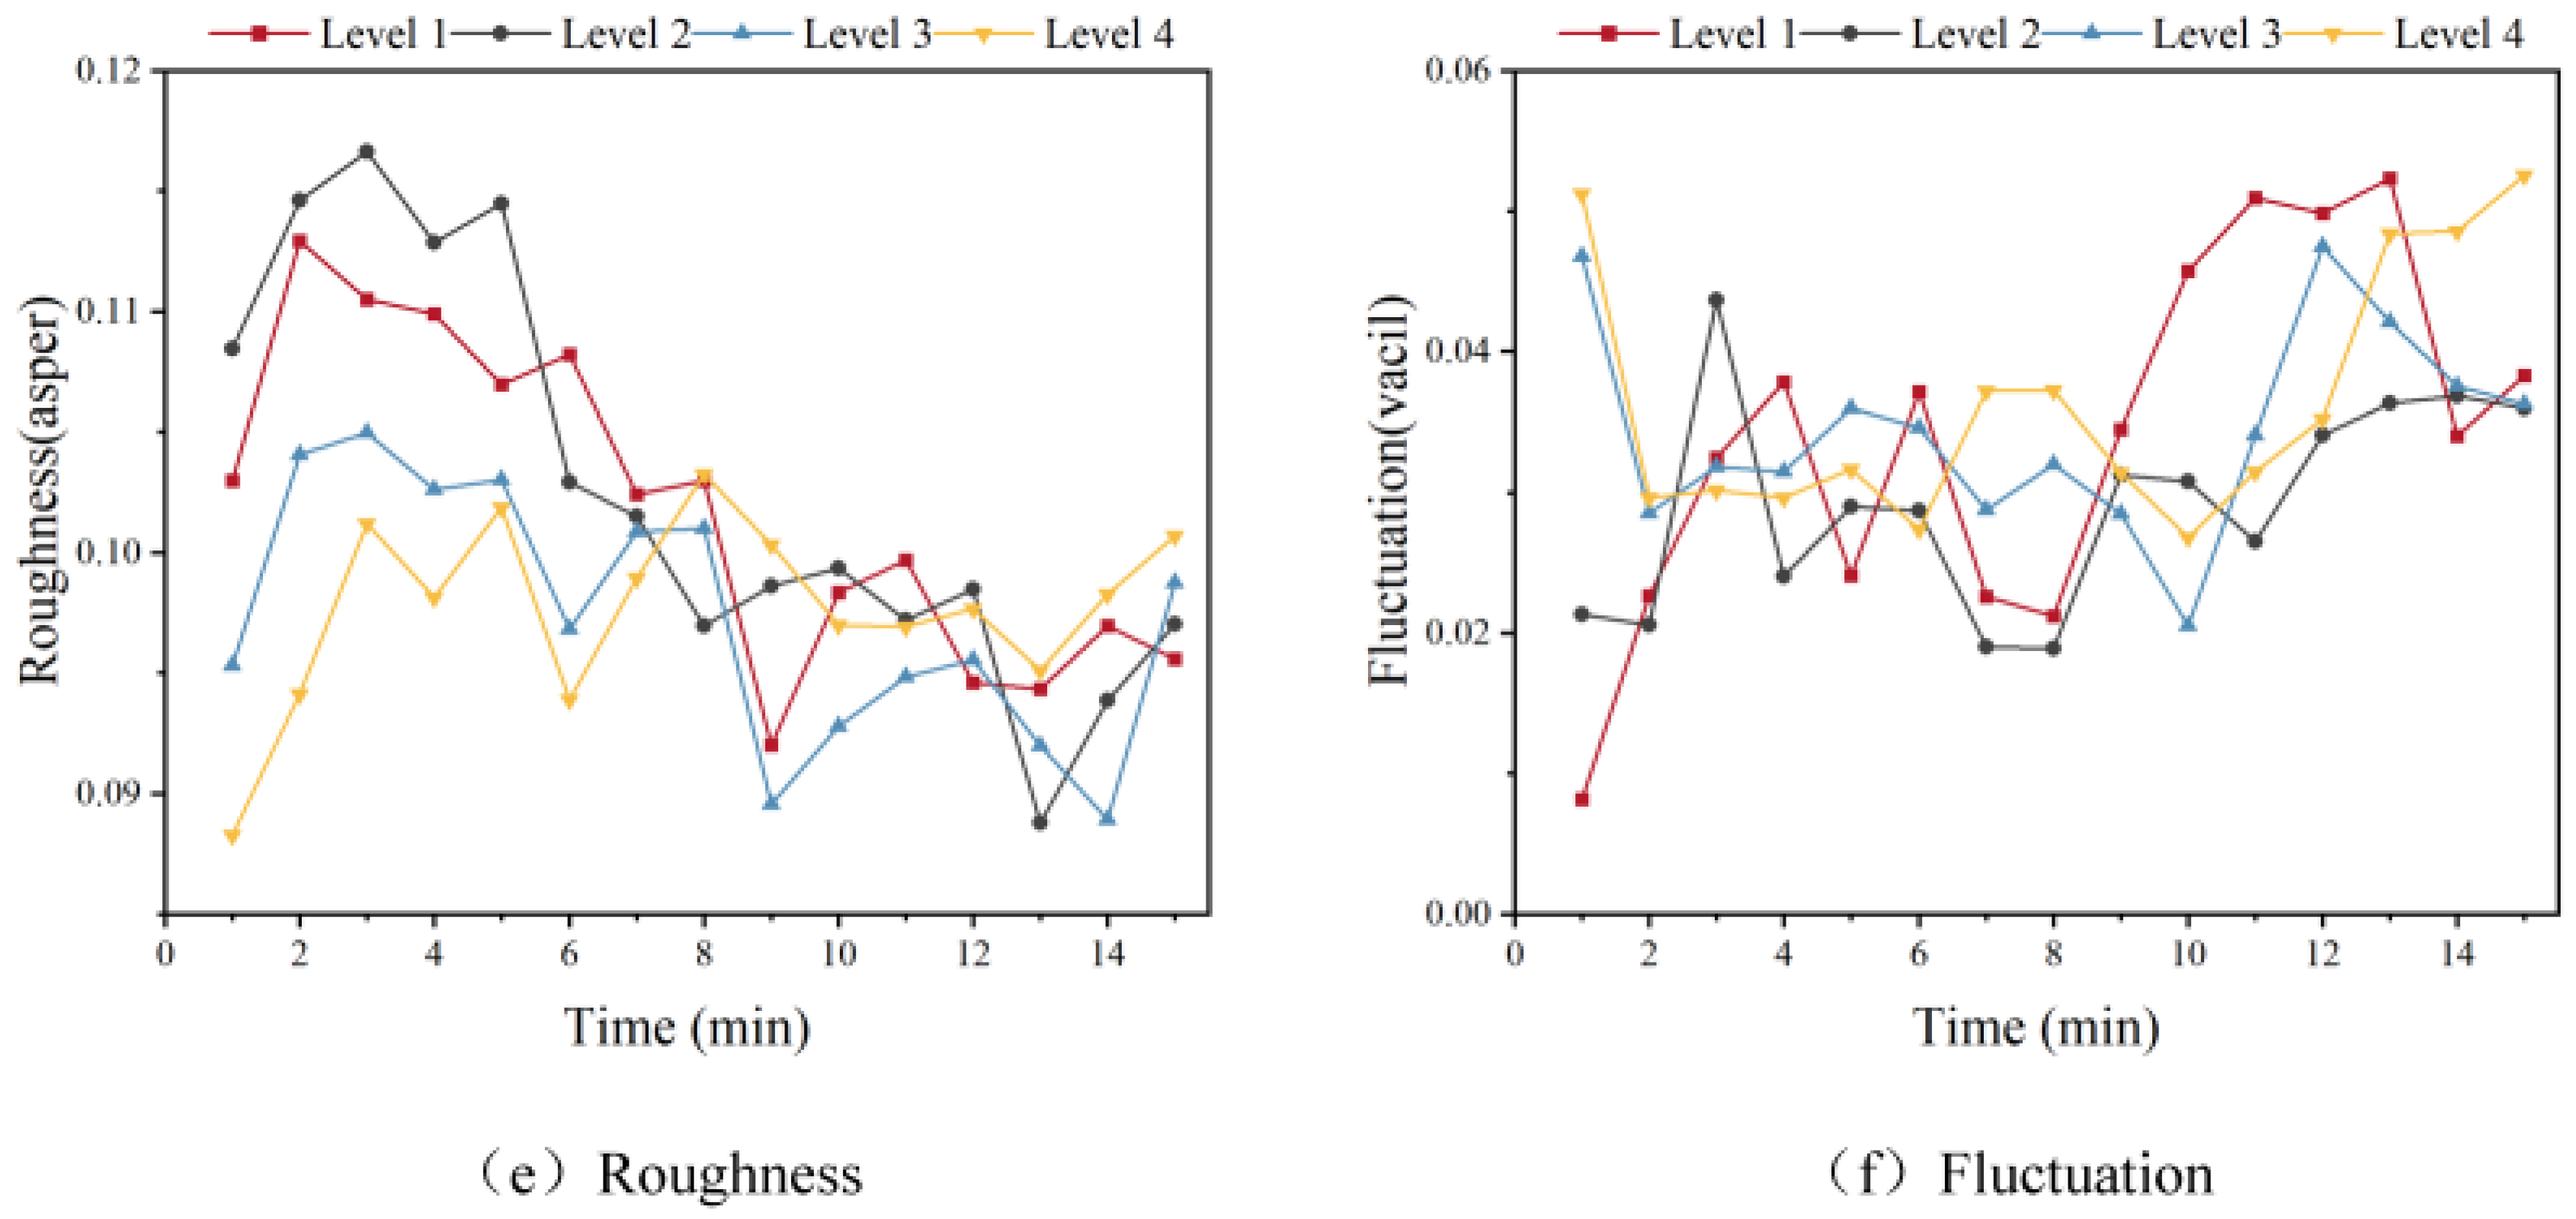
The acoustic-thermal composite environmental objective parameters exhibited by the four working conditions are distinct, and the trends of the indoor average PMV values and acoustic objective parameters are illustrated in
Figure 8. From
Figure 8a, it can be observed that the decreasing trend of condition 1 and condition 2 is more pronounced and significantly larger than that of condition 3 and condition 4. Furthermore, the average PMV value at the conclusion of the test is consistent with the order of the cases, indicating that the four cases possess four distinct cooling abilities, ranging from strong to weak. Additionally, stronger cooling abilities are accompanied by a higher noise level.
Figure 8b illustrates that the A-weighted sound pressure level (A-weighted SPL) of condition 1 is the highest, with a value of 65 dB(A) maintained throughout the test period. This is followed by conditions 2, 3, and 4. It takes a certain amount of time for the air conditioning system to reach normal operational status, which results in varying degrees of increase in the A-weighted sound pressure level across all conditions within a two-minute period. Upon reaching the set temperature, the compressor ceases operation, resulting in a decline in the A-weighted sound pressure level over the final 2–3 min for all conditions except condition 4. The change trend of loudness is essentially analogous to that of the A-weighted sound pressure level, as illustrated in
Figure 8c. It is noteworthy that there is a slight increase in loudness for conditions 3 and 4 between the 9th and 12th minutes. The change in sharpness exhibits a distinct trend, as illustrated in
Figure 8d. The overall trend of roughness is one of decrease, as illustrated in
Figure 8e. No discernible pattern emerges in the jitteriness, as illustrated in
Figure 8f.
4.2. Physiological Parameters Analysis
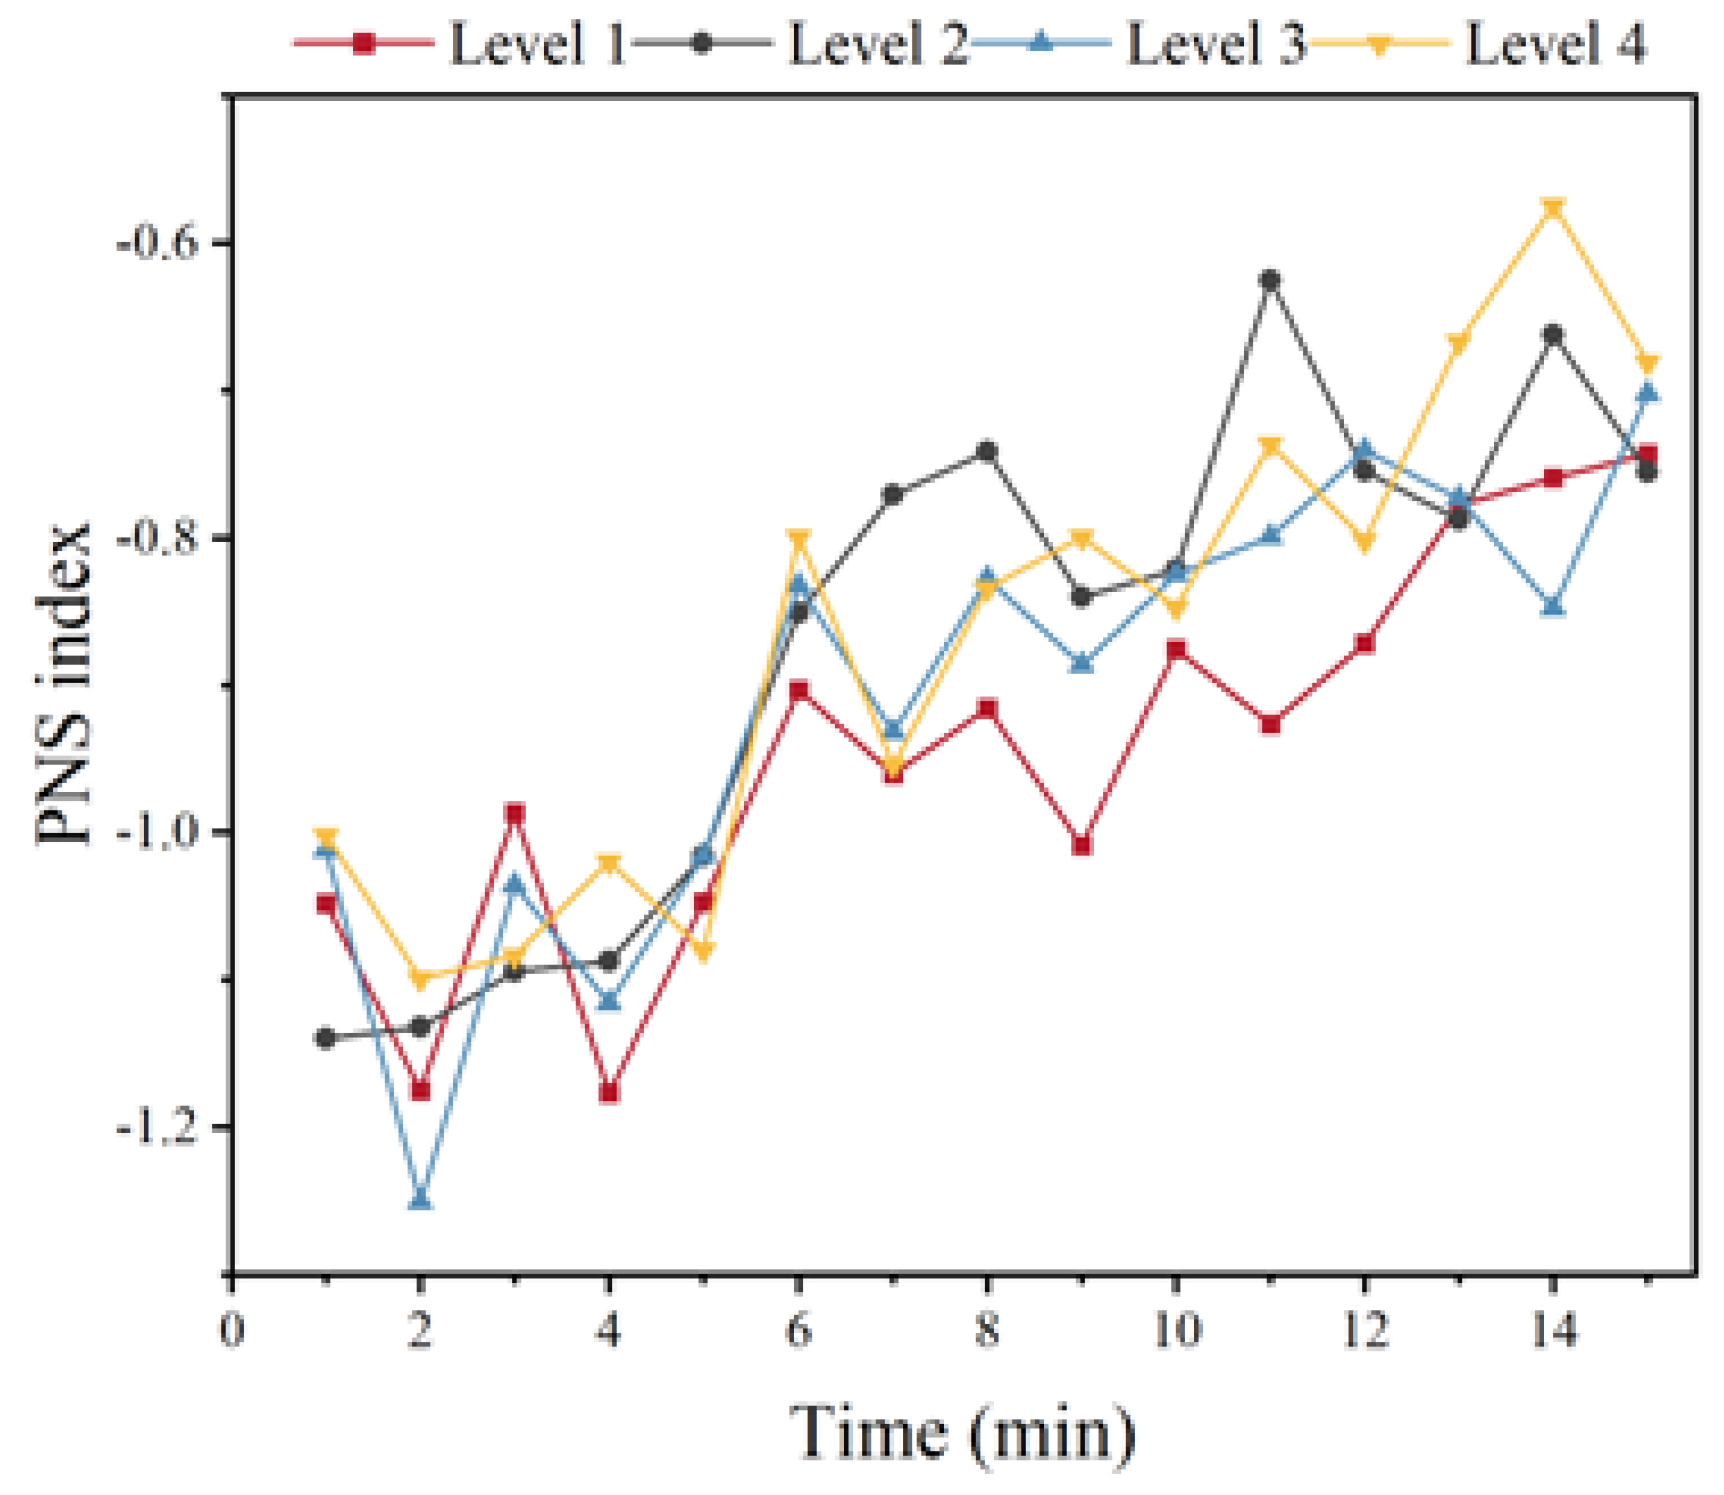
A clear distinction can be observed in the HRV index over time under different working conditions. While the average PNS index under the four working conditions in
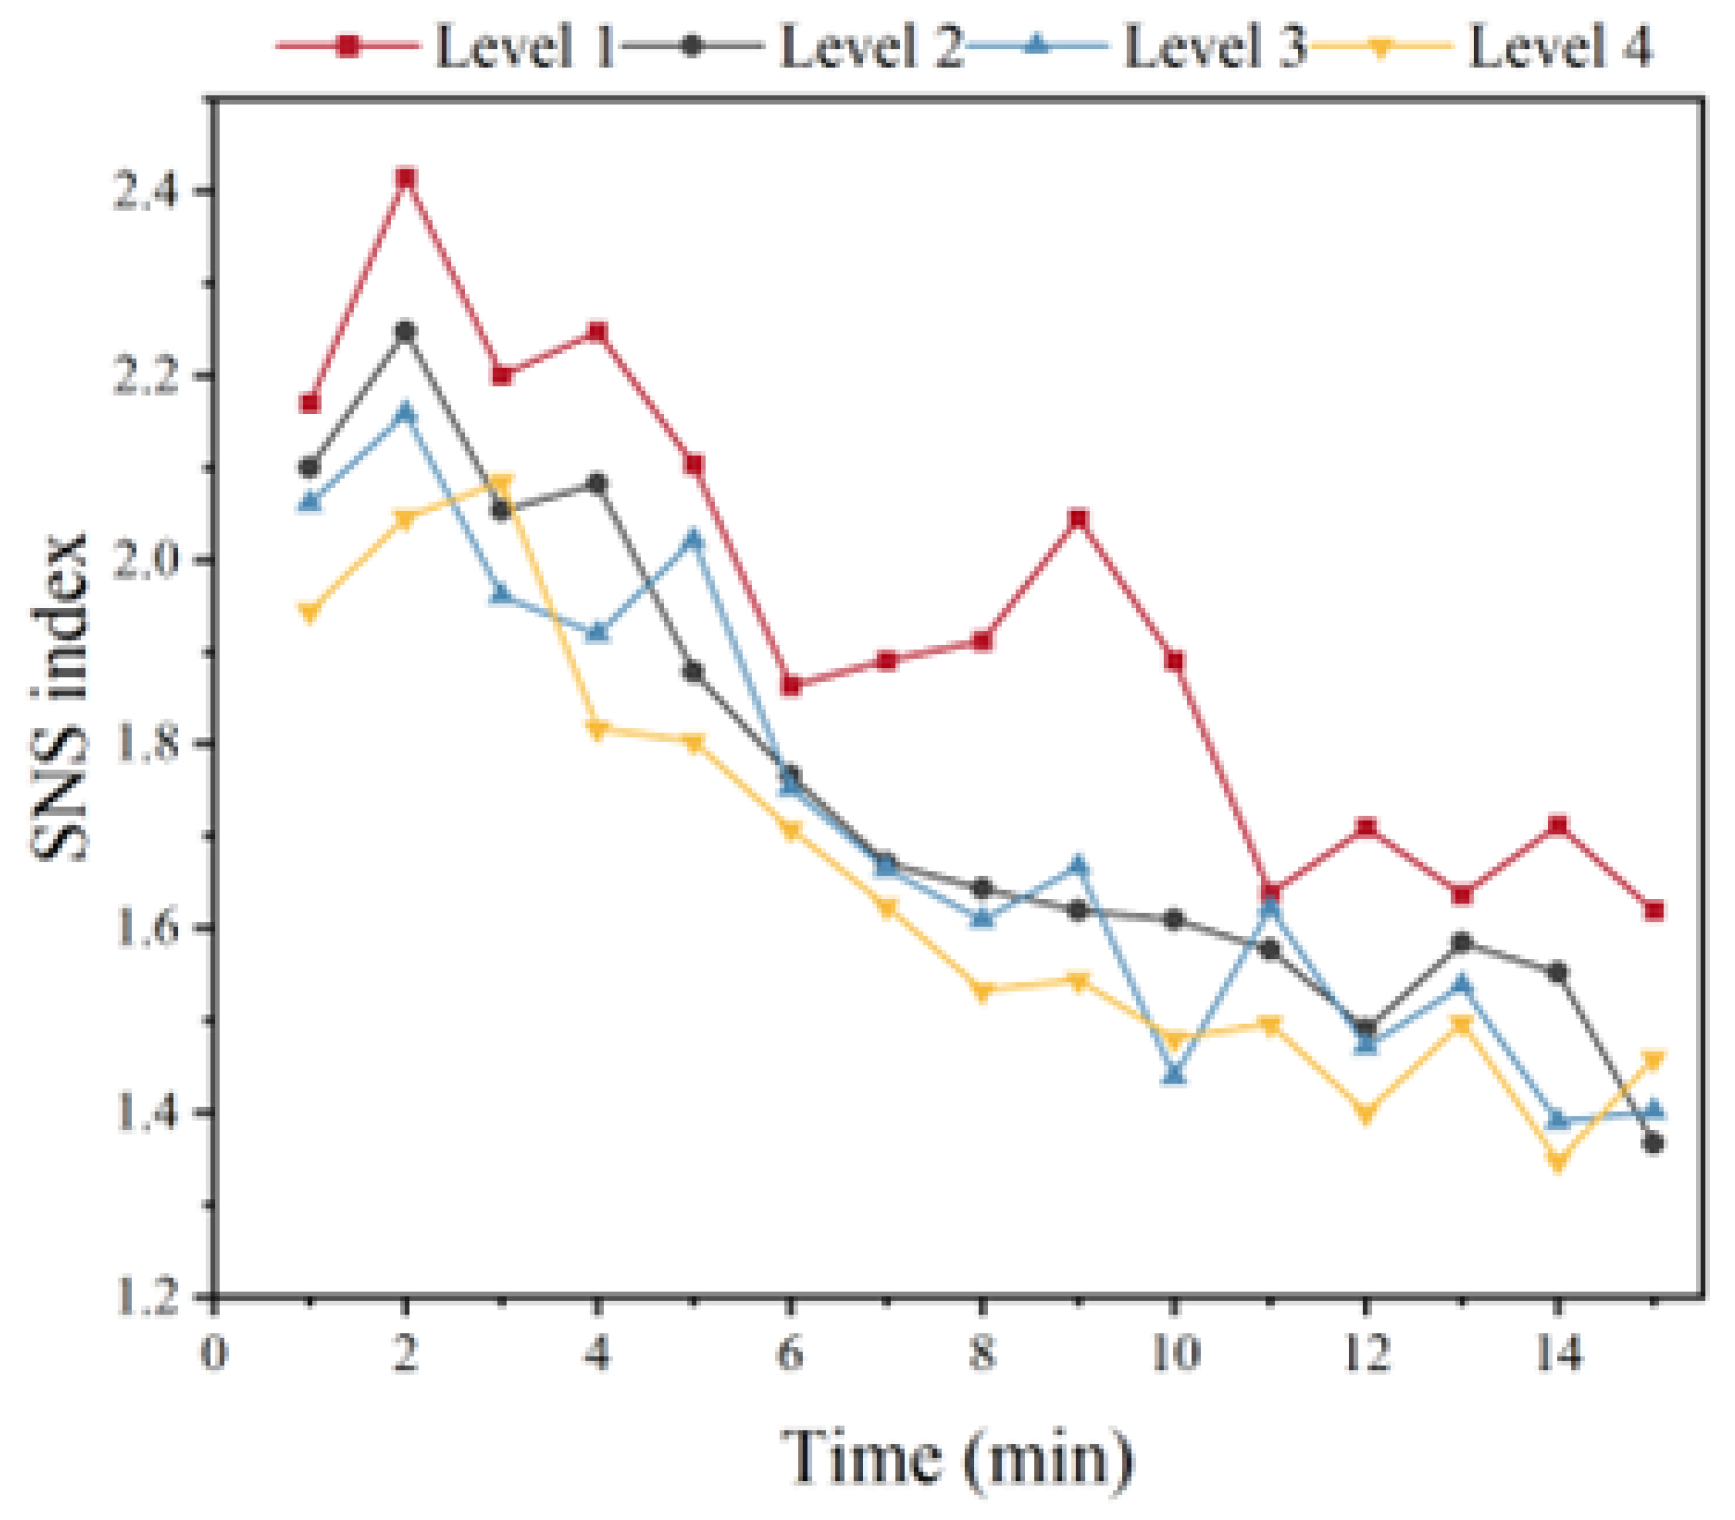
Figure 9 is not readily discernible, the values are consistently below 0 and gradually increase with time. This indicates that the subjects were experiencing a state of worry during the test period, with the degree of worry gradually decreasing over time. The average SNS indexes in
Figure 10 are all greater than 1 and gradually decrease with time, indicating that the degree of annoyance of the subjects gradually decreases with the change in time.
Figure 10 provides a clear illustration of the average SNS index levels across the four working conditions. Condition 1 exhibits the highest value, while condition 4 exhibits the lowest value. Furthermore, condition 2 exhibits a consistently higher value than condition 3, indicating that the degree of annoyance is also related to the working conditions.
The HRV indicators were subjected to a two-way repeated measures ANOVA, as shown in
Table 7. The results indicated that the
p-values of all dependent variables were less than 0.05 when the analytical term was “time”, and the
p-values of all dependent variables were greater than 0.05 when the analytical terms were “working conditions” and “time and working conditions”. The analysis indicates that there are significant differences in HRV indexes at different moments, with no significant differences in HRV indexes under different working conditions. Furthermore, the two factors of time and working conditions appear to be relatively independent, with no interaction effect.
As illustrated in
Figure 11, the operation of air conditioning resulted in a gradual decrease in temperature, which exhibited a consistent trend with that observed in
Figure 8a. The correlation coefficient between PMV, acoustic objective parameters and physiological parameters (PNS/SNS index, Ts) was calculated using the method of Pearson’s correlation coefficient, and the resulting correlation heat map is shown in
Figure 12. It can be observed that there is a correlation between PMV values and roughness and jitter, whereas no correlation exists between PMV values and A-weighted sound pressure level and loudness sharpness. In addition, the correlation coefficients between A, L and S are all above 0.7, indicating a strong correlation and suggesting that the three parameters belong to the same class of noise descriptors. The PMV value has a strong correlation with Ts (r = 0.99,
p < 0.05), in line with the trend of change.
Figure 12 illustrates a highly significant inverse correlation between the PNS index and the SNS index (r = −0.87,
p < 0.05), indicating the antagonistic effect of the PNS and the SNS. Concurrently, there was a robust correlation between the two indices and Ts and PMV (|r| > 0.8), which was attributable to the vasodilatory effect of elevated temperature, which in turn reduces the excitability of the autonomic nervous system and thus decreases HRV [
6]. A weak correlation was observed between acoustic-objective parameters and SNS indices, with correlation coefficients ranging from 0.36 to 0.47. Furthermore, F and R were also weakly correlated with the PNS index and Ts, respectively. In conclusion, the results demonstrate a strong correlation between thermal environment parameters and physiological indexes, with the latter being significantly influenced by the former. The acoustic-objective parameters, in particular F and R, exerted a notable influence on the physiological indices.
4.3. Subjective Responses
The average annoyance change curves for the four conditions are shown in
Figure 13, which shows that condition 1 had the lowest average annoyance in the first 7 min of the test, condition 2 had the lowest average annoyance in the 8th, 12th and 15th minutes, condition 3 had the lowest average annoyance in the 9th minute and condition 4 had the lowest average annoyance in the 10th to 11th minutes.
Each of the four working conditions was run for a period of 15 min, i.e., each volunteer was required to vote on the level of annoyance they experienced in 60 different acoustic-thermal composite environments. The subjective annoyance votes were analyzed using two-factor repeated measures ANOVA. In this analysis, the different working conditions were used as between-group factors and the different times as within-group factors. This analysis was conducted in order to investigate the effect of acoustic-thermal composite factors on annoyance [
21]. The results of the analysis are shown in
Table 8.
The results showed that there was a main effect when the analytic term was “time” and the dependent variable was “subjective evaluation” (F = 214.498, p < 0.001), and there was no main effect when the analytic term was “working conditions” (F = 1.304, p = 0.279), and there was an interaction effect between the interaction terms “time” and “working conditions” (F = 1.863, p = 0.279). The results showed that the effect of time on subjective evaluation was significant, i.e., there was a significant difference in the annoyance vote at different moments for each working condition; the effect of working condition on subjective evaluation was not significant, i.e., there was no significant difference in the annoyance vote for the four working conditions; and the interaction between time and working condition had a significant effect on subjective evaluation.
5. Prediction of Occupant Annoyance
The Spearman rank correlation coefficients of the subjective evaluations of 20 volunteers were analyzed [
22], as shown in
Table 9. It can be observed that the average correlation coefficient of numbers 6, 10, 14 and 19 is less than 0.7, which is below the threshold for inclusion. Consequently, the mean value of the remaining 16 volunteers’ evaluation results was taken as the mean annoyance degree. Pearson correlation coefficients were calculated between the average annoyance degree and the objective parameters, as shown in
Table 10. It can be seen that PMV, roughness, PNS index, SNS index and Ts are significantly correlated with the average annoyance level, and the above parameters are used as independent variables and the average annoyance level is used as the target variable, and 48 groups of samples are randomly selected as the training set of the model, and the remaining 12 groups of samples are used as the test set, and the annoyance prediction model is established by using the random forest (RF) algorithm.
The Random Forest algorithm has been shown to have significant advantages in the prediction of the degree of annoyance. Firstly, it automatically captures the multi-dimensional associations through the integration of multiple decision trees without the need for artificial feature combinations. This is due to the non-linear relationships and complex interactions between the screened predictor variables (PMV value, roughness, PNS/SNS index, skin temperature). Secondly, in the face of dynamic environmental noise (e.g., in the context of variations in data noise resulting from compressor startup noise fluctuations and individual physiological differences), the bagging strategy is employed to mitigate the variance of the single tree. This strategy exhibits enhanced robustness and resilience to noise during integration. In scenarios where the number of samples is limited (60 groups), the algorithm demonstrates stability across multiple iterations due to its fewer hyper-parameters and more efficient training. Furthermore, the random selection of features and samples effectively mitigates the correlation of the single tree, thereby preventing overfitting of small data and enhancing the generalization capability. It is evident that these features contribute to the model’s high level of accuracy, strong interpretability, and engineering practicality in prediction tasks.
The accuracy of the model prediction is estimated by the 10-fold cross-validation method, and the coefficient of determination (R
2), the mean absolute error (MAE) and the root mean square error (RMSE) are selected as the evaluation indexes. The results of the model run are shown in
Table 11, with the average evaluation indexes of 0.941, 0.201 and 0.259, which show that the RF-based annoyance prediction model exhibits a high degree of accuracy. The physiological indicators have the largest contribution to the subjective annoyance level, indicating that the physiological parameters can reflect the annoyance level of the human body, as shown in
Figure 14. At the same time, the thermal environment parameters have a higher contribution than the acoustic environment parameters, indicating that the thermal environment has a stronger influence on the subjective annoyance level.
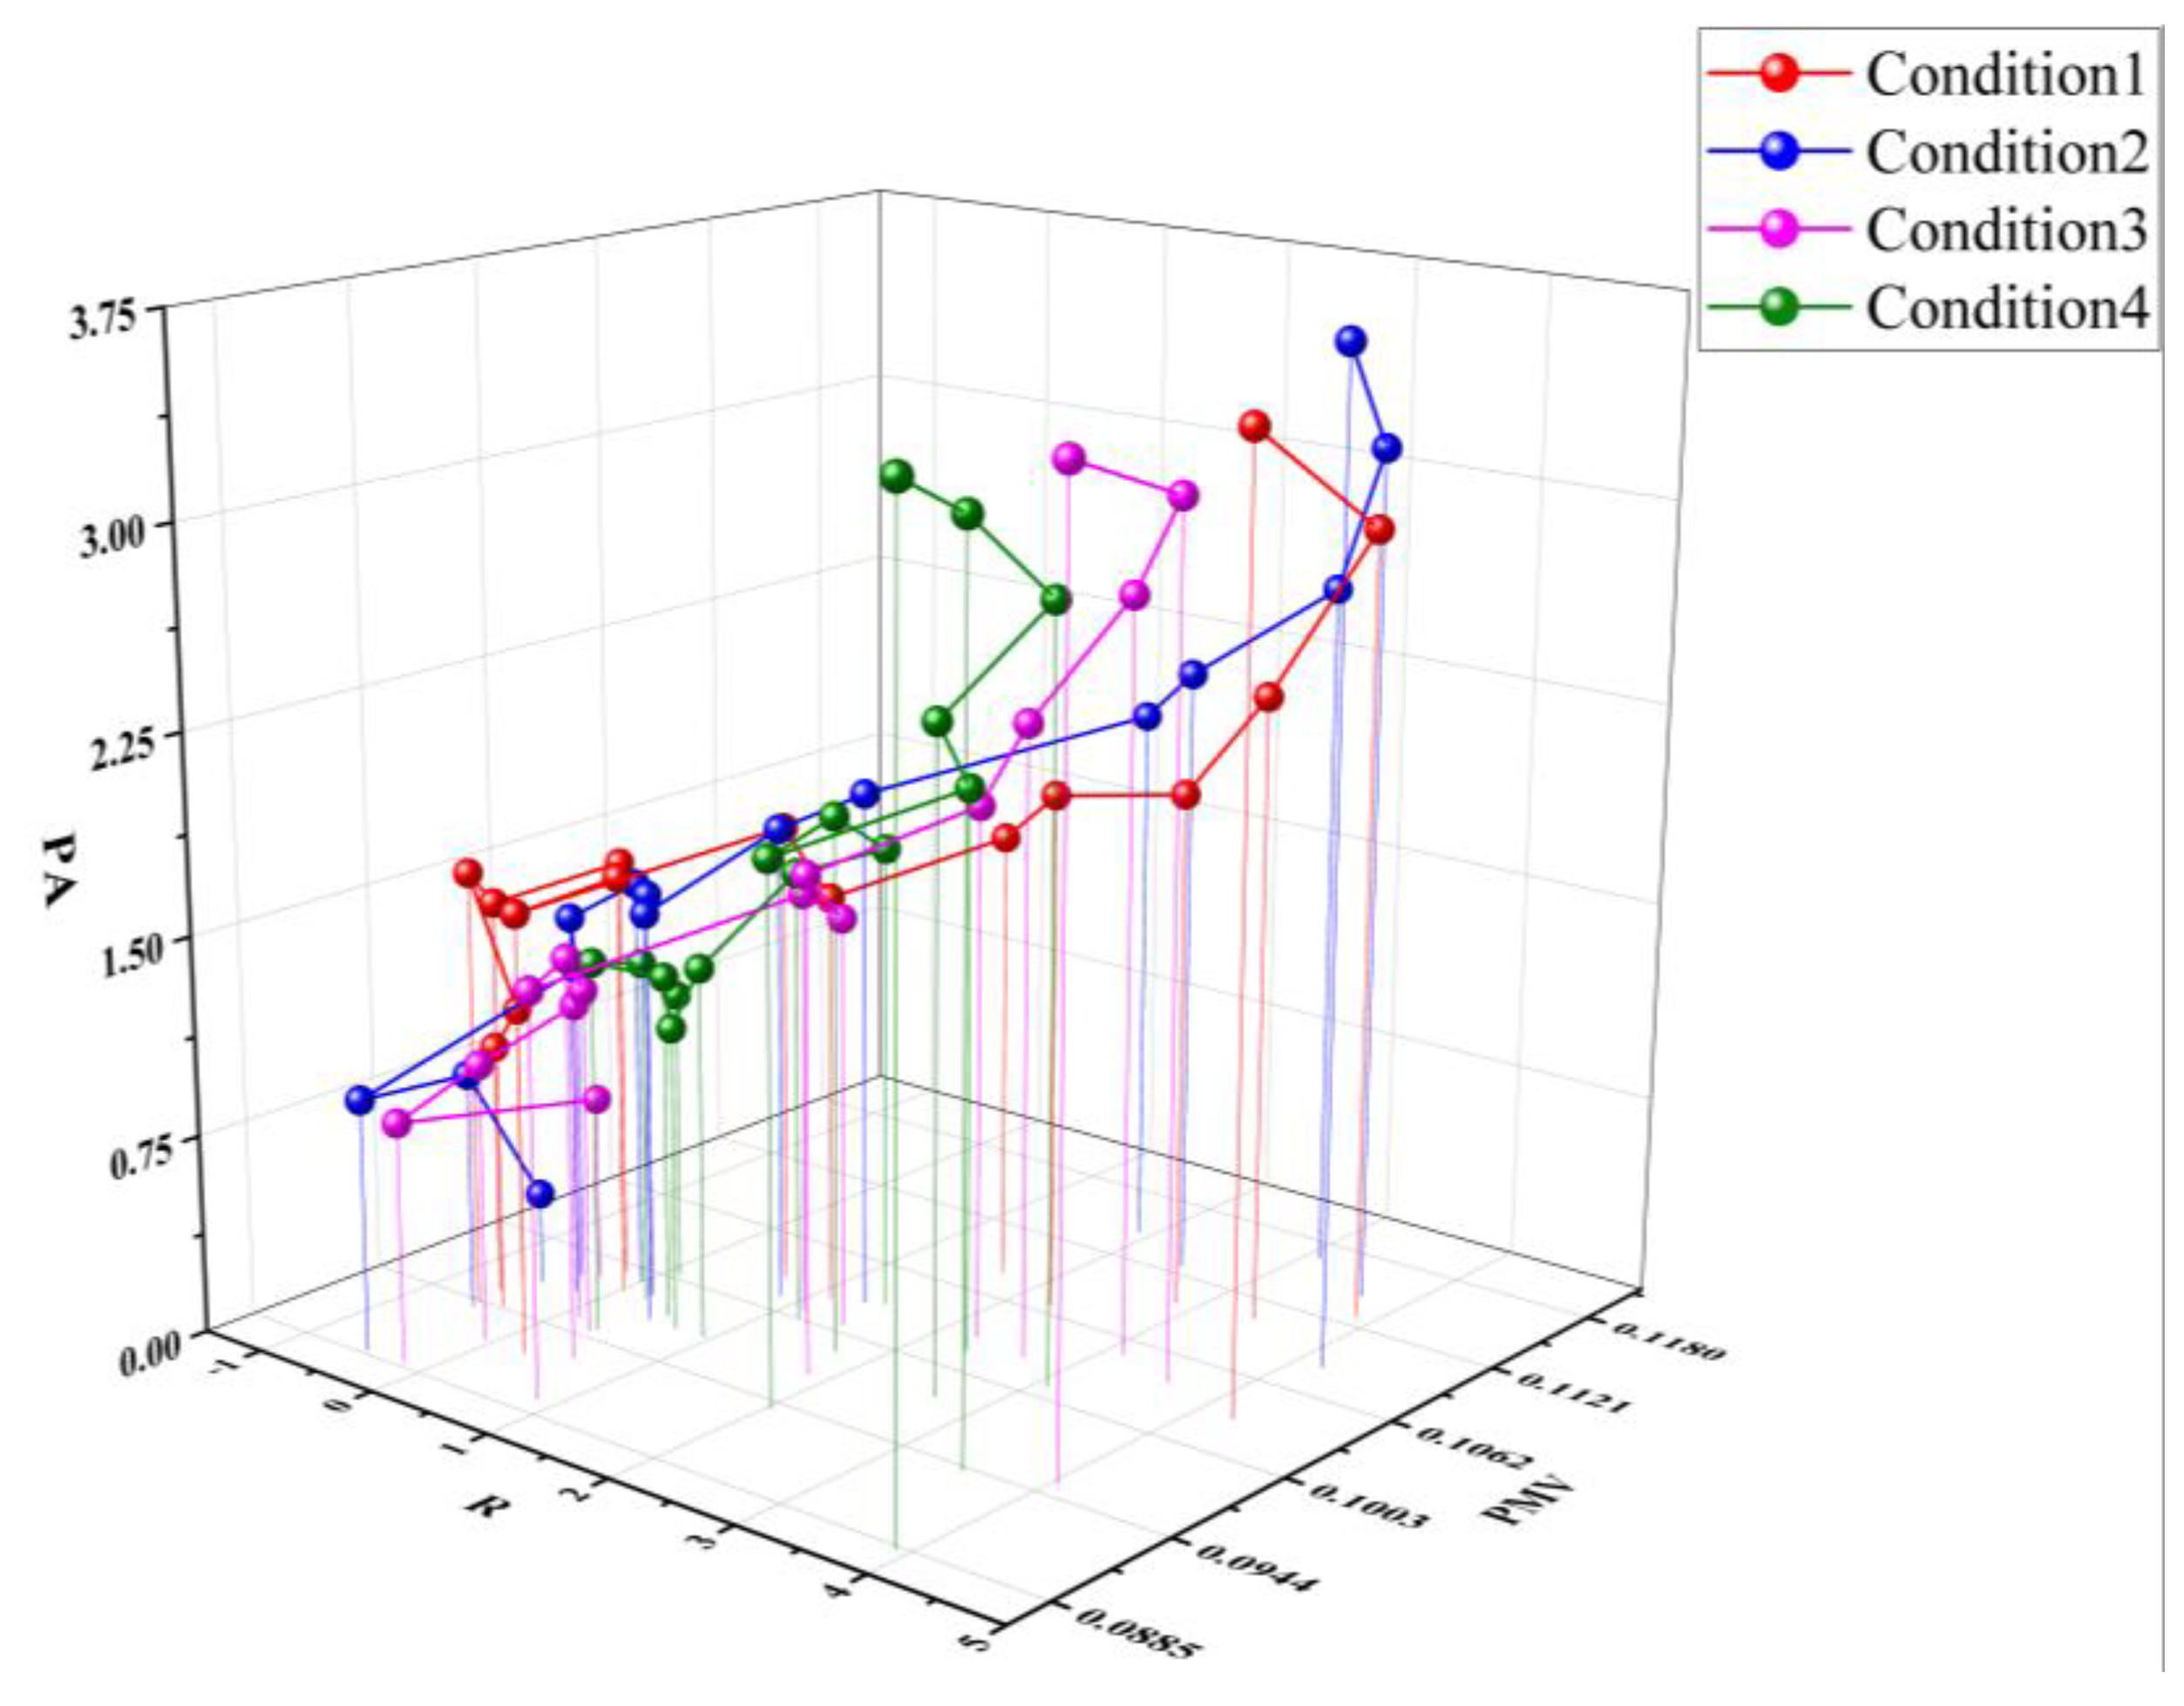
According to the analysis of the data in
Table 10, the objective acoustic parameter R and the value of the thermal environment parameter PMV have the most significant correlation with the subjective annoyance level PA. Thus, the three-dimensional relationship model of PA, R and PMV was constructed, as shown in
Figure 15. The results show that PMV is the core factor influencing PA, and the two are significantly negatively correlated (r = 0.931), indicating that improving thermal comfort can directly reduce occupant annoyance. Although R is weakly correlated with PA (r = 0.545), its local fluctuations (noise changes in the middle and late stages of the test in
Figure 4) indirectly modulate PA through the acoustic interactions, which is especially significant under high temperature and high PMV conditions. In addition, the high correlation (|r| > 0.8) between physiological parameters (PNS/SNS index, skin temperature) and PA suggests that the thermal environment modulates subjective perception through autonomic nervous system activity (e.g., heart rate variability) and body surface thermoregulation (e.g., skin temperature), and the interaction effect between time and working conditions (
p = 0.003) further validates the mechanism of thermal–acoustic environmental synergy in modulating annoyance levels. In conclusion, the optimization of the thermal environment in the cockpit is the primary strategy to reduce annoyance, while the control of the acoustic environment needs to be implemented synergistically with the improvement of thermal comfort to fully optimize the overall occupant comfort.
The 3D relationship model of PA, R and PMV in
Figure 15 provides a quantitative tool for optimizing the acoustic and thermal environment of the cab. The core application values of the aforementioned institution are as follows:
(1) Rapid prediction: the monitoring of the PMV value and noise roughness R in the cabin in real time enables direct input into the model to calculate the comprehensive annoyance degree PA, thus obviating the need for repeated physiological experiments and subjective evaluations, and consequently reducing experimental costs.
(2) Dynamic control: the model has been integrated into the intelligent control system of parking air conditioning, which is able to dynamically adjust the cooling intensity and fan speed based on the current PA prediction. For instance, when PMV > 0.5 (thermal discomfort) and R > 0.6 (significant roughness noise), priority is given to improving the cooling efficiency to reduce PMV; when PMV < 0.3 (close to thermal neutrality) and R > 0.8, the active noise reduction mode is activated to optimize the acoustic environment.
(3) Design optimization: in the cab design stage, the combination of different materials’ sound insulation performance (affecting R-value) and air-conditioning layout (affecting PMV) can be simulated through the model, so as to quickly screen the optimal configuration that makes PA < 1.0 (below mild annoyance), and to avoid repeated modifications of the prototype.
6. Discussion and Outlook
A comparative analysis with the latest results in related fields in recent years is carried out in two dimensions, namely the multimodal data fusion method and model performance. These reflect the innovation of this research method and the superiority of the model, as demonstrated in
Table 12 and
Table 13.
The sample selection for this paper comprised 20 male young adults, and gender-related differences in skin thermoregulation (e.g., lower basal metabolic rate in females), patterns of heart rate variability (e.g., higher parasympathetic activity in females under heat stress), and differences in subjective annoyance thresholds may have led to variations in the predictive performance of the model in other populations. Furthermore, factors associated with age (e.g., diminished thermal regulation in elderly individuals) were not incorporated and may also influence the extrapolation of conclusions. It is evident that further research is required to substantiate the efficacy of gender balance and age diversity. Further research should encompass the following:
The extension of the test to female drivers and middle-aged and older age groups.
The evaluation of the model’s resilience to a sex/age-specific physiological baseline.
The incorporation of demographic characteristics (e.g., BMI, metabolic rate) as auxiliary predictor variables.
The undertaking of long-term annoyance prediction studies.
It should be noted that the current model remains a valuable engineering guide for the primary target group, which is male drivers.
7. Conclusions
The impact of varying acoustic and thermal environments on human physiological parameters and subjective annoyance when environmental changes in the cabin were examined. Environmental and physiological parameters were employed as predictive variables, and a random forest (RF) algorithm was utilized to develop a prediction model for occupant annoyance. The principal findings are as follows:
(1) In terms of physiological parameters, the heart rate variability (HRV) index and the temperature sensation (Ts) exhibited significant changes in accordance with the thermal environment. Meanwhile, the physiological parameters were influenced by the acoustic objective parameters, particularly the frequency (F) and the ratio (R). The acoustic and thermal environment parameters in the cockpit underwent dynamic changes, and with the operation of the air conditioning, the subjects’ parasympathetic nervous system (PNS) vitality increased, while their sympathetic nervous system (SNS) vitality decreased. Concurrently, the Ts decreased, and the body returned to its normal state.
(2) There was an interaction effect between thermal and noise environments on subjective annoyance. However, the subjects’ subjective annoyance was more sensitive to the thermal environment than to the noise environment. Concurrently, there is a robust correlation between physiological parameters and subjective annoyance, which can reflect the comprehensive annoyance experienced by the human body.
(3) By utilizing PMV, roughness, PNS, SNS, and Ts as predictor variables, it is possible to estimate the degree of comprehensive annoyance experienced by subjects with greater accuracy. This estimation method can inform the design of noise reduction programmes for parking air conditioners and the development of driver-focused indoor environmental control strategies.
Author Contributions
Conceptualization, L.H., Y.W. and C.Y.; methodology, L.H., Y.Q. and C.Y.; software, C.Y. and Y.Q.; validation, Y.Q., L.H., B.W. and H.W.; formal analysis, Y.Q., L.H. and C.Y.; investigation, C.Y., B.R. and R.T.; resources, L.H., C.Y. and H.W.; data curation, L.H. and C.Y.; writing—original draft preparation, Y.W., Y.Q. and C.Y.; writing—review and editing, Y.Q., L.H., B.W. and C.Y.; visualization, Y.W.; supervision, H.W. and R.T.; project administration, B.R.; funding acquisition, B.W. All authors have read and agreed to the published version of the manuscript.
Funding
This research was funded through the National Natural Science Foundation of China (NSFC), Project “Three-dimensional isogeometric sound field and noise identification and visualization for inspection of vehicle bodies” [Grant No. 52375260].
Data Availability Statement
The data used to support the findings of this study are available from the corresponding author upon request.
Conflicts of Interest
Author Yeqing Wan and Ruili Tian were employed by the company SCIVIC ENGINEERING CORPORATION. Author Chenglin Yu was employed by the company China Automotive Engineering Research Institute Co. Author Bing ruan was employed by the company AUTOMOTIVE ENGINEERING CORPORATION. The remaining authors declare that the re-search was conducted in the absence of any commercial or financial relationships that could be construed as a potential conflict of interest.
References
- Guan, H.Y. Study on Combined Interaction Rules of Acoustic, Light and Thermal Environment on Human Comfort Based on Electroencephalogram. Ph.D. Thesis, Qingdao University of Technology, Shandong, China, 2020. [Google Scholar]
- Bähr, S.; Edel, F. The effect of colored light in the vehicle interior on the thermal comfort and thermal responses of vehicle occupants. In Proceedings of the International Conference on Human Factors in Transportation 2023, San Francisco, CA, USA, 20–24 July 2023. [Google Scholar]
- Yang, W.; Moon, H.J.; Kim, M.J. Combined effects of short-term noise exposure and hygrothermal conditions on indoor environmental perceptions. Indoor Built Environ. 2018, 27, 1119–1133. [Google Scholar] [CrossRef]
- Zhang, L. Study on The Effects of Thermal and Acoustic on Human Comfort. Ph.D. Thesis, Qingdao University of Technology, Shandong, China, 2016. [Google Scholar]
- Tsai, K.T.; Lin, Y.H. Identification of urban park activity intensity at different thermal environments and visible sky by using sound levels. Int. J. Biometeorol. 2018, 62, 1987–1994. [Google Scholar] [CrossRef] [PubMed]
- Geng, Y.; Hong, B.; Du, M.; Yuan, T.; Wang, Y. Combined effects of visual-acoustic-thermal comfort in campus open spaces: A pilot study in China’s cold region. Build. Environ. 2022, 209, 108658. [Google Scholar] [CrossRef]
- Tiller, D.; Wang, L.M.; Musser, A.; Radik, M. Combined effects of noise and temperature on human comfort and performance. ASHRAE Trans. 2010, 116, 522–540. [Google Scholar]
- Gao, Y.; Li, J.; Liu, W.; Li, J. Prediction of the combustion instability based on the thermos-acoustic decoupling method. J. Exp. Fluid Mech. 2022, 36, 11–18. [Google Scholar]
- Rui, J.; Lifei, G.; Chuanchuan, W.; Hao, G.; Xinfeng, L. Research on the characteristics of lossy objects in a reverberation chamber. Intense Laser Part. Beam 2022, 34, 113003-1–113003-6. [Google Scholar]
- Choi, J.H.; Loftness, V.; Lee, D.W. Investigation of the possibility of the use of heart rate as a human factor for thermal sensation models. Build. Environ. 2012, 50, 165–175. [Google Scholar] [CrossRef]
- Chaudhuri, T.; Zhai, D.; Soh, Y.C.; Li, H.; Xie, L. Random forest based thermal comfort prediction from gender-specific physiological parameters using wearable sensing technology. Energy Build. 2018, 166, 391–406. [Google Scholar] [CrossRef]
- Nkurikiyeyezu, K.N.; Suzuki, Y.; Lopez, G.F. Heart rate variability as a predictive biomarker of thermal comfort. J. Ambient Intell. Humaniz. Comput. 2018, 9, 1465–1477. [Google Scholar] [CrossRef]
- Chen, S.L. Emotion Recognition Based on Peripheral Physiological Signals. Ph.D. Thesis, Zhejiang University, Zhejiang, China, 2022. [Google Scholar]
- Zhai, Y.; Wang, X.; Niu, H.; Wang, X. Effects of Vehicle Cockpit Temperature on Driver Cognitive Abilities. J. Refrig. 2023, 44, 96–105. [Google Scholar]
- China Logistics & Purchasing. Truck Driver Employment Survey Report 2021; China Logistics & Purchasing: Beijing, China, 2022. [Google Scholar]
- World Medical Association. World Medical Association Declaration of Helsinki: Ethical principles for medical research involving human participants. JAMA 2025, 333, 71–74. [Google Scholar] [CrossRef] [PubMed]
- Guan, H.; Hu, S.; Liu, G.; Zhang, L. The combined effects of temperature and noise on the comfort perceptions of young people with a normal Body Mass Index. Sustain. Cities Soc. 2019, 54, 101993. [Google Scholar] [CrossRef]
- Wu, Q.; Liu, J.; Zhang, L. Cooling Characteristics of Car Cockpit Based on Thermal Evaluation Models. J. Refrigeration. 2020, 41, 118–126. [Google Scholar]
- Tarvainen, M.P.; Niskanen, J.P.; Lipponen, J.A.; Ranta-Aho, P.O.; Karjalainen, P.A. Kubios HRV–heart rate variability analysis software. Comput. Methods Programs Biomed. 2014, 113, 210–220. [Google Scholar] [CrossRef] [PubMed]
- Fanger, P.O. Thermal comfort: Analysis and applications in environmental engineering. In Thermal Comfort Analysis & Applications in Environmental Engineering; Danish Technical Press: København, Denmark, 1972. [Google Scholar]
- Cutler, A.; Cutler, D.R.; Stevens, J.R. Random forests. In Ensemble Machine Learning: Methods and Applications; Springer: New York, NY, USA, 2012; pp. 157–175. [Google Scholar]
- Zhang, Q.; Wei, Y.; Han, Z.; Fu, H.; Peng, X.; Deng, C.; Hu, Q.; Xu, C.; Wen, J.; Hu, D.; et al. Multimodal fusion on low-quality data: A comprehensive survey. arXiv 2024, arXiv:2404.18947. [Google Scholar]
Figure 1.
Simulated cabin and sensor position diagram.
Figure 1.
Simulated cabin and sensor position diagram.
Figure 2.
A subject during experiment.
Figure 2.
A subject during experiment.
Figure 3.
Schematic diagram of the acoustic sensor measurement point location.
Figure 3.
Schematic diagram of the acoustic sensor measurement point location.
Figure 4.
Schematic diagram of the location of the measurement points for thermal environment parameters.
Figure 4.
Schematic diagram of the location of the measurement points for thermal environment parameters.
Figure 5.
Schematic diagram of skin temperature measurement points.
Figure 5.
Schematic diagram of skin temperature measurement points.
Figure 6.
Electrode position.
Figure 6.
Electrode position.
Figure 7.
Experimental design diagram.
Figure 7.
Experimental design diagram.
Figure 8.
Environmental parameter change.
Figure 8.
Environmental parameter change.
Figure 11.
Skin temperature.
Figure 11.
Skin temperature.
Figure 12.
Correlation heat map.
Figure 12.
Correlation heat map.
Figure 13.
Average annoyance.
Figure 13.
Average annoyance.
Figure 14.
Relative importance of predictors.
Figure 14.
Relative importance of predictors.
Figure 15.
Subjective annoyance level.
Figure 15.
Subjective annoyance level.
Table 1.
Anthropometric information about the subjects.
Table 1.
Anthropometric information about the subjects.
| Age (years) | Height (cm) | Weight (kg) | BMI 0 | BSA 1 (m2) |
|---|
| 24.5 (±1.8) | 175.5 (±4.5) | (67.5 ± 7.6) | 21.8 (±2.1) | 1.8 (±0.1) |
Table 2.
Information regarding instrumentation.
Table 2.
Information regarding instrumentation.
| Parameter | Instrument | Description |
|---|
| Environmental measurements | | |
| Air temperature | GX18B20H | Accuracy: ±0.1 °C
Range: −55 °C~+125 °C |
| Relative humidity | DHT22 | Accuracy: ±2% RH
Range: 0~100% RH |
| Air velocity | RS-FSJT05 | Accuracy: ±(0.2 + 0.03 V) m/s
Range: 0~70 m/s |
| Acoustic sensor | GRAS 46AE | Freq range: 3.15 Hz~20 kHz
Dyn range: 17~138 dB |
| Physiological measurements | | |
| Skin temperature | AS6221 | Accuracy: ±0.09 °C
Range: 0~125 °C |
| Electrocardiograph | DiCare-m1CC | AD conversion accuracy: 24 bit
Input bandwidth: 0.05 Hz~150 Hz |
Table 3.
Personal annoyance scale.
Table 3.
Personal annoyance scale.
| Poles | Degrees | Wording of Degrees |
|---|
| Annoyance-free | 0 | Not annoying |
| Annoyance | 1 | Slightly annoying |
| 2 | Annoying |
| 3 | Very annoying |
| 4 | Unbearable |
Table 4.
Dressing thermal resistance.
Table 4.
Dressing thermal resistance.
| Garment Description | Iclo, clo |
|---|
| Sample Man’s Ensemble | |
| Men’s briefs | 0.04 |
| Ankle-length athletic socks | 0.02 |
| Shoes | 0.02 |
| Straight trousers (thin) | 0.15 |
| Short-sleeved dress shirt | 0.19 |
| Car seat | 0.15 |
| Total | 0.57 |
Table 5.
Commonly used HRV indicators.
Table 5.
Commonly used HRV indicators.
| Title | Descriptions |
|---|
| PNS index | Parasympathetic nervous system index |
| SNS index | Sympathetic nervous system index |
| Stress Index | stress level |
| Mean RR (ms) | Average RR interval |
| RMSSD (ms) | Root Mean Square of RR Interval Differences |
| SD1 (ms) | In a Poincaré diagram, the standard deviation along the short axis of the ellipse |
| SD2 (ms) | In the Poincaré diagram, the standard deviation along the long axis of the ellipse |
| SD2/SD1 | Ratio of SD2 to SD1 |
Table 6.
Comparison of correlation methods (PMV vs. annoyance).
Table 6.
Comparison of correlation methods (PMV vs. annoyance).
| Methodology | Correlation Coefficient | p-Value |
|---|
| Pearson | 0.931 | <0.01 |
| Spearman | 0.918 | <0.01 |
| Kendall | 0.802 | <0.01 |
Table 7.
Results of repeated-measure ANOVA on HRV index.
Table 7.
Results of repeated-measure ANOVA on HRV index.
| | Time | Working | Time and Working |
|---|
| | F | p | F | p | F | p |
|---|
| PNS index | 20.92 | <0.001 | 0.068 | 0.977 | 0.693 | 0.920 |
| SNS index | 0.068 | <0.001 | 0.392 | 0.759 | 0.448 | 0.999 |
| MeanRR | 19.02 | <0.001 | 0.046 | 0.987 | 0.655 | 0.947 |
| RMSSD | 9.864 | <0.001 | 0.089 | 0.966 | 0.948 | 0.567 |
| stress index | 5.084 | <0.001 | 0.822 | 0.486 | 0.513 | 0.994 |
| SD1 | 9.892 | <0.001 | 0.089 | 0.966 | 0.947 | 0.569 |
| SD2 | 4.022 | <0.001 | 0.645 | 0.589 | 0.618 | 0.967 |
Table 8.
Result of repeated-measure ANOVA on subjective vote.
Table 8.
Result of repeated-measure ANOVA on subjective vote.
| Source | F | p |
|---|
| Time | 214.498 | <0.001 |
| Operational | 1.304 | 0.279 |
| Time and Operational | 1.863 | 0.003 |
Table 9.
The mean of the correlations between subjective evaluations.
Table 9.
The mean of the correlations between subjective evaluations.
| No. | Spearman’s
Coefficient | No. | Spearman’s
Coefficient |
|---|
| 1 | 0.712 | 11 | 0.726 |
| 2 | 0.728 | 12 | 0.747 |
| 3 | 0.730 | 13 | 0.777 |
| 4 | 0.748 | 14 | 0.690 |
| 5 | 0.745 | 15 | 0.714 |
| 6 | 0.685 | 16 | 0.775 |
| 7 | 0.708 | 17 | 0.749 |
| 8 | 0.754 | 18 | 0.805 |
| 9 | 0.705 | 19 | 0.600 |
| 10 | 0.678 | 20 | 0.701 |
Table 10.
Correlation coefficient between objective parameters and subjective annoyance degree.
Table 10.
Correlation coefficient between objective parameters and subjective annoyance degree.
| Parameters | Spearman’s
Coefficient | Parameters | Spearman’s
Coefficient |
|---|
| PMV | 0.931 ** | F | −0.231 |
| A | 0.078 | PNS | −0.864 ** |
| L | 0.104 | SNS | 0.875 ** |
| S | 0.030 | Ts | 0.910 ** |
| R | 0.545 ** | | |
Table 11.
Cross-validation of prediction model accuracy.
Table 11.
Cross-validation of prediction model accuracy.
| No. | R2 | MAE | RMSE |
|---|
| 1 | 0.920 | 0.269 | 0.339 |
| 2 | 0.936 | 0.222 | 0.290 |
| 3 | 0.951 | 0.161 | 0.191 |
| 4 | 0.948 | 0.201 | 0.263 |
| 5 | 0.910 | 0.272 | 0.339 |
| 6 | 0.947 | 0.177 | 0.258 |
| 7 | 0.974 | 0.149 | 0.199 |
| 8 | 0.958 | 0.161 | 0.216 |
| 9 | 0.939 | 0.225 | 0.306 |
| 10 | 0.925 | 0.168 | 0.188 |
| average | 0.941 | 0.201 | 0.259 |
Table 12.
Comparison of multimodal data fusion methods.
Table 12.
Comparison of multimodal data fusion methods.
| Dimension | This Study | Other Recent Results |
|---|
| Integration strategy | Feature-level fusion (PMV, roughness R, HRV metrics, skin temperature) was used in conjunction with a random forest algorithm to achieve non-linear relationship modelling. | MoPE model (2024): cross-modal alignment via Mixture of Prompt Experts (MOPE), relies on optimization of pre-trained large model parameters.
Low-quality data fusion review [22] (2024): emphasizes weighted fusion with joint variational methods, but does not integrate physiological signals. |
| Data quality processing | Tukey’s criterion is introduced to exclude outliers and Z-score normalization to handle heterogeneous data from multiple sources. | Dynamic multimodal fusion (2024): relies on data complementation or noise robust regularization, high computational complexity.
Traditional PMV model: relies only on environmental parameters, does not deal with physiological signal noise. |
| Parametric efficiency | The Random Forest model requires only 0.8% trainable parameters (compared to the fine-tuned model) and is suitable for small sample scenarios. | MoPE model: requires 0.8% of parameters but relies on pre-trained base model, high training costs.
SSA-GA-BP neural network (2024): requires large amount of data for training, limited generalizability. |
Table 13.
Model Performance Comparison.
Table 13.
Model Performance Comparison.
| Model | Predictive Accuracy (R2) | Key Innovations |
|---|
| Random Forest | 0.941 | Fusion of PMV, noise roughness R, and HRV metrics to dynamically quantify thermal–acoustic interaction effects. |
| Thermoacoustic comfort model | 0.85–0.90 | Evaluation models are constructed based on the Thermal Climate Index (UTCI) and equivalent sound levels for plaza environments. |
| PMV-PPD model | 0.75–0.88 | Classical thermal comfort evaluation methods, widely used in passenger compartment simulation. |
| SSA-GA-BP neural network | 0.92 | Sparrow search algorithm optimizes BP neural networks to improve prediction stability in noisy environments. |
| Disclaimer/Publisher’s Note: The statements, opinions and data contained in all publications are solely those of the individual author(s) and contributor(s) and not of MDPI and/or the editor(s). MDPI and/or the editor(s) disclaim responsibility for any injury to people or property resulting from any ideas, methods, instructions or products referred to in the content. |
© 2025 by the authors. Licensee MDPI, Basel, Switzerland. This article is an open access article distributed under the terms and conditions of the Creative Commons Attribution (CC BY) license (https://creativecommons.org/licenses/by/4.0/).


 ,
, 


