1. Introduction
Vehicular ad hoc networks (VANETs) involve providing communication and exchange of information among vehicles, infrastructure, and other road users by integrating them into a network. These communication capabilities have contributed to various advancements, such as intelligent transportation systems and autonomous driving. VANETs enable efficient traffic management, offering safety and comfort to the vehicle and road users. VANETs can also support the dissemination of information about emergency events. In VANET architecture, the roadside infrastructure typically comprises roadside units (RSUs) deployed at specific points alongside the roads. The vehicles communicate with each other and with the infrastructure using an on-board unit (OBU) installed in the vehicle [
1,
2]. The vehicles connected to the network periodically transmit basic safety messages, also called beacon messages. These beacon messages contain information on real-time parameters of vehicles, such as speed, location, acceleration, etc. The vehicles also transmit event-based messages about specific events, such as road congestion or crashes [
3].
There can be potential malicious vehicles in VANETs that broadcast false information to create impressions of a fake event or road congestion for their selfish benefits. A malicious vehicle may broadcast false information individually, or there may be collusion among attackers, where they collectively launch a false information attack to increase the credibility of the attack [
4]. The security of VANETs from the malicious activities of these nodes is vital considering the possible effects on public safety. However, ensuring the security of VANETs faces challenges arising from the wireless communication involved and the distinctive features of these networks, such as high mobility, intermittent connectivity, changing topology, difficulty in trust evaluation, validation of information shared by the nodes, etc. [
5,
6]. Despite these challenges, securing VANETs from false information attacks is essential as such attacks may lead to hazardous consequences due to the actions of vehicles in response to receiving false information [
4].
The existing techniques in the literature for detecting false information attacks in VANETs use various approaches such as machine learning, blockchain, trust scores, statistical methods, etc. These techniques are computationally expensive, leading to high processing delays, or they depend on roadside infrastructures or coordination among vehicles. However, intermittent connectivity in VANETs may impact the accurate and timely detection of attacks in a coordinated environment due to the loss of connectivity or messages between the coordinating vehicles. Some techniques (discussed in
Section 2) use historical information about vehicles in the detection process. Some other techniques (discussed in
Section 2) use artificial data to train machine learning or statistical models used in the detection. It is not always feasible to have historical information about vehicles, as in the highly dynamic scenario of VANETs new vehicles may join the network on the fly. Moreover, the use of historical data leads to higher processing delays. Similarly, if artificially generated data do not correspond to the real scenario where a technique needs to work, the detection accuracy can be reduced.
The RSU-based Online Intrusion Detection and Mitigation (RSUOIDM) technique proposed in [
7] uses historical data in the communication range of RSUs to train a non-parametric anomaly detection model. The RSUs use their trained models to detect false information in newly received information by comparing it with the detection model and computing an anomaly score. The reliance on historical data incurs an initialization delay for the technique. Moreover, if the traffic pattern changes in the communication range of an RSU from the time when the historical data were collected to the time of evaluation, the detection accuracy of this method is reduced. An unsupervised machine learning-based approach is adopted in [
8] that uses data clustering for false information detection. In this Data Clustering-based False Information Detection (DCFID) technique, the vehicles are clustered into two distinct groups, benign and malicious, based on the similarities in the information transmitted in the beacon messages from the vehicles. This technique offers high detection accuracy. However, it works under the strict assumption that all the malicious vehicles transmit the same false information in their beacon messages; though in real scenarios there may be more than one group of malicious nodes, each group transmitting different false information.
To address the limitations of the existing approaches, we propose a false information attack detection technique using an unsupervised anomaly detection approach. Specifically, we use the distance-based anomaly detection technique in our framework to detect false information based on the real-time characteristics of the network. The proposed technique can be used independently by a vehicle without relying on roadside infrastructure or other vehicles to detect false information broadcast by other vehicles in its communication range. We use an approximation technique in the anomaly detection process and avoid multiple scans over the data to reduce the processing delay. The proposed technique enables fast and accurate detection of false information attacks and offers 30% lower data processing delay and a 17% lower false positive rate compared to the state-of-the-art techniques [
7,
8], as validated by the performance evaluation results.
The novelty of the proposed technique comes from the detection of false information attacks based on only real-time characteristics of the network, without depending on either historical or artificial data, or coordination among vehicles. The motivations for the proposed technique are to achieve high detection accuracy and a low data processing delay in false information detection at a high proportion of malicious nodes. The performance of the proposed technique is evaluated using the SUMO and OMNET++ simulators considering up to 40% of malicious nodes in the network. The results show that the proposed technique meets our objectives, offering 30% lower data processing delay and a 17% lower false positive rate in scenarios with high proportions of malicious nodes.
The following are the contributions of this paper:
We propose a technique for detecting false information attacks in VANETs using distance-based anomaly detection.
We optimize the detection process using approximations in anomaly detection and avoiding multiple scans over the data to reduce data processing delays. We design an algorithm for this approximation using data binning.
We perform extensive simulations to evaluate the performance of the proposed technique in urban and highway scenarios.
The rest of this paper is organized as follows:
Section 2 discusses the recent related work in false information detection in VANETs;
Section 3 explains the details of the proposed technique;
Section 4 discusses the performance evaluation results; and
Section 5 provides directions for future work and conclusions.
2. Related Work
In this section, we provide a summary of some recent approaches for detecting false information attacks in VANETs.
The method proposed in [
2] constructs a time series of vehicular traffic parameters and employs a long short-term memory (LSTM) classifier to differentiate between genuine and false events. While this approach achieves high accuracy, it depends on training the classifier with pre-generated synthetic data, which may not be applicable in all contexts. For instance, a model trained with data corresponding to a downtown or urban scenario is not suitable for evaluating vehicles in highway scenarios. Another machine learning-based approach, proposed in [
9], leverages vehicle features derived from signal properties, such as received signal strength and signal direction, combined with contextual information features. To extract contextual patterns for each vehicle, a Kalman filter algorithm is employed. The innovation errors, i.e., the differences between observed and predicted values, generated by the Kalman filter are then used to train an artificial neural network classifier for detecting false messages. Although the experimental results demonstrate high accuracy, the technique relies on training the classifier with synthetic data, which limits its adaptability to real-time scenarios.
The method presented in [
10] utilizes the OBUs of vehicles to establish a fog layer, managed by a centralized guard node, which evaluates vehicle speeds reported in beacon messages using a statistical technique. If a node’s reported speed deviates significantly from those of other nodes in the area, the guard node flags it as malicious. While this approach achieves low latency and high accuracy, its reliance on a centralized guard node introduces a vulnerability to a single point of failure. Another fog computing-based statistical approach for false information detection is proposed in [
11], which involves dynamically forming a fog layer with vehicles parked along roads. Each fog node collects data from beacon messages sent by nearby moving vehicles. The nodes then compute the average vehicle speed and apply a statistical test to identify malicious nodes in parallel. While this method achieves high detection accuracy in small-scale scenarios, its accuracy diminishes as the number of vehicles increases. Another statistical method, proposed in [
12], introduces a trust management framework that leverages context information derived from messages received from vehicles. This framework employs a statistical approach for anomaly detection to identify false information. While it achieves high detection accuracy in small networks, its scalability is limited, as it becomes computationally expensive in larger networks.
The Blockchain Assisted Misbehavior Detection and Event (BLAME) validation framework, proposed in [
13], validates traffic events to identify malicious vehicles utilizing neighbor information and event reports from individual vehicles, which are sent to RSUs. In this system, a blockchain network is implemented among the RSUs, where vehicle data are appended as blocks by a miner RSU after achieving consensus with other RSUs. A blockchain-enabled trust management model for VANETs, incorporating a threshold ring signature scheme, is presented in [
14]. This scheme allows vehicles to anonymously verify the authenticity and reliability of messages while preserving their privacy. The model leverages blockchain to enable RSUs to prevent false information attacks and ensure the trustworthiness of transmitted messages. The work in [
15] presents a blockchain-based scheme for trust management. The trust management model helps to identify false information by evaluating the trustworthiness of vehicles and the data they transmit. When vehicles report incidents to RSUs, the trust model is used to verify the validity of these reports. RSUs collaboratively update and record the trust values of vehicles in the blockchain. A blockchain-based reputation system is proposed in [
16], where vehicles validate events reported by other vehicles to establish reputations for the vehicles. The reputations of the vehicles in this scheme are stored in a blockchain that is maintained by the RSUs. The work in [
17] proposes a reputation evaluation and management model with two parallel blockchains. The vehicles maintain a reputation chain and the RSUs maintain an event chain. This approach uses direct trust and indirect trust established on the historical reputation of vehicles in trust score evaluation. While the blockchain-based approaches discussed in [
13,
14,
15,
16,
17] demonstrate high detection accuracy, they suffer from significant computational overhead and hence they are not scalable to large networks.
The false message detection method proposed in [
18] examines node profiles based on a reward–penalty system. Vehicles are rewarded for sending legitimate messages and penalized for false ones. If the reward-to-penalty ratio for a message sender falls below a defined threshold, the false message detection process is triggered. A message from a node is accepted only after the reward–penalty ratio for the node exceeds the threshold value which results in incorrectly identifying a high proportion of genuine messages to be false. A comparison of the existing techniques discussed above and our proposed technique is presented in
Table 1 below.
Our proposed technique addresses the limitations of the existing approaches, such as reliance on roadside infrastructures or historical or artificial data, for detecting false information attacks in VANETs [
2,
7,
8,
9,
10,
11,
12,
13,
14,
15,
16,
17,
18]. The proposed technique uses distance-based anomaly detection in real-time network data to identify false information without relying on prior vehicle data or synthetic data, resulting in a lower data processing delay and higher accuracy compared to existing approaches.
3. The Proposed Technique
We discuss the details of our proposed false information detection technique in this section. The concept of distance-based anomalies and the attack model considered in this work are introduced first.
Distance-based anomaly: A data point in a dataset is a distance-based anomaly or distance-based outlier [
19] if the point does not have at least
other points within a distance
for user-defined parameters
and
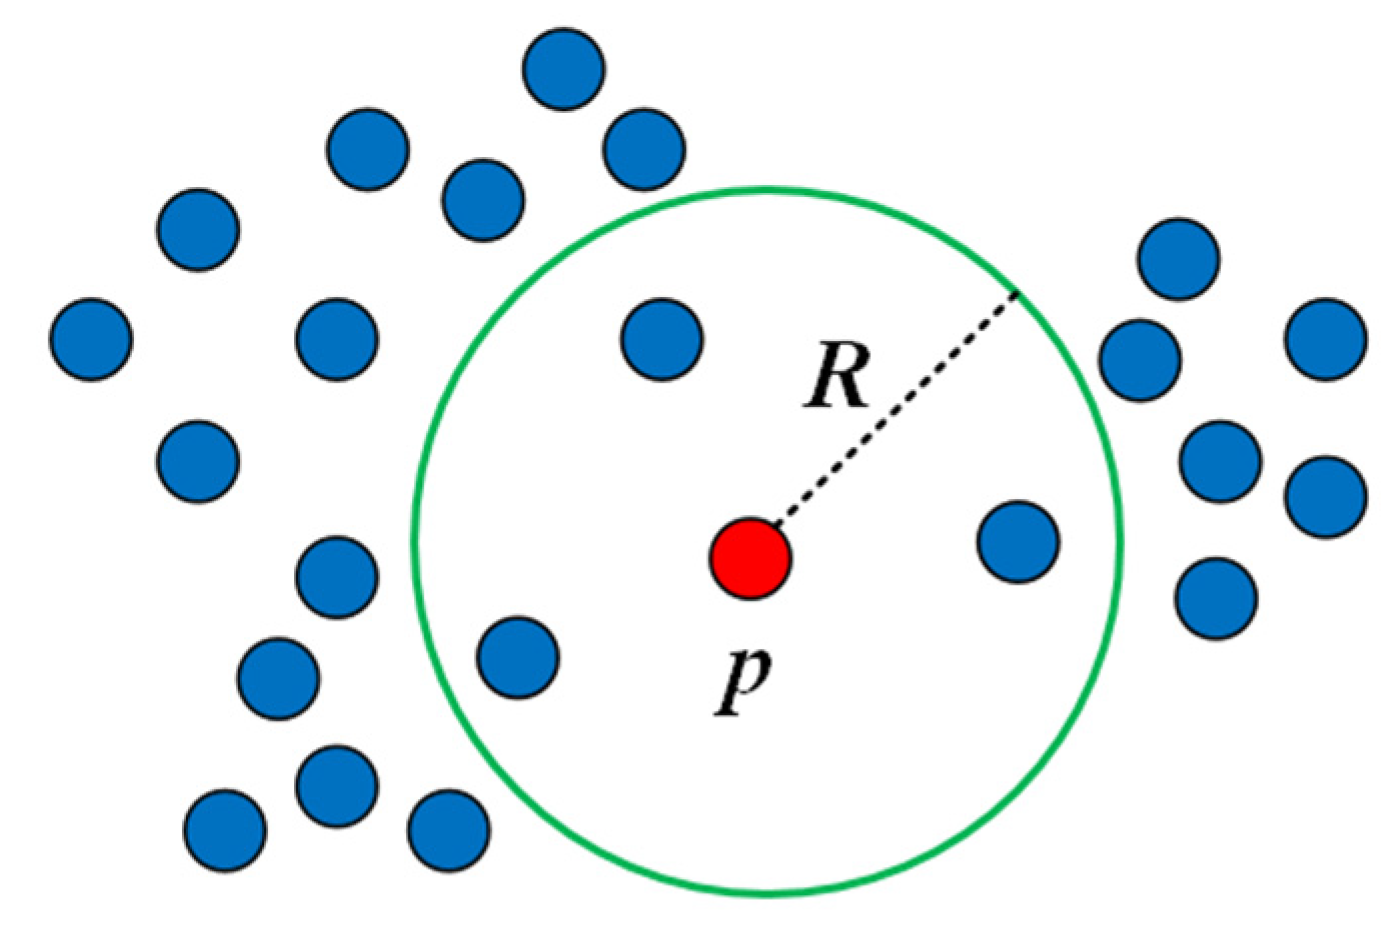
. An example of a distance-based anomaly in two-dimensional space is shown in
Figure 1. In this example, the point
is a distance-based anomaly if the value of the parameter
is specified as 4, i.e.,
. Here,
has only three other points, excluding
itself, within the specified distance
from
, i.e., the region bounded by the green circle with its center at
. As
has less than four (since
) points within the distance
, it is a distance-based anomaly for
. If the value of
is specified to be 3,
would not be a distance-based anomaly for the same distance
as
has three other points excluding itself within the green circle.
Attack model: A malicious node broadcasts a speed value lower than its real speed in the beacon messages [
10] to create the illusion of traffic congestion or an emergency event such as an accident. A vehicle analyzes beacon messages received from all the vehicles in its communication range to detect false information. It is assumed that the majority of vehicles are honest, as considered in the literature [
2,
10].
3.1. Overview of the Proposed Technique
In the proposed false information detection technique, a vehicle evaluates the speed values received from all other vehicles in its communication range to identify the malicious vehicles. A vehicle maintains a node list to store the vehicle
and speed value broadcast by each node. The evaluator vehicle can evaluate the nodes in the node list based on their speed values on demand to detect any potential false information. Vehicles in a region travel at similar speeds as they are in the same traffic conditions and are influenced by the moving patterns of others. Therefore, if a vehicle reports a significantly different speed value compared to the other vehicles in a region, the vehicle is identified to be malicious. An evaluating vehicle uses distance-based anomaly detection to find these substantially different speed values by analyzing the beacon messages received from all the vehicles in its communication range in real time. The two parameters
and
required for distance-based anomaly detection (as discussed in
Figure 1) need to be specified.
Parameter Selection for Anomaly Detection
The assumptions of our framework are as follows: we assume that the majority of vehicles are honest and hence the value for is considered as half the number of nodes in the node list. That is, the speed of an honest vehicle is expected to be similar to at least half of the nodes in the node list. The distance parameter to define the similarity range can be adjusted based on the travel scenario. For example, in a highway scenario, a speed difference of up to 10 km per hour can be considered similar, which results in .
To count the number of points within the specified distance
, referred to as the neighbor count hereafter, an approximation strategy is adopted by using a data binning technique that minimizes the processing delay. The bin information is evaluated in the next phase to detect malicious nodes. The overall approach is shown in
Figure 2. We discuss the data binning and evaluation phases in the next two subsections.
3.2. Data Binning Phase
Distance-based anomaly detection requires computation of all pair-wise distances between the speed values in a node list, which is computationally expensive. To address this issue, the data binning technique is used, which avoids computing all pair-wise distances between the speed values. The binning also benefits the evaluation phase as the binned data are used to collectively evaluate a group of nodes instead of evaluating them one by one.
Each bin contains a node count and a list of nodes belonging to the bin. While scanning each (
,
speed) pair in the node list
, the bins are dynamically created based on the speed values of the nodes. For each node in the list, the bin index
is computed as follows:
Here, (<) is the bin width parameter, which is discussed in the next subsection. After computing the , the corresponding bin is created if it does not already exist and the node count for the bin is initialized to one. If the bin already exists, the node count is increased by one. In either case, the node is added to the list of node s for the bin.
The bin information is used in the evaluation phase to detect the malicious nodes without scanning the node list again. Due to the similarity in the speed values of vehicles in a region, the number of bins created is much smaller compared to the number of nodes in the node list. Therefore, evaluating only the bins reduces the processing time of the evaluation phase, which is discussed in
Section 3.3.
3.3. Evaluation Phase
In the evaluation phase of the proposed technique, an approximation of the neighbor count is made for all the nodes by inspecting the bins. This approximation is made for all the nodes in a bin together, and they are collectively evaluated for maliciousness. If the node count for a bin is at least half of the total number of nodes in the node list, the node
s in that bin are determined as honest, since the speed of all these nodes are within a distance
(as
). Otherwise, the neighbor count is approximated from the adjacent bins. The number of bins,
, for this approximation is a small number to reduce the processing time. Also,
is considered an odd number for simplicity. The value of the bin width parameter
is computed based on
and
from Equation (2), the rationale for which is explained in example 1.
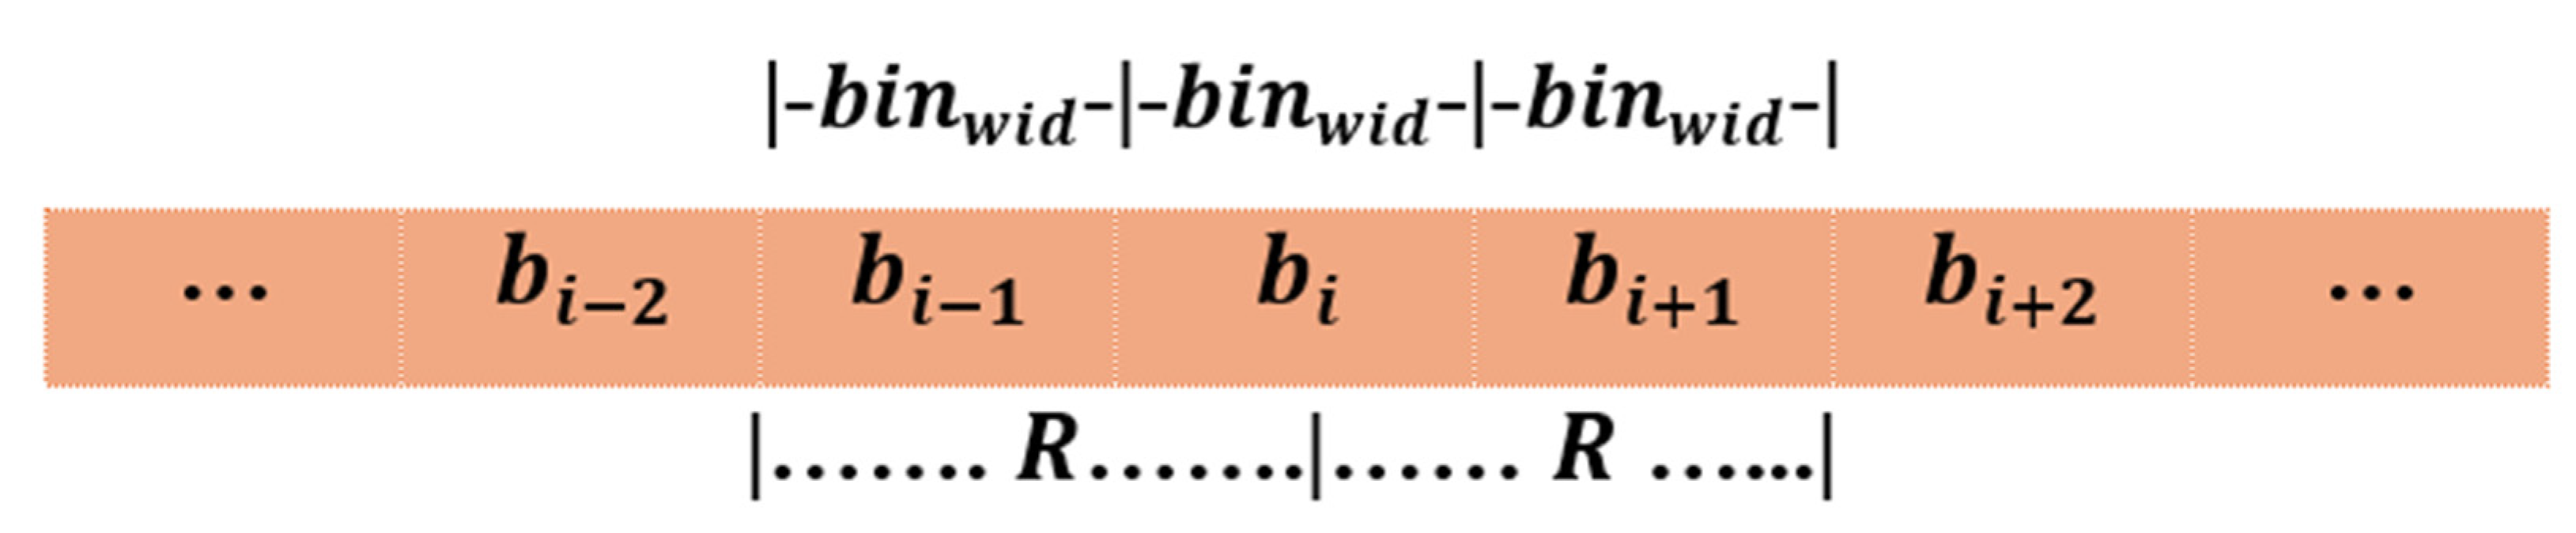
Example 1: Say we want to approximate the neighbor count for the nodes in the
-th bin
in
Figure 3 with three bins. We can estimate the neighbor count with reference to the midpoint of the bin, i.e., the distance
is extended on either side of the midpoint, as shown in the figure, which leads to
. This is generalized as Equation (2). It can be observed that for the bins at both ends, all possible bins may not exist. The same may happen for bins in the middle as the bins are dynamically created based on the observed speed values. If any bin does not exist, the neighbor count is approximated with only the bins that exist within the specified distance. Further, depending on the speed values of the nodes in the node list, the best approximation of the neighbor count may not be obtained by considering an equal number of bins on either side. For instance, the neighbor count for
in
Figure 3 can be obtained by considering one of three possible combinations:
.
The combination of bins that gives the maximum neighbor count is chosen, so that honest nodes are not incorrectly detected as malicious. This does not benefit the malicious nodes as they broadcast significantly different speed values compared to their real speed to create illusions of a fake event. Hence, even after considering the maximum neighbor count, they do not meet the evaluation criteria to have sufficient neighbors to be classified as honest. Moreover, as the number of bins considered for approximating the neighbor count is small, the number of combinations of bins to be evaluated is also small. Further, once a combination satisfies the criteria to be evaluated as honest, i.e., the neighbor count exceeds half the number of nodes in the node list, the remaining combinations of bins need not be evaluated. As such, the evaluation of all combinations of bins does not have a significant impact on the processing time. The overall process of neighbor count approximation for any bin
is outlined in Algorithm 1.
| Algorithm 1: Neighbor Count Approximation Algorithm |
| Input: |
| Output: |
| 1: |
| 2: |
| 3: |
| 4: |
| 5: |
| 6: |
| 7:else |
| 8:
Continue |
| 9: end if |
| 10: end for |
| 11: then |
| 12: |
| 13: end if |
| 14:/2) then |
| 15: Go to step 18 |
| 16: end if |
| 17: end for |
| 18 |
| 19: end |
After approximating the neighbor count, if the count for a bin is less than half the number of nodes in the node list, the node
s belonging to that bin are marked as malicious. All the bins are evaluated in this manner and the detected malicious nodes are added to a malicious node list
, which constitutes the output of the detection algorithm. Our proposed technique can be used to detect collusion among malicious nodes by observing the bins that have a substantial neighbor count but do not meet the requirement to be classified as honest. The overall procedure of the proposed technique is shown in Algorithm 2.
| Algorithm 2: False Information Detection Algorithm |
| Input: |
| Output: |
| 1: using Equation (2) |
| 2: // data binning starts |
| 3: using Equation (1) |
| 4: exists then |
| 5: |
| 6:
else |
| 7: |
| 8: to 1 |
| 9:
end if |
| 10: |
| 11: end for
// data binning ends |
| 12: // evaluation phase starts |
| 13:/2) then |
| 14:
Continue |
| 15: else |
| 16: using Algorithm 1 |
| 17:/2) then |
| 18: Continue |
| 19: else |
| 20: |
| 21: end if |
| 22: end if |
| 23: end for
// evaluation phase ends |
| 24: |
| 25: end |
The binning of the node list data and subsequent evaluation of the binned data enhances the scalability of the proposed technique. It may be noted that the binning of the node list data is carried out by scanning the node list only once. Therefore, even when the number of nodes in the network increases, there is a marginal increase in the processing time of the data binning phase only. Once binning is completed, each bin is collectively evaluated in the evaluation phase. Even when the number of nodes significantly increases, the number of bins does not increase due to the similar speed values of vehicles; only the bin counts for the bins increase. Thereafter, as the nodes in each bin are collectively evaluated in the evaluation, the processing time for the evaluation phase does not increase and maintains the scalability of the proposed technique to larger networks.
3.4. Time Complexity Analysis of Algorithm 2
This subsection analyzes the time complexity of Algorithm 2. The time complexity of the binning phase is , where is the number of nodes in the node list . For the evaluation phase, the worst-case time complexity for computing the neighbor count for the bins using Algorithm 1 is , where is the number of bins. However, as the number of bins is significantly smaller compared to the number of nodes in the node list (), the time complexity of Algorithm 2 is dominated by the time complexity of the evaluation phase, which is . Hence, the overall time complexity of the proposed Algorithm 2 is . This linear time complexity of the algorithm contributes to a low data processing delay in false information detection.
4. Experimental Results
The performance evaluation of the proposed technique is discussed in this section, with the simulation setup, performance metrics used, and the results obtained. As stated in
Section 1, the performance of the proposed technique is compared with the RSUOIDM [
7] and DCFID [
8] techniques.
4.1. Simulation Setup
The performance evaluation of the proposed technique is carried out in both urban and highway scenarios. The simulations are carried out on a desktop computer with the Ubuntu 22.04.3 LTS operating system, equipped with an Intel 8th Gen i5-8400 Hexa-Core Processor running at 4 GHz, 8 GB of DDR4 RAM, and an NVIDIA GeForce GTX 1050Ti GPU. We use the Veins framework [
20] based on the SUMO and OMNET++ simulators for our simulation study. SUMO generates traces of vehicle movements, such as speed, location, acceleration, etc. SUMO also supports OpenStreetMap to import real-world road networks for generating simulation scenarios. The communication between vehicles is established using OMNET++, which is also used to measure network performance. Veins bi-directionally couples SUMO and OMNET++ to facilitate online network simulation. To evaluate the performance of our proposed technique, we import two maps of the city of Stillwater, Oklahoma, United States of America: one for the urban scenario and one for the highway scenario. In the urban scenario, vehicles have lower mobility and travel at a speed of 45–65 kph. The vehicles in the highway scenario travel at a speed of 80–110 kph. The honest vehicles in the simulation broadcast their actual speed in the beacon messages, while the malicious vehicles broadcast significantly lower speed values to resemble the situation of fake road congestion. The malicious vehicles in the urban scenario broadcast false speeds in the 20–30 kph range and the malicious vehicles in the highway scenario broadcast false speeds in the 35–50 kph range. We consider 500 vehicles in our simulation and measure the false information detection performance of the proposed technique by varying the proportion of malicious nodes in the 10–40% range. The values of the parameters used in the simulation are shown in
Table 2 below.
4.2. Performance Metrics
We use the following commonly used metrics to evaluate the performance of the proposed technique.
Data processing time: The time required for an evaluator node or RSU to evaluate the beacon message information to detect malicious nodes.
Accuracy: The fraction of correctly classified (honest and malicious) nodes out of the total number of nodes evaluated.
Precision: The fraction of correctly detected malicious nodes out of the total number of nodes detected as malicious.
Recall: The fraction of correctly detected malicious nodes out of the total number of actual malicious nodes.
F1 score: The harmonic mean of precision and recall that evenly expresses precision and recall in one metric.
False positive rate (FPR): The fraction of honest nodes incorrectly detected as malicious nodes.
4.3. Results for the Urban Scenario
The performance evaluation results for the urban scenario are discussed in this subsection with
Figure 4.
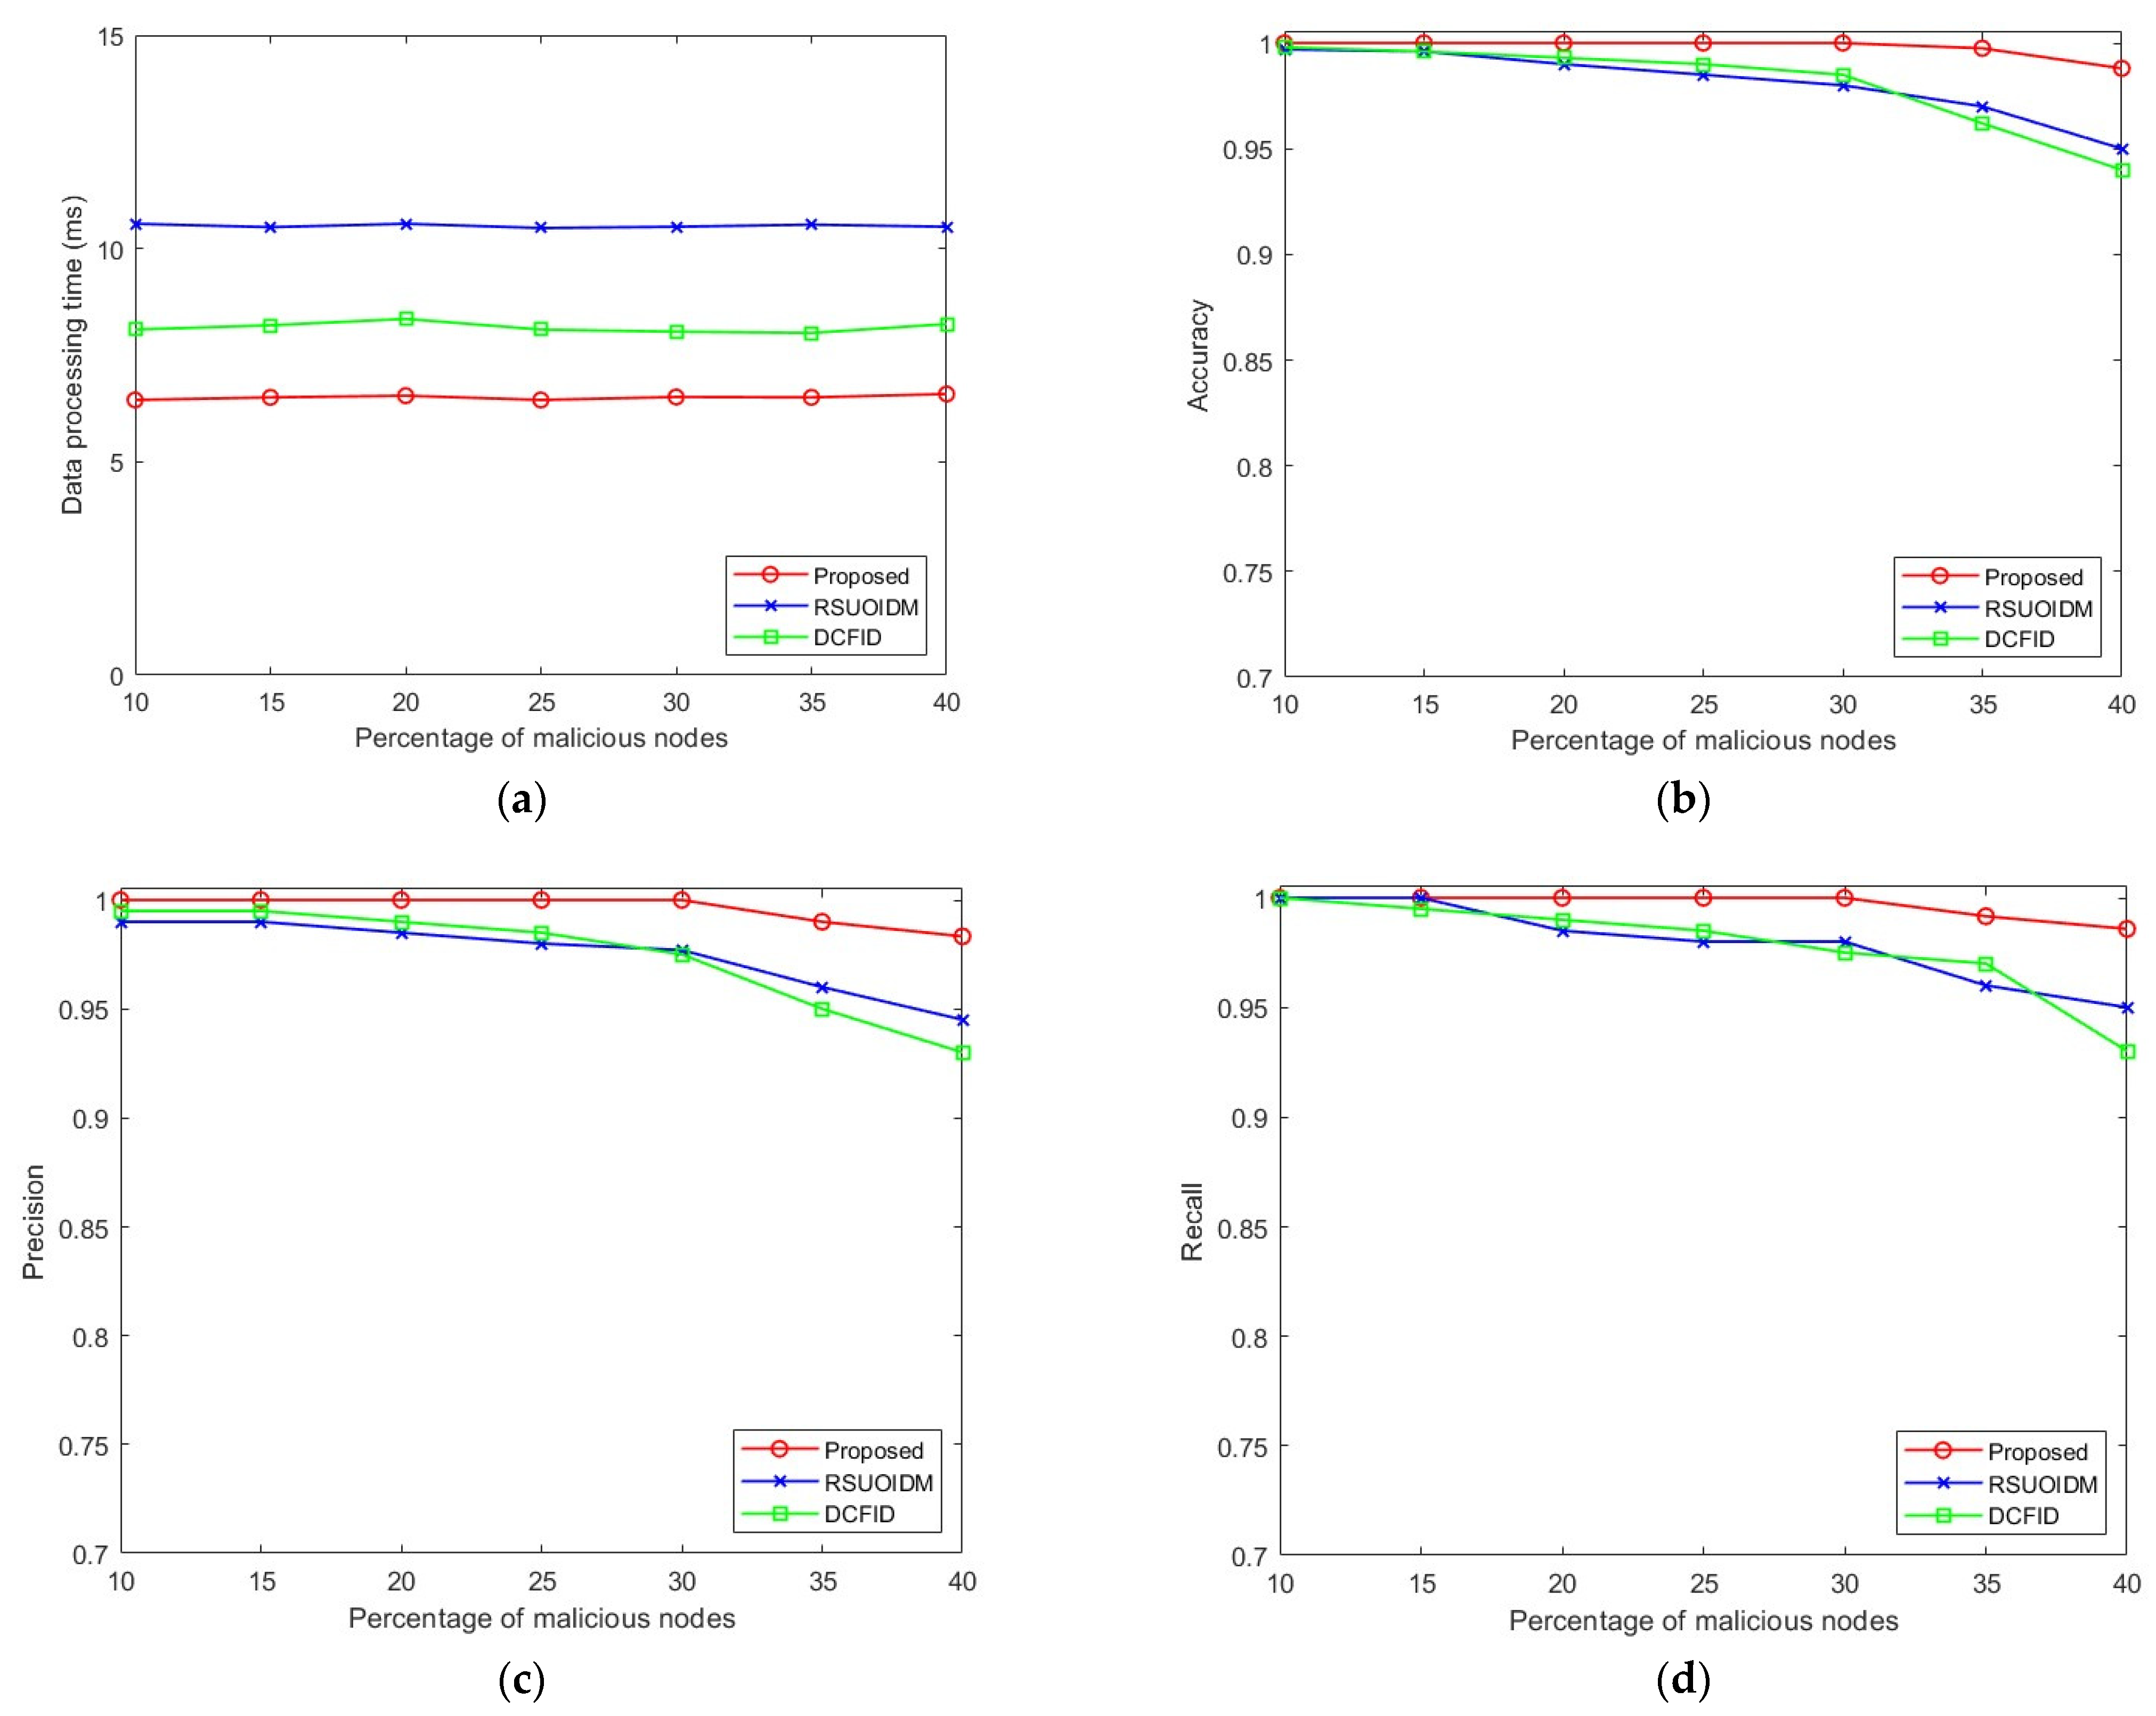
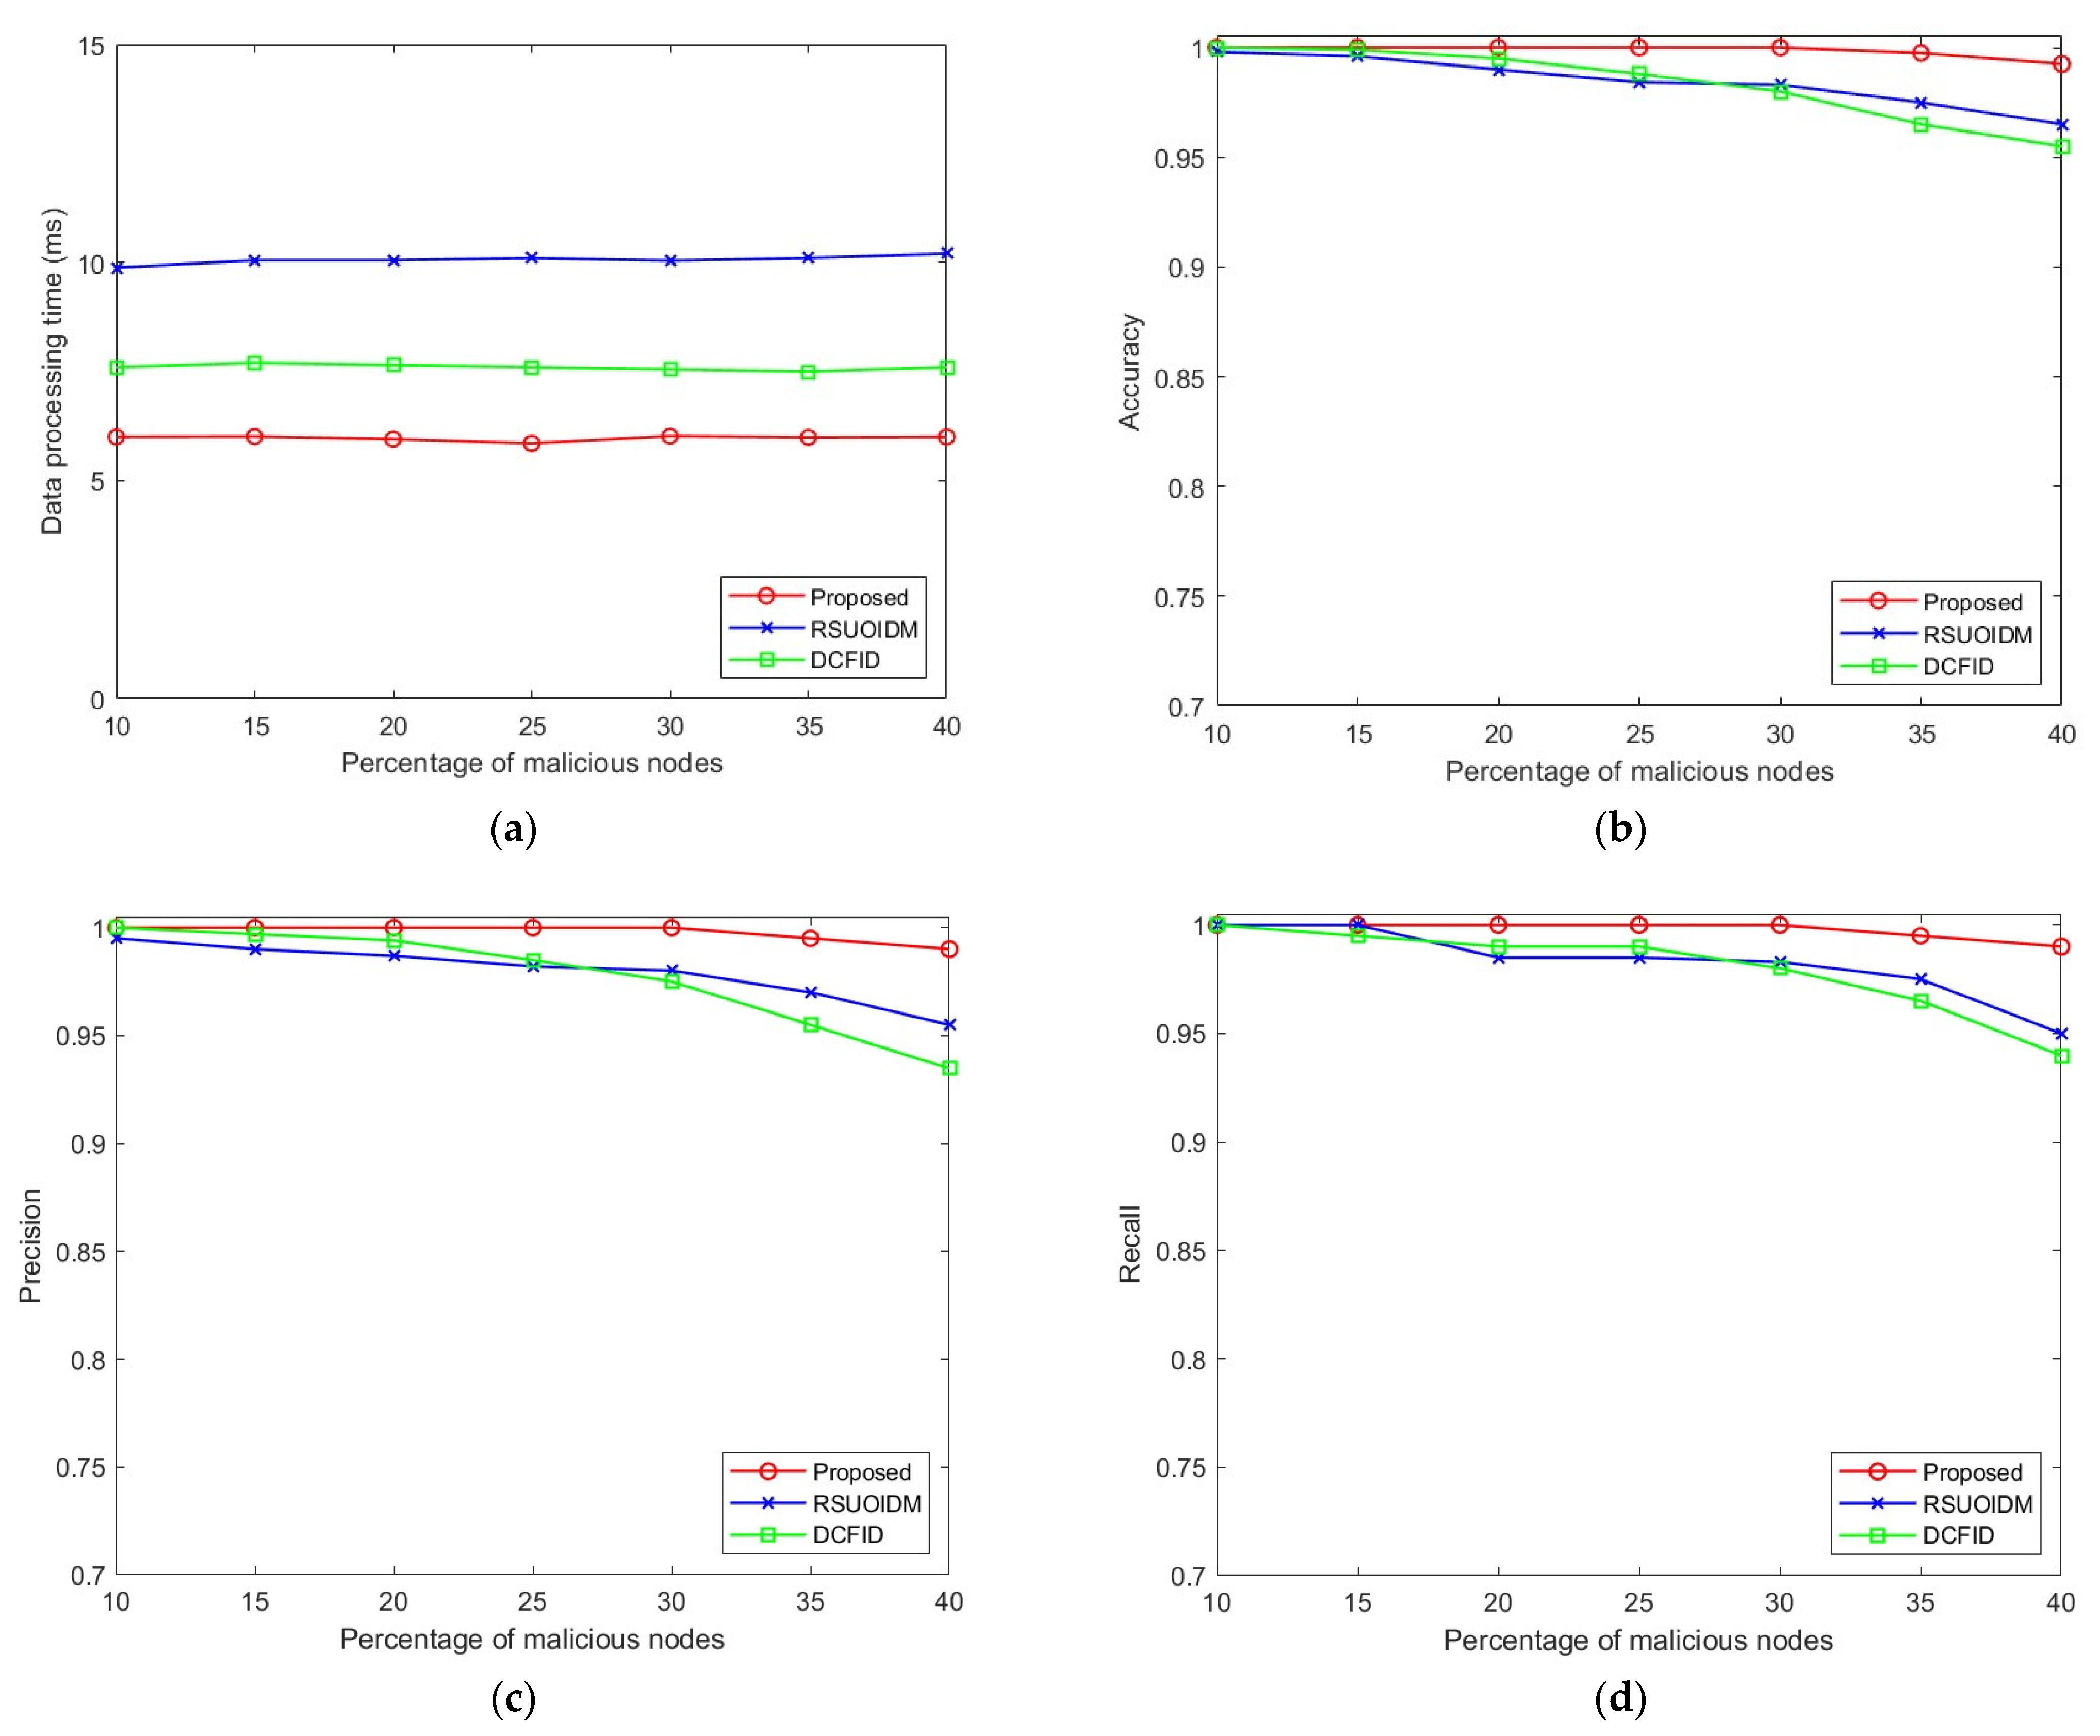
Data Processing Time: As observed from
Figure 4a, the data processing time of the proposed technique is on average 29% lower in the urban scenario due to the collective evaluation of binned data in our technique (
Section 3.3), thus offering lower processing time in comparison to the RSUOIDM and DCFID techniques. The data processing times of all the methods remain consistent with an increase in the percentage of malicious nodes as the number of beacon messages remains the same irrespective of the percentage of malicious nodes. The RSUOIDM technique evaluates the beacon messages from vehicles individually, leading to higher processing times. On the other hand, the clustering process of the DCFID technique leads to higher processing times though the evaluation of vehicles is collectively made in this technique after clustering. Our approach performs the binning process using only a single scan over the node list and then collectively evaluates the binned data.
Accuracy: The accuracy of the proposed technique remains consistent in the urban scenario when the proportion of malicious nodes increases. As seen in
Figure 4b, when the proportion of malicious nodes increases beyond 30%, the accuracy slightly decreases. The anomaly detection approach in our proposed technique correctly classifies almost all the nodes using the binning method to achieve this high accuracy. The proposed technique offers higher accuracy in comparison to the RSUOIDM and DCFID techniques for all proportions of malicious nodes.
Precision: It is observed from
Figure 4c that the precision of our proposed technique decreases slightly when the proportion of malicious nodes increases beyond 30%; however, the value still stays above 0.98. This signifies the correctness of our detection approach. Due to the variations in the vehicle speeds in the simulations, the speed values of some honest nodes do not remain similar to the majority of the honest nodes, and these nodes are incorrectly detected as malicious, resulting in a minor decrease in precision. The proposed technique offers higher precision for all proportions of malicious nodes compared to the RSUOIDM and DCFID techniques.
Recall: The recall value also remains higher than the RSUOIDM and DCFID techniques for all proportions of malicious nodes, which can be observed in
Figure 4d. The proposed technique correctly detects almost all the malicious nodes in the network. To create the illusion of a false event, the malicious nodes abruptly lower the speed value in the beacon messages. The binning method in our technique separates these deviating speed values and correctly detects them, exploiting the fact that these values are a minority.
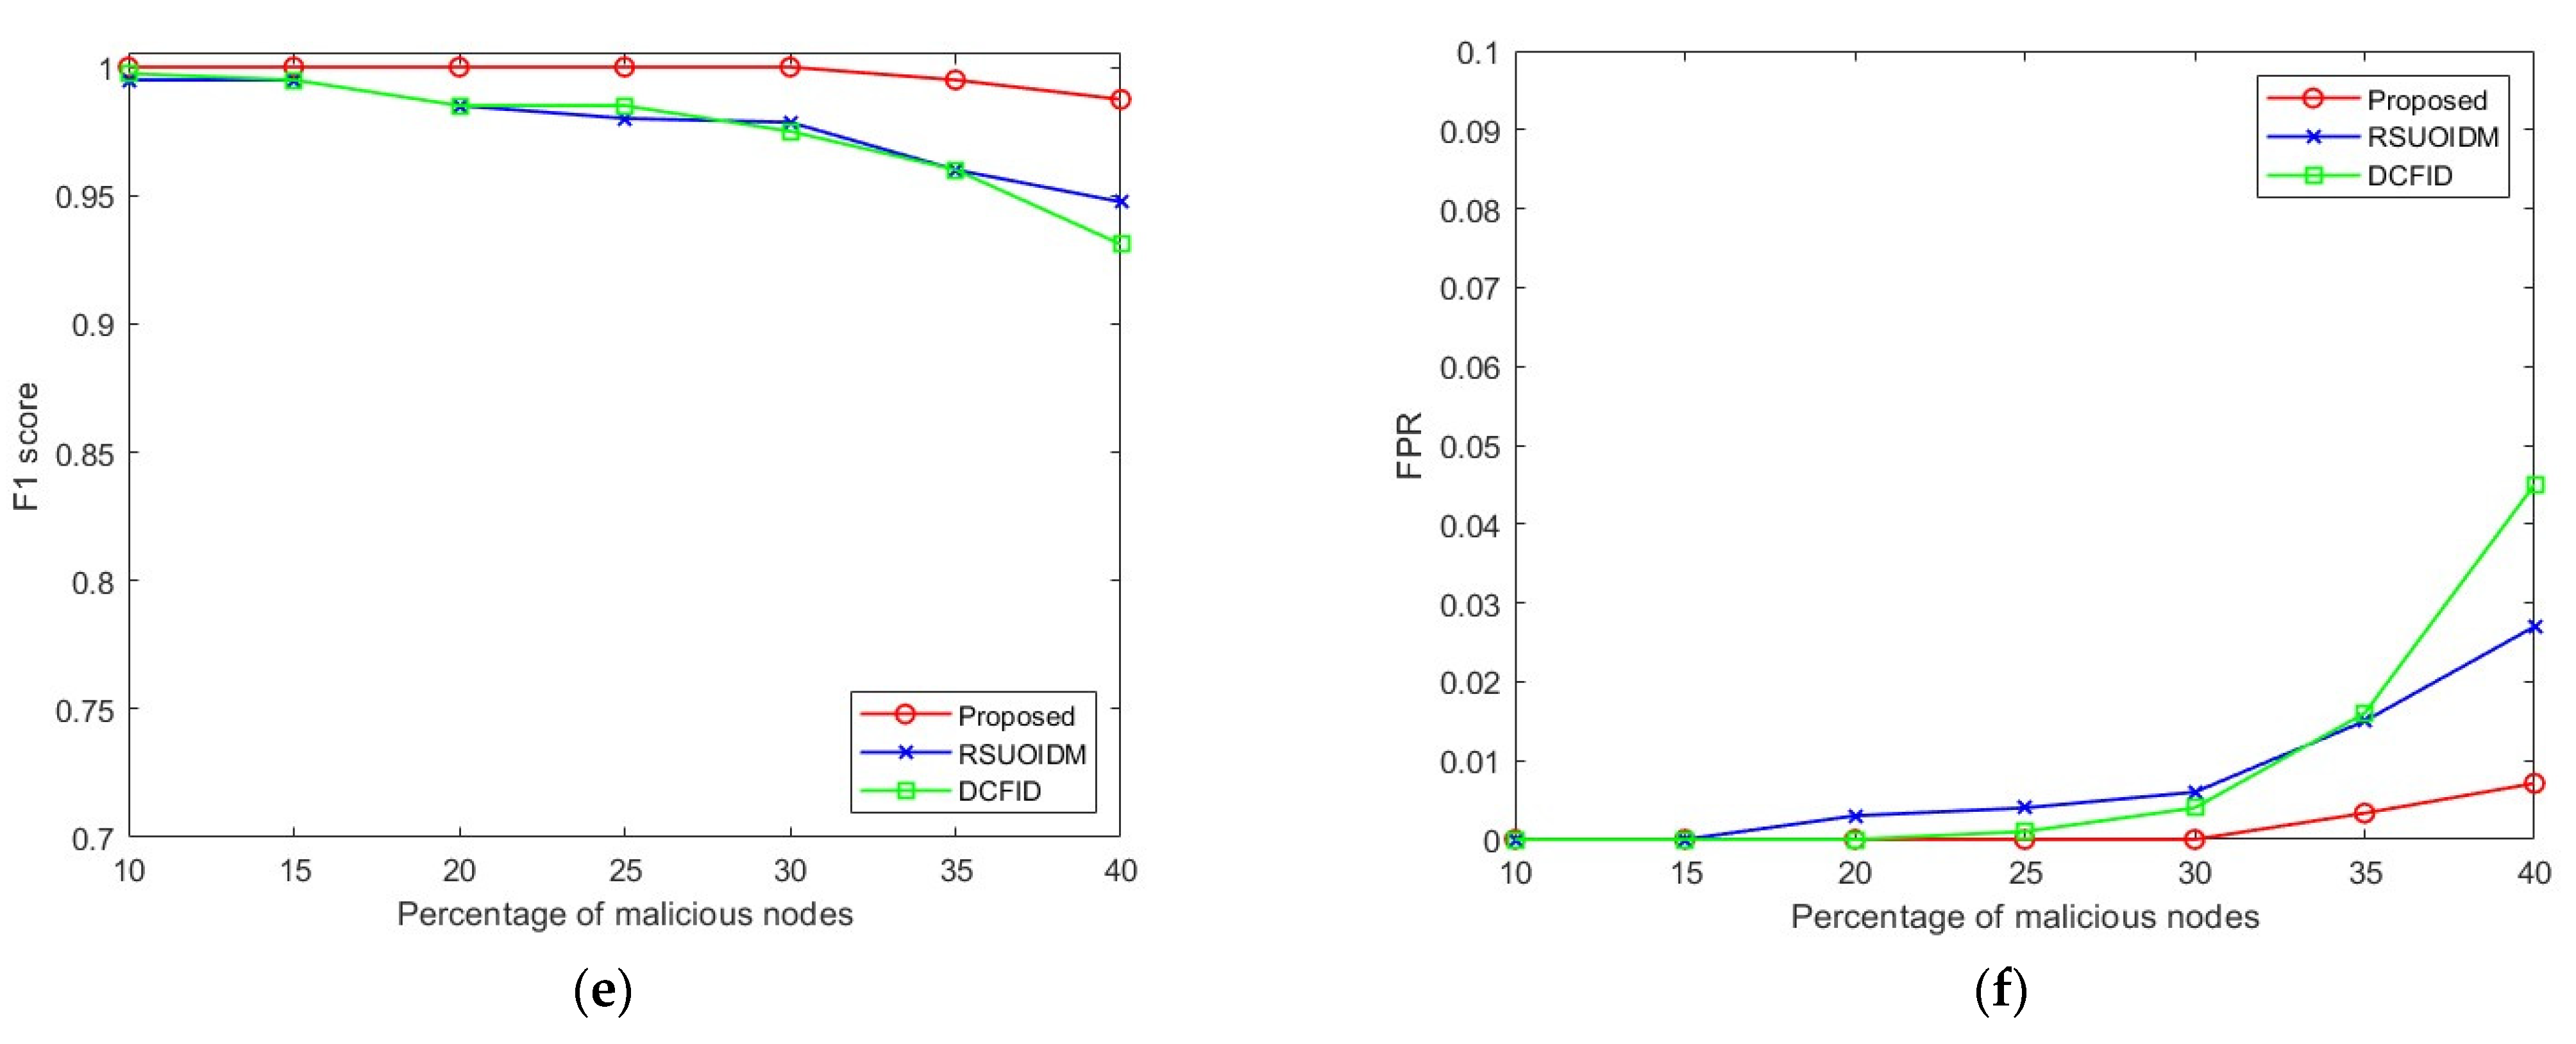
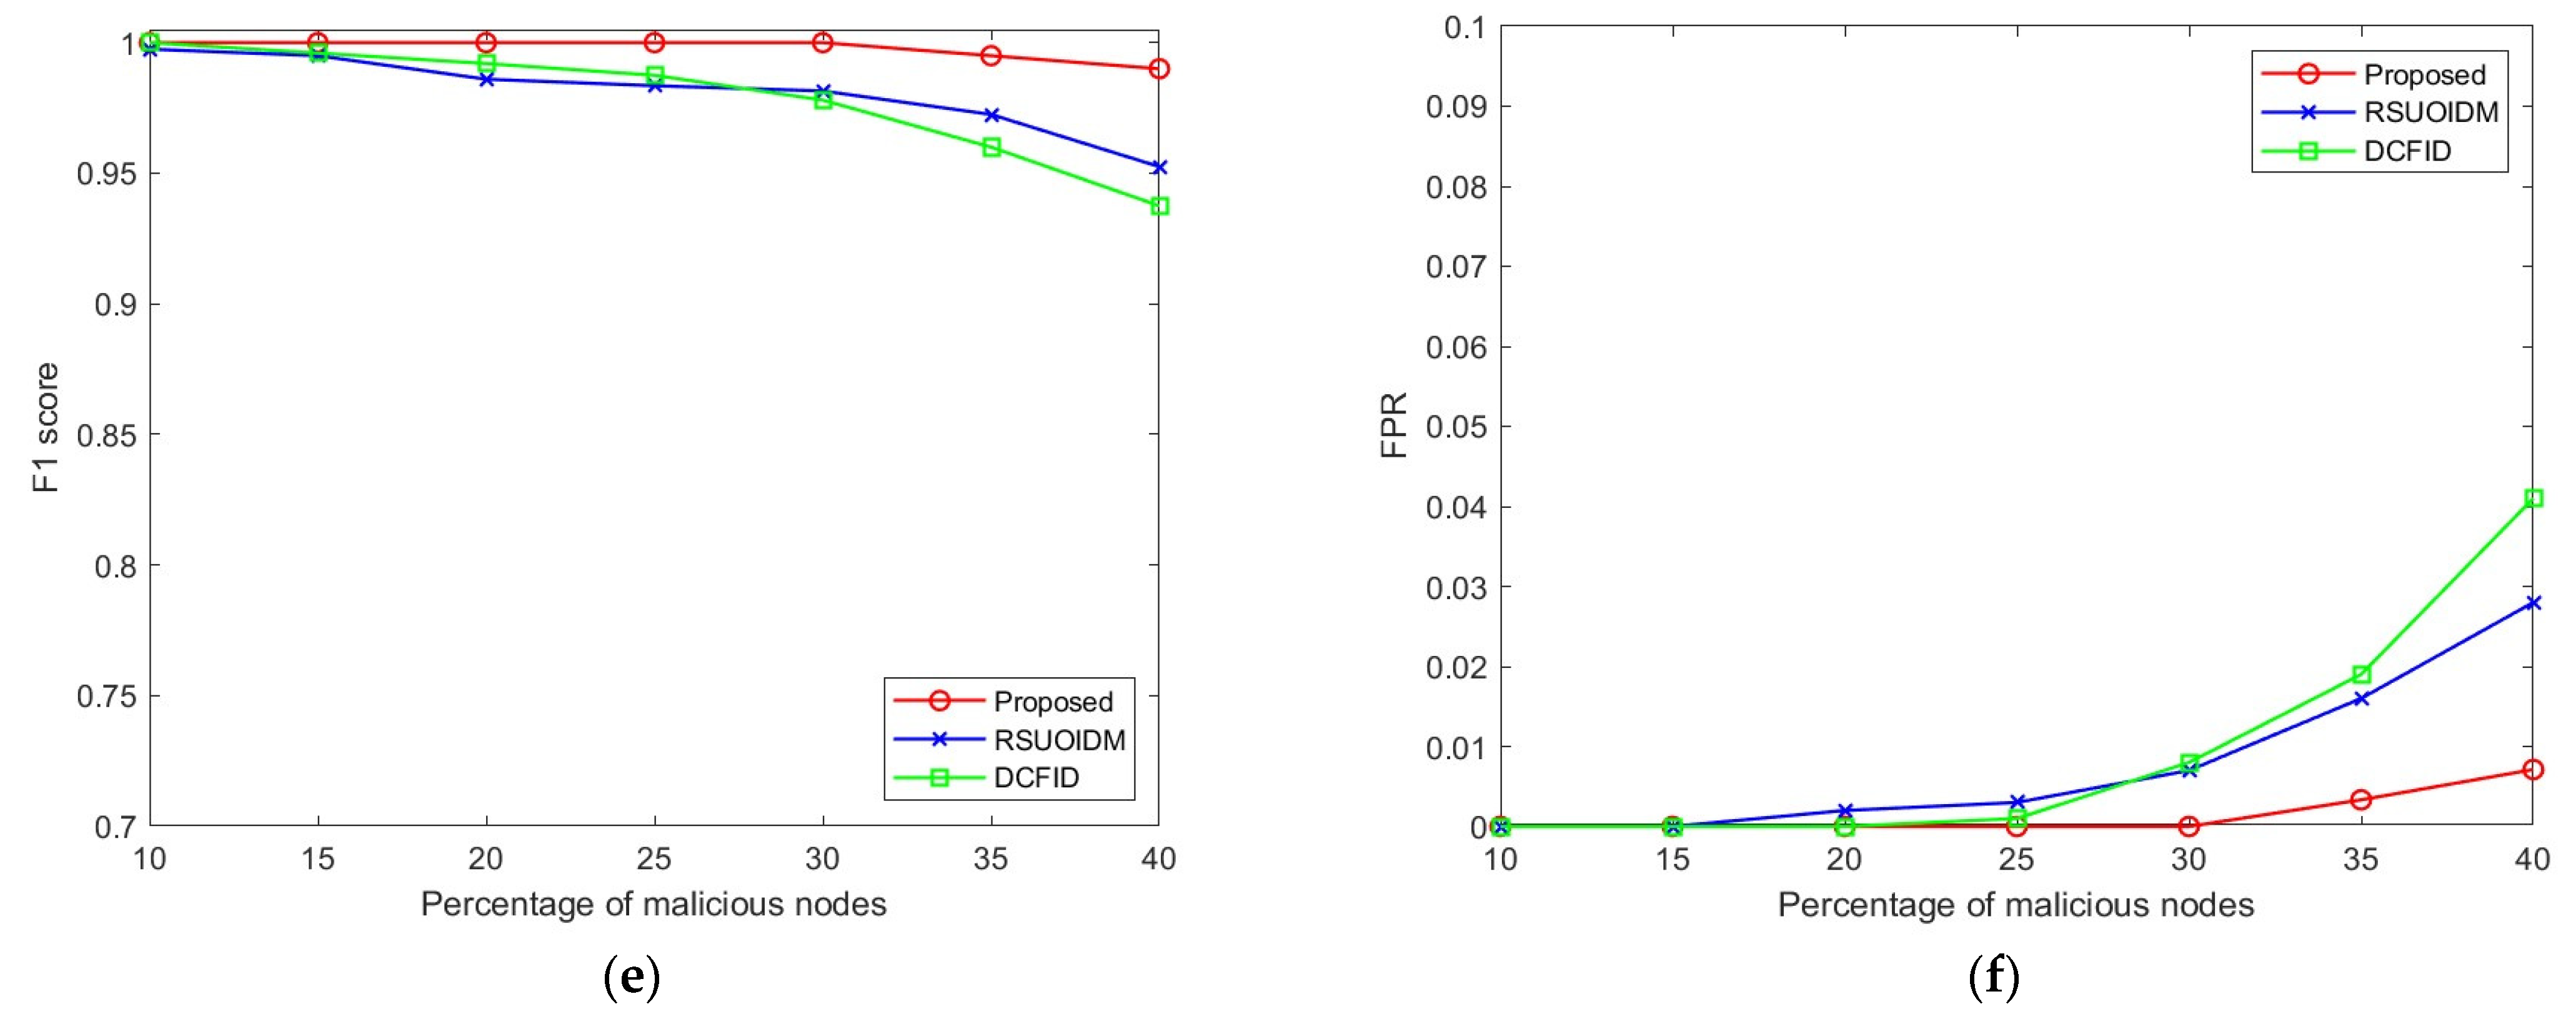
F1 score: The F1 score degrades slightly when the proportion of malicious nodes increases above 30% due to the marginal changes in precision and recall values in these cases. As seen in
Figure 4e, the higher F1 score for our proposed technique than the RSUOIDM and DCFID techniques suggests that our technique can successfully detect the malicious nodes in the network without incorrectly classifying the honest nodes to be malicious.
FPR: The FPR of the proposed technique remains low, which can be observed in
Figure 4f. The maximum value of FPR arises when the proportion of malicious nodes reaches 40%. In the presence of such a high proportion of malicious nodes, our detection technique incorrectly classifies a few honest nodes to be malicious resulting in a slightly higher FPR. However, in real-life scenarios, such high proportions of malicious nodes do not exist in a network. Overall, our detection technique’s correct classification of the honest nodes offers a 17% lower FPR compared to the RSUOIDM and DCFID techniques.
4.4. Results for the Highway Scenario
The performance evaluation results for the highway scenario are discussed in this subsection with
Figure 5.
Data processing time: Our proposed technique offers a 31% lower data processing time on average in the highway scenario in comparison to the RSUOIDM and DCFID techniques as seen in
Figure 5a.
As in the urban scenario, the data processing times of the three techniques are independent of the percentage of malicious nodes. The data processing time of our technique is marginally lower in the highway scenario compared to the urban scenario as due to the high mobility of vehicles in the highway scenario, a smaller number of beacon messages needs to be processed by an evaluating vehicle.
Accuracy: As observed from
Figure 5b, the proposed technique offers stable accuracy in the highway scenario as well with increases in the proportion of malicious nodes. Though the accuracy slightly degrades with more than 30% malicious nodes in the network, the accuracy remains marginally better than in the urban scenario. For all proportions of malicious nodes, our technique offers higher accuracy than the RSUOIDM and DCFID techniques by correctly classifying honest and malicious nodes.
Precision: The precision of our proposed technique is slightly better in the highway scenario compared to the urban scenario when the proportion of malicious nodes increases beyond 30%, which can be observed in
Figure 5c. The RSUOIDM and DCFID techniques also show better precision in the highway scenario due to the higher deviation between actual speed and false speed values transmitted by vehicles, enabling the techniques to detect false speed values. Overall, the proposed technique offers higher precision in all cases of simulation compared to the RSUOIDM and DCFID techniques.
Recall: Our proposed technique also offers better recall values than the RSUOIDM and DCFID techniques in all proportions of malicious nodes in the highway scenario, which can be observed from
Figure 5d. This indicates that our technique correctly detects almost all the malicious nodes in the network, with the binning method accurately separating the deviating speed values.
F1 score: The F1 score of our technique remains higher than the RSUOIDM and DCFID techniques due to the higher precision and recall values, as seen in
Figure 5e. This again suggests that in the highway scenario our technique can successfully detect the malicious nodes in the network without incorrectly classifying the honest nodes as being malicious.
FPR: The FPR of the proposed techniques remains lower compared to the RSUOIDM and DCFID techniques for all proportions of malicious nodes. On average, our technique offers a 16% lower FPR than the RSUOIDM and DCFID techniques, which can be observed in
Figure 5f. When the proportion of malicious nodes increases beyond 30%, our technique incorrectly classifies a few honest nodes to be malicious, resulting in a slightly higher FPR, whereas the FPR of the RSUOIDM and DCFID techniques increases steeply beyond 25% of malicious nodes.


