Abstract
The junction temperature of a power device in a natural air-cooled power converter fluctuates randomly due to the variation in airflow rate in ambient environments. Most of the existing thermal analysis methods do not pay attention to the uncertain influence of airflow on the heat-dissipation capacity of such converters, making it difficult to accurately evaluate the thermal safety of these devices. To address this issue, a thermal safety assessment method for power devices in natural air-cooled converters is proposed in this paper. In the proposed method, convective heat resistance samples of converter housing are extracted with an equivalent thermal network model and the historical operation temperature of the converter. Wavelet packet transform is used to analyze the time–frequency domain characteristics of the convective heat resistance, and Monte Carlo simulation is employed to simulate the random influence of the airflow rate on the device junction temperature. The thermal safety of power devices is assessed in the form of over-temperature probability, which is expressed by a two-variable growth function. An experimental platform is designed to validate the effectiveness of the proposed method. The results show that the proposed method can accurately estimate the over-temperature risk of a power device in a natural air-cooled converter under different ambient temperature and current levels, thus effectively improving the thermal reliability of converters.
1. Introduction
Power devices are widely used in power electronic converters, such as power supplies, motor drivers and grid-connected inverters. To avoid overheating fault in the converter, the junction temperature of the power device must not exceed its maximum allowable value. Therefore, how to accurately assess the thermal safety of power devices under different working conditions is a key issue to ensure the reliability of converters.
The thermal safety assessment of devices relies on effective thermal analysis methods. At present, the commonly used device thermal analysis methods mainly include the finite element method and the equivalent thermal network model method [1]. The finite element method simulates the 2D or 3D temperature field distribution of a power device and its converter housing through the grid division of the calculation area [2,3]. Due to the huge amount of calculation required, the finite element method is more suitable for designers of semiconductor devices who require detailed information about the time–spatial temperature distribution of a device structure. The equivalent thermal network model estimates variations in device temperature and converter housing temperature based on the thermal–electrical analogy [4]. The equivalent thermal network model is expressed as an RC electrical network based on the thermo-electric analogy in which the voltage, current, and RC parameter correspond to temperature, thermal power, and thermal impedance, respectively. Since the thermal network model only provides the temperature information of a limited number of nodes (mainly junction, case and heatsink temperature) between the device and the environment, it has the advantages of small calculation requirements and convenient use. For this reason, the thermal network model is usually used for the online thermal analysis of power devices.
The above two thermal analysis methods have been widely used for various power devices and converters. The finite element method was employed in the literature [5] to establish a 3D thermal model of IGBT and to analyze the sensitivity of the model parameters. The authors of [6,7] used the finite element method to simulate the electrothermal performance of IGBT and successfully realize the retrieval of voltage and current. The thermal network model was used to estimate the junction temperature of power devices and realize junction temperature control to improve the overload capacity of converters [8]. The authors of [9] proposed a thermal network model of power, MOSFET, which considers the thermal aging effect of packaging materials and accurately estimates the junction temperature change during the continuous degradation of a device. Based on a thermal network model of power devices, the life of a wind turbine converter under a long-term task profile was evaluated in [10]. Due to the aging of device materials and nonlinear heat dissipation, the heat impedance in the thermal network model may change nonlinearly with use time and working conditions. In order to reflect the junction temperature change in devices more accurately, the nonlinear variation characteristics of thermal impedance in thermal network models are studied in the literature [11,12]. These nonlinear network models considering temperature-dependent physical parameters have been proven to have higher thermal analysis accuracy [13,14]. In the literature [15,16], three-dimensional thermal network models are constructed to estimate the internal temperature distribution of modules composed of multiple chips. Compared with one-dimensional models, three-dimensional thermal models have significant advantages in describing the thermal coupling effects between device chips [17,18,19].
Although the above studies have greatly promoted the development of thermal analysis technology for power devices and converters, they assume that the research object works under stable and deterministic conditions. Consequently, the existing thermal analysis methods are not suitable for assessing the thermal safety of devices in natural convection air-cooled converters. A natural air-cooled converter is a kind of converter that uses the natural flow of air in an ambient environment to dissipate heat. Typical air-cooled converters include portable DC power supplies, movable inverters, photovoltaic controllers, etc. These converters are commonly low-power, but play a crucial role in the field of outdoor power conversion and transmission. To meet waterproof and heat-dissipation performance requirements, natural air-cooled converters usually have a fully enclosed metal housing. Due to the uncertainty of ambient airflow rate, the heat-dissipation capacity of these converters is unstable, which leads to random fluctuations in device junction temperature. The randomness of the junction temperature greatly increases the difficulty of thermal safety assessment, thus reducing the effectiveness of thermal management strategies. Therefore, it is still a great challenge to accurately evaluate the thermal safety of power devices in natural air-cooled converters because existing studies commonly ignore the uncertain influence of airflow rate on converters.
To address this problem, a thermal safety assessment method is proposed in this paper. In the proposed method, the random effect of airflow rate on natural air-cooled converters is quantitatively analyzed by a wavelet packet transform on the convective heat resistance of the converter housing. Considering the advantage of online usability, the equivalent thermal network model of the converter is used to extract the convective heat resistance samples of the housing. The Monte Carlo method is employed to simulate random fluctuation in the device’s junction temperature. A two-variable growth function is used to describe the over-temperature probability of the device under different current and ambient temperatures. Compared with existing thermal analysis studies, this study can effectively reflect the thermal safety of a device in the form of over-temperature probability, thus improving the reliability of natural air-cooled converters.
2. Influence of Airflow Rate Randomness on the Thermal Safety of Natural Air-Cooled Converters
2.1. Equivalent Thermal Network Model of Natural Air-Cooled Converters
As described in the introduction, in order to analyze the thermal safety of power devices in practical engineering, it is necessary to estimate the device junction temperature with the equivalent thermal network model. The structure of the thermal network model is related to the physical structure of converters. Natural air-cooled converters commonly have a fully enclosed structure and power devices are tightly attached to the inner wall of the converter housing for heat dissipation. Due to the conductive heat resistance of the converter housing, the power device may cause a certain degree of temperature distribution on the housing. According to the physical definition [20], conductive heat resistance θd can be expressed as
where λ is the thermal conductivity, which is determined by the material properties of the housing. l is the path length of the heat conduction on the housing, which is related to the distribution distance of power devices and the size of the housing. S is the heat conduction area on the housing, which is related to the size and thickness of the housing.
In general, the smaller the converter housing and the higher the thermal conductivity of the housing material, the smaller the value of the conductive heat resistance θd. If θd is small enough, the temperature distribution on the converter housing can be ignored and the housing can be regarded as a whole for thermal analysis. Due to the lack of an auxiliary cooling system, the housing of natural air-cooled converters must be made of materials with good thermal conductivity, such as aluminum or copper. In addition, under the requirements of cost and portability, the housing size of natural air-cooled converters is commonly strictly limited. Because of the above two reasons, the housing temperature distribution of many natural air-cooled converters in practical engineering is small.
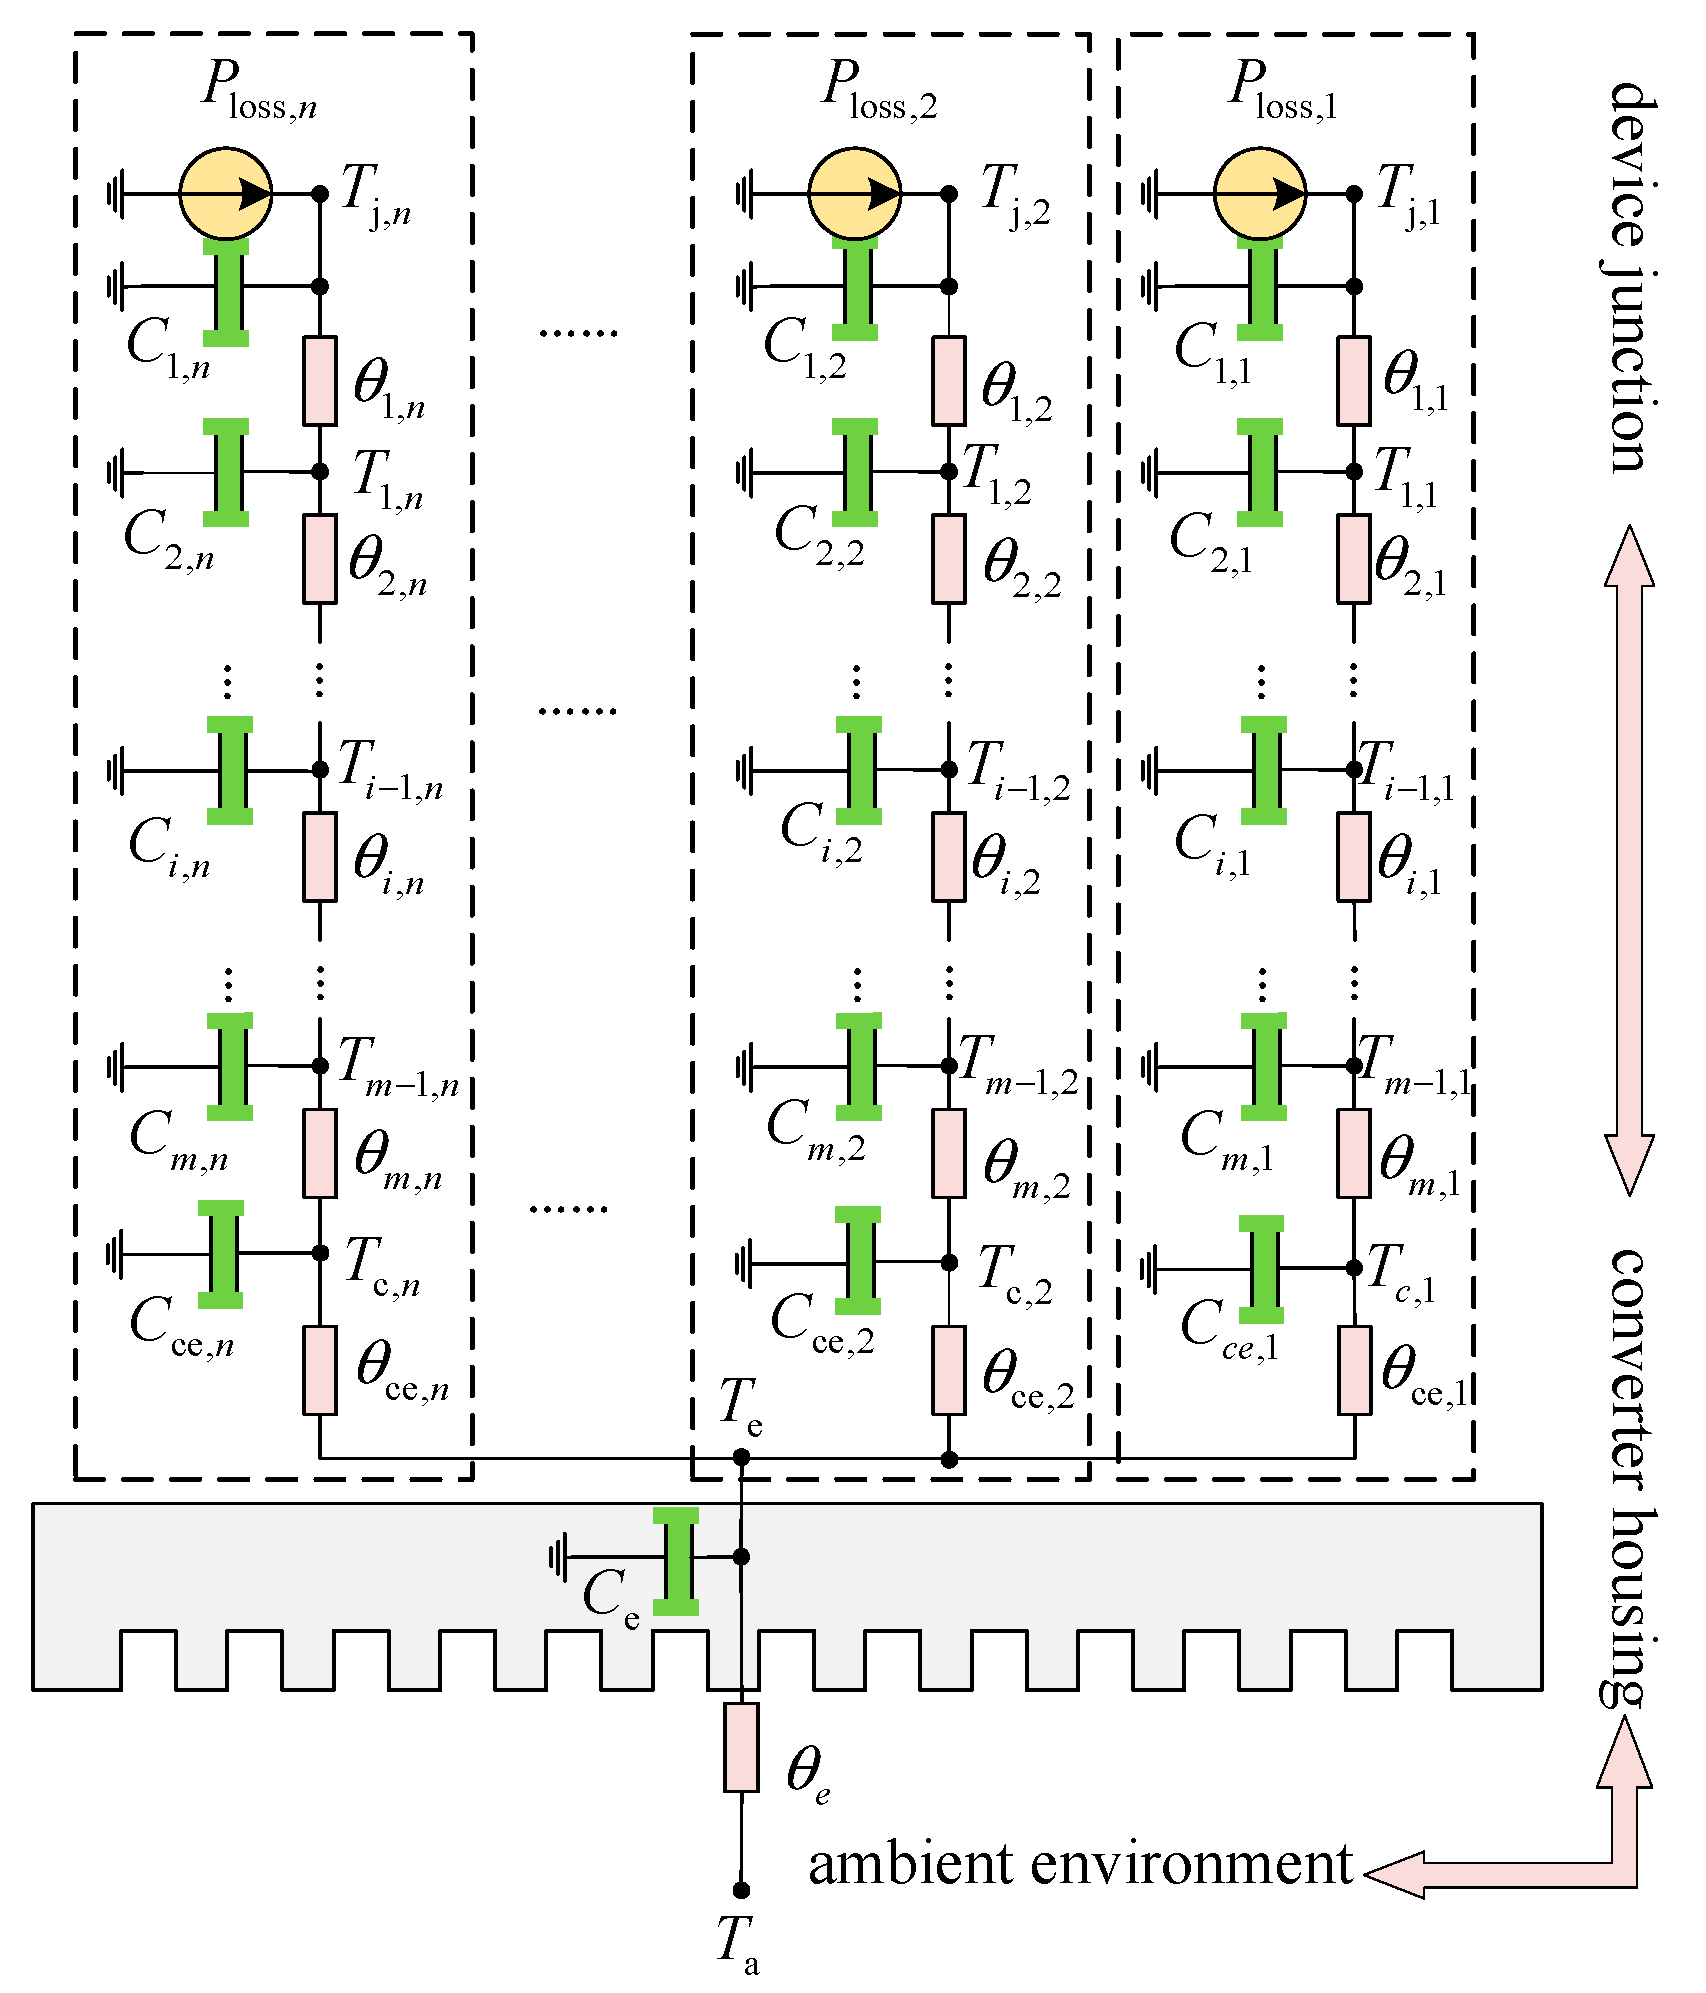
On the basis of ignoring housing temperature distribution, the equivalent thermal network model of a natural air-cooled converter composed of power MOSFETs can be constructed as shown in Figure 1. The equivalent thermal network model consists of a thermal network from the device junction to the converter housing and a thermal circuit from the converter housing to the ambient environment. The subscript n represents the number of power devices inside the converter. The parameters Ploss,n, Tj,n and Tc,n are the loss, junction temperature and case temperature of the device, respectively. Ci,n, θi,n and Ti,n are the heat capacity, heat resistance and temperature of the i-node (i from 1 to m) inside the device, respectively. Cce,n and θce,n are the heat capacity and heat resistance of the heat-conducting material between the device case and the converter housing, respectively. Te, and Ta are the converter housing temperature and the ambient temperature, respectively. Ce and θe are the heat capacity and convection heat resistance of the converter housing, respectively.
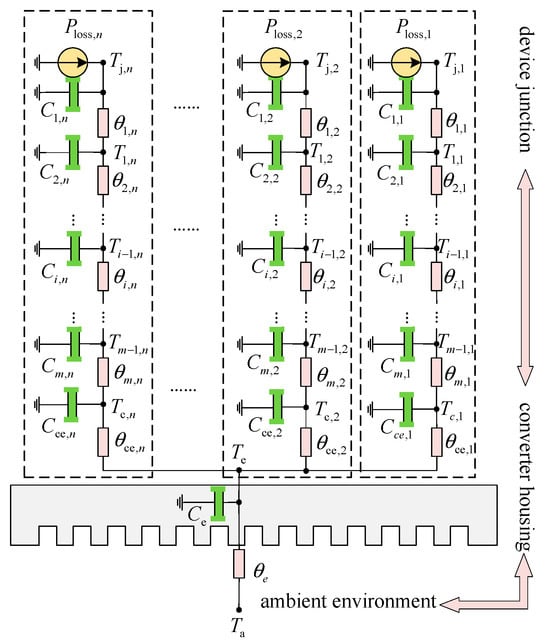
Figure 1.
Thermal network model of a natural air-cooled converter.
According to the electrical network analysis method, the thermal networks from the device junction to the converter housing can be expressed as
The thermal circuit from the converter housing to the ambient environment can be expressed as
When the converter housing temperature Te is measured, the case temperate Tc,k and the junction temperature Tj,k can be directly estimated by (2). If the measured temperature is the ambient temperature Ta, the junction temperature needs to be estimated by combining (2) and (3).
Obviously, the device junction temperature is estimated with the linear thermal network in this paper. However, as mentioned in the introduction, the heat resistances in the thermal network have certain nonlinear characteristics. The parameter extraction workload of the nonlinear thermal network is larger than that of the linear thermal network, so the linear thermal network is still widely used to estimate the device junction temperature in practical engineering. With the continuous improvement and development of parameter identification methods, nonlinear thermal networks can be used to construct thermal models of natural air-cooled converters in the future.
2.2. Experimental Set-Up
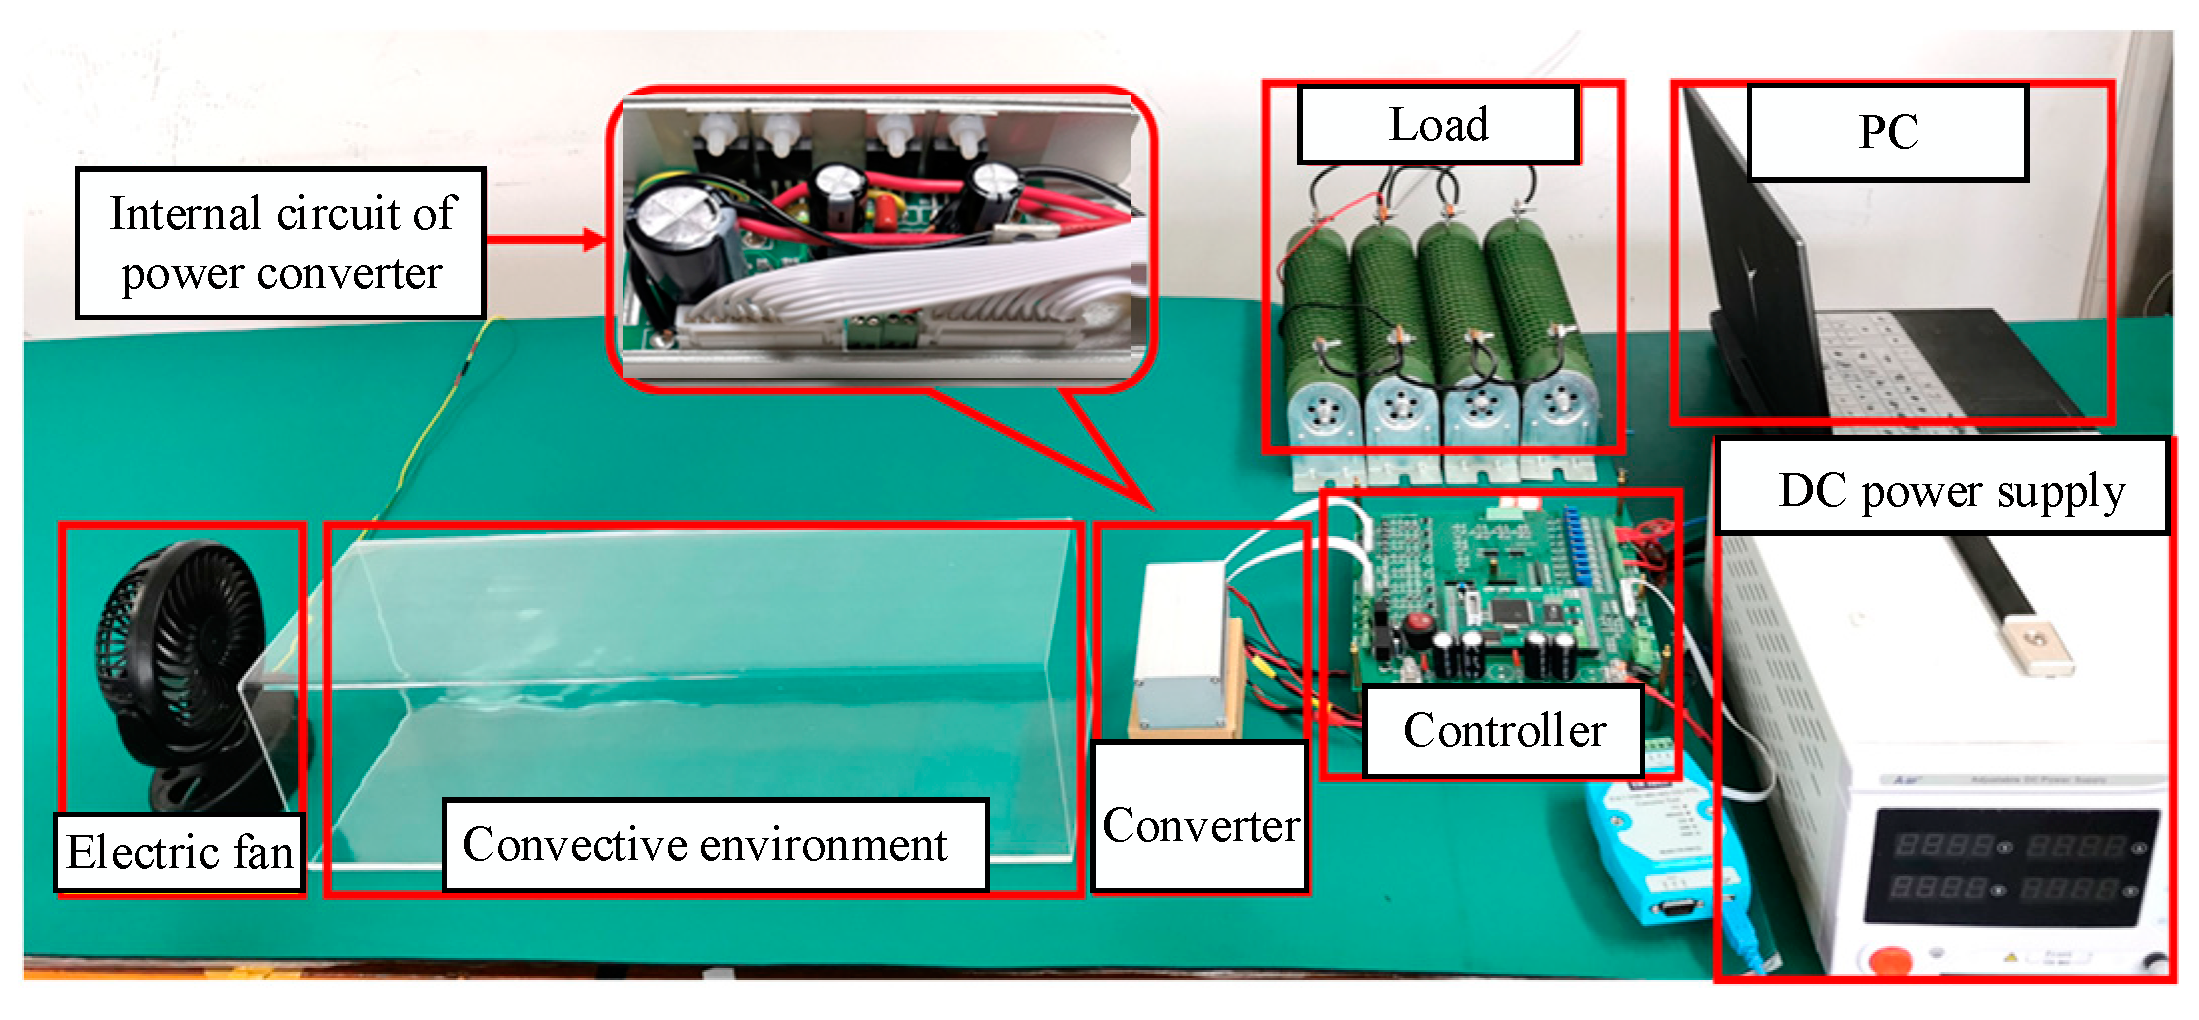
To analyze the influence of airflow rate randomness on the thermal safety of the natural air-cooled converter, an experimental platform is designed, as shown in Figure 2. In this platform, an H-bridge converter with output square-wave voltage is used as the experimental object. The load of the converter is a 0.5 Ω resistor and a 0.1 mH inductor. An 18 V DC power supply is used to power the converter. The circuit of the converter is mounted inside a rubber base and a metal housing, as shown in Figure 3. The five surfaces of the housing are numbered S1 to S5, respectively. The size of the housing is only 100 mm × 32 mm × 32 mm. The material of the housing is 1070 aluminum alloy with a thermal conductivity of up to 234 W/(m·k).
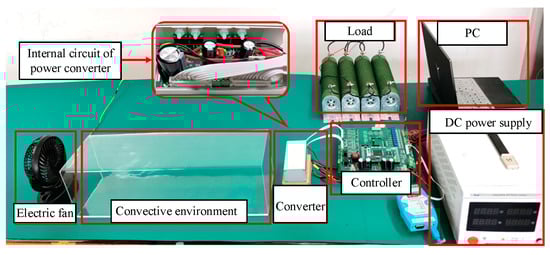
Figure 2.
Experimental platform.
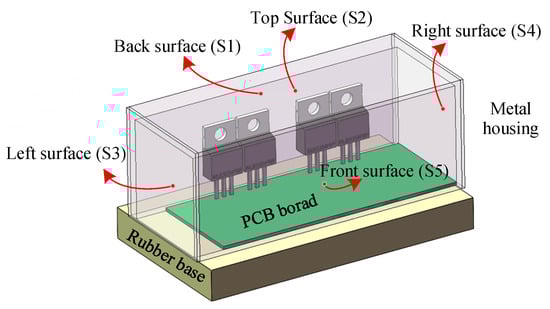
Figure 3.
Schematic diagram of the converter structure in the experimental platform.
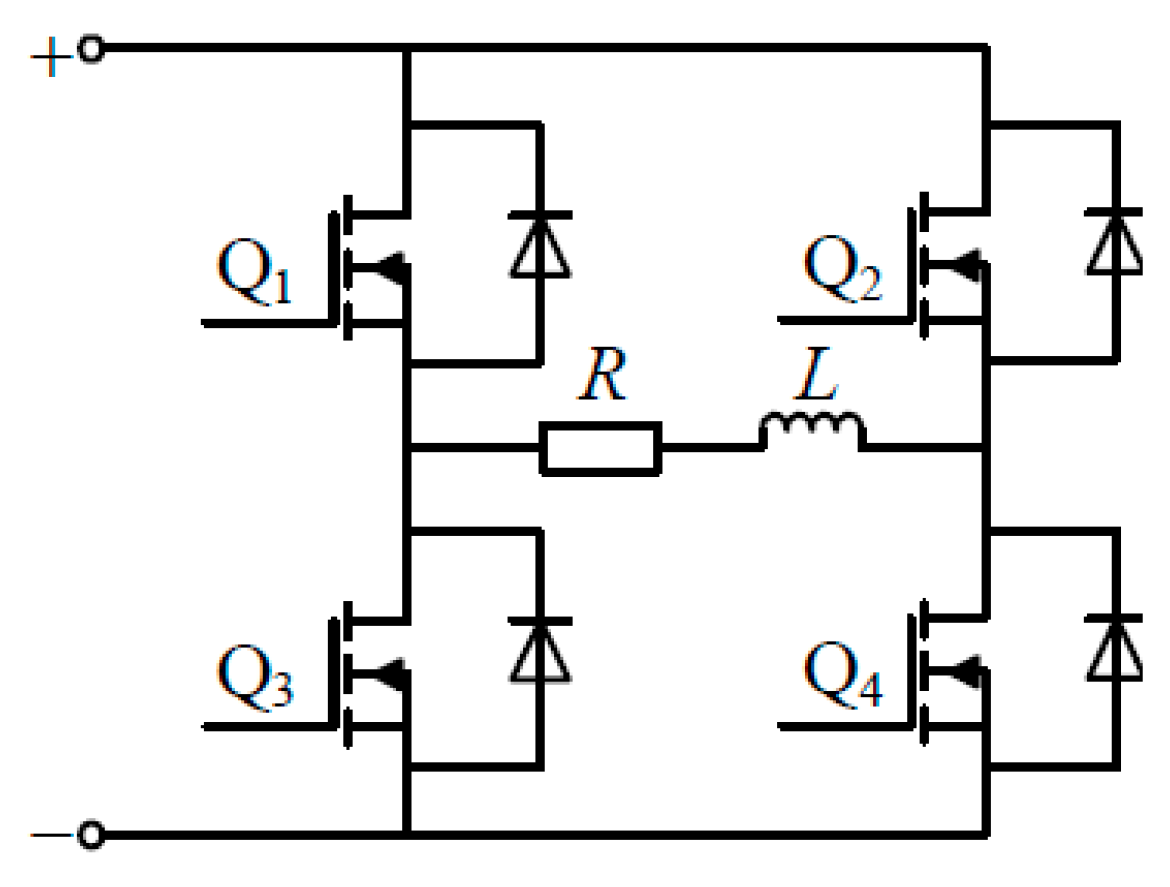
The converter consists of four power MOSFETs numbered from Q1 to Q4, as shown in Figure 4. The type of power of the MOSFETs is IRFB4410PbF, and they are attached to the inner wall of the housing through the thermal conductive adhesive TR6400. The thermal conductivity and the thickness of the thermal conductive adhesive are 0.8 W/(m·k) and 0.2 mm. Table 1 lists the thermal parameters of the power MOSFETs, the thermal conductive adhesive and the housing, which are provided by the manufacturers.
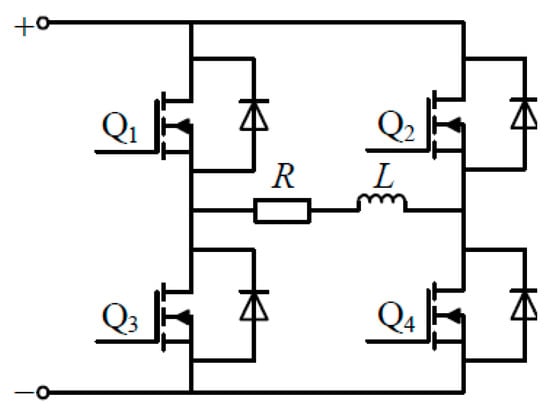
Figure 4.
Main power topology of the converter.

Table 1.
Thermal network model parameters of the power device.
A controller is used to control the load current of the converter and make the converter commutate at a frequency of 200 Hz. The controller is designed based on an RK3568 microprocessor whose main frequency is up to 1.8 GHz/4 core and the memory is 2 GB. To simulate the uncertain variation in airflow rate in the experimental environment, the controller controls the motor speed of an electric fan by the duty cycle of the PWM signal. The control program in the controller is written based on C language.
During the experiment, the temperature, including the device case temperature, the converter housing temperature and the ambient temperature, are measured by MF52 thermistors with an error of less than 1% and a thermal response time of less than 2 s. The current is measured by an MT9221 Hall effect sensor with an error of less than 2%. All the measurements are collected by the controller and sent to a PC for storage and analysis.
2.3. Analysis on the Influence of Thermal Safety
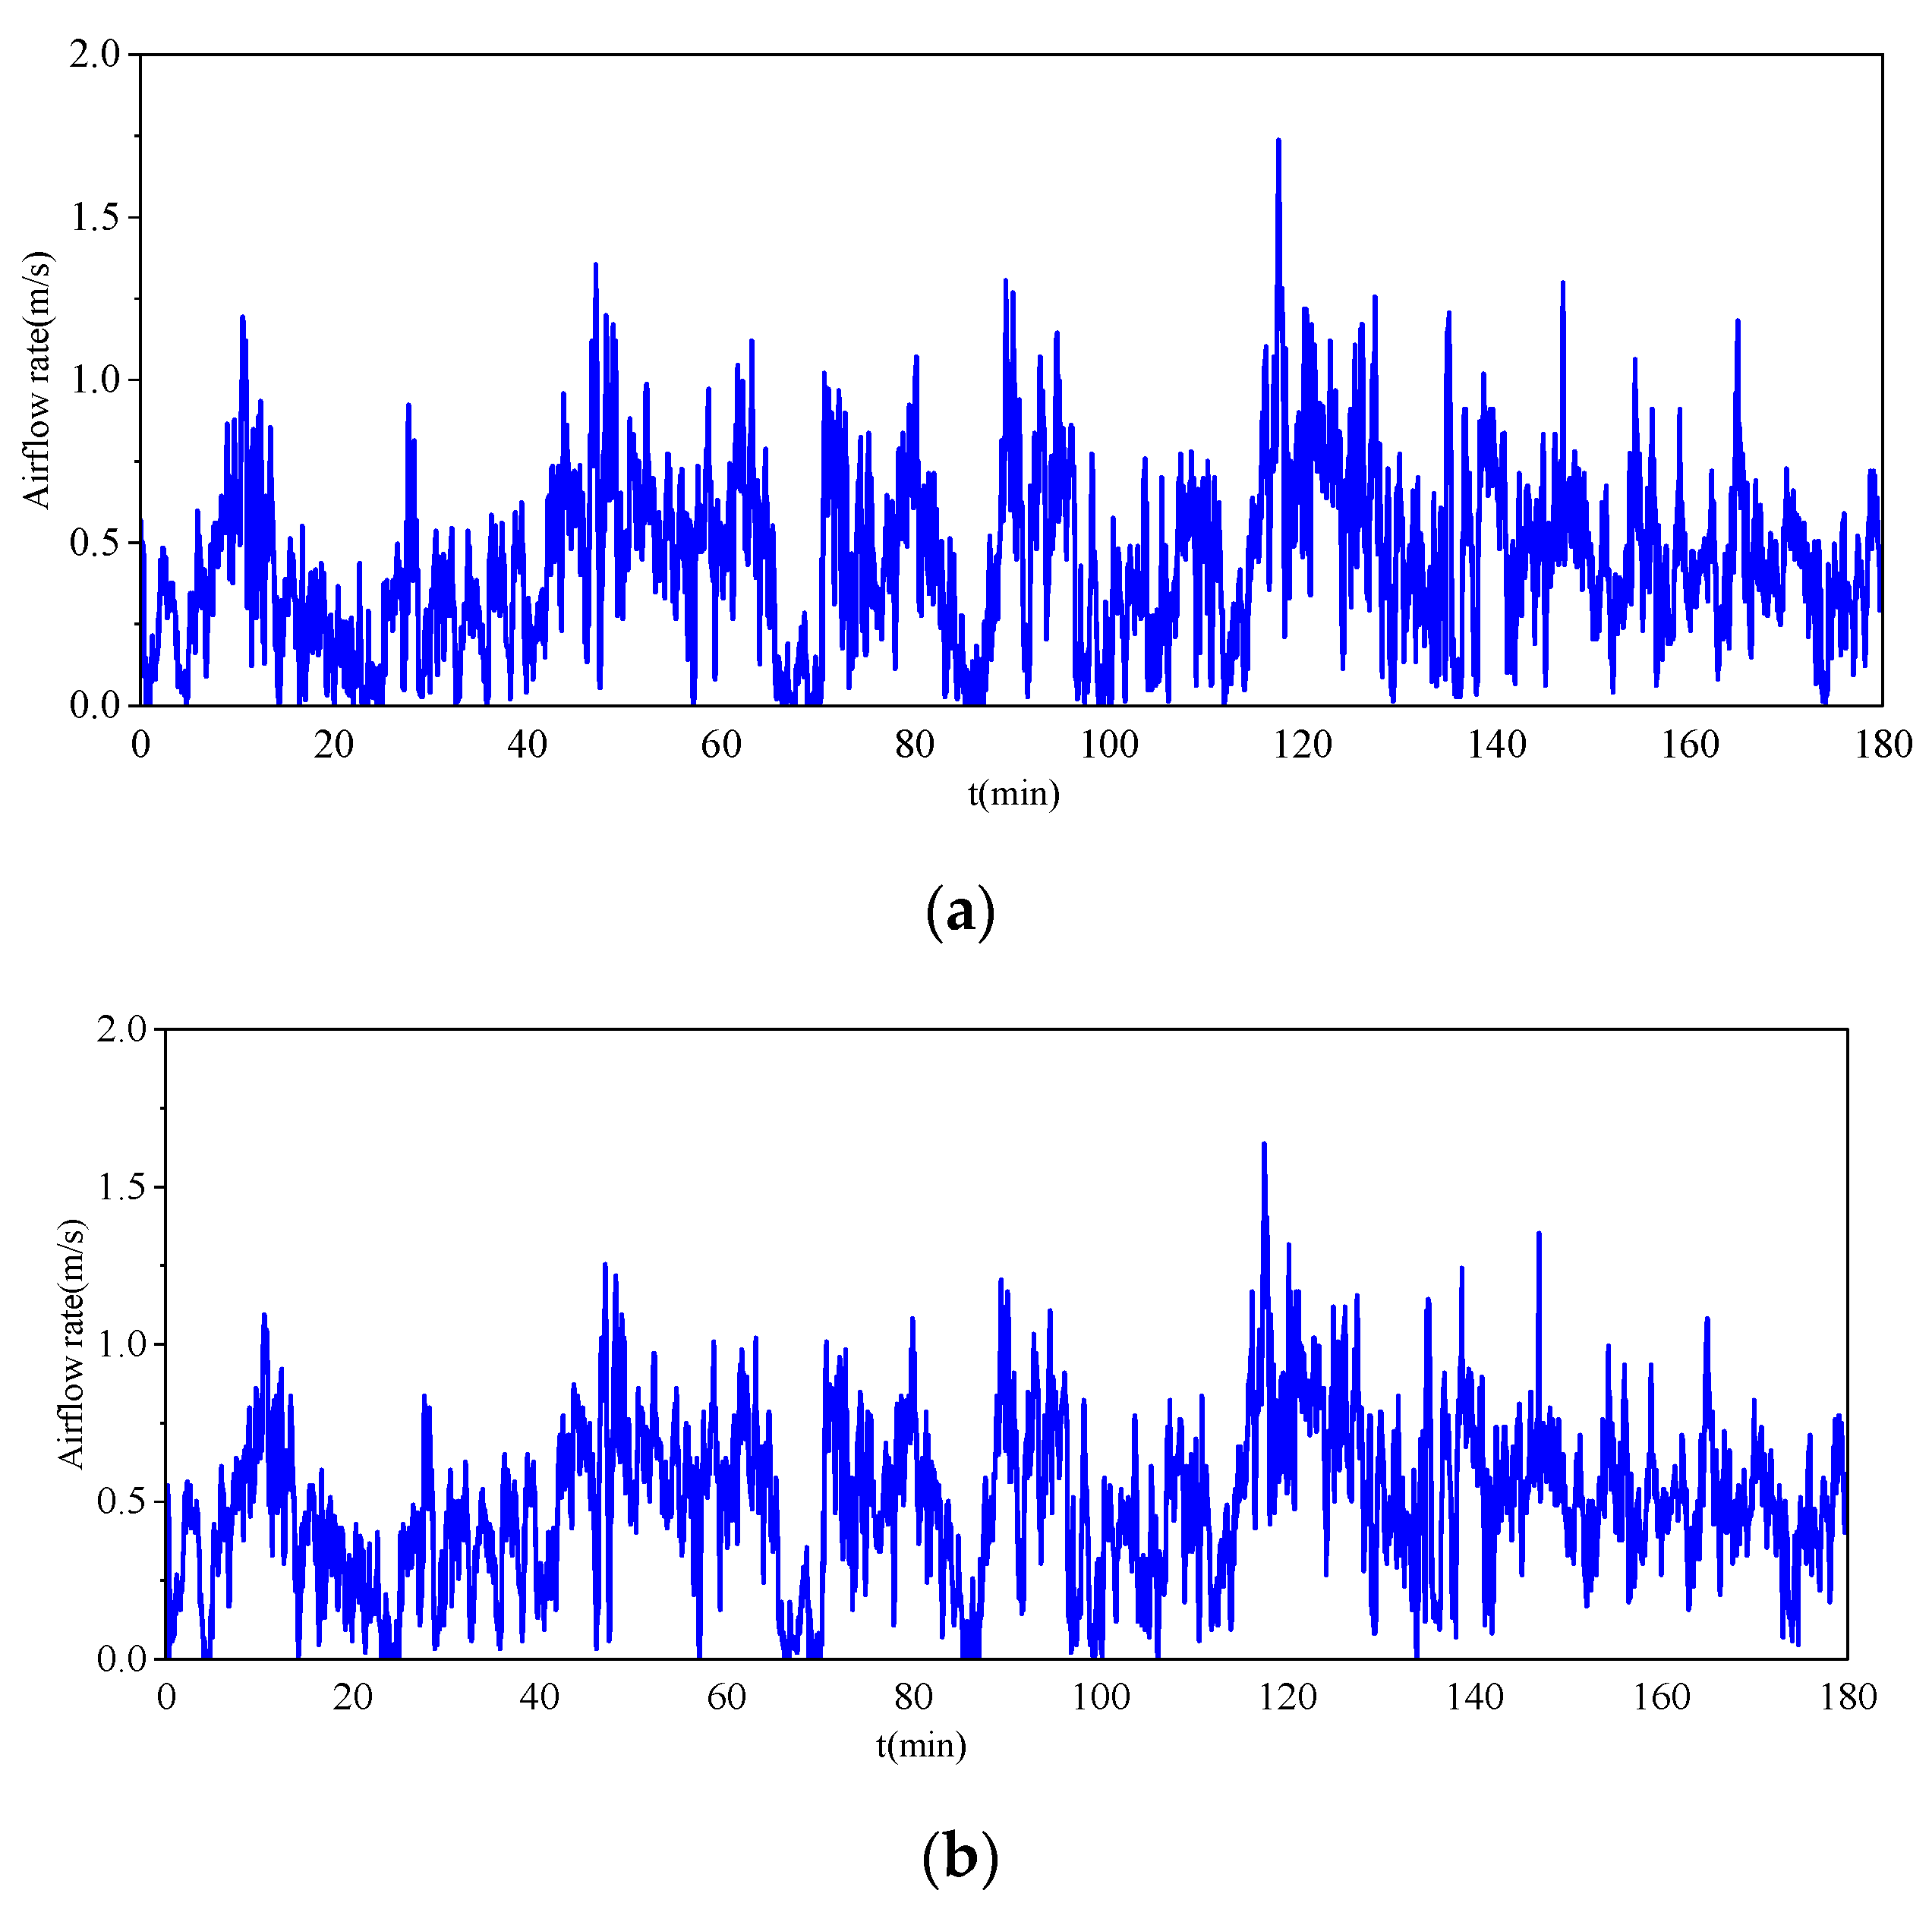
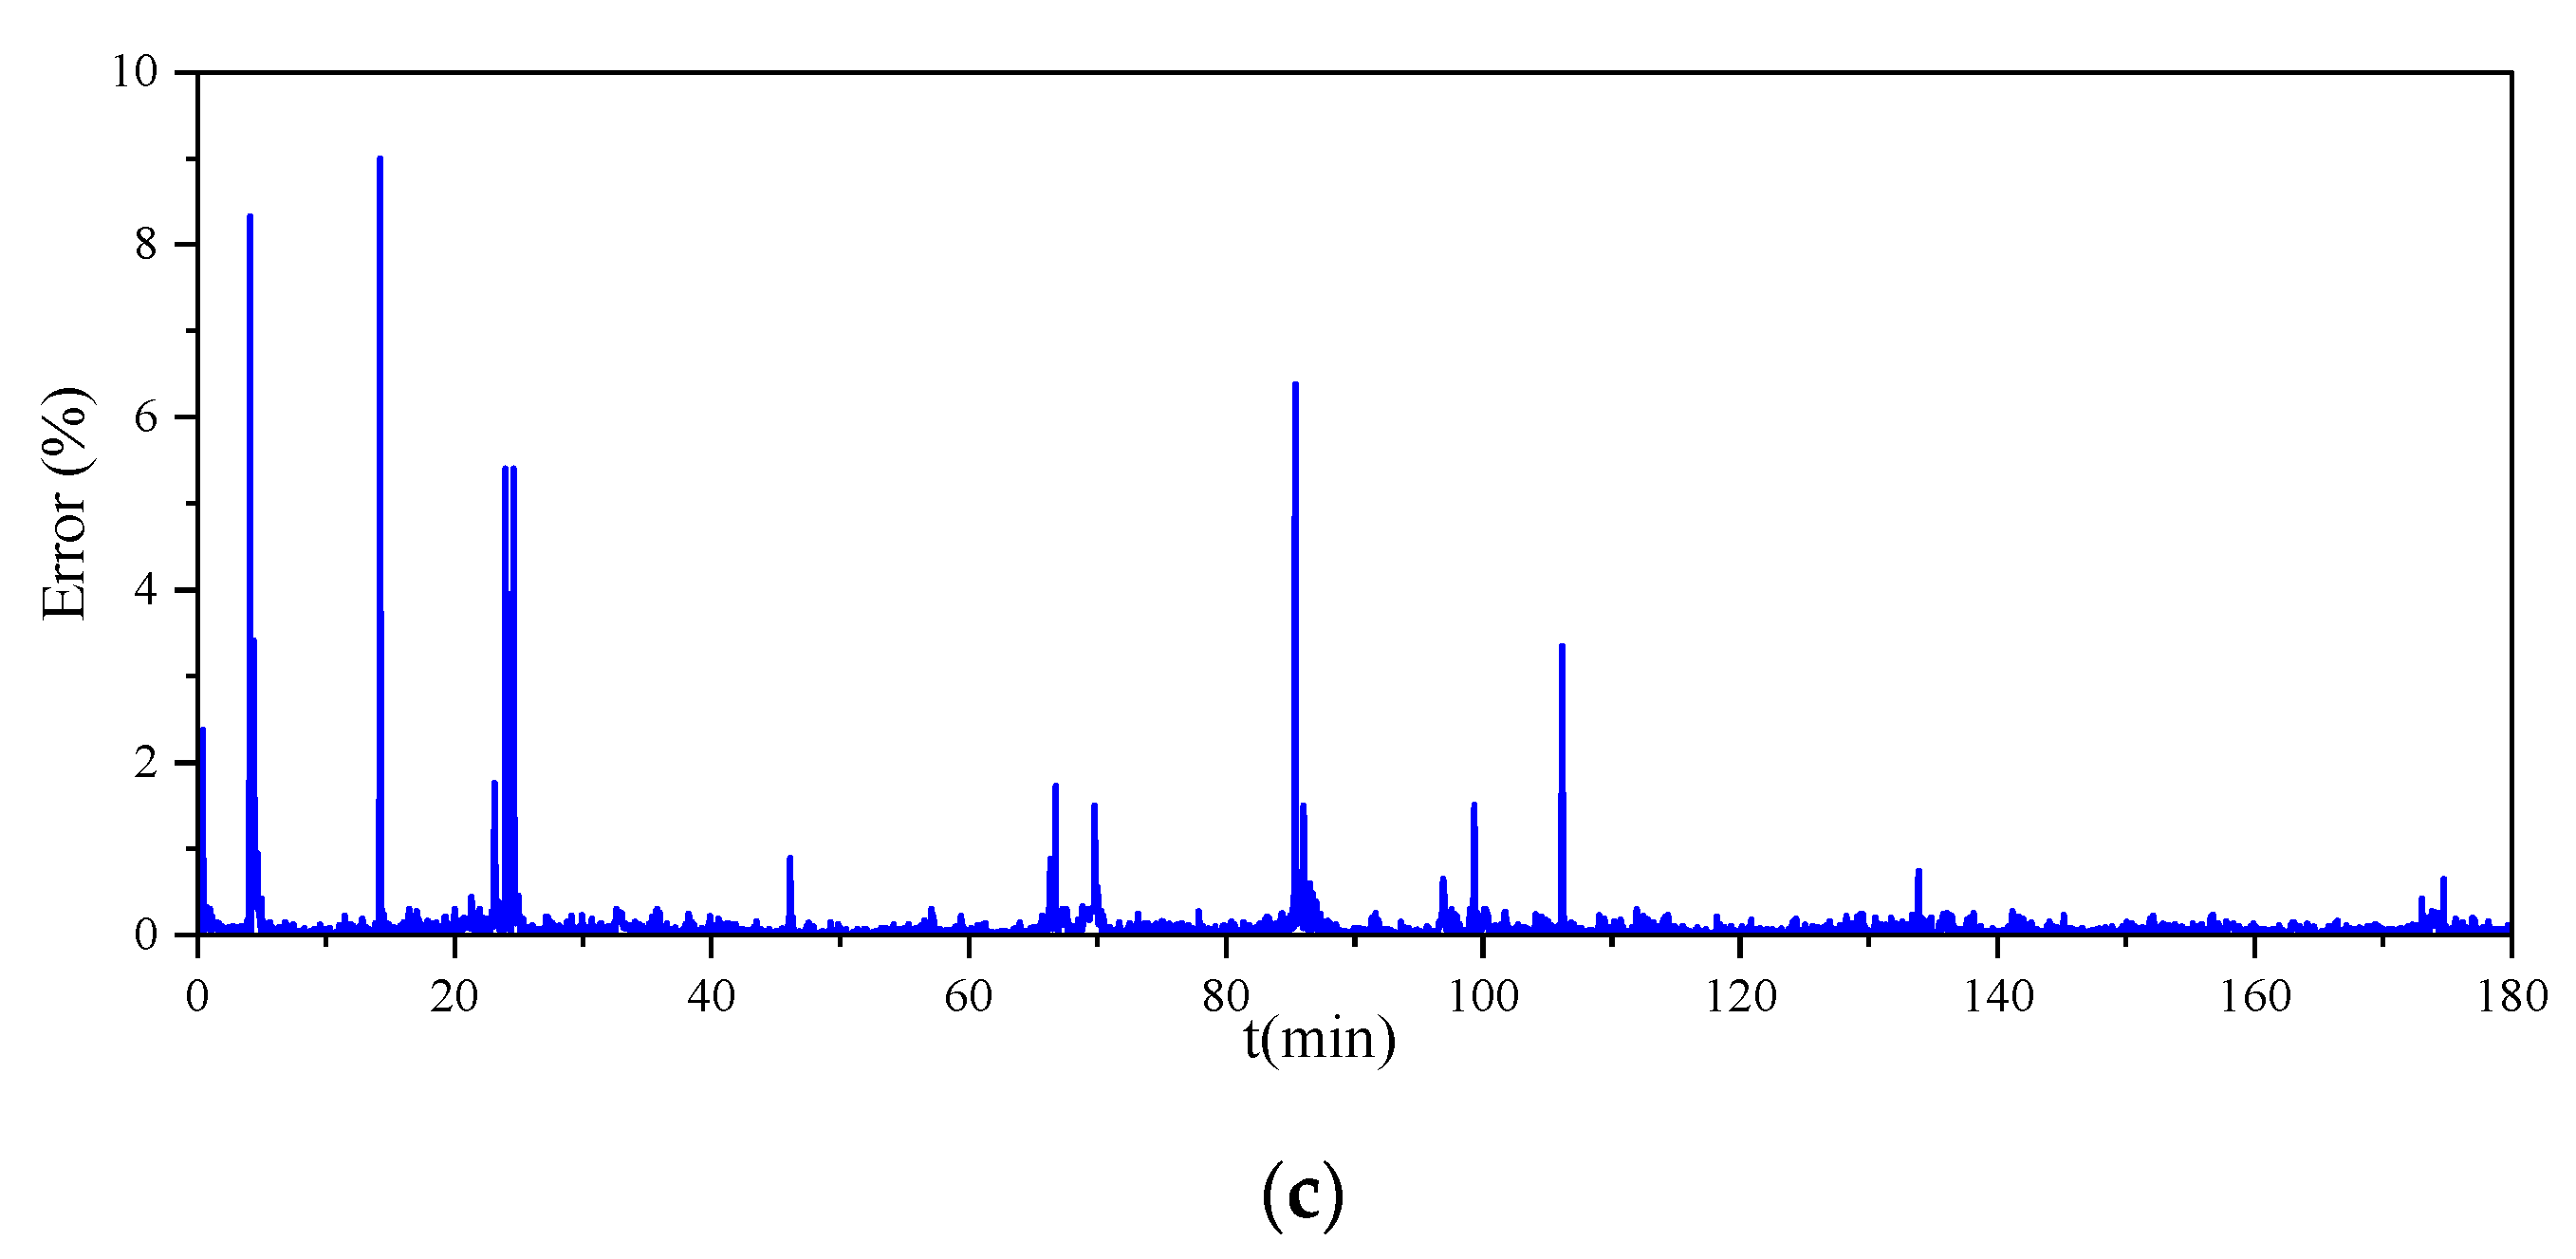
To accurately simulate the natural air-cooling conditions of the converter, the airflow rate with a total duration of 180 min was measured in an outdoor natural environment with a sampling period of 1 s. According to the measured data, similar airflow changes are generated in the experimental environment by the fan. A comparison of the airflow rate in the natural environment and the experimental environment is shown in Figure 5. It can be found that the airflow rate generated by the fan is in good agreement with the airflow rate measured outdoors. The maximum full-scale deviation between the two is only 9.1%F.S, which indicates that the experimental platform can truly simulate the random variation in airflow rate in the natural air-cooling environment.
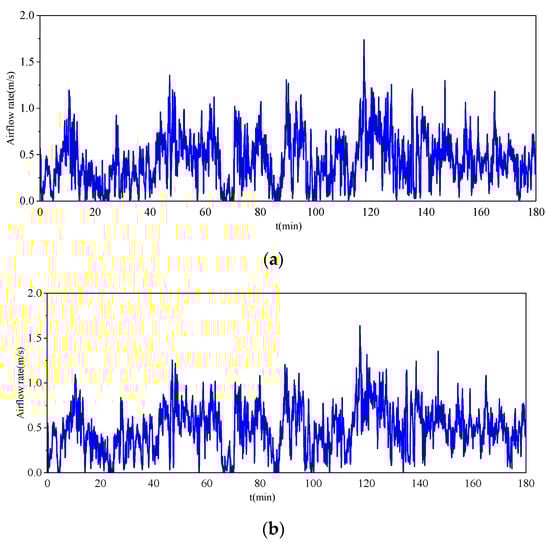
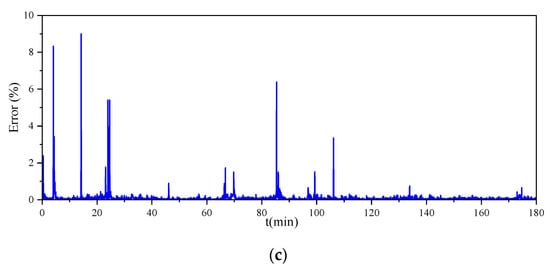
Figure 5.
Comparison of airflow rate in the natural environment and the experimental environment. (a) Airflow rate in the outdoor environment; (b) airflow rate in experimental environment; (c) full-scale deviation in airflow rate between the two environments.
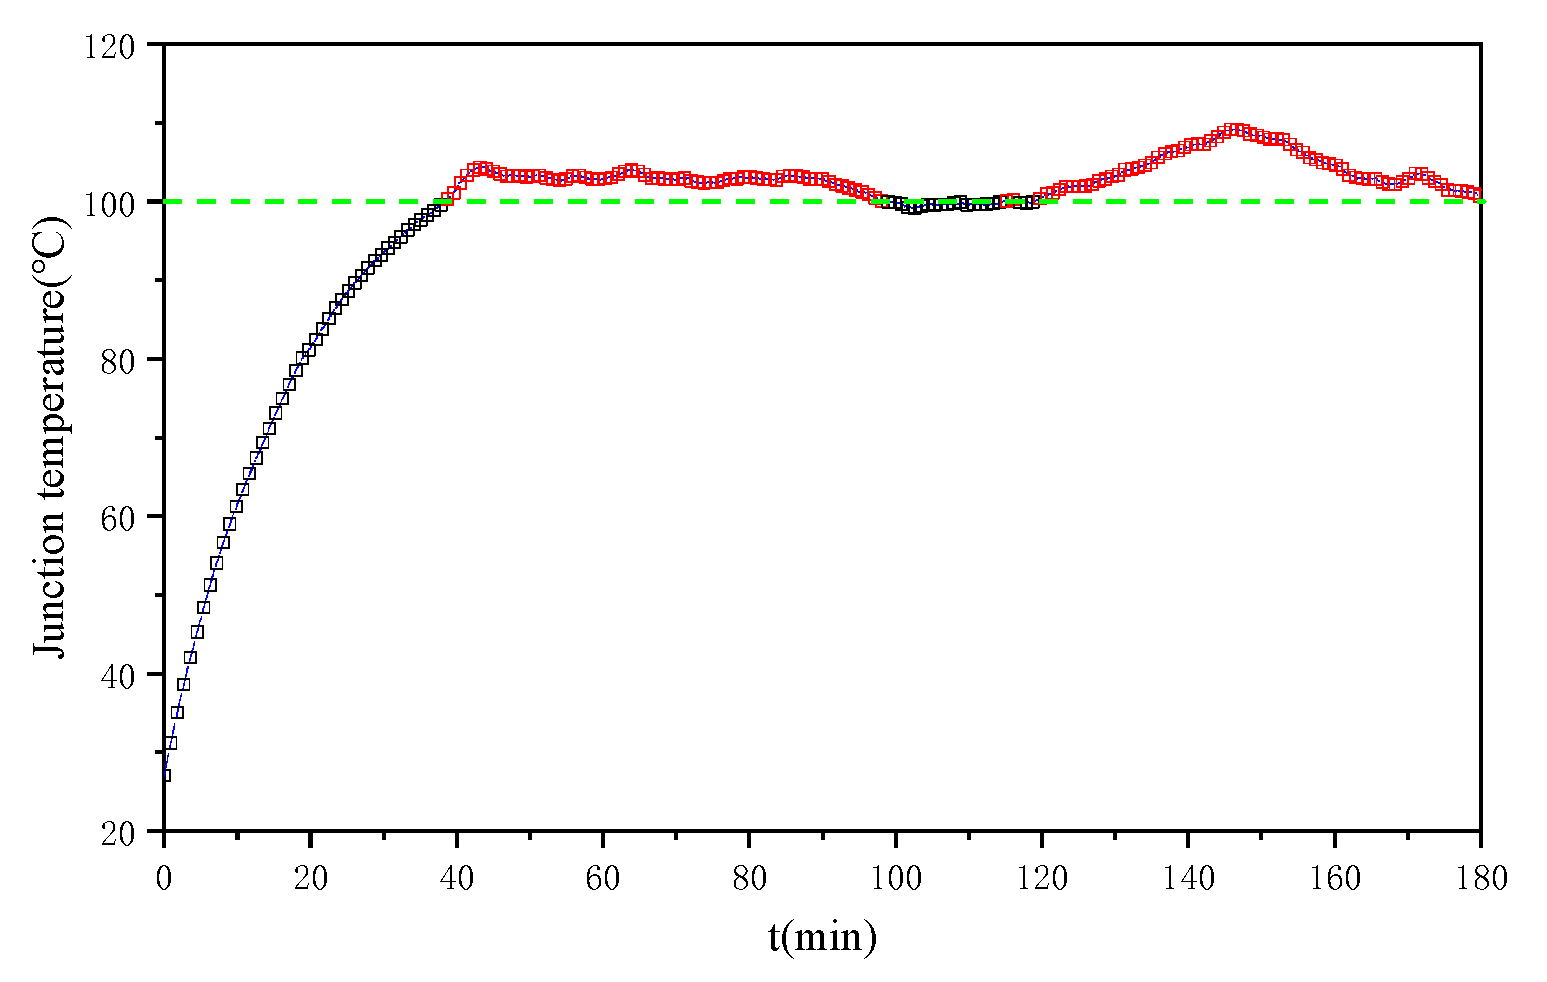
Figure 6 shows the junction temperature variation in the power device Q1 when the converter operates at a 7.5 A load current and the above random airflow rate. To conveniently observe the junction temperature fluctuation in the device under natural convection conditions, the junction temperature presented here is the peak value in each converter commutation. That is, the fluctuation in junction temperature caused by commutation is not presented in the results.

Figure 6.
Junction temperature variation in the power device Q1 when the converter operates at a 7.5 A load current with the random airflow rate.
Due to the uncertainty of the airflow in the environment, the junction temperature of the device Q1 also has strong randomness, even if the converter current is constant. In this paper, the maximum allowable junction temperature Tjmax of the device is assumed to be 100 °C. It can be found that the random junction temperature causes the over-temperature of the device in some periods. The duration of these periods is also uncertain, which greatly increases the difficulty of thermal safety assessment. The junction temperature of other power devices has similar changes, which are not described here.
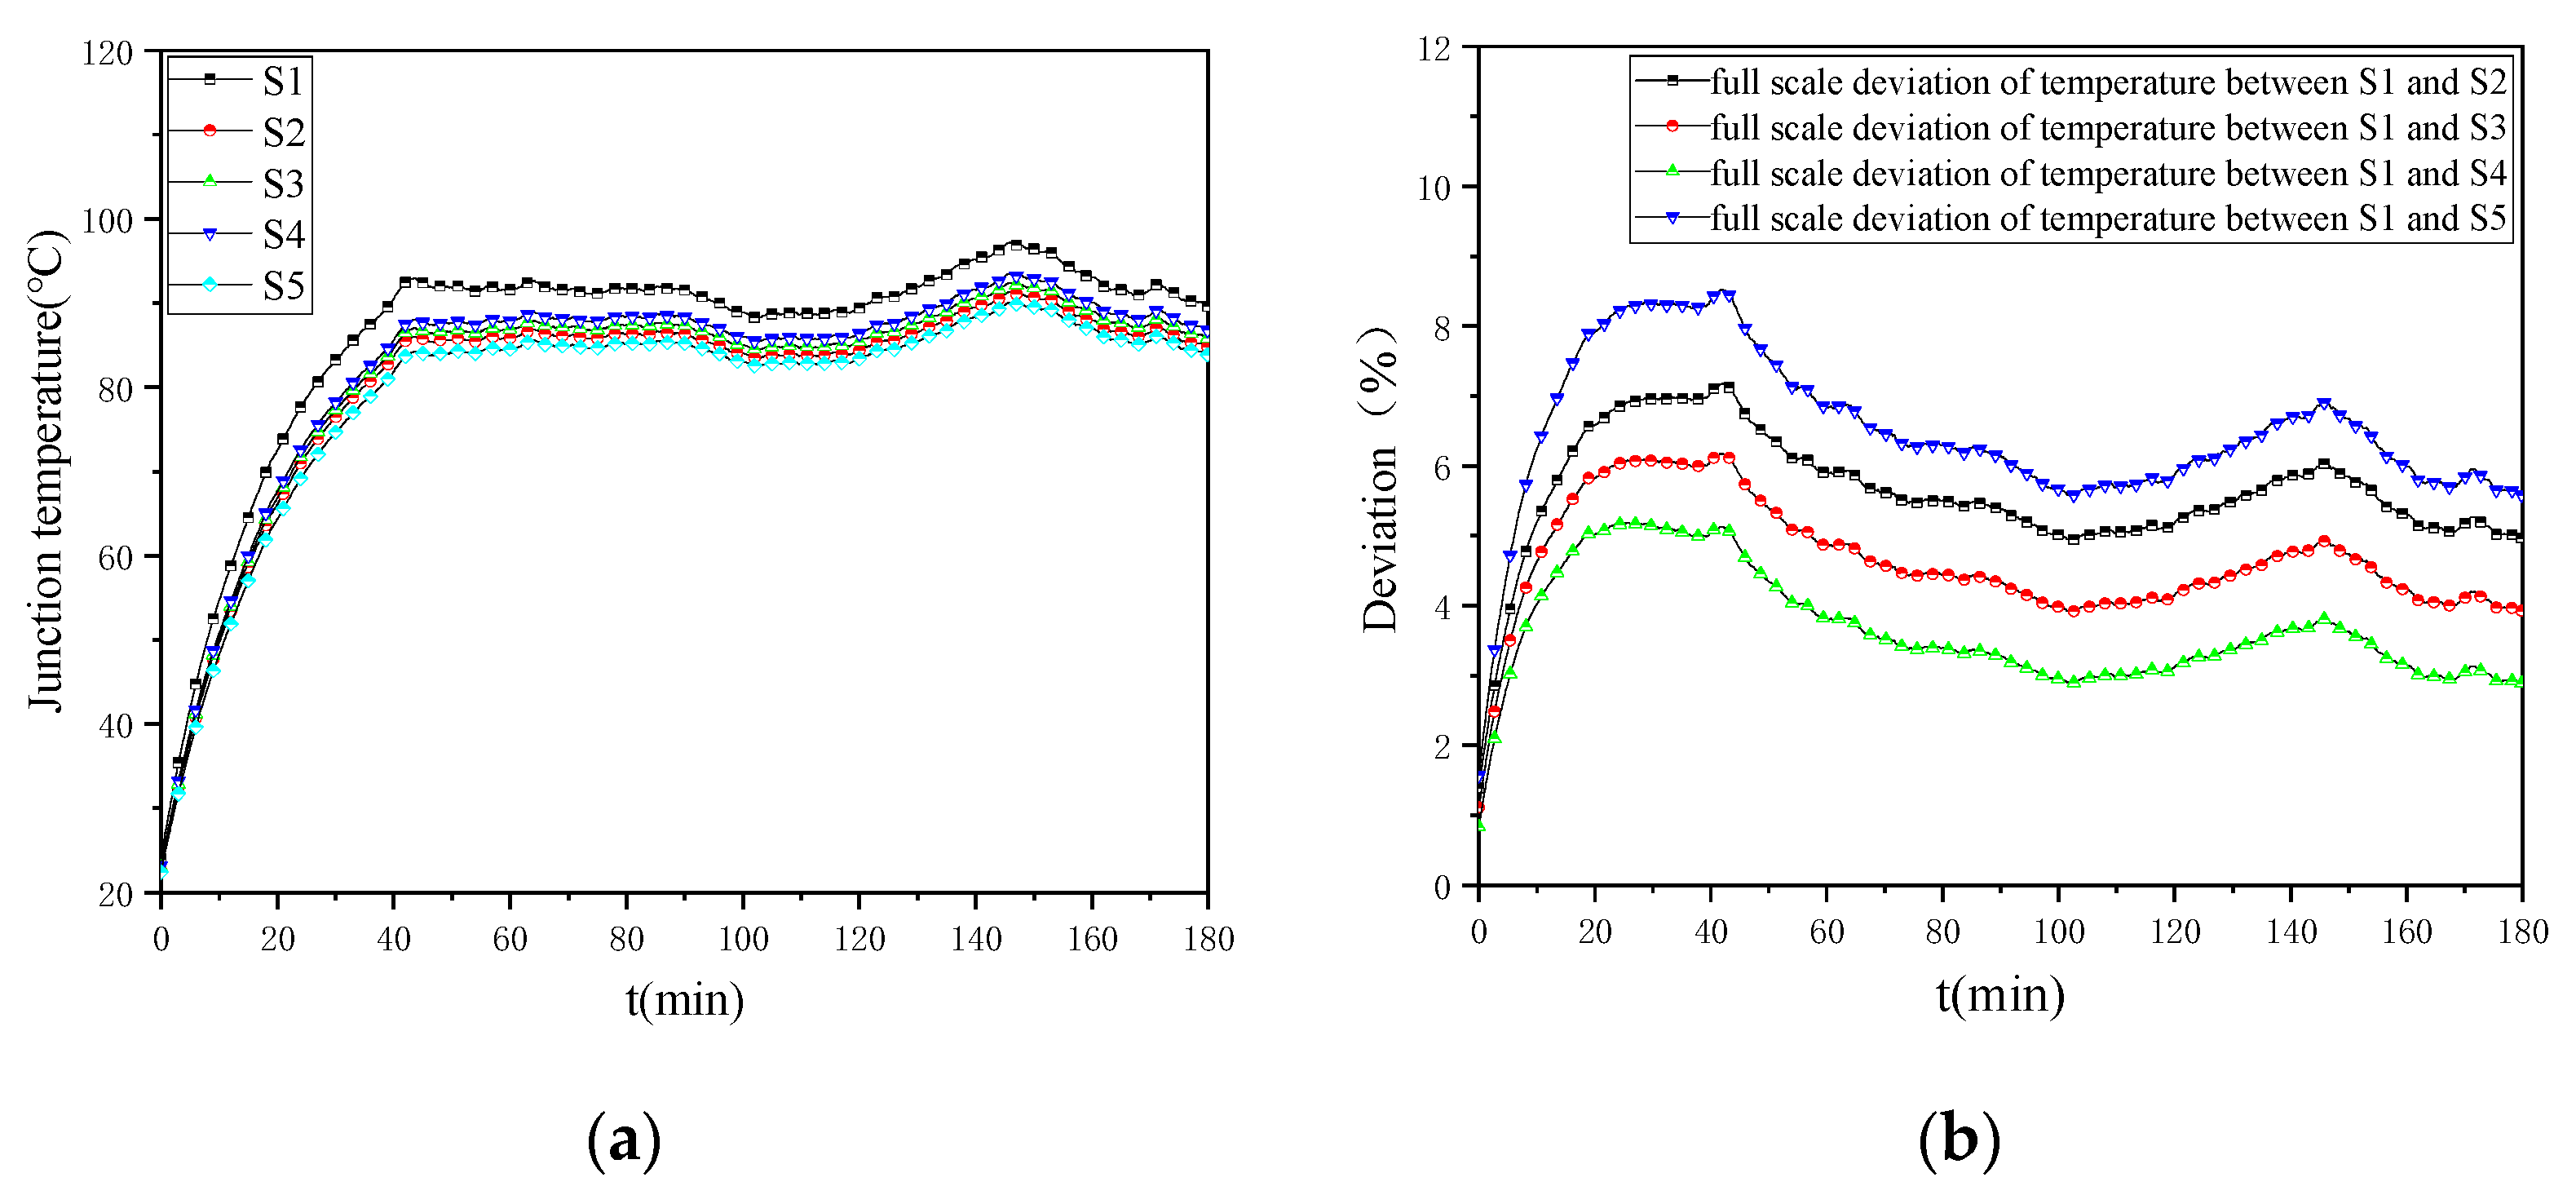
In addition, the center temperature of the five metal surfaces is also measured to verify the good thermal conductivity of the converter housing, as shown in Figure 7a. Figure 7b shows the full-scale deviation between the temperature on the surface S1 and the temperature on the other surfaces. It is easy to find that the temperature on the back surface (S1) of the housing with the power device is the highest, while the temperature of the front surface (S5) is the lowest. The maximum full-scale deviation in temperature between surface S1 and surface S5 does not exceed 8.5%F.S, indicating that the temperature difference between these surfaces is small. Therefore, the thermal conductivity of the converter housing is good and its surface temperature distribution can be ignored in this study.
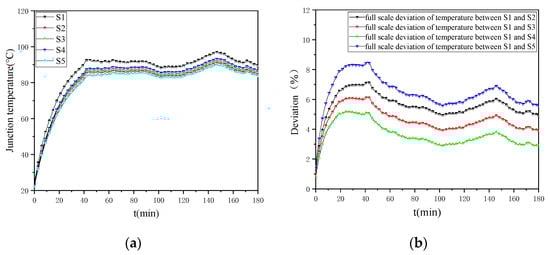
Figure 7.
Temperatures measured on the different surfaces of the housing and the full-scale deviation between the temperature on surface S1 and the temperature on other surfaces. (a) Measured temperature; (b) full-scale deviation.
3. Time–Frequency Domain Analysis for Convective Heat Resistance of Natural Air-Cooled Converters
3.1. Extracting Convective Heat Resistance of Converter Housing
Convective heat resistance is an important physical quantity for thermal analysis, since it can characterize the convective heat transfer intensity between a solid surface and an ambient environment [21,22]. In order to quantify the influence of airflow rate on the heat-dissipation capacity of the converter housing and the junction temperature of the device, it is necessary to extract the convective heat resistance of the housing and analyze its characteristics. According to heat transfer theory, convective heat resistance has complex time-varying characteristics because it is related to many nonlinear factors such as ambient wind speed, density, dynamic viscosity, and atmospheric pressure [23]. As a result, it is difficult to accurately calculate convective heat resistance by theoretical methods. In this paper, the samples of convective heat resistance are extracted using the equivalent thermal network model and the historical operation temperature of the converter.
By discretizing at time k, (2) and (3) are rewritten as
where is the discrete step size.
Then, the convective heat resistance of the housing at time k is expressed as
where
It can be found from (5) that the convective heat resistance of the converter housing can be calculated by using the historical data of case temperature , housing temperature and ambient temperature . The extraction of convective heat resistance samples is completed by forming the calculated results into a time series .
3.2. Principle of Wavelet Packet Transform
Since the variation in airflow rate in the natural environment has obvious frequency domain characteristics, the convective heat resistance of converter housing is a special random process with frequency characteristics. To grasp the variation rule of convective heat resistance, it is necessary to analyze the samples of convective heat resistance in a time–frequency domain.
Wavelet packet transform is a typical time–frequency domain analysis method that reflects the variation characteristics of signals in different frequency bands by using different groups of wavelet packet coefficients [24]. The wavelet packet coefficients are obtained by wavelet decomposition, which is given by
where l is the number of decomposition layers, which affects the number of decomposed frequency bands. z is the wavelet packet coefficient number. v and w represent different time steps. and are the even- and odd-numbered wavelet packet coefficients in the l + 1 layer, respectively. h(w−2v) and g(w−2v) are the low-pass and high-pass filter coefficients, respectively, which are related to the selected wavelet basis function.
The decomposed signal can be restored by the layer-by-layer reconstruction of wavelet packet coefficients. Wavelet packet reconstruction is expressed as
where and are the low-pass and high-pass filter coefficients of wavelet packet reconstruction, respectively.
3.3. Time–Frequency Domain Characteristics of Housing Convective Heat Resistance
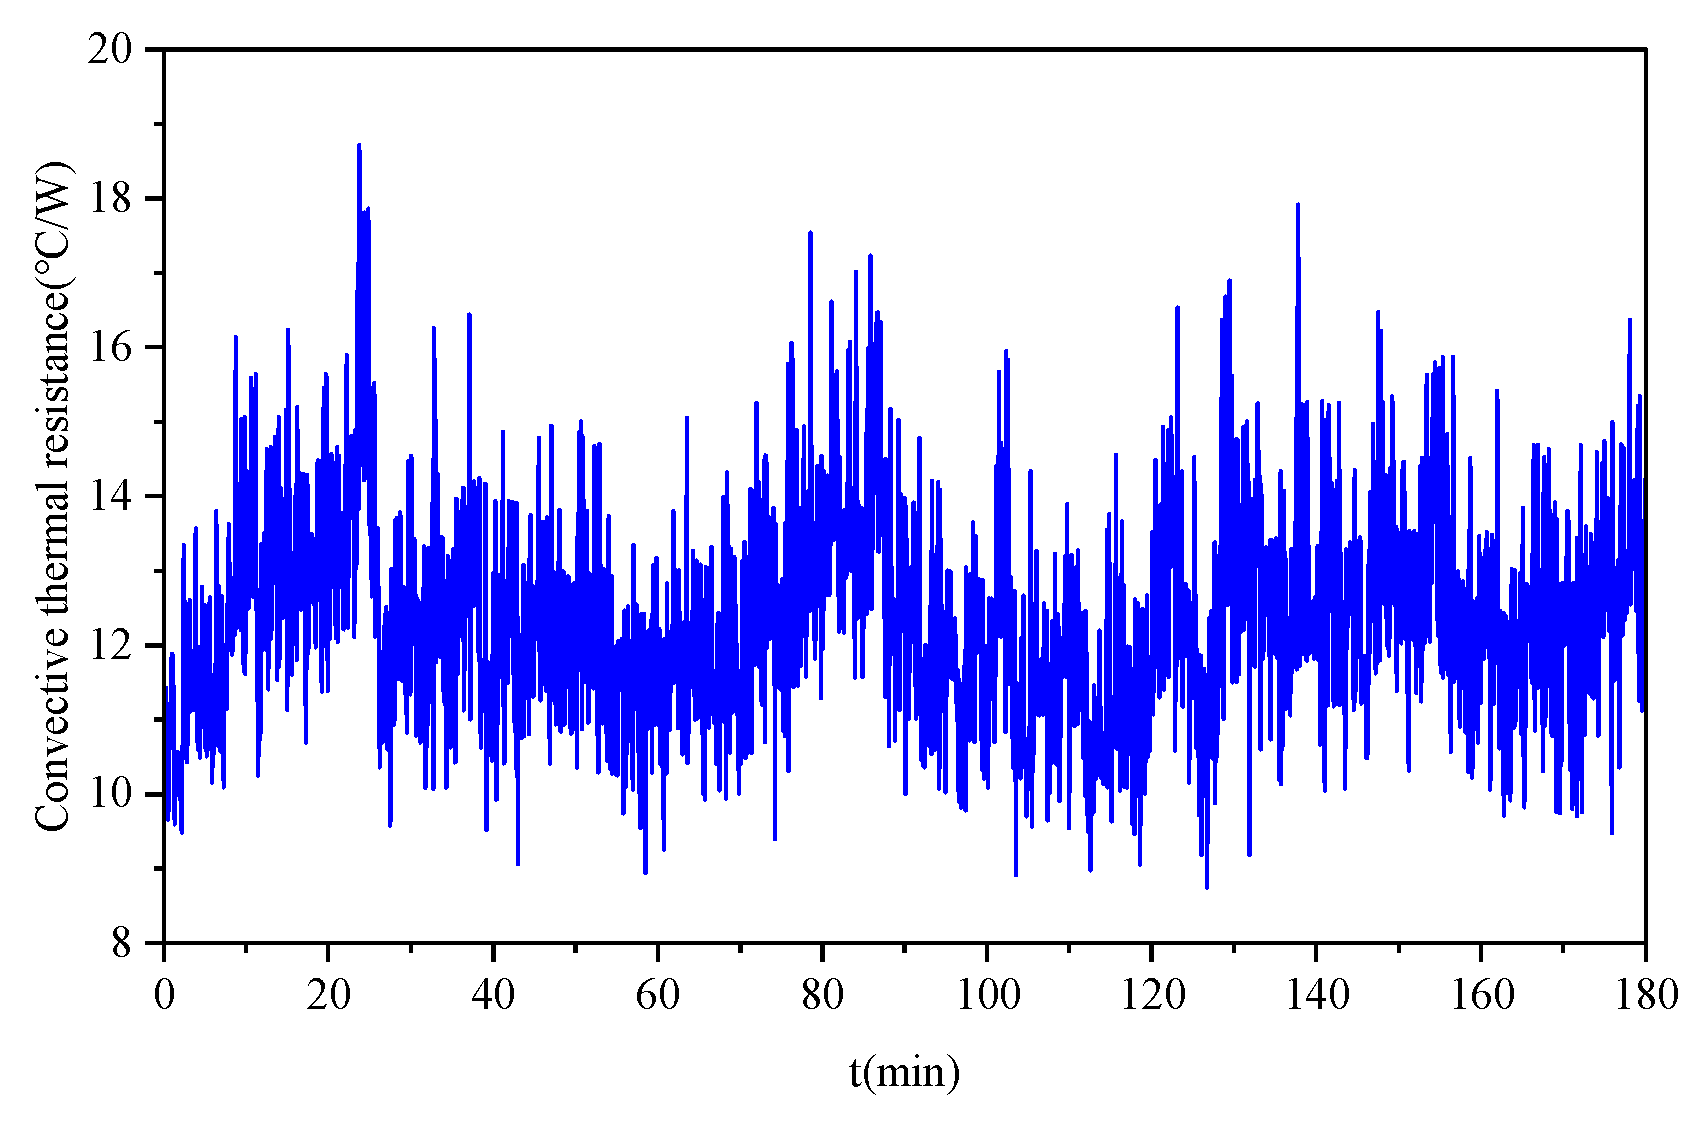
The convective heat resistance of the converter housing in the natural air-cooling environment shown in Figure 8 is extracted with (5). The extracted convective heat resistance samples are shown in Figure 6. Then, these samples are analyzed by the wavelet packet transform. The basis function of the wavelet packet transform is 30 dB wavelets, and the decomposition layer is three layers.

Figure 8.
Convective heat resistance samples of the converter housing.
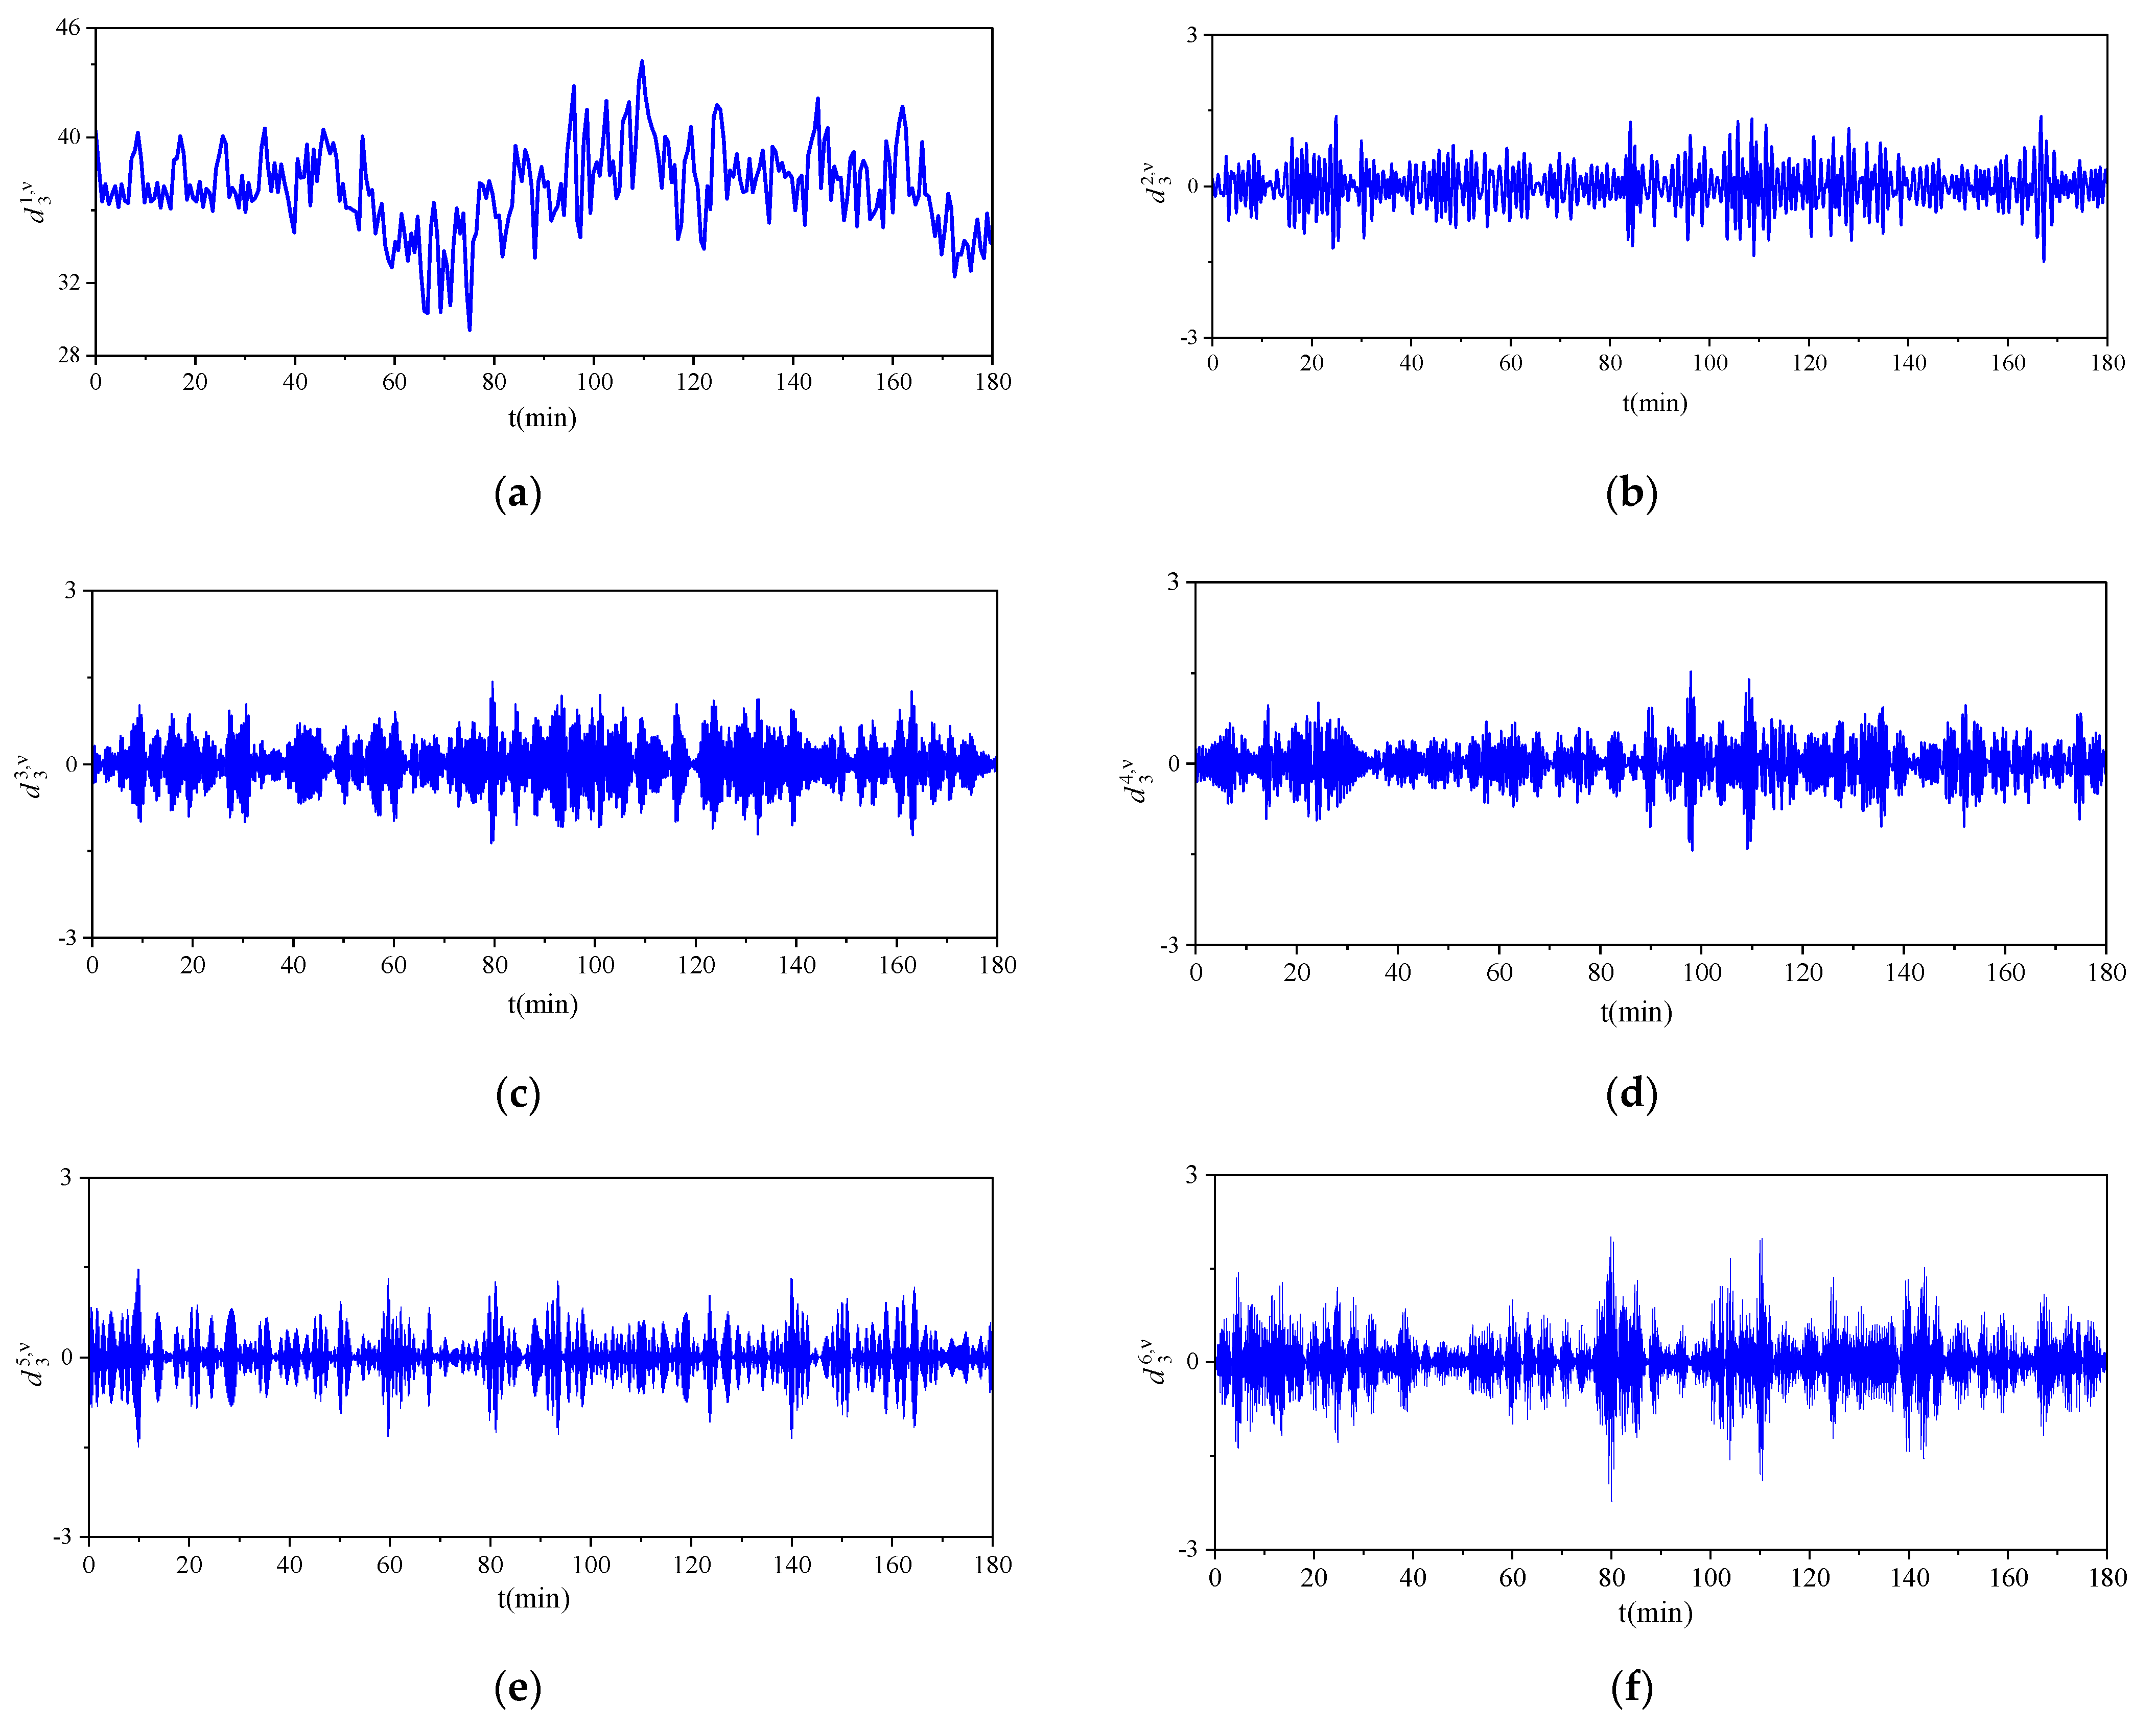
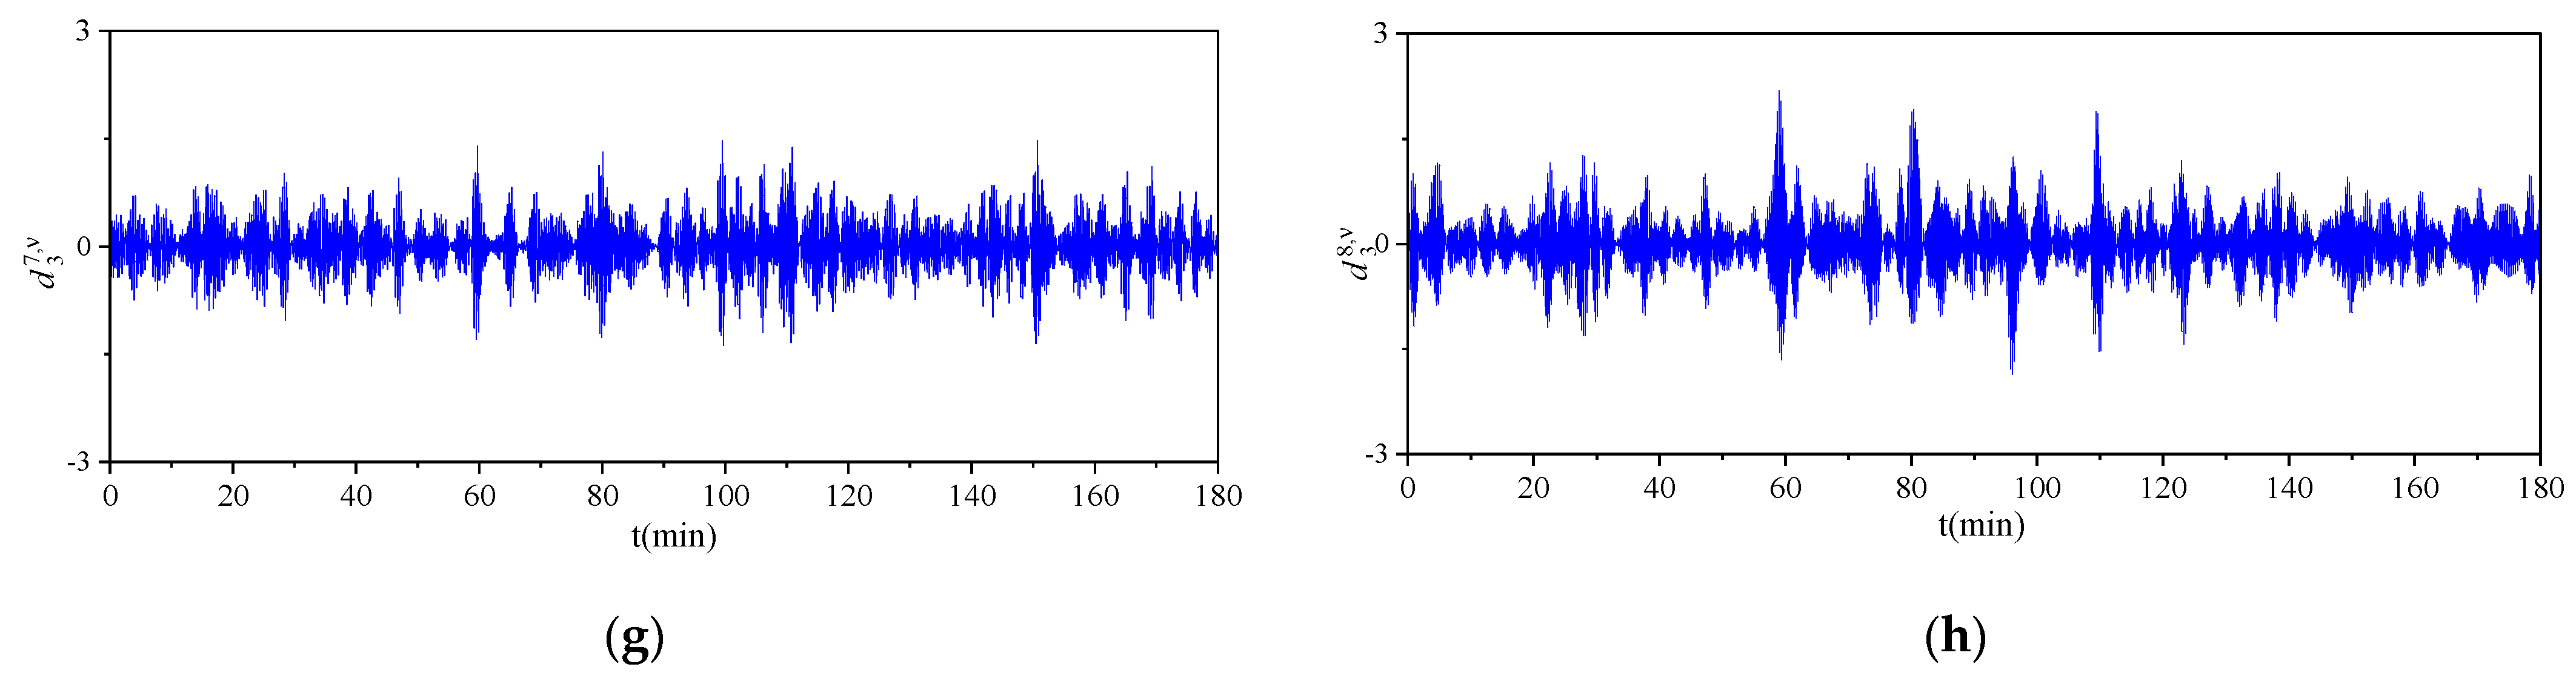
After wavelet packet decomposition, the wavelet packet coefficients in eight frequency bands are obtained. These wavelet packet coefficients are represented by to , and are shown in Figure 9. Since the upload period of experimental data in the experimental platform is 1 s, the signal frequency range that the wavelet packet transform can analyze is 0 Hz to 0.5 Hz.
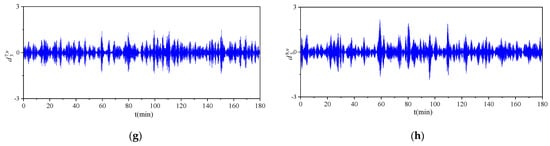
Figure 9.
Wavelet packet coefficients in different frequency bands. (a) Frequency band 1 (0 to 0.0625 Hz), (b) frequency band 2 (0.0625 to 0.125 Hz), (c) frequency band 3 (0.125 to 0.1875 Hz), (d) frequency band 4 (0.1875 to 0.25 Hz), (e) frequency band 5 (0.25 to 0.3125 Hz), (f) frequency band 6 (0.3125 to 0.375 Hz), (g) frequency band 7 (0.375 to 0.4375 Hz), (h) frequency band 8 (0.4375 to 0.5 Hz).
The variations in wavelet packet coefficients directly reflect the fluctuation degree of the signals in various frequency bands. It is easy to find that the wavelet packet coefficients have a large amplitude change in the frequency band of 0 Hz to 0.0625 Hz, which indicates that the fluctuation in convective heat resistance in the low-frequency band is more intense than that in the high-frequency band. The variation law of convective heat resistance affects the fluctuation characteristics of the device junction temperature, so it should be considered in the thermal safety assessment.
4. The Proposed Thermal Safety Assessment Method
In this section, a method is proposed to assess the thermal safety of natural air-cooled converters in the form of the over-temperature probability of power devices. Since the thermal safety assessment involves how to reflect random fluctuations in device junction temperature, the Monte Carlo principle for random simulation is first introduced. Then, the principle of the proposed method and the over-temperature risk function of the device are given. Finally, the proposed method is verified with the experimental data.
4.1. Monte Carlo Principles
The basic idea of the Monte Carlo method is to transform the problem to be solved into a probability distribution calculation by random sampling and then obtain the numerical solution of the problem [25]. The calculation process of the Monte Carlo method mainly includes three steps: constructing the probability process, realizing probability distribution sampling, and establishing an estimator [26]. Firstly, the problem should be correctly described as a probability process, as some variables in this process are exactly the solution to the problem. Then, the random sampling process of the Monte Carlo method is realized by using random variables with known probability distributions. Finally, the sampling results are calculated and counted so as to obtain an unbiased estimation of the solution to the problem.
In the Monte Carlo method, the arithmetic mean of the simple sample Z1, Z2 … Zn of the random variable Z is used as the approximate solution to the problem, as shown in the following formula:
where N is the total number of samples and ZN is the arithmetic mean value calculated from N random variable samples. According to the law of large numbers, if Z1, Z2 … Zn satisfies the independent and identical distribution and has a finite expected value (E(Z) < ∞), then the formula can be obtained.
That is, when the number of samples of random variable Z is large enough, the average value of all sub-samples will converge to the expected value of the solution to the problem with a probability of 1.
In this paper, the wavelet packet coefficients extracted from the convective heat resistance samples are statistically analyzed by this method, and the probability density function is obtained. Finally, the convective heat resistance components in different frequency bands are calculated.
4.2. Proposed Assessment Method
Based on wavelet packet transform and the Monte Carlo principle, a thermal safety assessment method for power devices in natural air-cooled converters is proposed, as shown in Figure 10. The proposed method consists of four main steps.
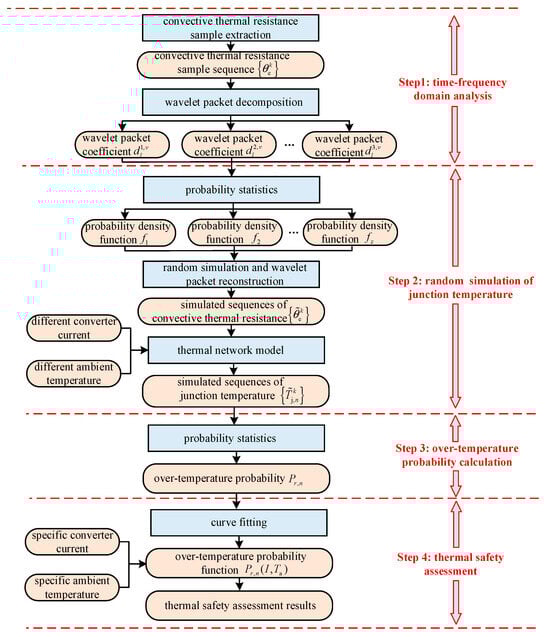
Figure 10.
Principle block diagram of the proposed method.
Step 1 is applied to extract the convective heat resistance samples of the converter housing and perform the time–frequency domain analysis, as described in the previous section. Step 2 is mainly used to realize the Monte Carlo simulation of the device junction temperature. For this purpose, the wavelet packet coefficients of convective heat resistance in the different frequency bands are statistically analyzed to construct their probability density functions (PDFs) f1 to fz. According to these PDFs, the wavelet packet coefficients are randomly simulated and reconstructed to generate several simulated sequences for convective heat resistance. The simulated sequences of device junction temperature can be generated by substituting the sequence , different converter current I and ambient temperature Ta into the equivalent thermal network model of the converter. In step 3, the over-temperature probability of the device n, which is related to the converter current and ambient temperature, can be obtained with the probability statistics of the simulated junction temperature. In the last step, an over-temperature probability function is established by data fitting and used to assess the thermal safety of the device at the specific converter current and ambient temperature.
Since the wavelet packet transform and Monte Carlo methods describe the random effect of convective heat resistance on the device junction temperature under different frequency bands, the junction temperature fluctuation can be effectively simulated in the natural air-cooling environment. With the junction temperature obtained by random simulation, the proposed method is able to assess the thermal safety of the device in the form of over-temperature probability under different converter currents and ambient temperatures.
4.3. Over-Temperature Risk Function
It is well known that under specific thermal convection conditions, the over-temperature risk of power devices increases with the increase in power loss and ambient temperature. The converter used in this study is a voltage source converter with output square-wave voltage. Since the amplitude of the square-wave output voltage and the bus voltage is constant, the device loss (including switching loss and on-state loss) in the converter is positively correlated with the load current I. Because of this, a two-variable growth function related to the converter load current and ambient temperature is employed to describe the over-temperature probability of the device. The growth function used in this paper is a Pearl function, which has the advantages of a simple structure and fewer variables [27]. According to the principle of Pearl function, the over-temperature probability Pr,n(I, Ta) of device n can be expressed as
where α(Ta), β(Ta) and γ(Ta) are coefficients of the Pearl function with respect to the ambient temperature Ta.
These coefficients can be obtained by fitting polynomials, which are given by
where μi, δi and εi are polynomial coefficients.
If the amplitude of the output voltage or the bus voltage is dynamically changing, the load current cannot accurately reflect the device loss. Consequently, for some converters such as current source inverters or battery chargers, the converter power should be used instead of the load current as the variable to calculate the over-temperature probability of the power device.
4.4. Validation and Analysis
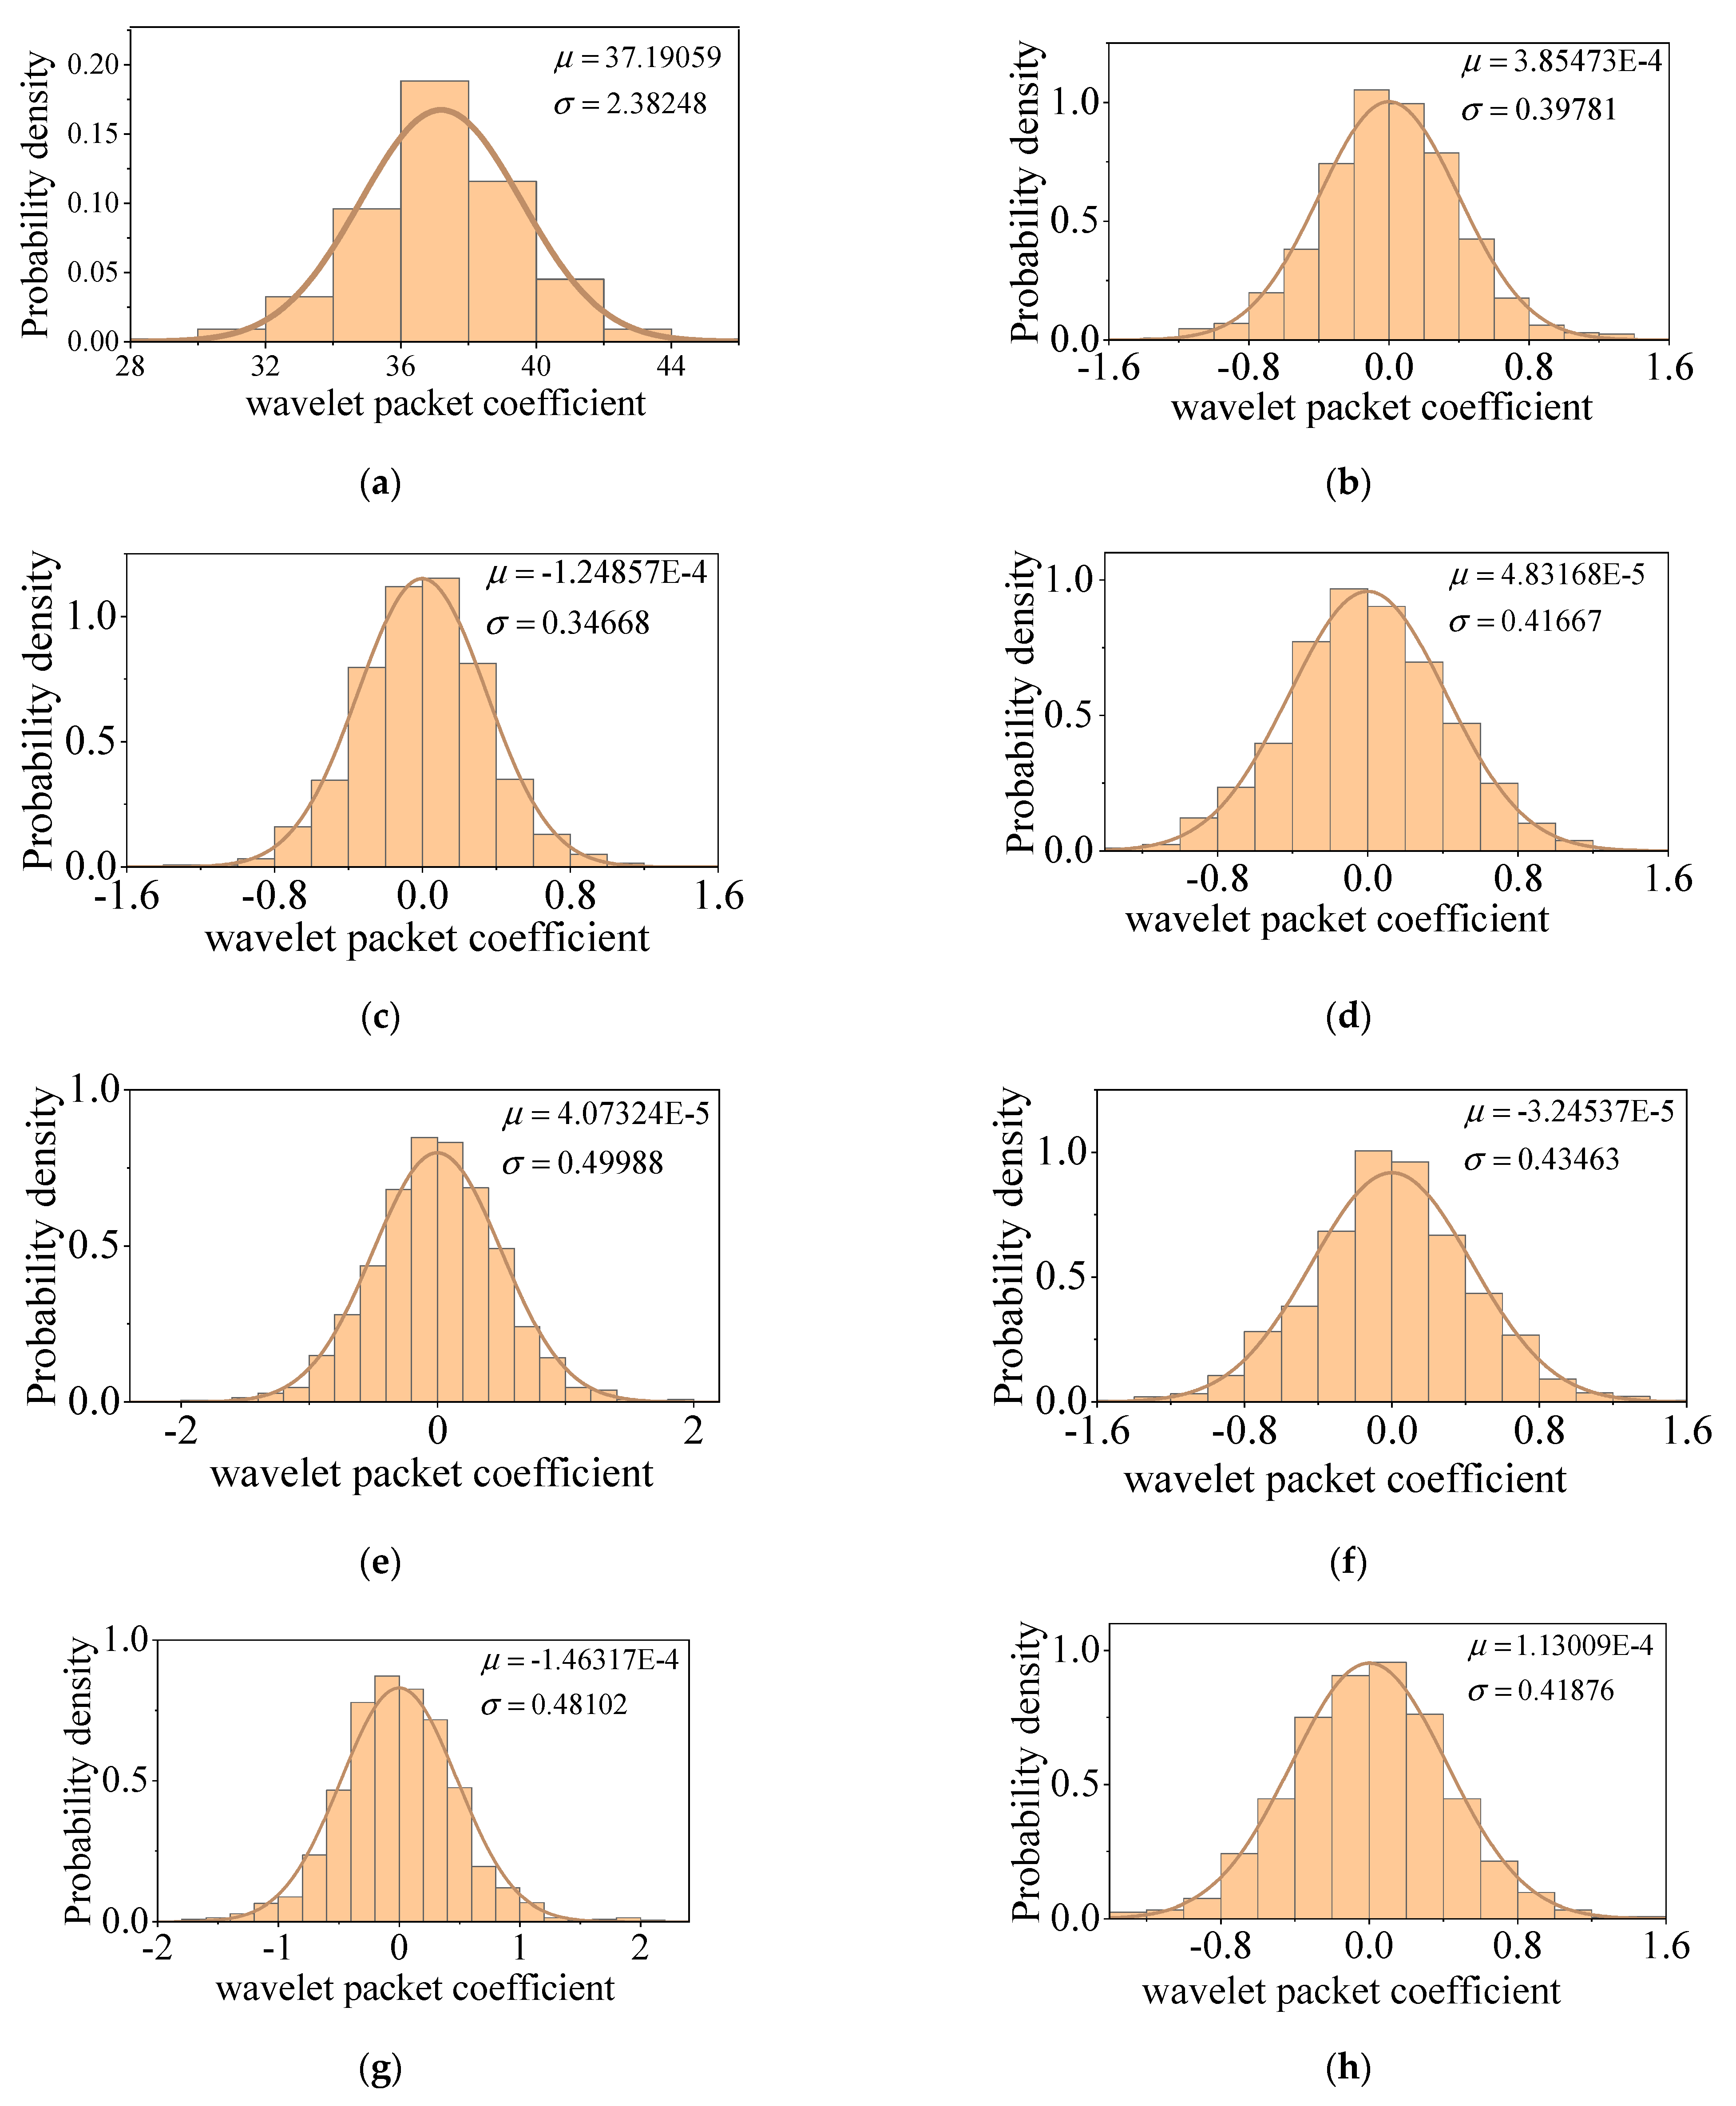
The probability of the wavelet packet coefficients for the convective heat resistance samples shown in Figure 7 is statistically analyzed by the proposed method. Figure 11 shows the probability density function of the wavelet packet coefficients in different frequency bands. From the results, it can be found that the wavelet packet coefficients in the experiment in this paper basically obey the normal distribution.
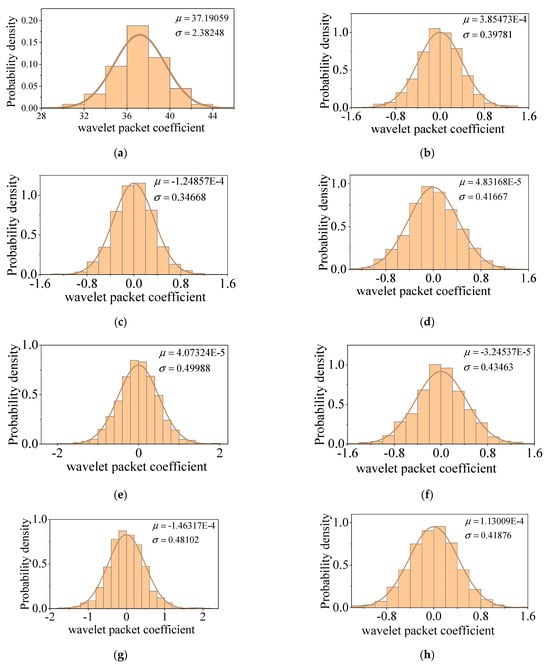
Figure 11.
The probability density functions for the wavelet packet coefficients of convective heat resistance under different frequency bands. (a) Probability density function f1, (b) probability density function f2, (c) probability density function f3, (d) probability density function f4, (e) probability density function f5, (f) probability density function f6, (g) probability density function f7, (h) probability density function f8.
The simulation sequences of convective heat resistance are obtained by the random simulation and reconstruction of the above wavelet packet coefficients. The number of convective heat resistance sequences simulated in this paper is 200. The greater the number of simulation sequences, the richer the simulation samples. This is beneficial to improve the statistical accuracy of over-temperature probability, but it will increase the amount of calculation. Therefore, it is necessary to reasonably select the number of simulations in practical engineering according to hardware resources.
Figure 12 shows a comparison of the power density spectrum between the simulated sequence and the sample sequence of convective heat resistance. Power spectral density is a random process analysis method that reflects the distribution characteristics of signal power at different frequencies [28]. The similarity between different power spectral densities can be used to analyze the difference in random characteristics between different random processes. According to the Pearson correlation coefficient calculation method [29], the similarity of the power spectral density between the simulated sequence and the sample sequence is 98.53%. Since the similarity is close to 1, the random characteristics between the simulated sequence and the sample sequence are basically the same. This indicates that the proposed method accurately simulates the random characteristics of convective heat resistance in natural air-cooling environments.
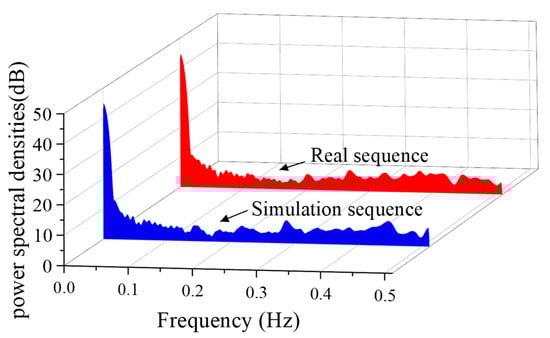
Figure 12.
Power spectral densities of the sample sequence and the simulated sequences.
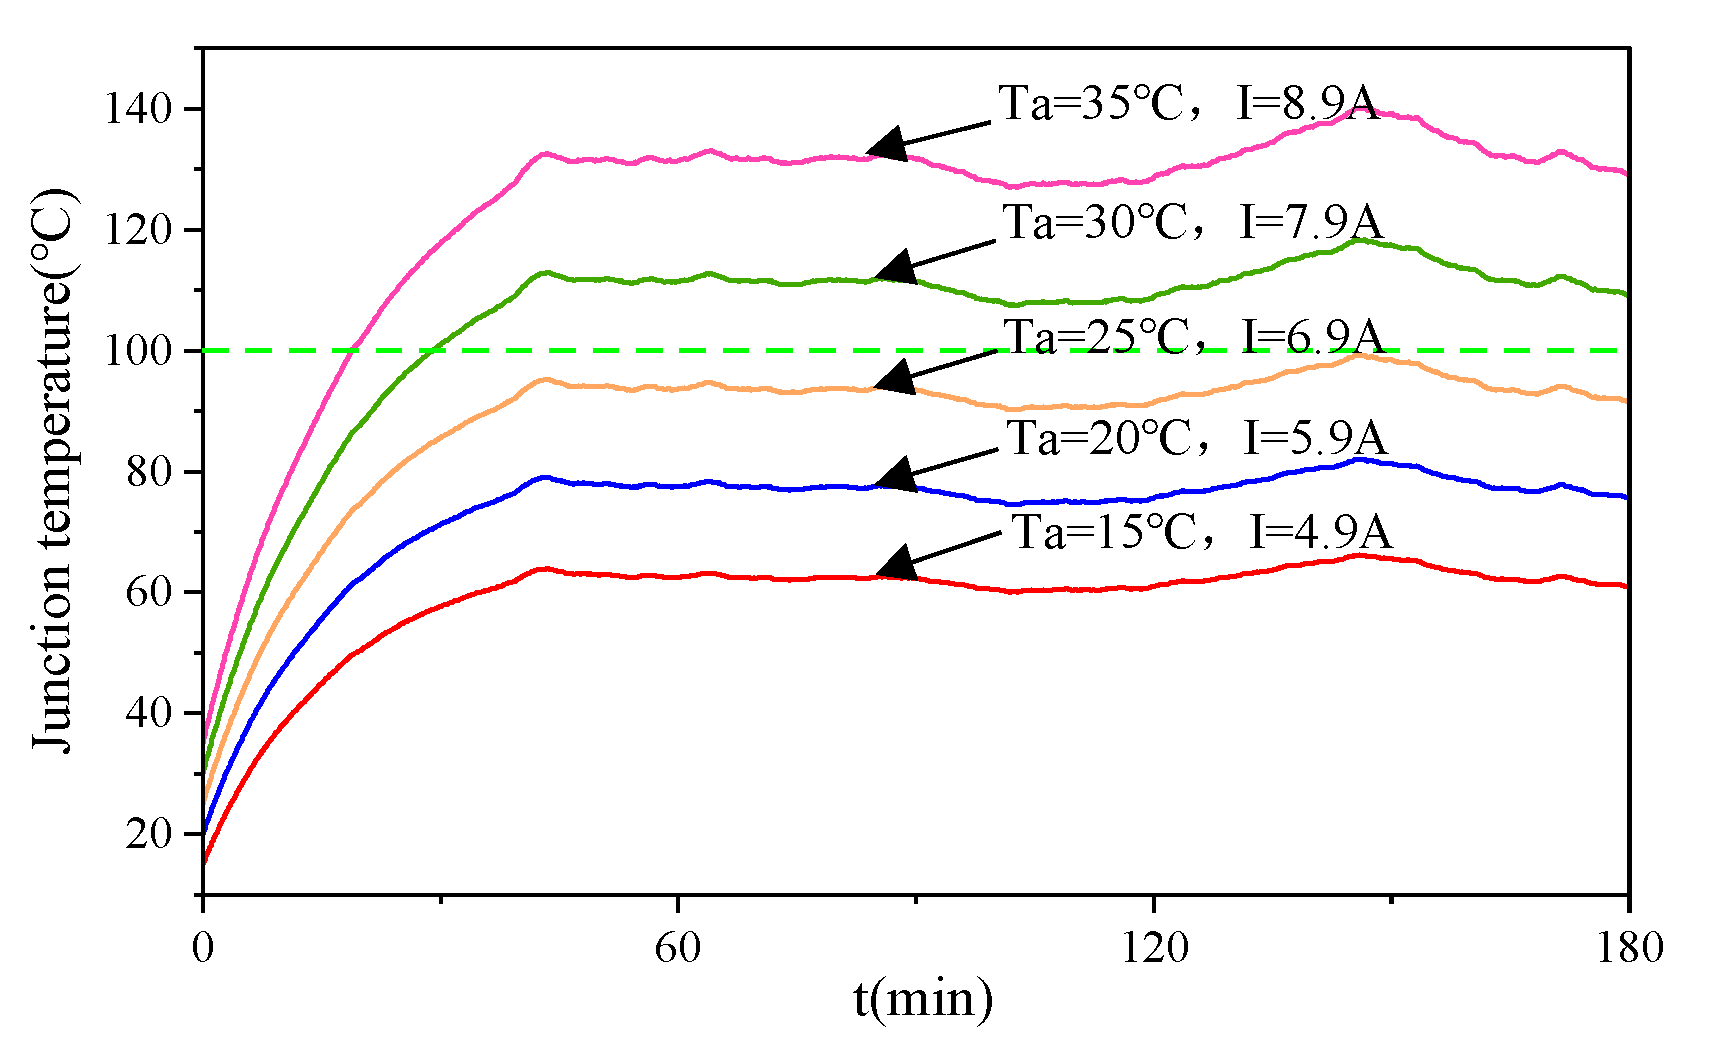
Next, the simulated sequences of convective heat resistance are substituted into the thermal network model to simulate the random variations in device junction temperature at different currents and ambient temperatures. Figure 13 shows five sets of random simulation results for the junction temperature of device Q1. All simulated sequences of convective heat resistance are used to simulate the junction temperature change. Therefore, 200 groups of junction temperature simulation results can be obtained under each combination of ambient temperature and current. However, for the convenience of observation, only five groups of junction temperature simulation results are presented here. Obviously, the simulated junction temperatures are always in random fluctuation.
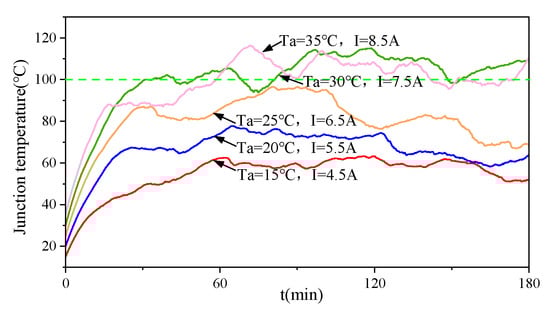
Figure 13.
Power spectral densities of the sample sequence and the simulated sequences.
The over-temperature probability of the device Q1 under different converter currents and ambient temperatures is obtained with the simulated junction temperatures. By using fifth-order polynomial fitting, the Pearl function for calculating the probability of over-temperature can be established. The fitting coefficients are listed in Table 2 and Figure 14, showing the over-temperature probability surface calculated with the Pearl function. With the good computing power of the microprocessor in this study, the above-mentioned random simulation of junction temperature and the establishment of the over-temperature probability are achieved in 200 ms.
Table 2.
Coefficients of the Pearl growth function.
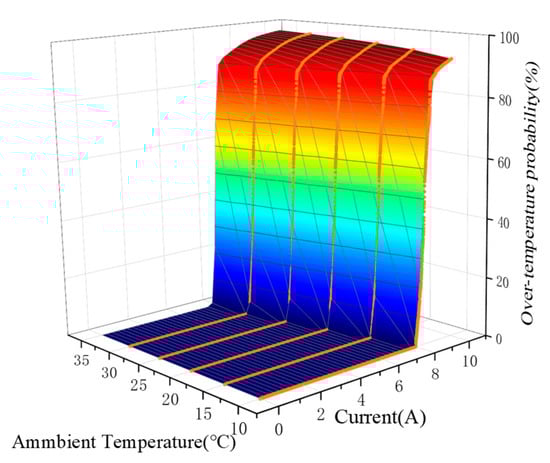
Figure 14.
Over-temperature probability surface of the device Q1 calculated with the Pearl function.
Finally, the over-temperature risks of the device Q1 under five groups of specific converter current and ambient temperature, as shown in Table 3, are estimated by using the above Pearl function. The data listed in this table show that the risk of over-temperature in groups #1 and #2 reaches more than 90%, which also indicates that the converter has a great probability of overheating failure. The over-temperature risk in group #3 is 3.31%, which means that the converter has relatively good safety, but there is still a small probability of thermal failure. In groups #4 and #5, the over-temperature risk of the device is 0, indicating that the thermal safety of the converter is extremely high.
Table 3.
Over-temperature risk assessment results of device Q1 at specific converter currents and ambient temperatures.
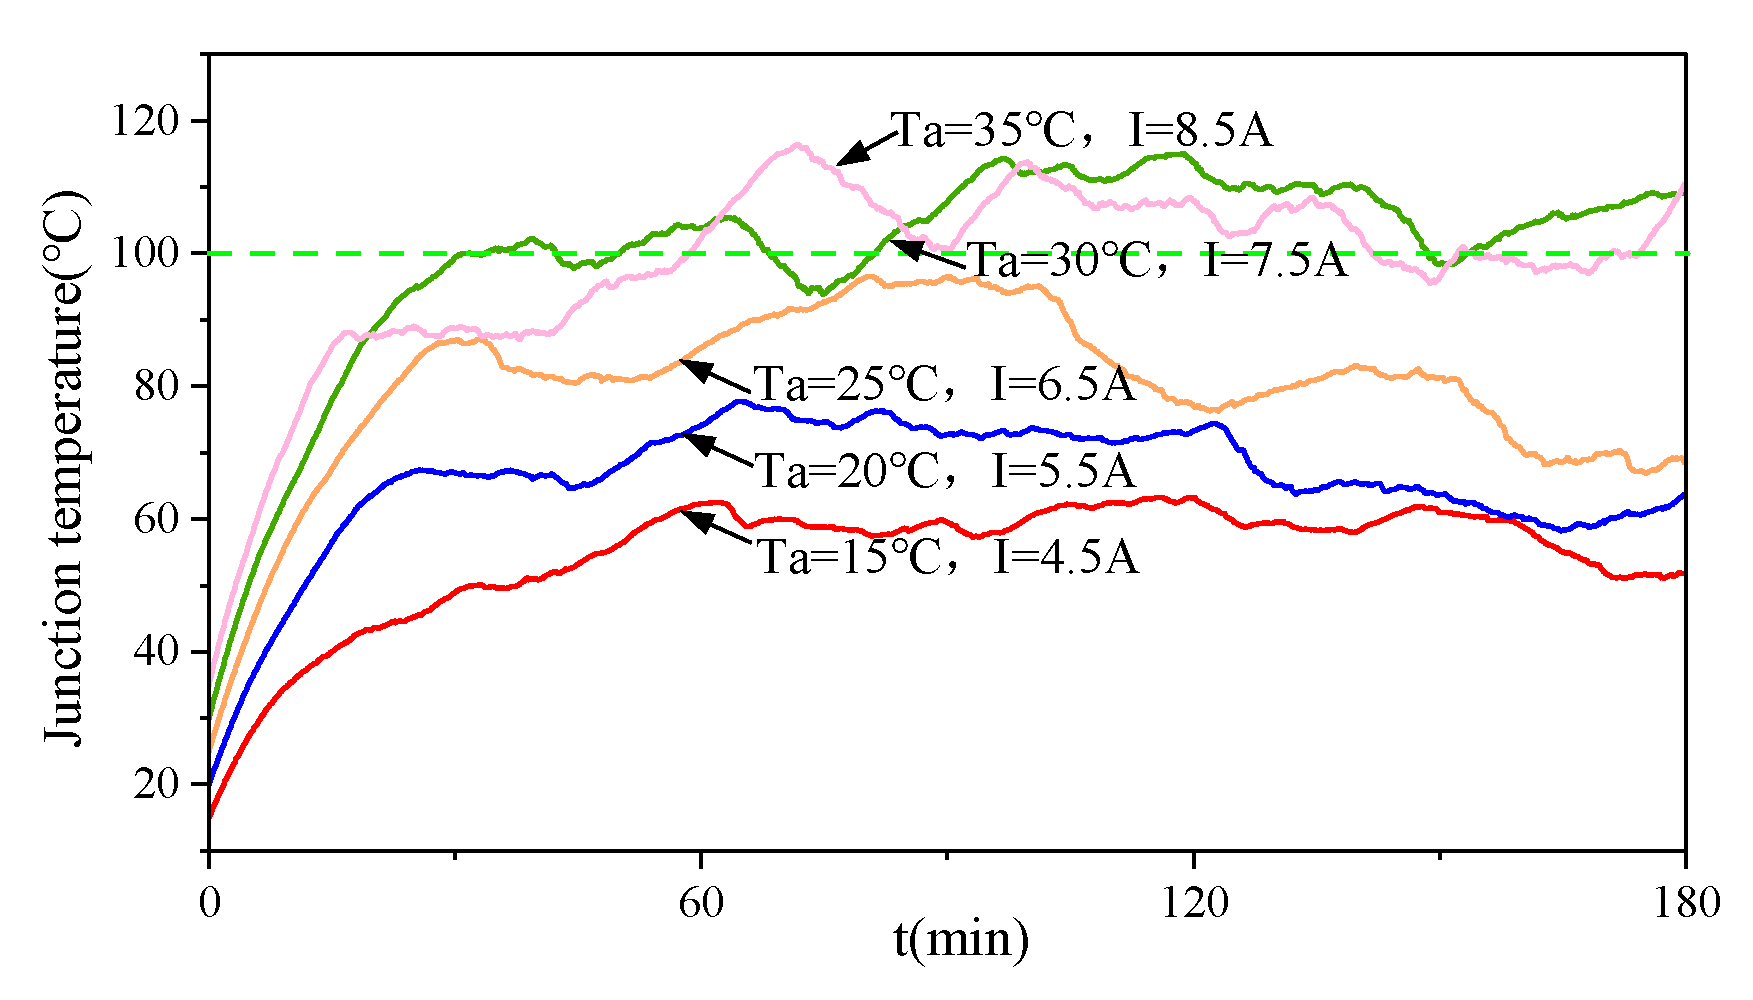
To verify the above thermal safety assessment results, the converter in the experiment platform is operated under the current and ambient temperatures shown in Table 3 and the natural air-cooled environment shown in Figure 4. The junction temperature variation in device Q1 in the experiment is shown in Figure 15. It can be seen that the junction temperature exceeds Tjmax in groups #1 and #2. The junction temperature in group #3 is less than Tjmax, but its maximum value is close to Tjmax. In groups #4 and #5, the junction temperature is much smaller than Tjmax. These experimental phenomena are consistent with the results of the thermal safety assessment. This indicates that, based on the wavelet packet transform and Monte Carlo methods, the proposed method effectively simulates the influence of random airflow on the device junction temperature of converters under the natural air-cooled environments. The thermal safety of other devices in the converter can also be evaluated by the proposed method, but this is not explored here.
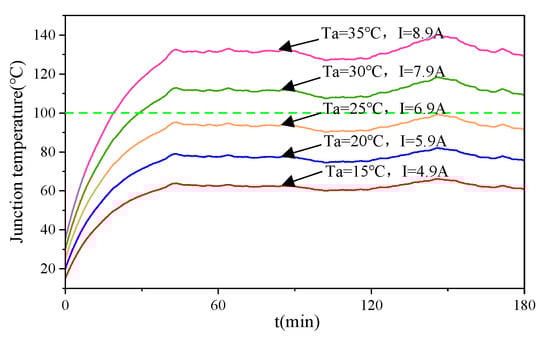
Figure 15.
Junction temperature variation in device Q1 in the validation experiment of the proposed method.
The above results show the effectiveness of the proposed method for assessment of the thermal safety of power devices in natural air-cooled converters. The proposed method can be used in the test stage or practical application stage of converter products. In the test stage, the convective heat resistance sample of the housing is extracted through the off-line experiment of prototypes, and the heat-dissipation performance of the prototype is improved according to the estimated over-temperature probability of devices. In the practical application stage, the convective heat resistance samples should be continuously updated and then the proposed method can estimate and predict the over-temperature risk of devices in real time.
5. Conclusions
In this paper, a thermal safety assessment method for power devices in natural air-cooled converters is proposed. The experimental results show that by using wavelet packet transform and Monte Carlo simulation, the proposed method can effectively simulate the influence of random airflow in natural air-cooling environments on device junction temperature in converters. In this way, the over-temperature risk of power devices under different ambient temperature and current levels can be accurately estimated in the form of probability, which effectively improves the thermal reliability of natural air-cooled converters.
It should be noted that the method proposed in this study is only for natural air-cooled converters with good thermal conductivity and small size. If the size of the converter housing is large or the thermal conductivity of the housing material is low, the proposed method needs to be further improved due to the non-negligible surface temperature distribution on the housing. The time–frequency domain analysis of convective heat resistance and the random simulation of device junction temperature in this paper have provided a good foundation for the future improvement of this method. In addition, to improve the reliability of junction temperature estimation, more accurate and novel thermal networks can be used in future to replace the linear thermal network used in the proposed method.
Author Contributions
Conceptualization, Y.Z.; Investigation, W.H.; Methodology, W.H., Y.Z. and Z.Y.; Writing—original draft, W.H.; Writing—review and editing, Z.L., J.L., F.B. and W.Z. All authors have read and agreed to the published version of the manuscript.
Funding
This research was funded by the National Natural Science Foundation of China (Grant No. 42206225) and the Project of State Key Laboratory of Smart Grid Protection and Operation Control (SGNR0000KJJS2007613).
Data Availability Statement
The data presented in this study are available on request from the corresponding author.
Conflicts of Interest
The authors declare no conflicts of interest.
References
- Qian, C.; Gheitaghy, A.M.; Fan, J.; Tang, H.; Sun, B.; Ye, H.; Zhang, G. Thermal management on IGBT power electronic devices and modules. IEEE Access 2018, 6, 12868–12884. [Google Scholar] [CrossRef]
- Bahman, A.S.; Ma, K.; Blaabjerg, F. A lumped thermal model including thermal coupling and thermal boundary conditions for high-power IGBT modules. IEEE Trans. Power Electron. 2018, 33, 2518–2530. [Google Scholar] [CrossRef]
- Chen, H.; Yang, J.; Xu, S. Electrothermal-based junction temperature estimation model for converter of switched reluctance motor drive system. IEEE Trans. Ind. Electron. 2020, 67, 874–883. [Google Scholar] [CrossRef]
- Lutz, J.; Schlangenotto, H.; Scheuermann, U.; Doncker, R.D. Semiconductor Power Devices; Springer: Berlin, Germany, 2011; pp. 360–368. [Google Scholar]
- Drofenik, U.; Cottet, D.; Müsing, A.; Meyer, J.M.; Kolar, J.W. Modelling the thermal coupling between internal power semiconductor dies of a water-cooled 3300V/1200A HiPak IGBT module. In Proceedings of the International Exhibition and Conference for Power Electronics, Intelligent Motion and Power Quality (PCIM Europe 2007), Nuremberg, Germany, 22–24 May 2007. [Google Scholar]
- Wu, R.; Iannuzzo, F.; Wang, H.; Blaabjerg, F. Fast and accurate Icepak-PSpice co-simulation of IGBTs under short-circuit with an advanced PSpice model. In Proceedings of the 7th IET International Conference on Power Electronics, Machines and Drives (PEMD 2014), Manchester, UK, 8–10 April 2014; pp. 1–5. [Google Scholar]
- Greco, G.; Vinci, G.; Bazzano, G.; Raciti, A.; Cristaldi, D. Layered electro-thermal model of high-end integrated power electronics modules with IGBTs. In Proceedings of the IECON 2014-40th Annual Conference of the IEEE Industrial Electronics Society, Dallas, TX, USA, 29 October–1 November 2014; pp. 1575–1580. [Google Scholar]
- Lemmens, J.; Vanassche, P.; Driesen, J. Optimal control of traction motor drives under electrothermal constraints. IEEE J. Emerg. Sel. Top. Power Electron. 2014, 2, 249–263. [Google Scholar] [CrossRef]
- Chen, H.; Ji, B.; Pickert, V.; Cao, W. Real-time temperature estimation for power MOSFETs considering thermal aging effects. IEEE Trans. Device Mater. Reliab. 2014, 14, 220–228. [Google Scholar] [CrossRef]
- Du, X.; Li, G.; Li, T.; Sun, P.; Zhou, L. Multi-time scale lifetime evaluation of IGBT modules in the wind power converter. Proc. CSEE 2015, 35, 6152–6161. [Google Scholar]
- Górecki, K.; Górecki, P. Nonlinear Compact Thermal Model of the IGBT Dedicated to SPICE. IEEE Trans. Power Electron. 2020, 35, 13420–13428. [Google Scholar] [CrossRef]
- Górecki, K.; Zarebski, J.; Bisewski, D.; Dąbrowski, J. Nonlinear Compact Thermal Model of Power Semiconductor Devices. IEEE Trans. Compon. Packag. Technol. 2010, 33, 643–647. [Google Scholar] [CrossRef]
- Heng, K.; Yang, X.; Wu, X.; Ye, J.; Liu, G. A Temperature-Dependent Physical Thermal Network Model including Thermal Boundary Conditions for SiC MOSFET Module. IEEE Trans. Electron Devices 2022, 69, 4444–4452. [Google Scholar] [CrossRef]
- Górecki, P.; Wojciechowski, D. Accurate Computation of IGBT Junction Temperature in PLECS. IEEE Trans. Electron Devices 2020, 67, 2865–2871. [Google Scholar] [CrossRef]
- Yang, X.; Xu, S.; Heng, K.; Wu, X. Distributed Thermal Modeling for Power Devices and Modules with Equivalent Heat Flow Path Extraction. IEEE J. Emerg. Sel. Top. Power Electron. 2023, 11, 5863–5876. [Google Scholar] [CrossRef]
- Zhang, X.; Wang, S.; Xin, L.; Wu, K.; Li, J. A 3-D thermal network model for the temperature monitoring of thermal grease as interface material. Microelectron. Reliab. 2020, 114, 113816. [Google Scholar] [CrossRef]
- Wang, H.; Zhou, Z.; Xu, Z.; Ge, X.; Yang, Y.; Zhang, Y.; Yao, B.; Xie, D. A Thermal Network Model for Multichip Power Modules Enabling to Characterize the Thermal Coupling Effects. IEEE Trans. Power Electron. 2024, 39, 6225–6245. [Google Scholar] [CrossRef]
- Shi, Y.; Liu, J.; Ai, Y.; Chen, S.; Bai, Y. Dynamic IGBT Three-Dimensional Thermal Network Model Considering Base Solder Degradation and Thermal Coupling between IGBT Chips. IEEE Trans. Transp. Electrif. 2023, 9, 2994–3011. [Google Scholar] [CrossRef]
- Ma, M.; Guo, W.; Yan, X.; Yang, S.; Zhang, X.; Chen, W.; Cai, G. A Three-Dimensional Boundary-Dependent Compact Thermal Network Model for IGBT Modules in New Energy Vehicles. IEEE Trans. Ind. Electron. 2021, 68, 5248–5258. [Google Scholar] [CrossRef]
- Long, Y.; Song, Z. Thermal Analysis of High Torque Density Axial-Radial Flux Permanent Magnet Machine Based on Lumped Parameter Thermal Network. In Proceedings of the 2023 26th International Conference on Electrical Machines and Systems (ICEMS), Zhuhai, China, 5–8 November 2023; pp. 1443–1448. [Google Scholar]
- Zhao, H.; Zhang, X.; Li, J.; Zhang, F.; Zhao, W.; Zhang, Y.; Gerada, D.; Zhang, H. Effectiveness of Thermal Interface Materials on Electrical Machines Thermal Performance with Heat Pipes. IEEE Trans. Transp. Electrif. 2023, 10, 1274–1285. [Google Scholar] [CrossRef]
- Wang, R.; Fan, X.; Li, D.; Qu, R.; Li, L.; Zou, T. Convective Heat Transfer Characteristics on End-Winding of Stator Immersed Oil-Cooled Electrical Machines for Aerospace Applications. IEEE Trans. Transp. Electrif. 2022, 8, 4265–4278. [Google Scholar] [CrossRef]
- Górecki, P. Compact Thermal Modeling of Power Semiconductor Devices with the Influence of Atmospheric Pressure. Energies 2022, 15, 3565. [Google Scholar] [CrossRef]
- BURRUS. Introduction to Wavelets and Wavelet Transforms: A Primer; China Machine Press: Beijing, China, 2005. [Google Scholar]
- Metropolis, N.; Ulam, S. The Monte Carlo method. J. Am. Stat. Assoc. 1949, 44, 335–341. [Google Scholar] [CrossRef]
- Hammersley, J. Monte Carlo Methods; Springer Science & Business Media: Berlin/Heidelberg, Germany, 2013. [Google Scholar]
- Moriguchi, K. An approach for deriving growth equations for quantities exhibiting cumulative growth based on stochastic interpretation. Phys. A Stat. Mech. Its Appl. 2018, 490, 1150–1163. [Google Scholar] [CrossRef]
- Christensen, J.H.; Mortensen, J.; Hansen, A.B.; Andersen, O. Chromatographic preprocessing of GC-MS data for analysis of complex chemical mixtures. J. Chromatogr. A 2005, 1062, 113–123. [Google Scholar] [CrossRef] [PubMed]
- Lieskovská, E.; Jakubec, M.; Jarina, R.; Chmulík, M. A review on speech emotion recognition using deep learning and attention mechanism. Electronics 2021, 10, 1163. [Google Scholar] [CrossRef]


Disclaimer/Publisher’s Note: The statements, opinions and data contained in all publications are solely those of the individual author(s) and contributor(s) and not of MDPI and/or the editor(s). MDPI and/or the editor(s) disclaim responsibility for any injury to people or property resulting from any ideas, methods, instructions or products referred to in the content. |
© 2024 by the authors. Licensee MDPI, Basel, Switzerland. This article is an open access article distributed under the terms and conditions of the Creative Commons Attribution (CC BY) license (https://creativecommons.org/licenses/by/4.0/).