1. Introduction
At the 2021 United Nations Climate Change Conference, COP26, it was acknowledged that limiting global warming to 1.5 °C necessitates a 45% reduction in global carbon dioxide emissions by 2030 compared to the 2010 level, ultimately reaching net zero around mid-century. Given that the power sector contributes a quarter of global greenhouse gas emissions [
1], it is evident that the energy sector must undergo substantial changes towards defossilization.
To achieve an energy sector independent of fossil fuels, there is a critical need to increase the penetration of variable renewable energy sources (vRES) like solar and wind power. It is anticipated a continuous increase in photovoltaic (PV) generation in the coming years, given the decreasing prices, lower environmental impacts, independence from fuel costs, relatively low operations and maintenance requirements, and a modular design facilitating rapid construction schedules.
PV systems show a low environmental impact when compared to power production using fossil fuels, as they do not emit greenhouse gasses (GHG) during the electricity generation lifetime. However, some environmental impacts may be associated with PV production, namely, land use, water use in the manufacturing process, hazardous materials used to clean and purify the semiconductor surface, and life-cycle global warming emissions, including manufacturing, materials transportation, installation, maintenance, and decommissioning and dismantlement.
This increased penetration of vRES poses challenges to the stability of the energy system since vRES heavily depends on meteorological conditions and seasonal variations. By increasing integration, the power supply becomes reliant on uncontrollable factors. Moreover, traditional synchronous generators in thermoelectric power stations, synchronously connected to the grid, use rotating parts as an energy buffer, delivering inertia to the system and ensuring power system stability.
The total inertia in a traditional power system acts as resistance in the form of kinetic energy exchange from synchronously connected machines to counteract changes in frequency. Changes in frequency can result from power imbalances in generation and demand. Wind and solar sources, connected to the grid through power electronics converters, cannot contribute to the inertia of the system. Consequently, increased vRES penetration leads to decreased system inertia, potentially causing deviations from the nominal frequency with negative implications and potential damage to grid systems.
This issue is exacerbated in small, isolated grids like islands and some cities in developing countries, where a careful study is needed due to low system inertia and low network equivalent impedance. Increasing PV penetration may worsen this situation, and one solution to minimize this issue is the installation of battery energy storage systems (BESS).
This study aims to investigate the influence of a BESS on the frequency regulation of a weak grid with high vRES penetration that lacks inherent system inertia. Madeira Island was chosen as a case study, considering three scenarios: the current scenario (low vRES penetration), the future scenario (increased vRES integration), and the future scenario with a BESS. The study involves applying rapid changes in load and generation, along with ground fault disturbances, and analyzing their effects on frequency stability. The anticipated positive influence of a BESS in minimizing frequency disturbances will also be studied. The Simscape Electrical package from Matlab/Simulink is utilized for this study, providing the capability to perform transient stability studies and allowing users to model every grid element from scratch for a comprehensive understanding of the system.
Madeira Island is a compelling case study due to its isolation and the challenges in increasing vRES integration. With a decrease in synchronously generated power from thermoelectric plants, measures are being implemented to manage decreasing system inertia and avoid significant disturbances in frequency and system stability. A 15 MW/10 MWh BESS is already operational on Madeira Island to enhance system stability, making it a relevant consideration for this study. Furthermore, the energy sources used in simulations align with those existing on Madeira Island, and the anticipated increase in solar generation in the future scenario matches vRES expansion forecasts for Madeira.
The paper’s objectives can be summarized as follows:
Investigate the impact on frequency stability of higher PV integration in a weak grid incorporating various vRES;
Analyze the contribution that a BESS can bring to the improvement of frequency stability.
The paper is organized into five parts. After this first section,
Section 2 analyzes the state of the art, highlighting problems caused by large vRES integration in a weak grid reported in the literature and analyzing existing solutions.
Section 3 presents the simulation conditions, while
Section 4 explains grid modeling, providing details on models used for each grid element.
Section 5 presents and discusses the results, and the conclusion is provided in the final section.
2. Related Work
2.1. Solar Panels and Batteries in Weak Grids
Weak power grids can be categorized as systems connected to the main grid by weak interconnections or entirely autonomous grids without a connection to the main grid, such as islands and remote areas [
2]. In this paper [
2], the challenge of greater integration of solar panels in weak grids is examined, and a novel framework is proposed to assess its impact. The suggested approach advocates using the probable maximum generation profile based on clear-sky radiation for voltage evaluation and the average generation profile based on average radiation for energy analysis.
In [
3], the advantages for consumers with solar generation equipped with an energy storage system are investigated. The study focuses on Madeira Island, utilizing real data to determine the optimal end-user contract. The objective is to optimize the system for arbitrage and peak-shaving. The findings indicate that a larger storage size renders more volatile consumer contracts (triple-rate tariffs) more advantageous. Additionally, using a storage system for power backup during outages does not impact the benefits derived from employing the battery for arbitrage and peak-shaving. The research is extended in [
4], where the optimal sizing of energy storage for four different types of prosumers on Madeira Island, each with distinct PV generation and load demand relations, is explored.
Miguel et al. [
5] have analyzed the benefits of installing a BESS in Madeira Island in terms of increased vRES penetration and a reduction in CO
2 emissions. They assume a re-dispatch scenario where a BESS can replace a thermal group of equivalent power. Results demonstrate how a BESS can decrease thermal production, leading to a reduction in CO
2 emissions. For instance, a BESS with 7.5 MWh energy and 30 MW power reduces thermal plant energy production by 11.65 GWh, corresponding to a 3070-ton reduction in CO
2 emissions. The study infers that a larger power rate and a lower energy capacity yield better results, albeit requiring more complex control algorithms.
The optimal combination of vRES and a BESS is determined using HOMER software in [
6], considering financial aspects and the load demand of the island Kavaratti, the metropolis of Lakshadweep. Additionally, the best component locations are identified through load flow analysis using DigSILENT PowerFactory software. The study concludes that introducing the calculated optimal combination of vRES and a BESS (840 kWh battery and vRES fraction of 26%) results in a lower cost of energy compared to relying solely on diesel sets, and ensures 100% load met.
Canales et al. [
7] explored the feasibility of a hybrid system (PV and wind turbines) connected to pumped storage hydropower plants and a BESS. An optimization process calculates the optimal installed capacity of PV, wind turbines, pump/turbine, and battery storage to minimize the levelized cost of energy (LCOE) and loss of power supply probability (LPSP). Pumped storage hydropower gains popularity due to its low maintenance cost, long lifetime, and high energy density. On the other hand, a BESS offers a faster response time, high efficiency, and rapid installation time. Several papers, including [
8,
9,
10], study the use of batteries to increase the virtual inertia of the grid.
2.2. Solutions to Increase Inertia in Weak Grids
With the increasing penetration of vRES to meet decarbonization goals, numerous studies are underway to assess how grids, particularly weak grids, will respond to reduced grid inertia levels. Simulations are being conducted, taking into account higher vRES integration in weak grids and scrutinizing their reactions to fluctuations in load and generation [
8,
11].
The inertia,
, (s) can be defined by Equation (1) as referred to in [
12]:
where
, (W), is the apparent power of the synchronous generator (SG) and
, (J), is the kinetic energy stored in the rotating mass of the SG. In other words, the inertia constant is defined as the time the rotor’s kinetic energy can supply the rated power of the SG.
The analysis of inertia’s relevance in the frequency stability of electrical systems is detailed in [
12]. The study differentiates between synchronous inertia, representing energy exchange from synchronously connected machines, and virtual inertia, associated with power electronics converter-connected generation. Control of the converter can deliberately vary energy exchange with the grid, termed virtual (or synthetic) inertial response, depending on the energy source behind each participating converter (e.g., storage systems, kinetic energy from wind). Ref. [
12] also explores the influence of different inertia values on the Rate of Change of Frequency (ROCOF) and the minimum frequency (NADIR frequency). It concludes that reduced inertia leads to higher ROCOF values and smaller NADIR values during power imbalances.
In [
13], an alternative definition for synthetic inertia and fast frequency response is presented. Fast frequency response is described as “the controlled contribution of electrical torque from a unit responding quickly to frequency changes to counteract reduced inertial response”. Synthetic inertia is defined as “the controlled contribution of electrical torque from a unit proportional to the ROCOF at the terminals of the unit”. The study concludes that both synthetic inertial response and fast frequency response can enhance the NADIR frequency, while ROCOF improvement is attributed only to synthetic inertia.
Importantly, the challenge of inertia reduction is not confined to weak grids. The impact of significant vRES penetration on inertia in larger grids, such as the European power system, is explored in [
14]. Mehigan et al. examine a scenario with high vRES integration, assessing the impact on the European power system’s inertia and each synchronous area. The study also delves into the implications of inertia constraints on total generation costs and CO
2 emissions. For instance, increasing the ROCOF limit in the Baltic synchronous area results in substantial cost savings and reduced CO
2 emissions. However, the study does not specifically address dynamic stability studies, a crucial consideration when contemplating an increase in the ROCOF limit.
An option proposed in [
12] to create a power reserve in solar panels is to de-load the PV unit by adjusting the output voltage from the value set by maximum power point tracking (MPPT). Another suggested approach to enhance stability is designating certain conventional power plants as synchronous condensers, capable of providing synchronous inertia.
In [
10], the diverse measures adopted by countries (Ireland, Great Britain, Australia, USA) to address decreasing inertia in power systems are analyzed: ROCOF limit increase, energy storage, restrictions on excessive vRES penetration, utilization of synchronous condensers, emulation of inertial response from vRES and inverters. Technologies proposed to boost inertia include synchronous condensers, demand-side management, pumped hydroelectric energy storage, flywheels, batteries, and ultra-capacitors.
The impact of inertia reduction in the Great Britain grid and proposed solutions are outlined in [
15]: ROCOF limit increase in certain relays, demand-side response, energy storage, and synchronous compensators. The study evaluates the effect on ROCOF and short-circuit ratio due to the deployment of synchronous compensators in the Great Britain grid, utilizing Scotland’s reduced network model as a case study.
Almeida et al. [
11] explore the contribution of electric vehicles to frequency stabilization in an isolated grid. Electric cars adjust their charging power in response to significant frequency deviations, employing a combination of droop control and inertial emulation. Simulations consider the island of Flores in the Azorean archipelago under different scenarios, demonstrating a reduction in the frequency oscillation band with minimal changes in energy consumption.
In [
10], various control techniques aiming to decrease inertia are examined. Inertia emulation techniques for inverters mimic synchronous and induction machines, involving control of the DC-link capacitor and excess energy from de-loaded vRES. External energy devices can also be utilized.
The control strategy PV-based virtual synchronous generator (PV-VSG) is detailed in [
16], with proposed improvements involving the implementation of variable virtual inertia. Simulations suggest that the PV-VSG can utilize stored energy to balance transient energy variations in the power grid following a fault.
Mao et al. [
17] study a control system for PV systems with a BESS based on a Virtual Synchronous Generator (VSG). The system, comprising a BESS control, photovoltaic control, and inverter VSG controller, demonstrates decentralized control. Simulations indicate that the proposed control system reduces ROCOF and enhances the frequency stability of the grid.
In [
8], the impact on frequency stability due to the predicted increase in vRES penetration is studied. Storage systems such as batteries and flywheels are explored to mitigate this impact, simulating disturbances and analyzing their effects on ROCOF, steady-state frequency, and minimum frequency.
The impact of a BESS on the stability of distribution networks with high vRES penetration connected to the grid by inverters is analyzed in [
9]. Results indicate that appropriate charging and discharging schemes of a BESS can improve transient stability. The study utilizes a typical United Kingdom 11 kV feeder with various conditions (with 2 SG, with SG plus wind turbine, with SG plus rooftop solar panel and a BESS, etc.), verifying that BESS use allows the synchronous machine to resynchronize.
Nikolic et al. [
18] propose a technology consisting of a BESS and a synchronous condenser to add inertia to the grid. Using the isolated grid of King Island in Australia as a case system, the article measures the frequency and real power after the shutdown of the last diesel generator and after distribution faults. According to the study, the system composed of a BESS and the synchronous condenser can substitute diesel generation in an isolated power system with 100% instantaneous renewable energy, providing ample support during distribution system faults.
The main contributions of our paper are as follows:
To provide a simplified, yet credible, representation of the Madeira Island power system, which allows for frequency stability studies to be carried out;
To demonstrate the positive impact the introduction of a BESS can bring to the enhancement of the frequency stability margins in a scenario of a high share of grid-connected converters that struggle to provide inertia.
3. Simulation Conditions
3.1. Scenarios’ Definition
In this research, three scenarios were considered:
Current scenario:
This scenario corresponds to the RES penetration in Madeira Island as of 2020. The diesel, gas and solid waste were joined in a single thermal power plant. Before any disturbance was applied, all renewable power plants were running at nominal power, i.e., Hydro: 77 MW; Solar PV: 20 MW, Wind: 63 MW. The equivalent thermal power plant is operating at 35% of the nominal power, i.e., 74 MW.
Future scenario:
This scenario corresponds to a scenario with an increase in the percentage of power provided by solar generation. Considering that an increase in the nominal power provided by solar generation was undertaken, the nominal power of the equivalent thermal power plant was decreased. In conclusion, the power supplied by each power plant for this scenario is as follows: Hydro: 77 MW; Solar PV: 70 MW; Wind: 63 MW; the equivalent thermal power plant is operating at 24 MW.
The future scenario was built based on the power system planning made available by the Madeira Island system operator.
Future scenario with BESS:
The third scenario has the same supplied power for each power plant as the future scenario. However, a 15 MW/10 MWh BESS is added.
The recent installation in Madeira Island of a BESS is the first step towards the decarbonization of the power system. The operation of a nearly 100% renewable power system is possible, provided full deployment of diverse storage systems is carried out. In this situation, a backup thermal power plant might be needed.
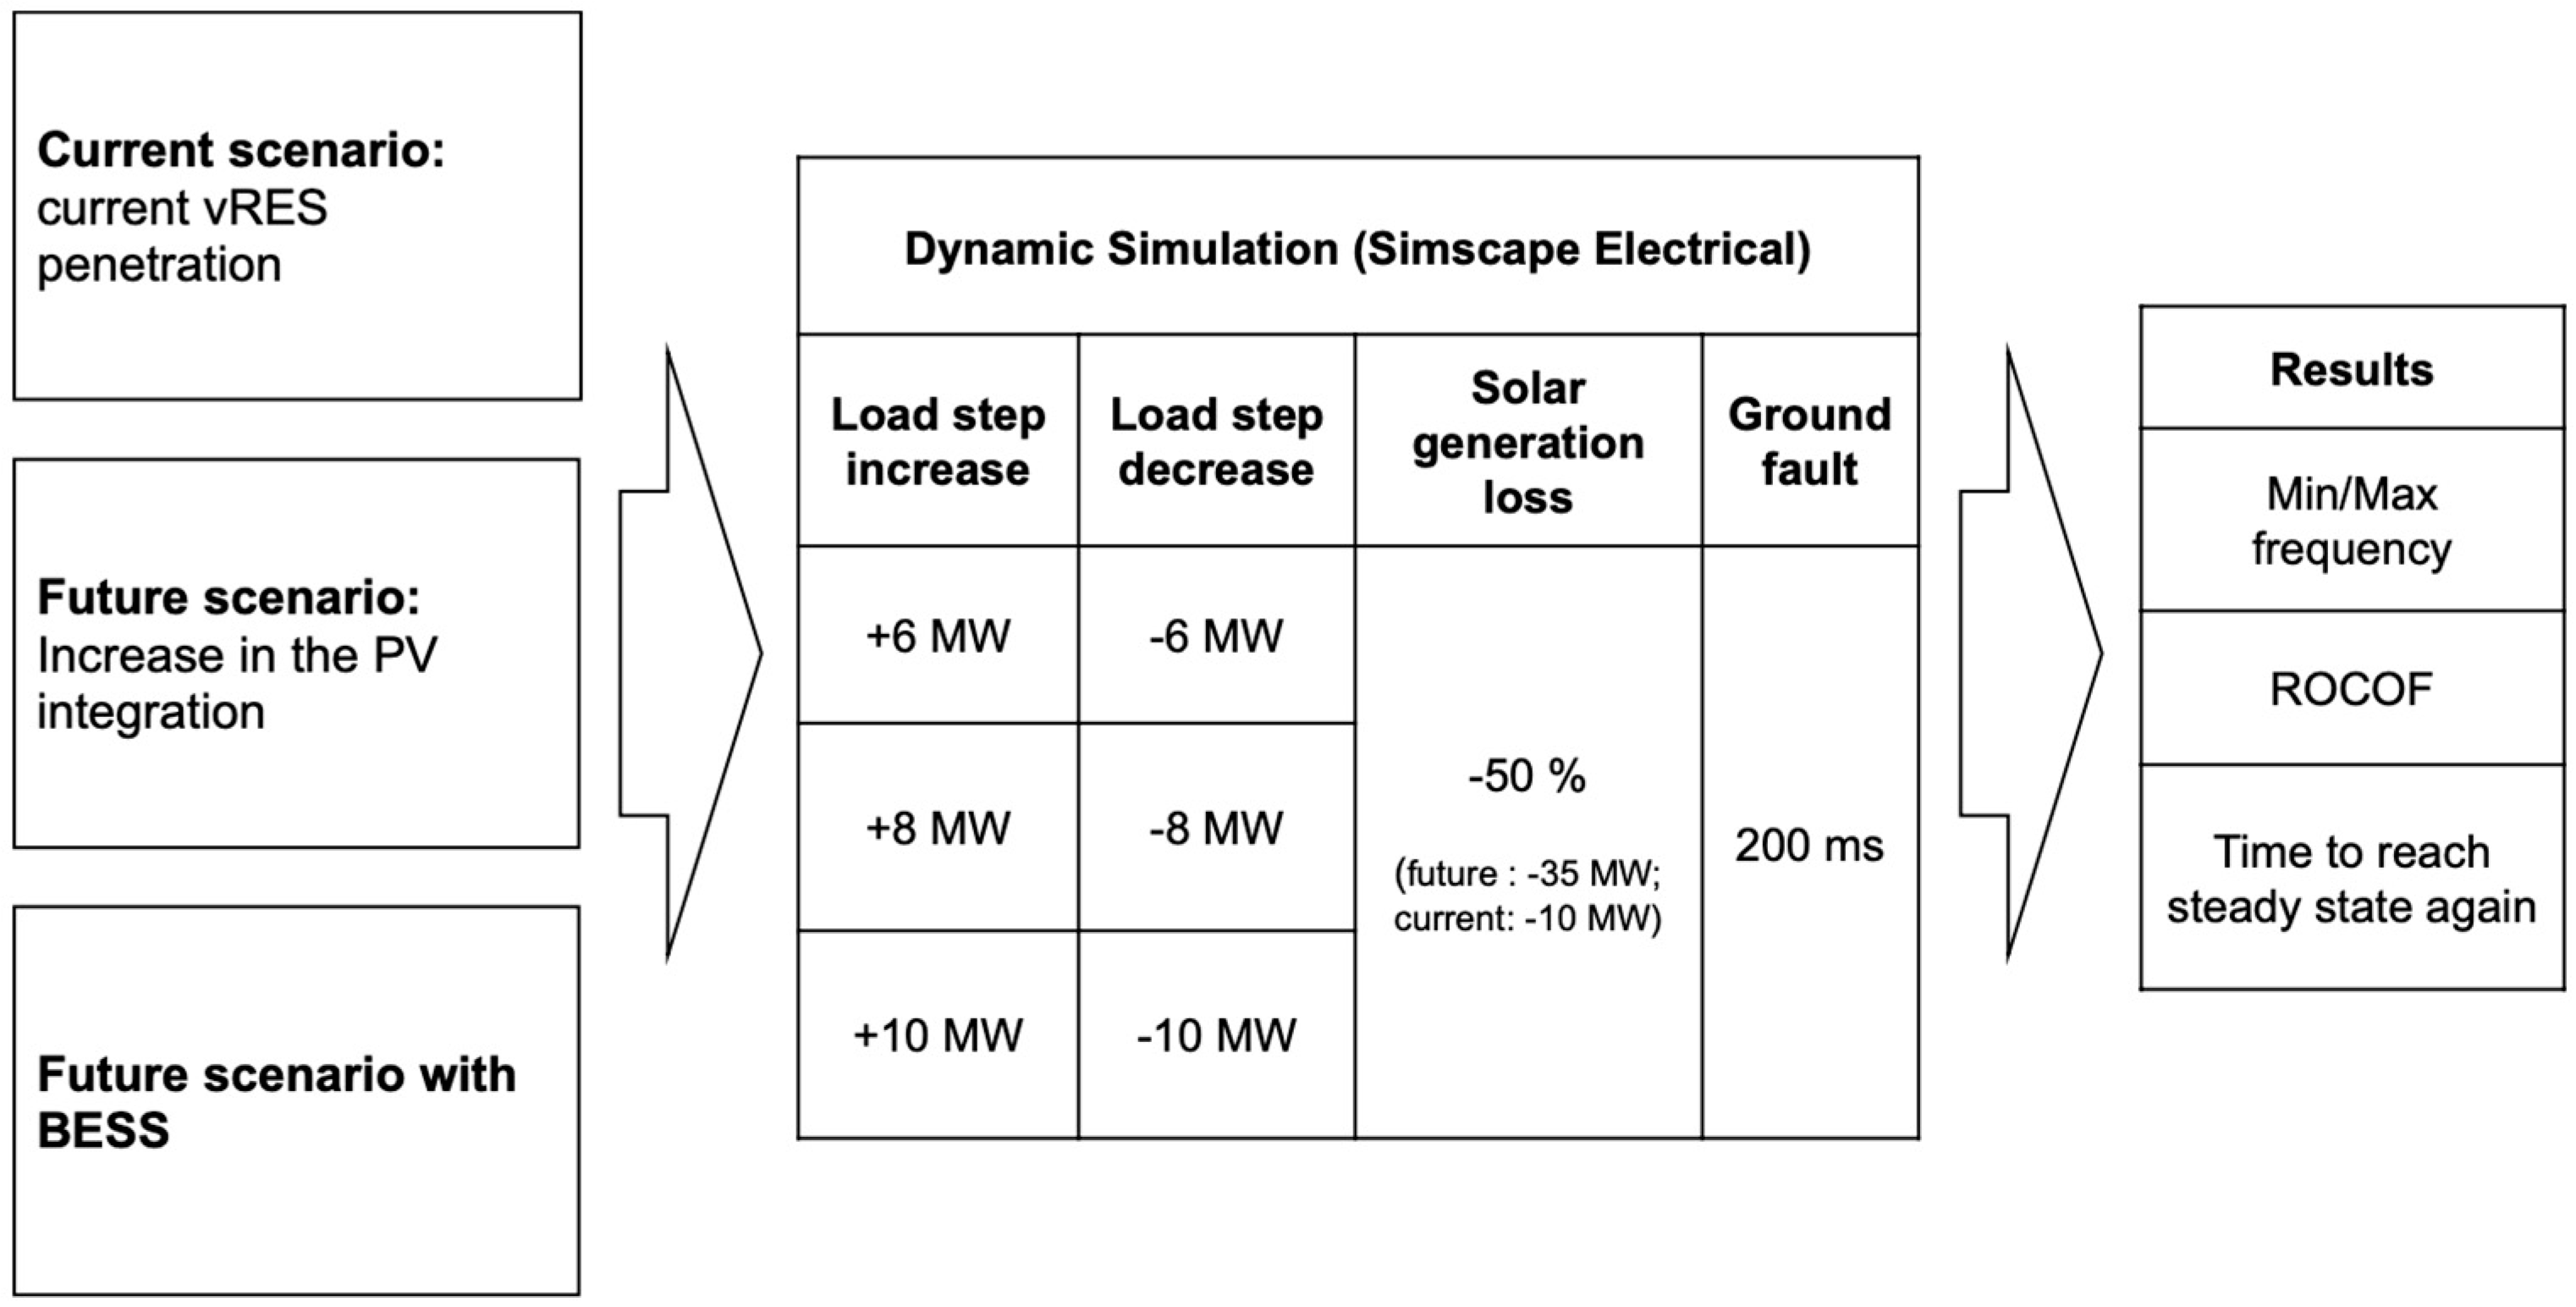
3.2. Disturbances Studied
With the system in a steady state, the following disturbances were undertaken:
Further explanations of the used methodology to perform the simulations are given in
Figure 1. The outputs are the maximum/minimum frequency deviation, ROCOF (using a sliding window of 500 ms, as in Equation (2)) and the time necessary to reach the steady state, which is analyzed to understand the frequency stability issues in each scenario:
where
is the frequency at time
and
is the frequency at time
.
The simulations were performed using Simscape Electrical from Matlab [
19].
4. System Modelling
The grid used for the simulation is based on the IEEE 9 bus network (IEEE9) and is shown in
Figure 2.
4.1. Lines, Transformers and Loads
The lines are modeled using the “Three-Phase PI Section Line” block of the Simscape Electrical package, [
20]. The π-model was used to represent the line. The inductive and capacitive couplings between the three-phase conductors were also considered, besides the ground parameters. The line parameters
,
and
are given by the positive and zero sequence parameters. This method assumes that the three phases are balanced. The transformers are modeled using the “Three-Phase Transformer (Two Windings)” block of the Simscape Electrical package [
21]. The two-winding transformer is modeled in the simulation using the electrical equivalent circuit representation. The loads are modeled using the “Three-Phase Dynamic Load” block of the Simscape Electrical package [
22]. The loads are modeled as constant power loads that dynamically adjust the load current inversely with the load voltage so that the load power is constant. When simulating a rapid load change, the load in bus 6 (
Figure 2) changes its active power demand according to a step signal.
4.2. Solar Power Plant
The solar power station was modelled in a multi-string inverter system configuration based on the model presented in [
23]. The PV arrays are modelled using the “PV Array block” of the Simscape Electrical package [
24] that represents an array of PV modules, each module being composed of several PV cells connected in series. Each PV module is modelled with the five-parameter and one-diode model. To represent the Boost converter, an average model from the example in [
23] was used. The average model represents the Boost converter by equivalent voltage sources generating the voltage averaged over one cycle of the switching frequency. This model allows using much larger time steps than the detailed model, resulting in a much faster simulation. The inverter was modelled using the “Universal Bridge” block of the Simscape Electrical package [
25]. Like with the boost converter, the inverter was also modelled using the average model that represents the Voltage Source Converter (VSC) inverter by equivalent voltage sources. These equivalent voltage sources generate the AC voltage averaged over one cycle of the switching frequency, making the simulations faster than with the detailed model. The controller for this inverter is based on the controller present in [
26]. Its main goal is to calculate a reference voltage to control the inverter considering the three-phase voltage and current at the solar power plant transformer output. The control ensures that the inverter DC voltage is constant, and the reactive power provided at the output is equal to the reference value established.
A more detailed model would represent the boost converter with a detailed representation of the power electronics. On the other hand, the average model represents the system by equivalent voltage sources. Indeed, the average model does not represent harmonics; however, the dynamics resulting from the control system and the power system interaction are preserved, which is the realm of our investigation. Moreover, the computation time is reduced by a great deal when using the average model.
4.3. Wind Power Plant
The wind power plant model is based on the Simscape model available in [
27] and based on the article [
28]. The doubly fed induction generator (DFIG) was modelled using the “Asynchronous Machine” block of the Simscape Electrical package [
29]. The electrical equivalent circuit is represented in the d- and q- axis. To ensure that the DFIG works at maximum efficiency and that the greatest possible percentage of power is obtained from the wind, it is necessary to connect an AC-DC-AC converter to the rotor. This converter allows to change the rotor speed by transferring power through the machine rotor. The power transferred through the rotor by the AC-DC-AC converter is controlled by the wind turbine control. Appropriate models were used to represent the turbine and the drivetrain, the latter taking into consideration the inertia of the turbine and the mechanical connection between the turbine and the rotor of the DFIG.
4.4. Battery Energy Storage System
The battery was modelled using the “Battery” block of the Simscape Electrical package [
30]. A battery with 15 MW capacity and 10 MWh storage was considered. This block implements the generic dynamic model of a lithium-ion battery. The inverter is a VSC type whose model is the same as the one used in the PV power plant. Moreover, the inverter controller is similar to the one used in the PV power plant. However, in this case, the reference current depends on the imposed output active power (reference active power). The inverter’s DC voltage can change, and the active output power is controlled to be as close to the reference active power as possible. The goal is for the BESS inverter to change its active power output to stabilize the grid frequency.
4.5. Thermal Power Plant
The thermal power plant model was built after the “Synchronous machine pu funda-mental” block of the Simscape Electrical package [
31] to model the mechanical and electrical behavior of the synchronous generator (SG). This power plant works as a swing bus providing the electric power necessary to balance the difference between the power generated and the power requested by the loads. For the thermal power plant to work like this, the electric power reference must be equal to the power at the output terminals of the synchronous generator, as shown in [
32]. If the electric power requested by the grid has rapid changes, the thermal power plant will not be able to provide the requested power. These rapid changes, which the thermal power plant cannot hold, are the focus of this paper. Two additional blocks from the Simscape Electrical package were used to control the SG behavior: the “Steam turbine and governor” block [
33], and the “Excitation system” block [
34].
4.6. Hydropower Plant
The hydroelectric power plant is composed using the SG which is identical to the one used in the thermal power plant and by the controllers. Like in the thermal power plant, two additional blocks from the Simscape Electrical package were used to control the SG behavior: the “Hydraulic Turbine and Governor” block [
35], and the “Excitation System” block [
34].
4.7. Grid Total Inertia
The frequency is a characteristic of the system. All the power units are aggregated into one unit, represented by a single mass model like in [
12]. Therefore, the system inertia,
, can be obtained by considering the amount of inertia each element of the system provides in relation to its percentage of the total system’s power, as seen in Equation (3):
where
is the generator
rated power,
the inertia and
the total rated capacity of the power system (sum of all the generator’s individual rated capacities).
Considering the system inertia and the imbalance between the total load and generation power, Equation (4) is obtained:
where
the nominal frequency,
is the frequency of the system,
the total power being generated and
the power being consumed. Equation (4) is essential to understand the frequency variations that will be studied in the next section.
5. Results and Discussion
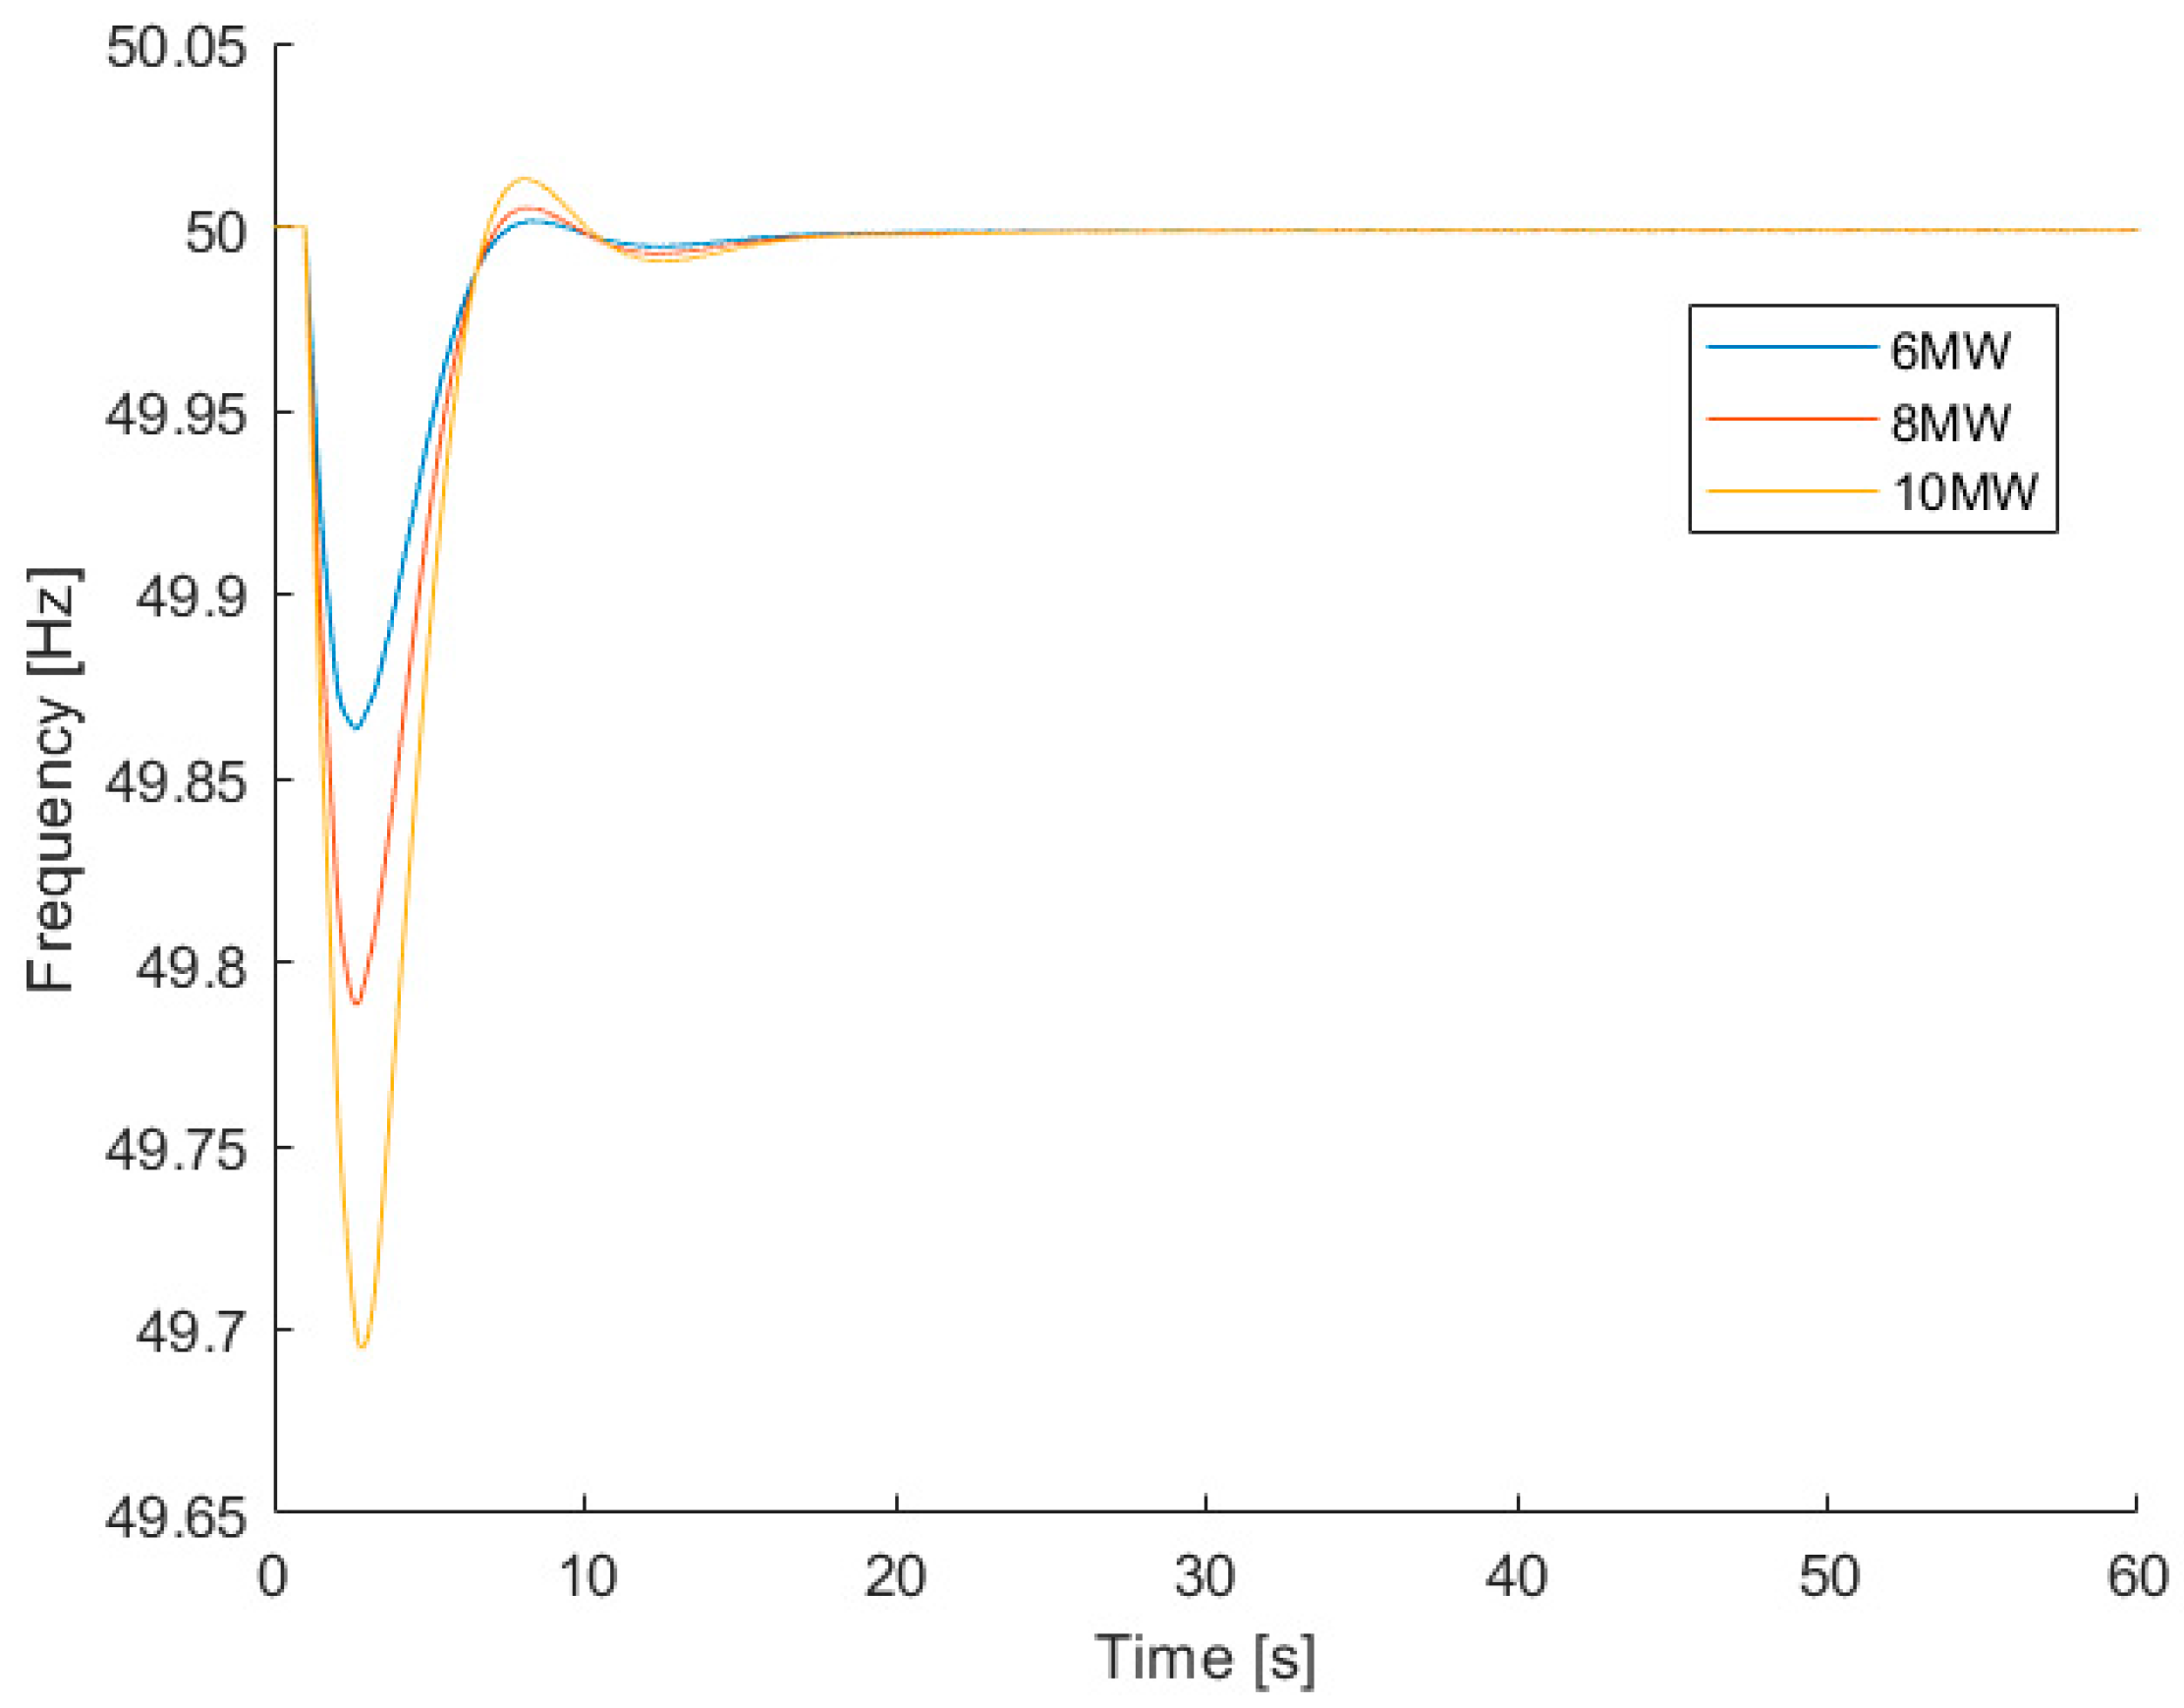
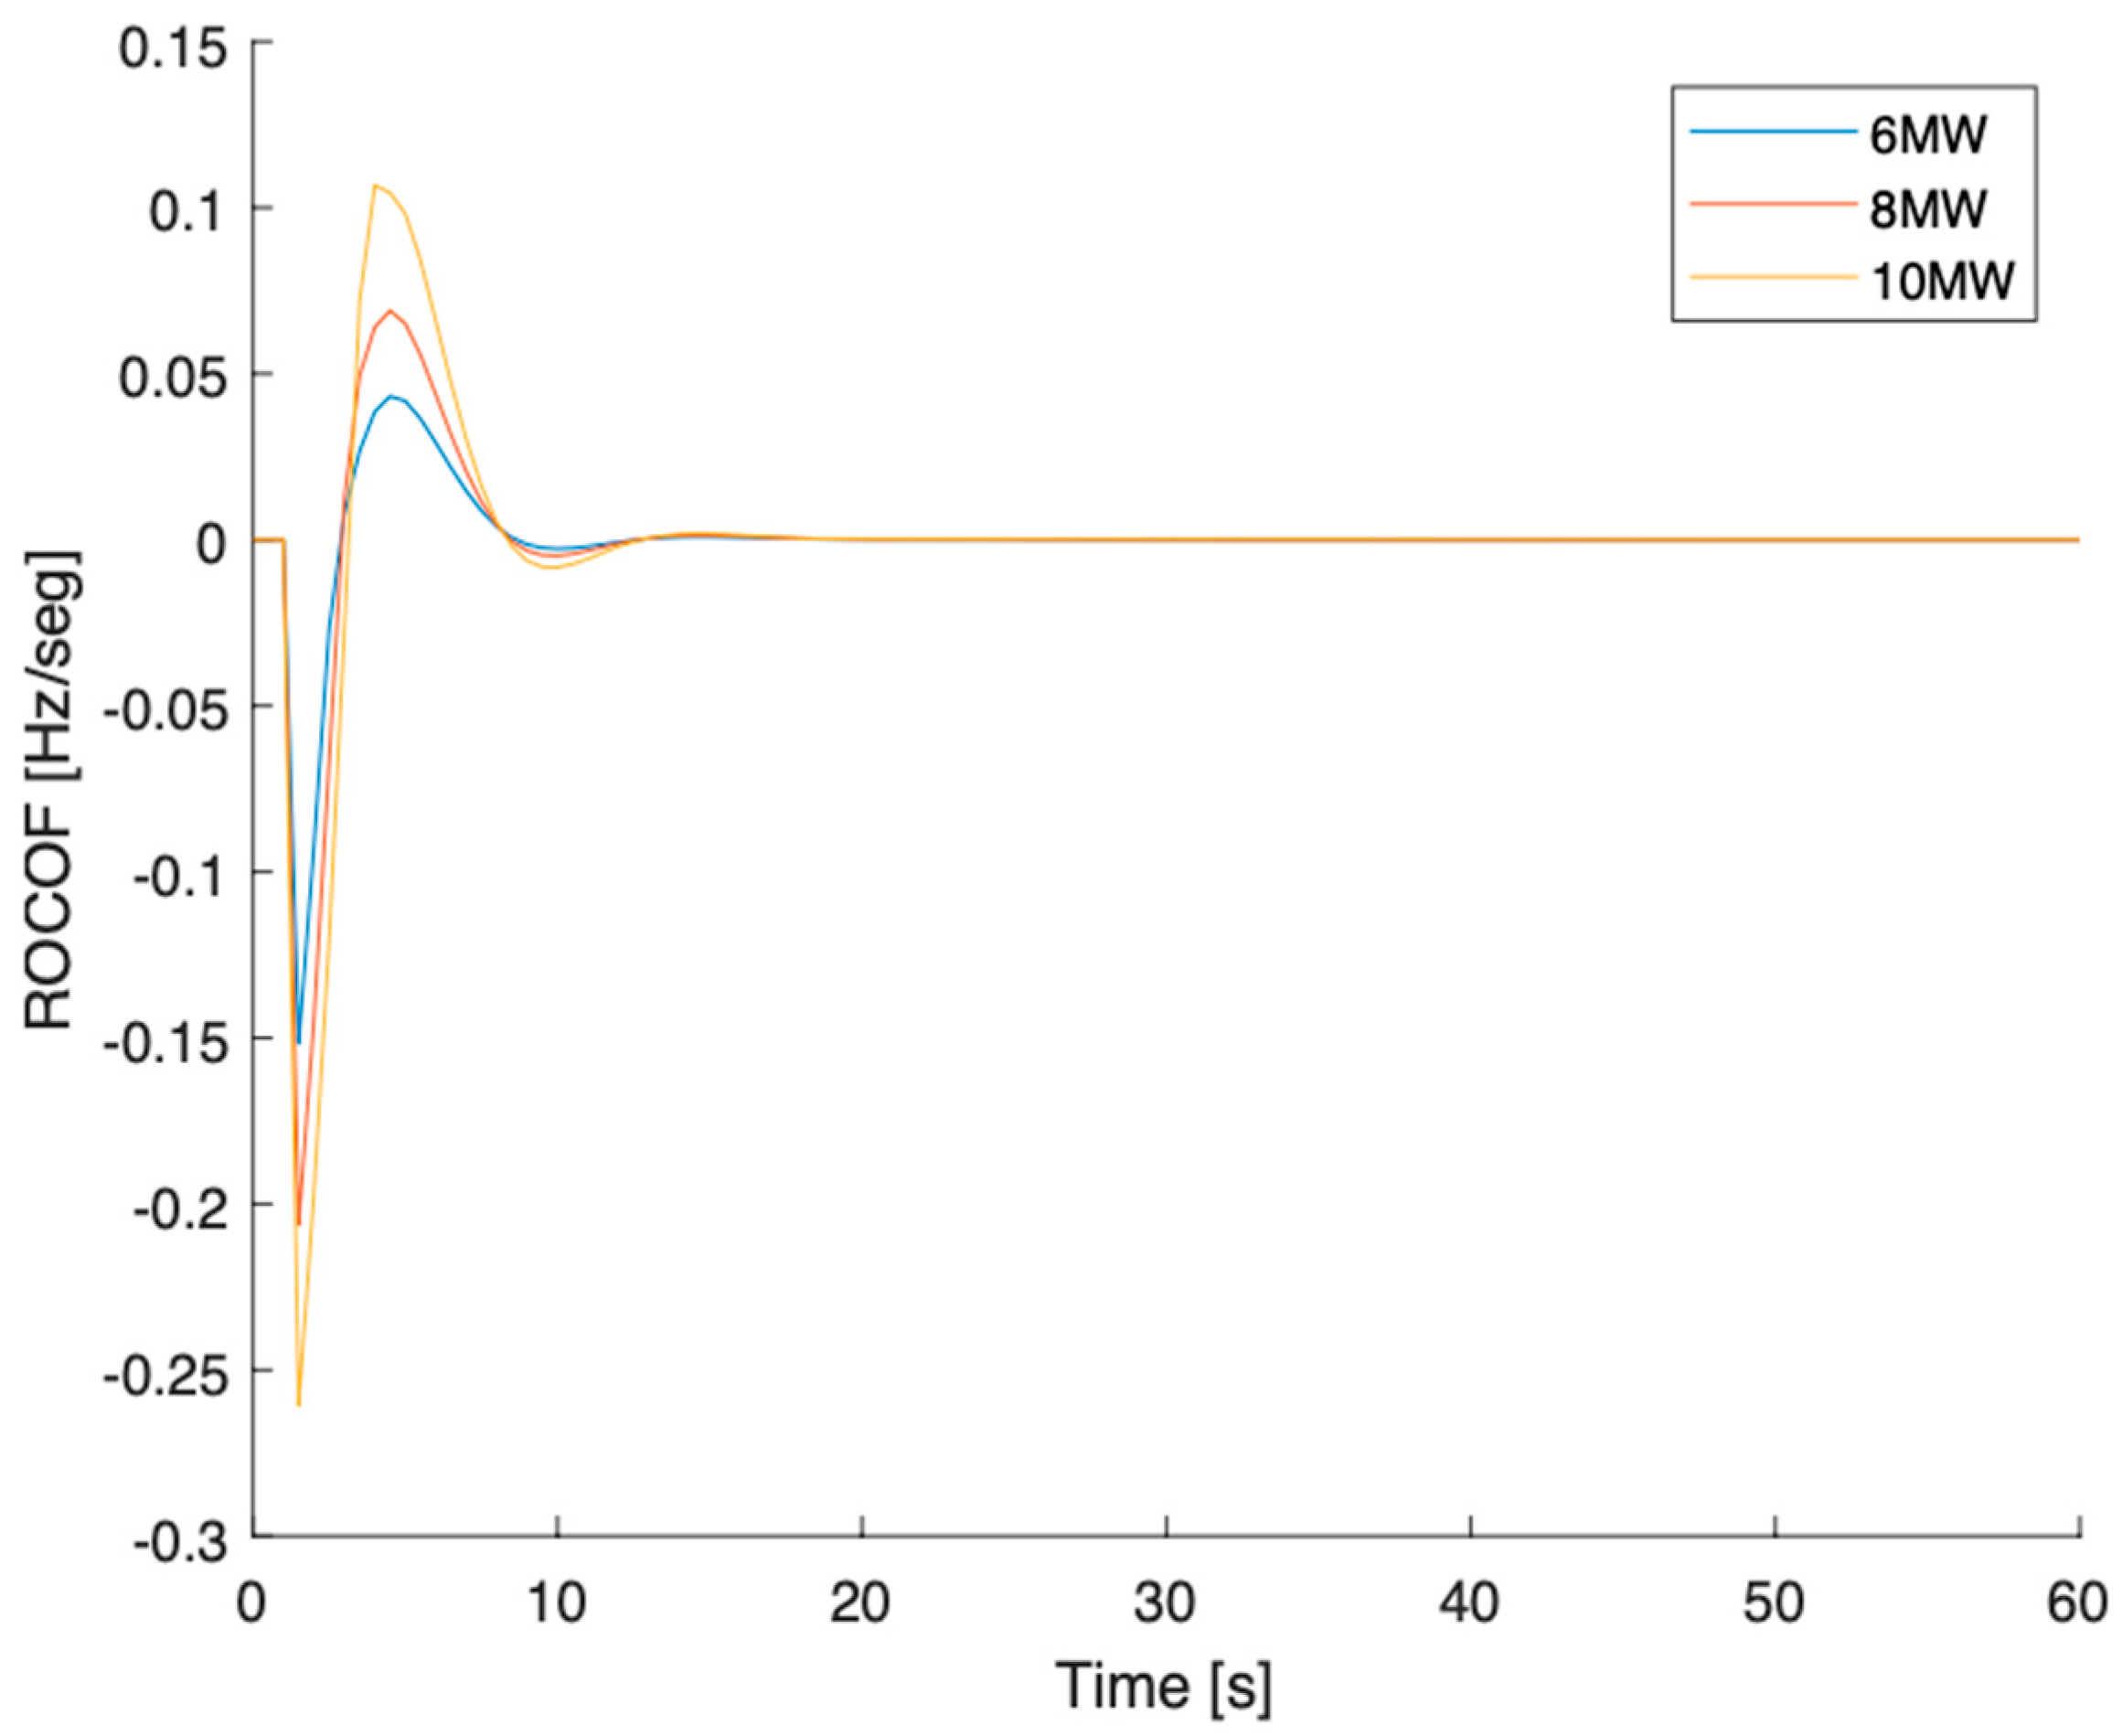
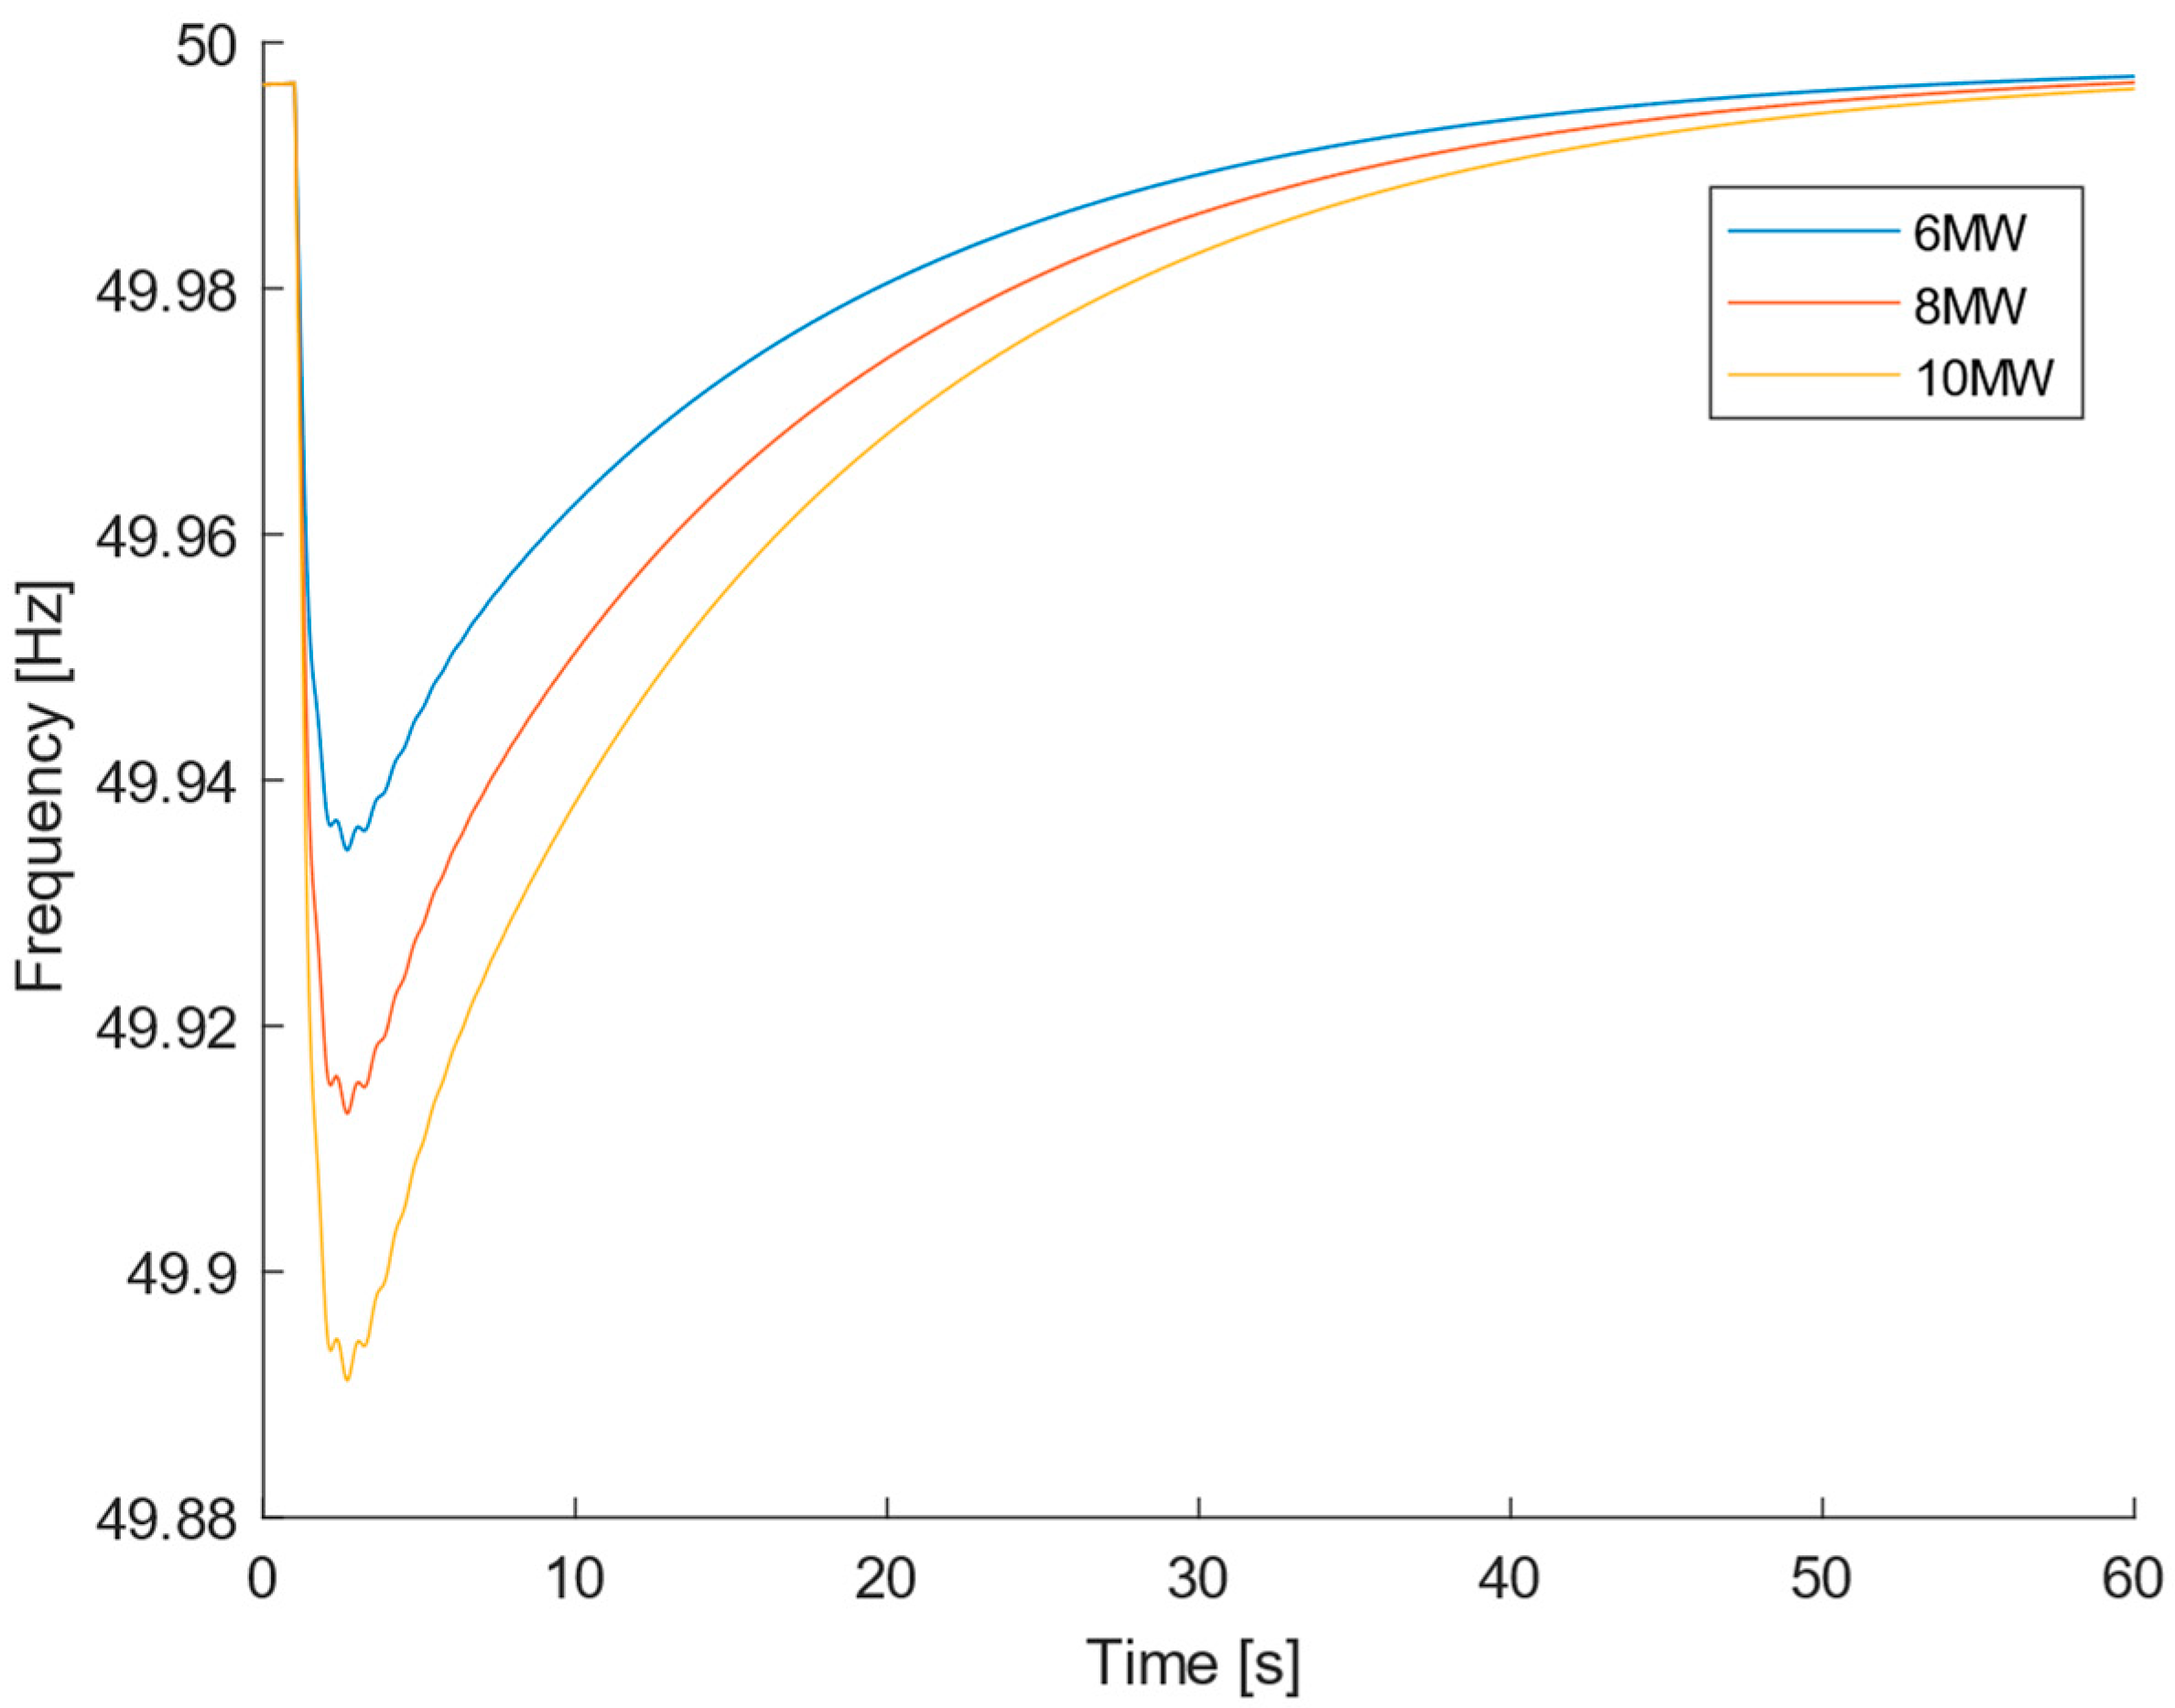
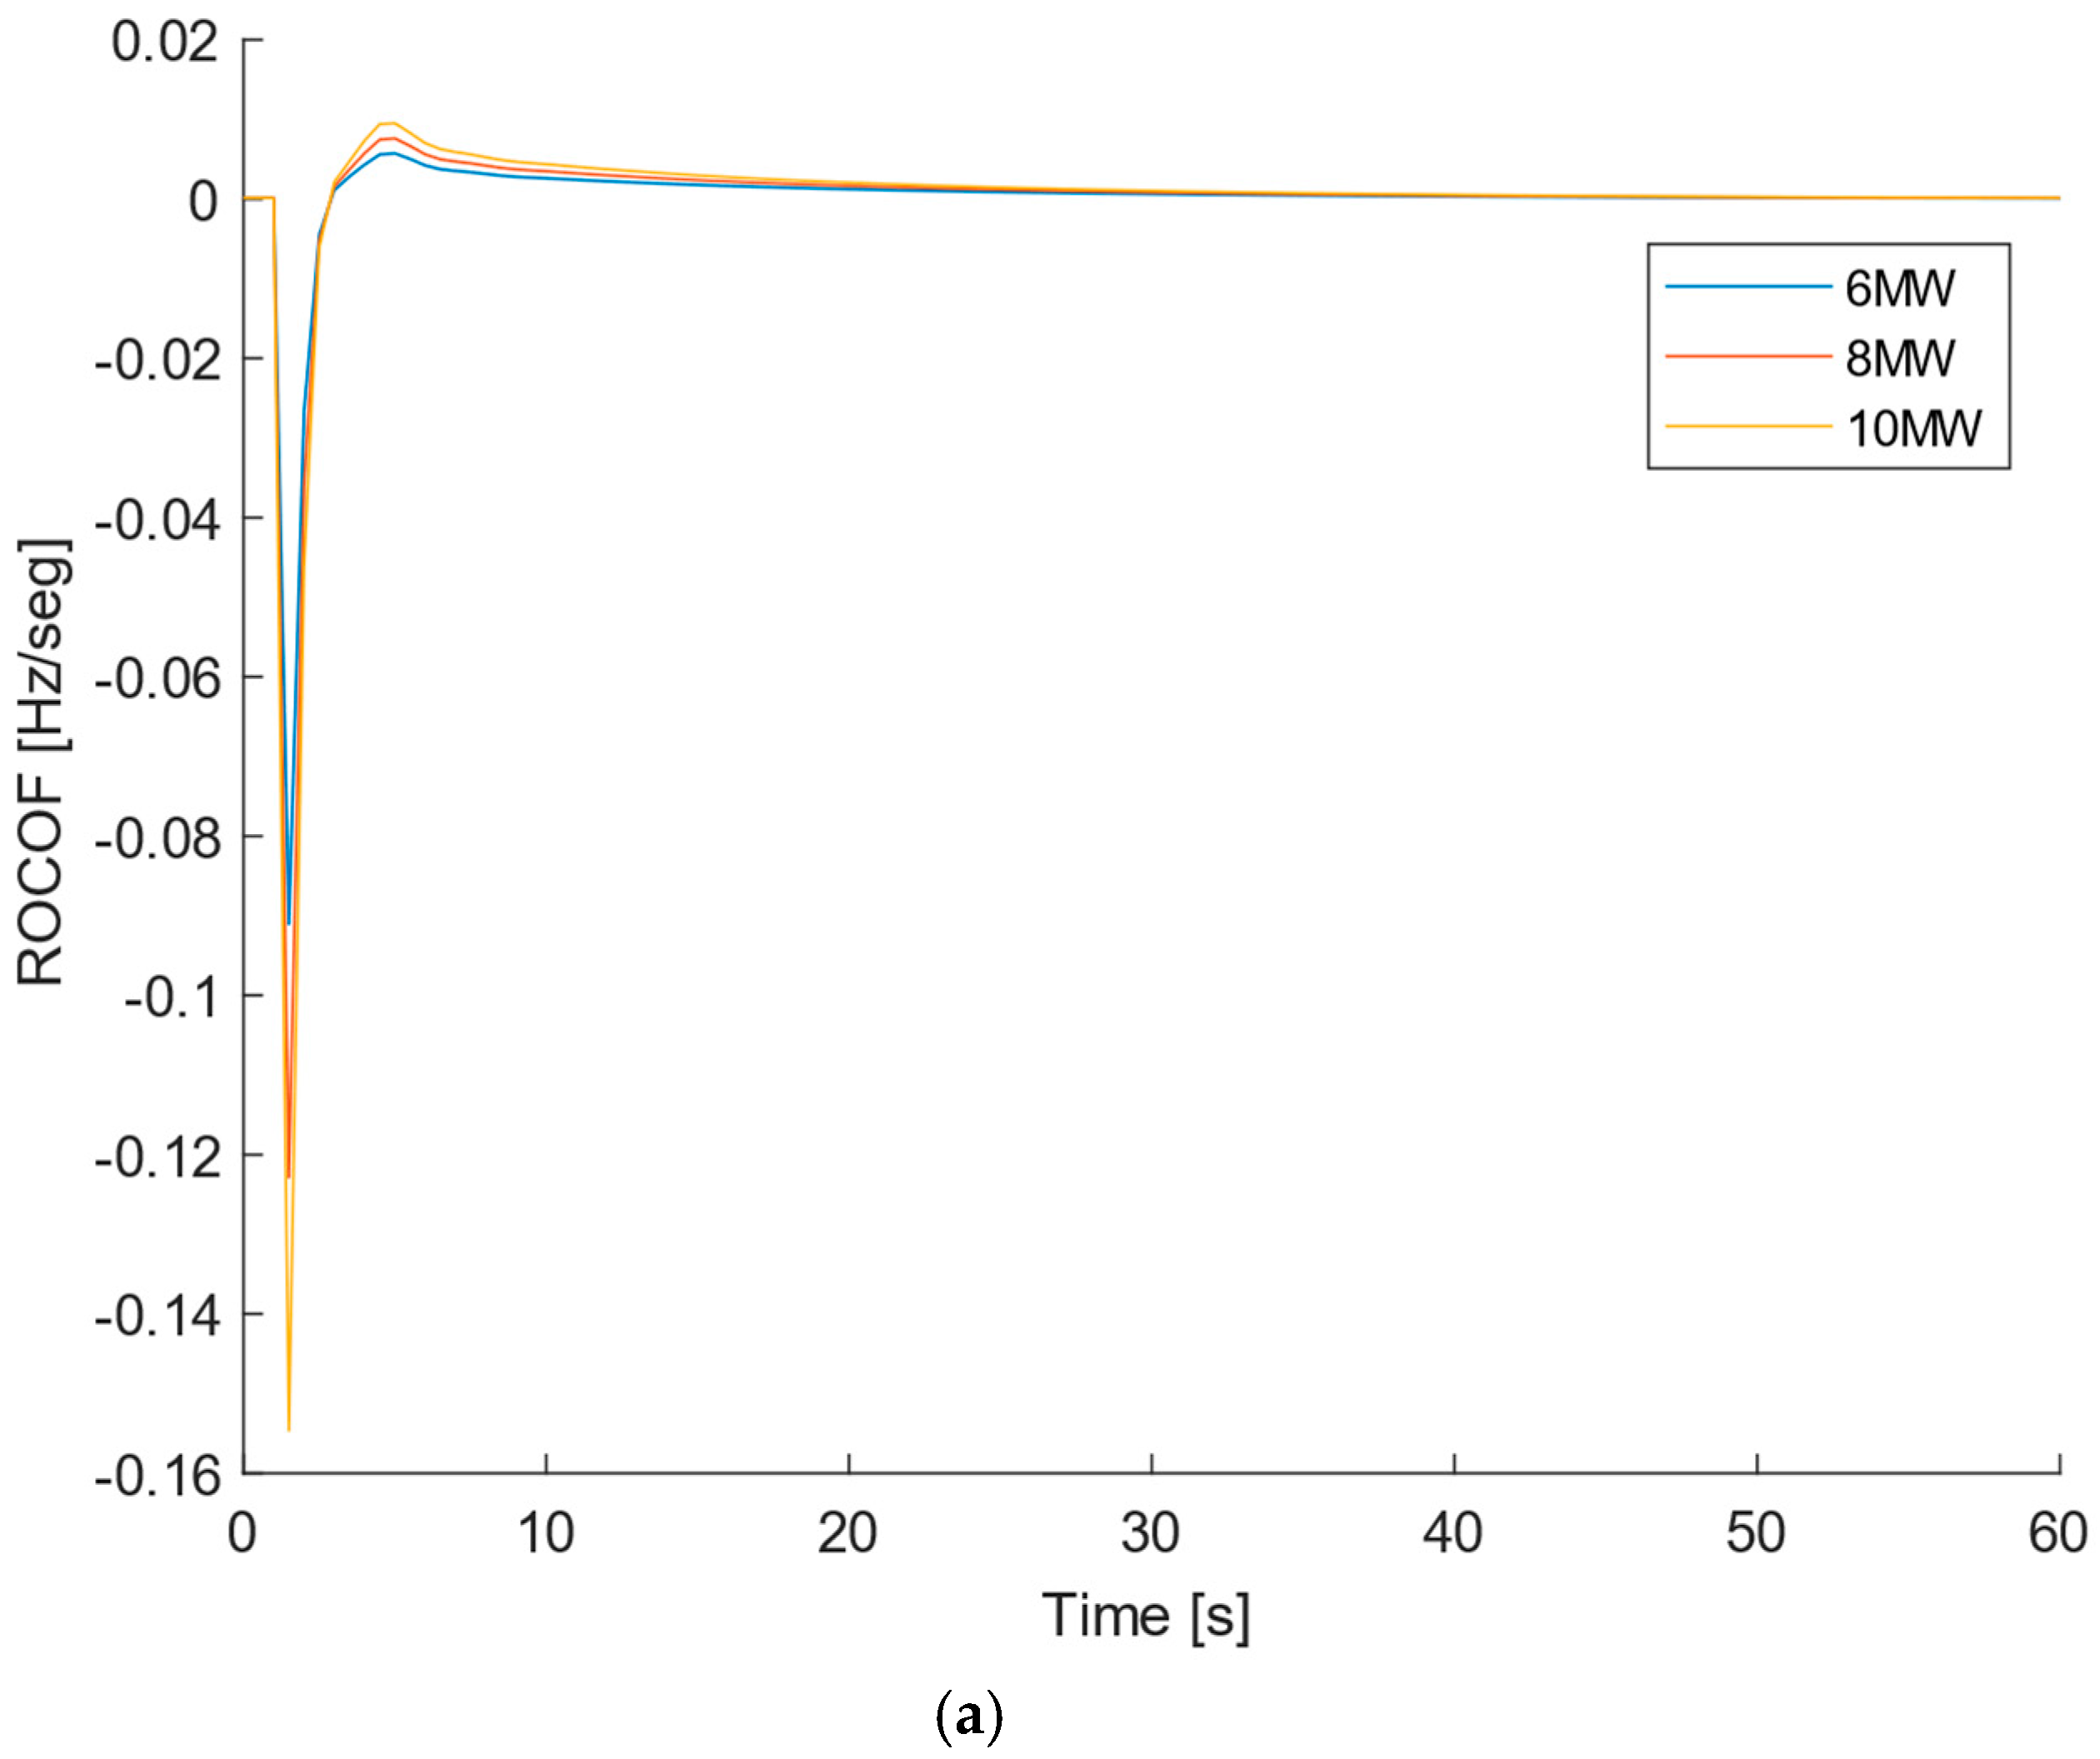
5.1. Load Step Increase
Current scenario
Three load step increases with different magnitudes, +6 MW, +8 MW and +10 MW, were applied to the load connected to bus 6 (
Figure 2) at time
t = 1 seg (considering that in
t = 0 seg, the system is in a steady state). The results for the frequency and ROCOF variation are shown in
Figure 3 and
Figure 4. It is possible to see that an increase in the load demand results in a decrease in the frequency, as predicted according to Equation (4). It is also visible that a bigger load increase results in a smaller minimal frequency. Furthermore, the ROCOF reaches higher absolute values for higher load changes, like it was theoretically predicted. According to Equation (4), the greater the difference between the generated power and the load demand, the greater the ROCOF.
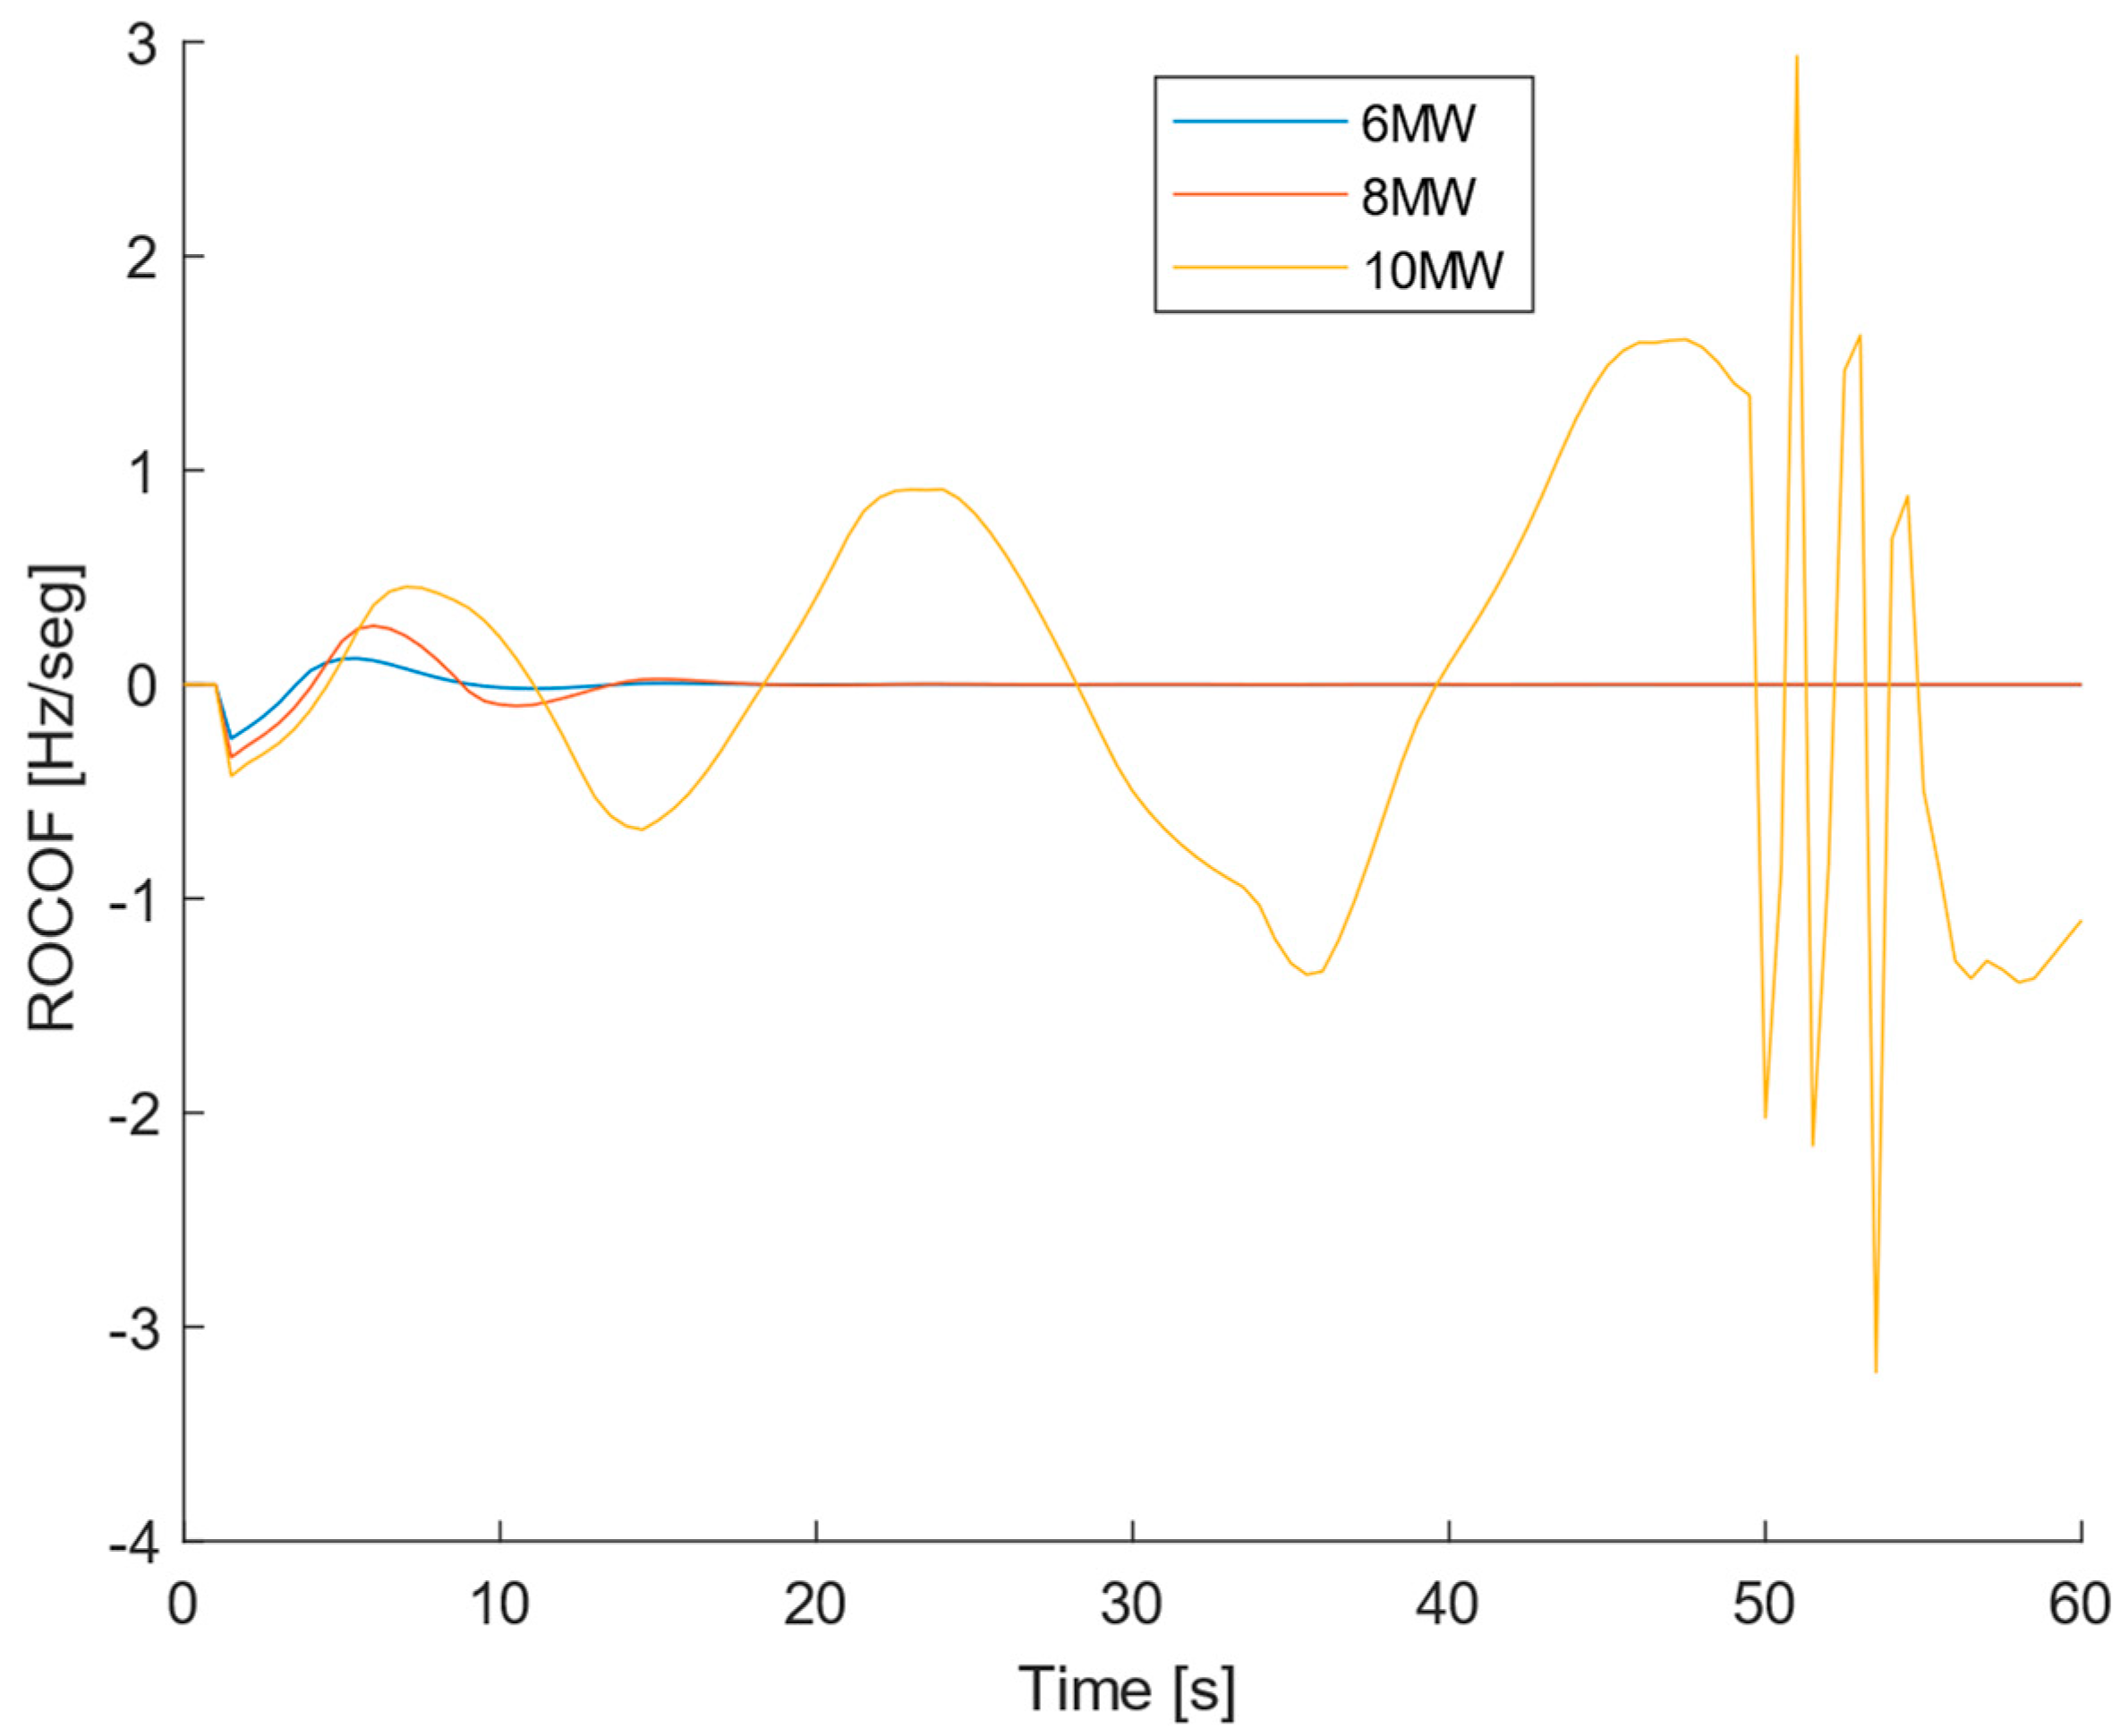
Future scenario
The same load step increase was applied in bus 6 for the future scenario conditions and the results are shown in
Figure 5 and
Figure 6. By observing
Figure 5, it is visible that the frequency reached such low values for the +10 MW load increase that the SG desynchronized, and the system collapsed. The system collapse can be explained by the fact that, in the future scenario, the conventional thermoelectric power plant provides less nominal power, and more power comes from the solar power plant that does not provide inertia. Therefore, the system is less capable of resisting bigger disturbances. Once more, it is also possible to verify that a bigger load increase results in a smaller minimal frequency and a more pronounced absolute value of ROCOF.
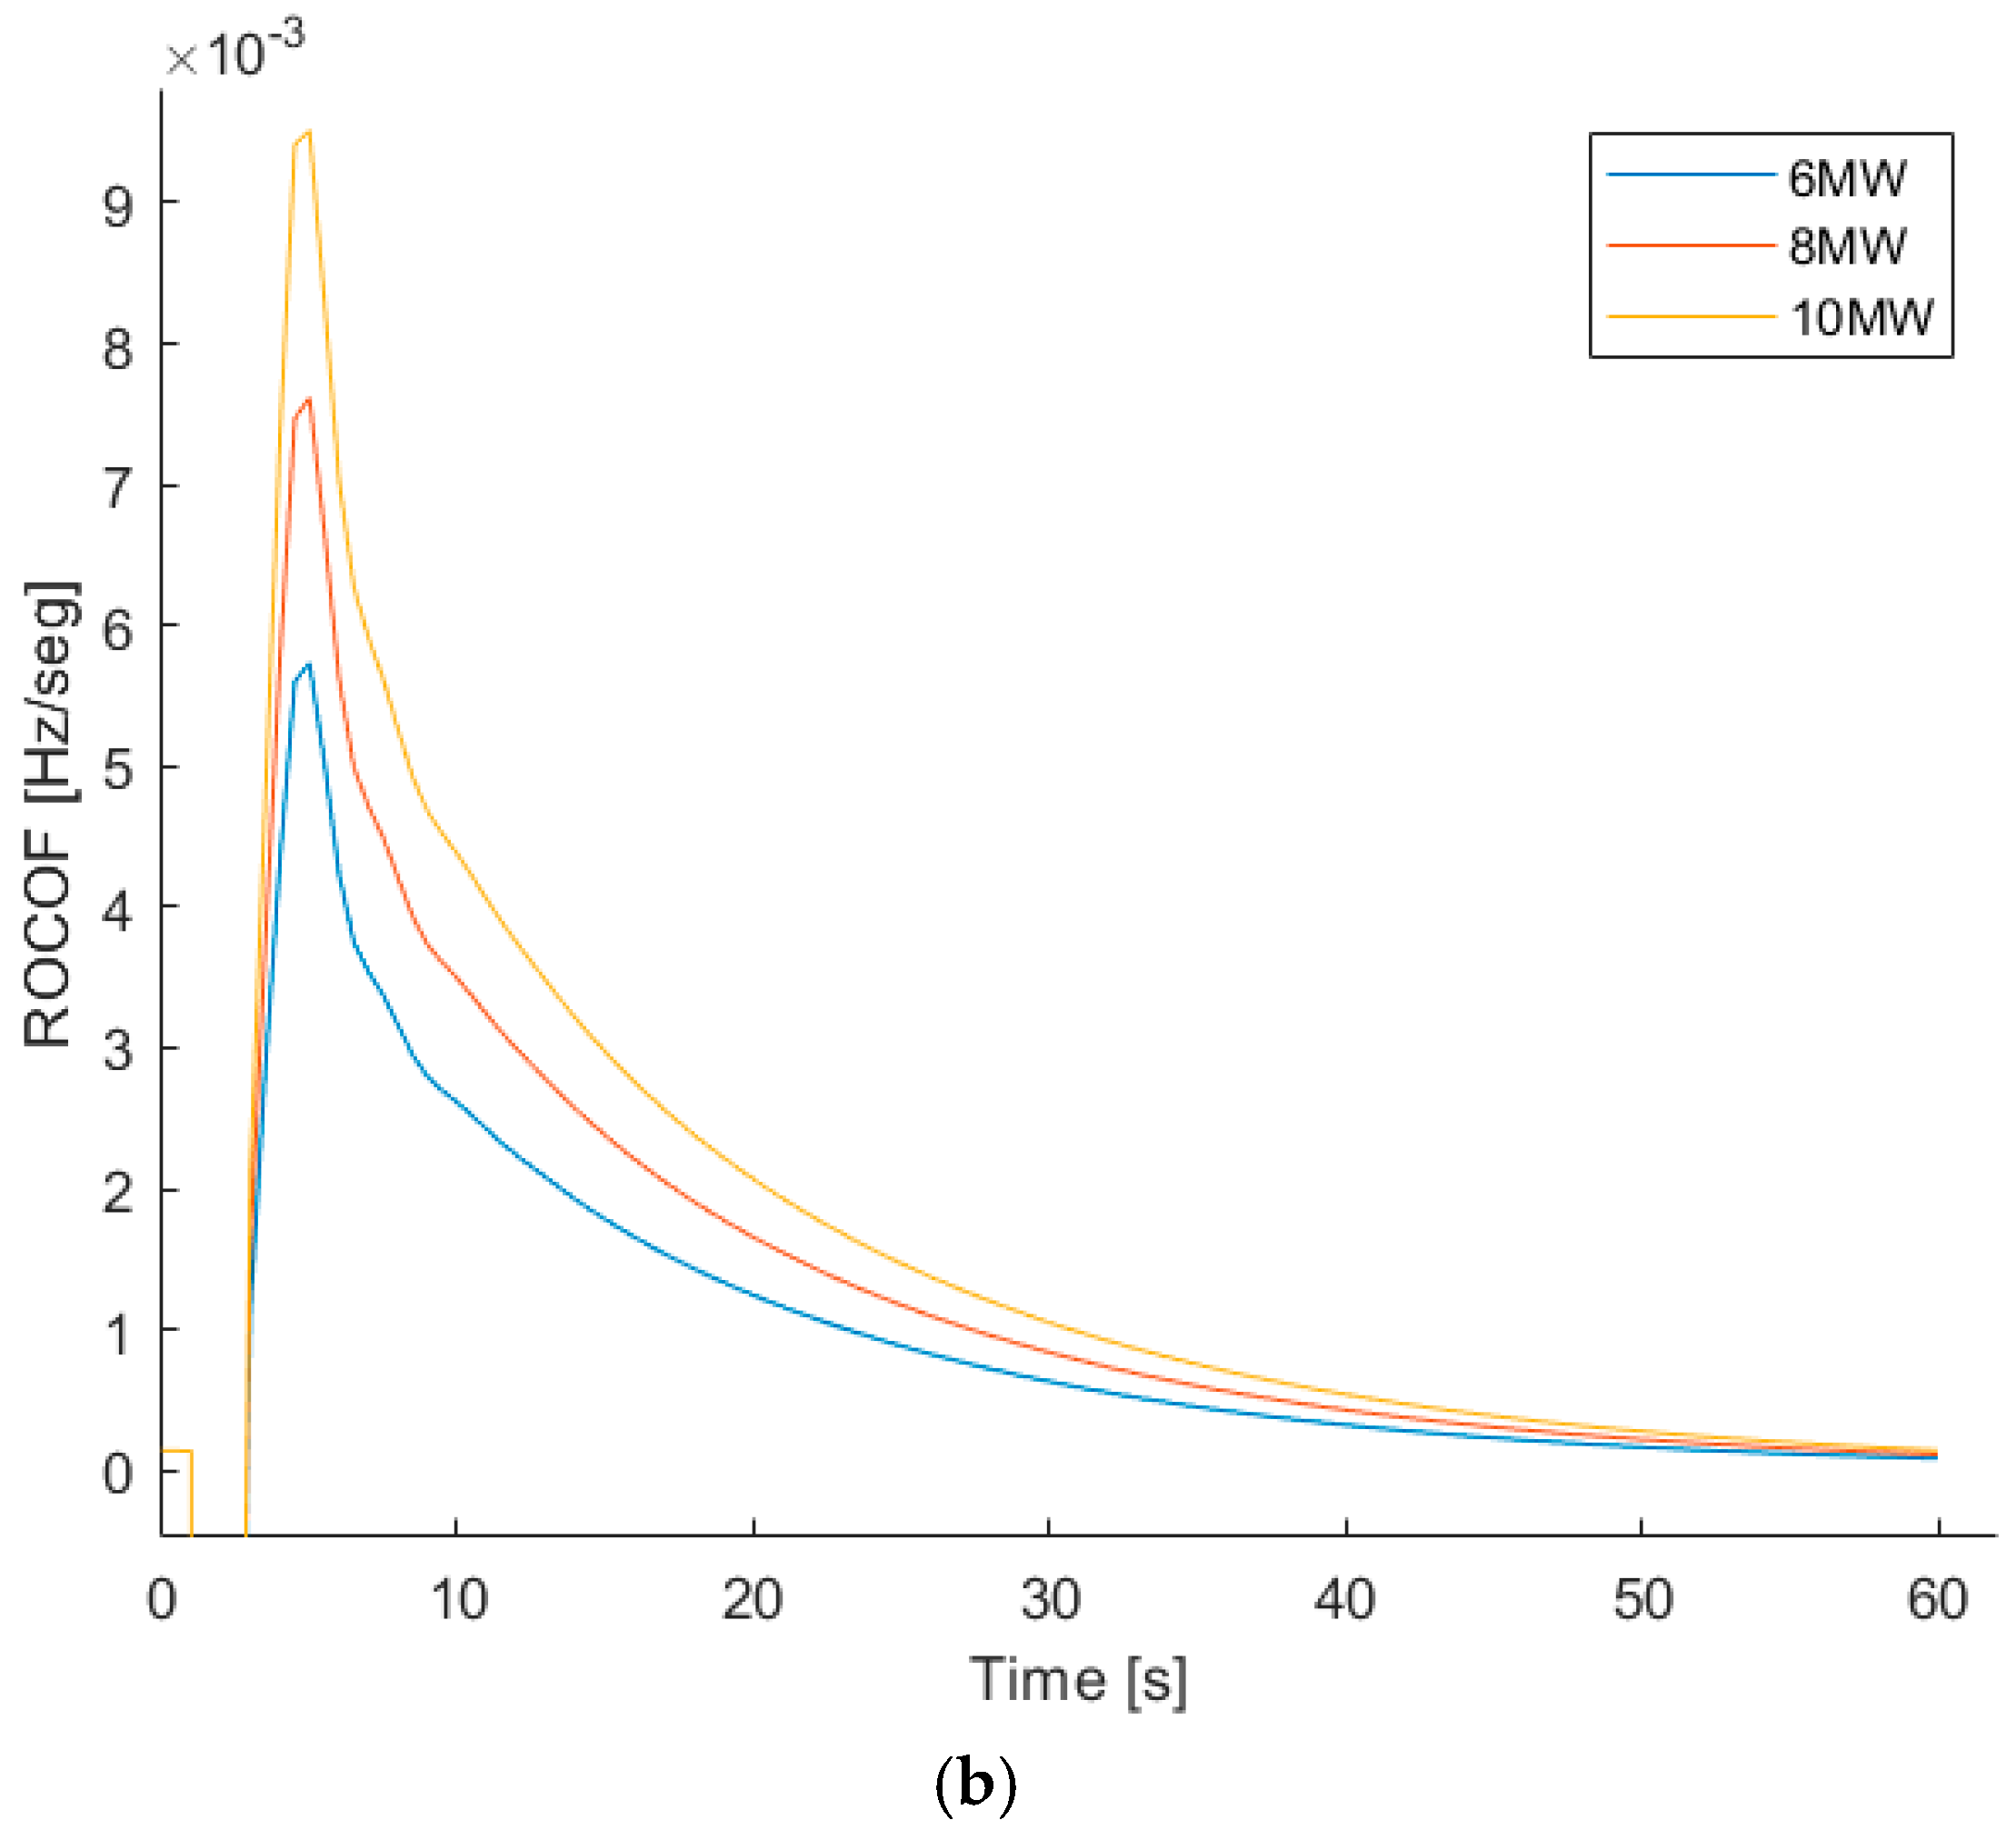
The behavior of the system after the Synchronous Generator has desynchronized should not be considered as the system is not working anymore. In real conditions, the system would have been disconnected by the protections and ROCOF relay following the first swing of the frequency. In our paper, the behavior of the protections was not implemented, but we let the simulation continue just to show what would happen if the protection system failed. According to the definition of ROCOF, Equation (2), the rise and fall of the frequency concerning the previous value translate into a positive and negative ROCOF, respectively.
Future scenario with a BESS
When applying a load step increase in the future scenario with a BESS, the results are shown in
Figure 7 and
Figure 8a. Adding a BESS to the future scenario makes it evident that the frequency does not reach such low values as in the current scenario and future scenario without a BESS. Furthermore, the frequency goes back to a steady state even for the more aggressive load increase of 10 MW. This means a huge increase in the frequency stability, as the system did not collapse as it did for the 10 MW load increase in the future scenario without a BESS. The frequency is more stable with the use of the BESS because it is faster to react than the thermal power plant. The thermal power plant has a lower nominal power in the future scenario than in the current scenario and, therefore, less inertia.
As it is possible to see in
Figure 8b, which is a zoom-in of
Figure 8a, after 40 s, the ROCOF is still not zero and the frequency is still rising to meet the steady point of 50 Hz.
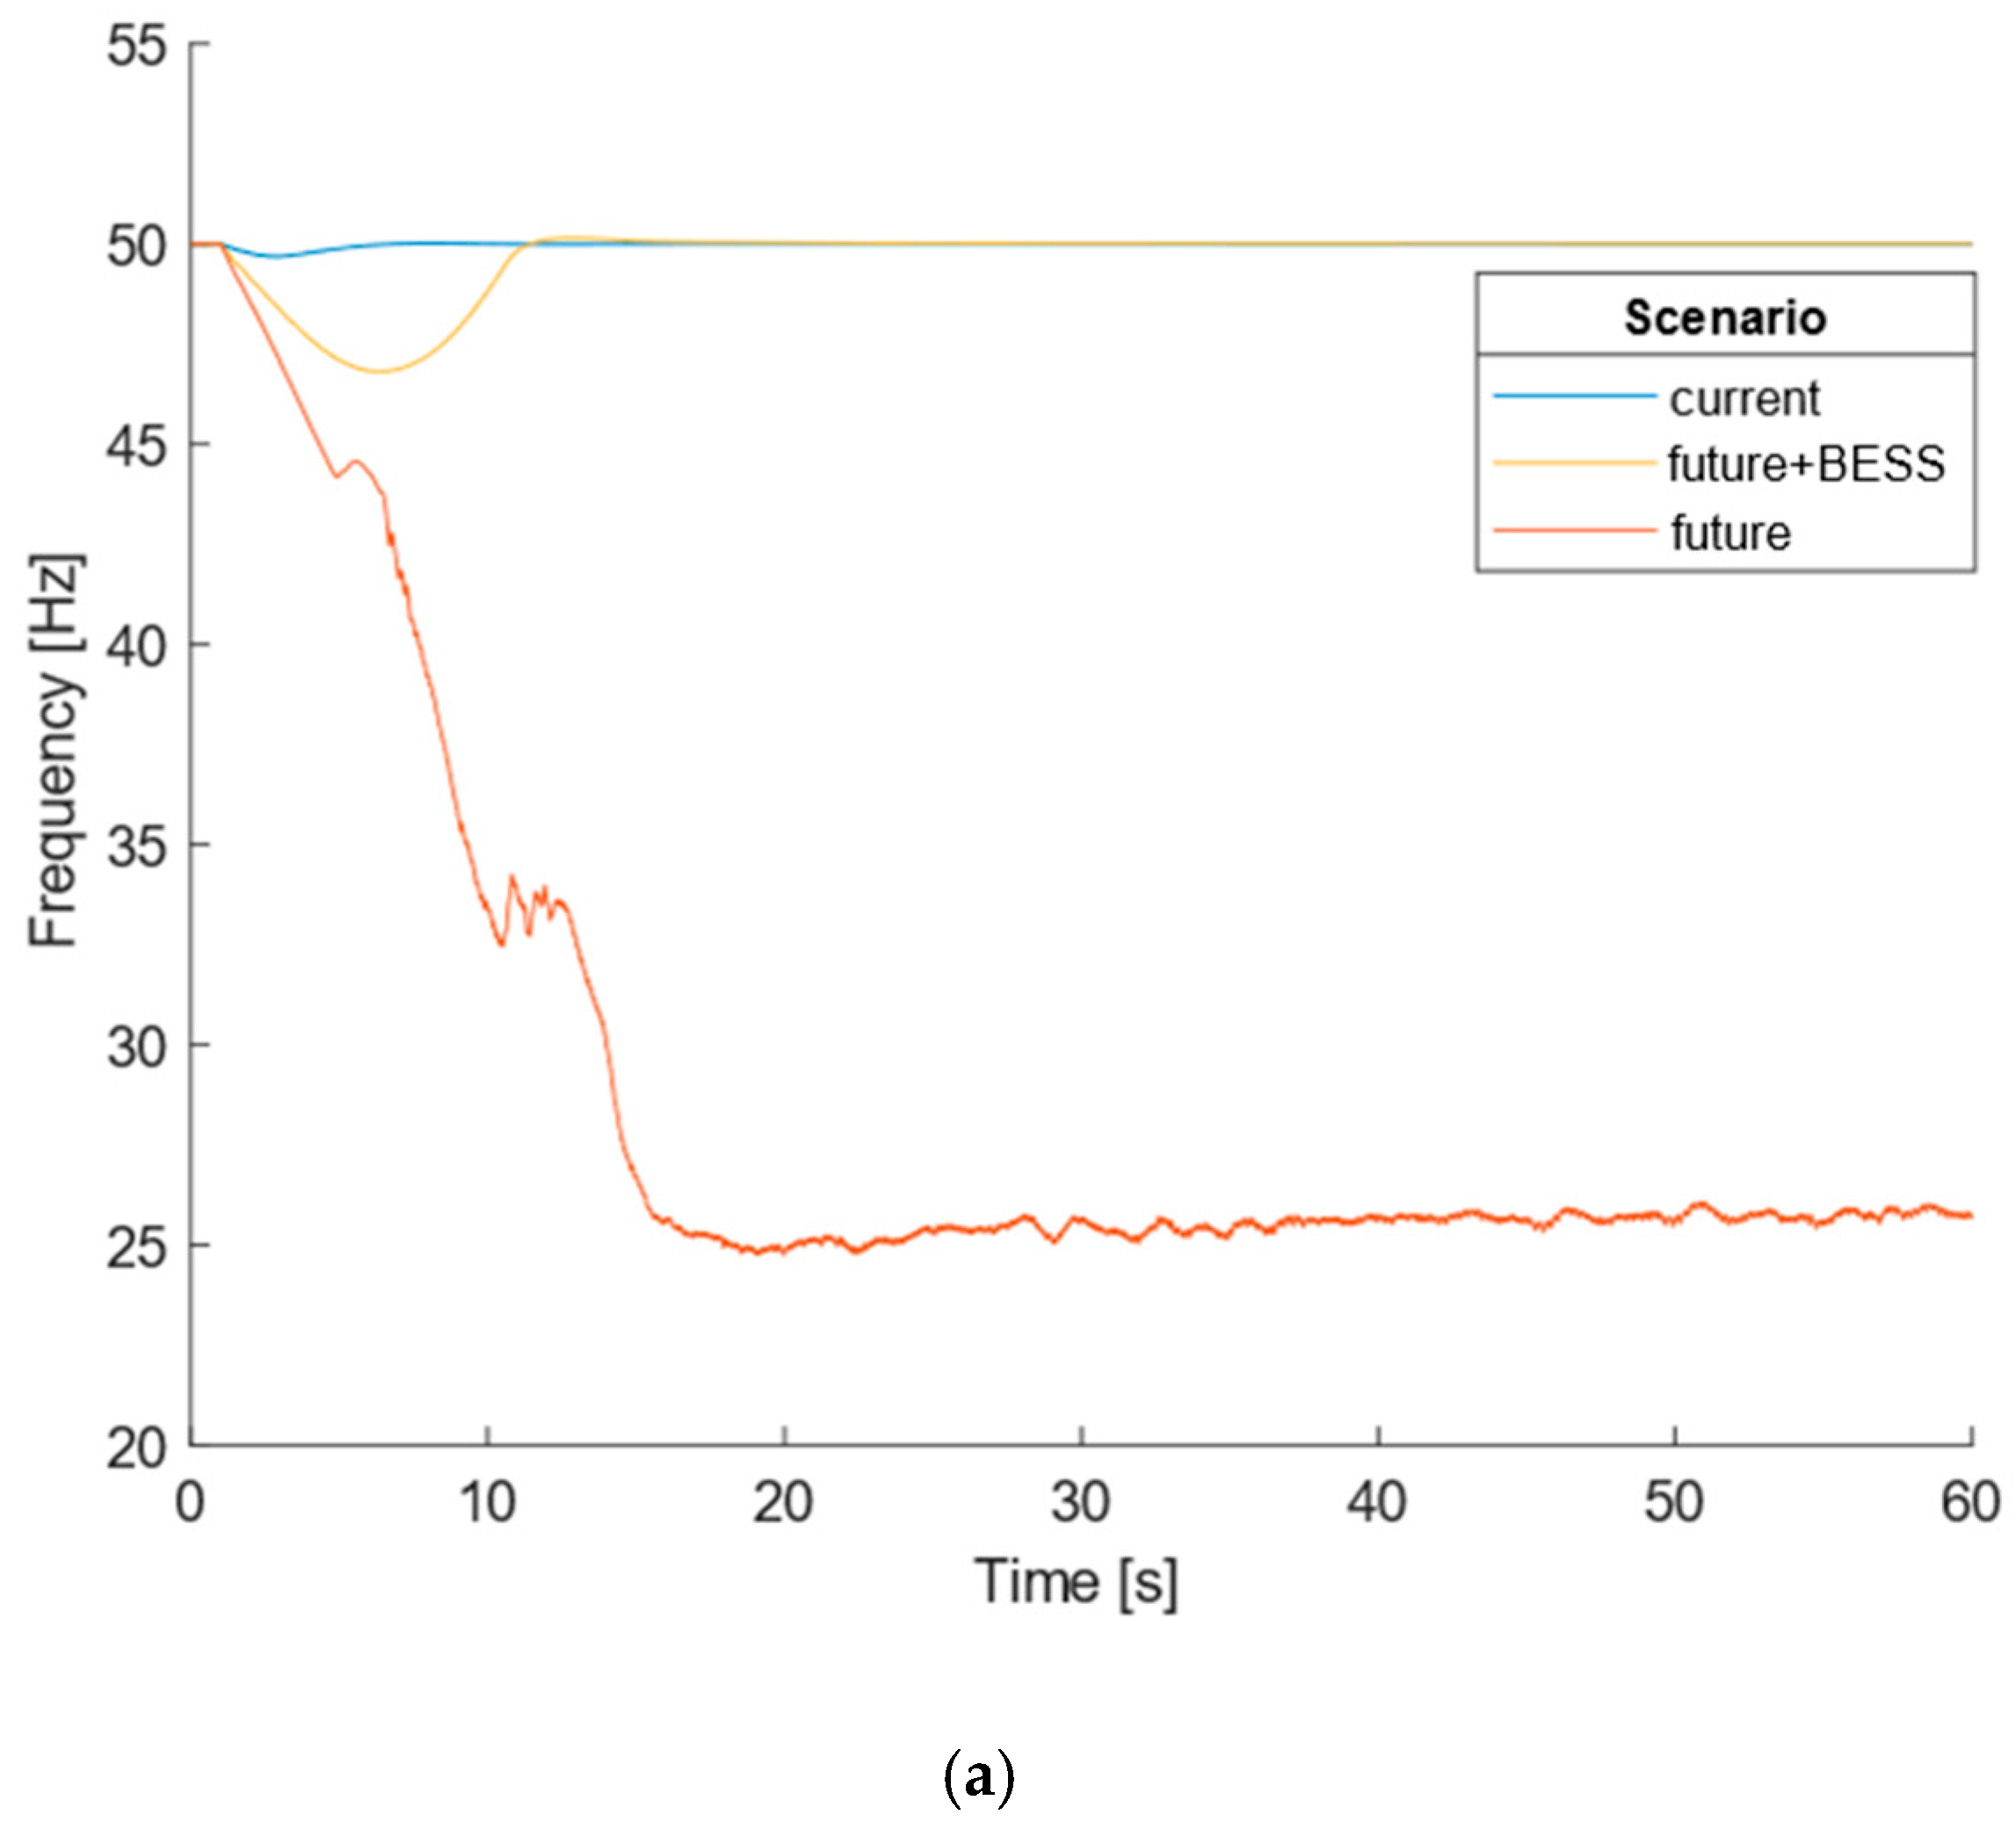
5.2. Generation Loss
For the generation loss disturbance, a 50% decrease in the irradiance that hits the solar panels (from 1000 W/m
2 to 500 W/m
2) was analyzed. This translates into a 50% decrease (−35 MW) in the PV power supplied in the future scenario with and without a BESS. For the current scenario, a 50% decrease in the irradiance means a −10 MW decrease in the power. The effect this disturbance has on the frequency and ROCOF is shown in
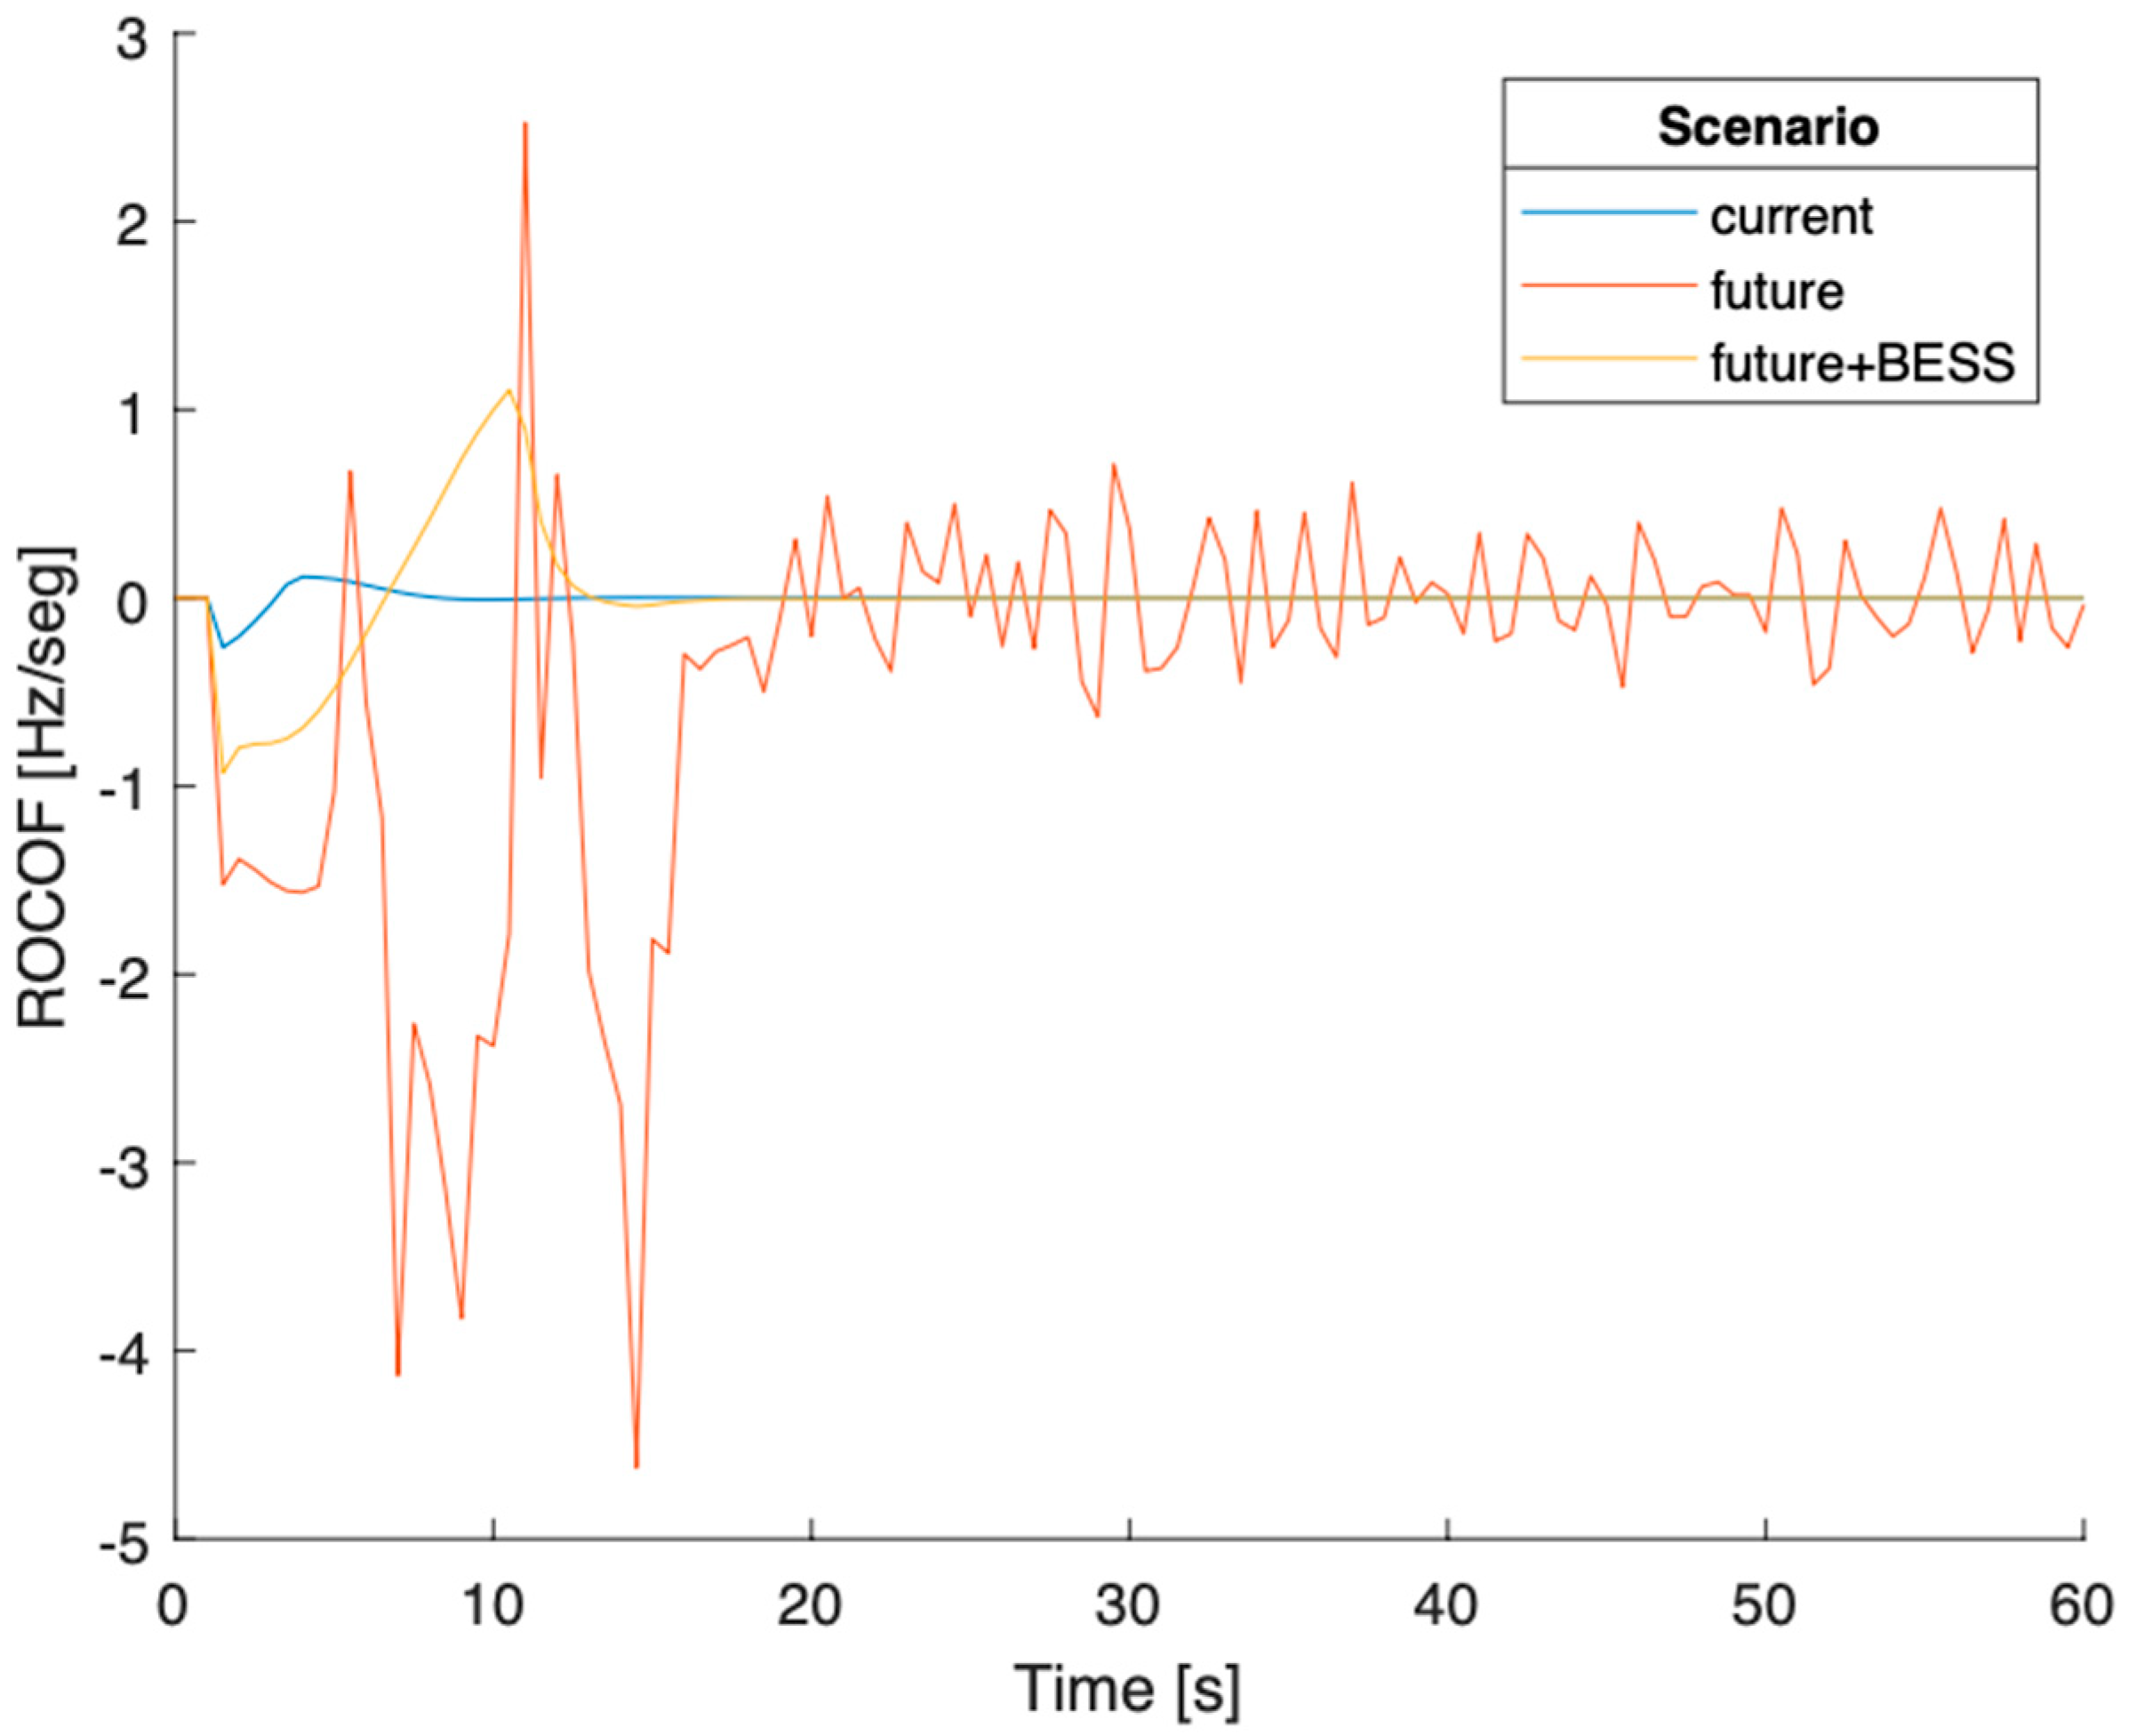
Figure 9a and
Figure 10.
The generated power decreased, and the load demand stayed constant. Therefore, according to Equation (4), the frequency has a negative variation, as can be confirmed in
Figure 9a and
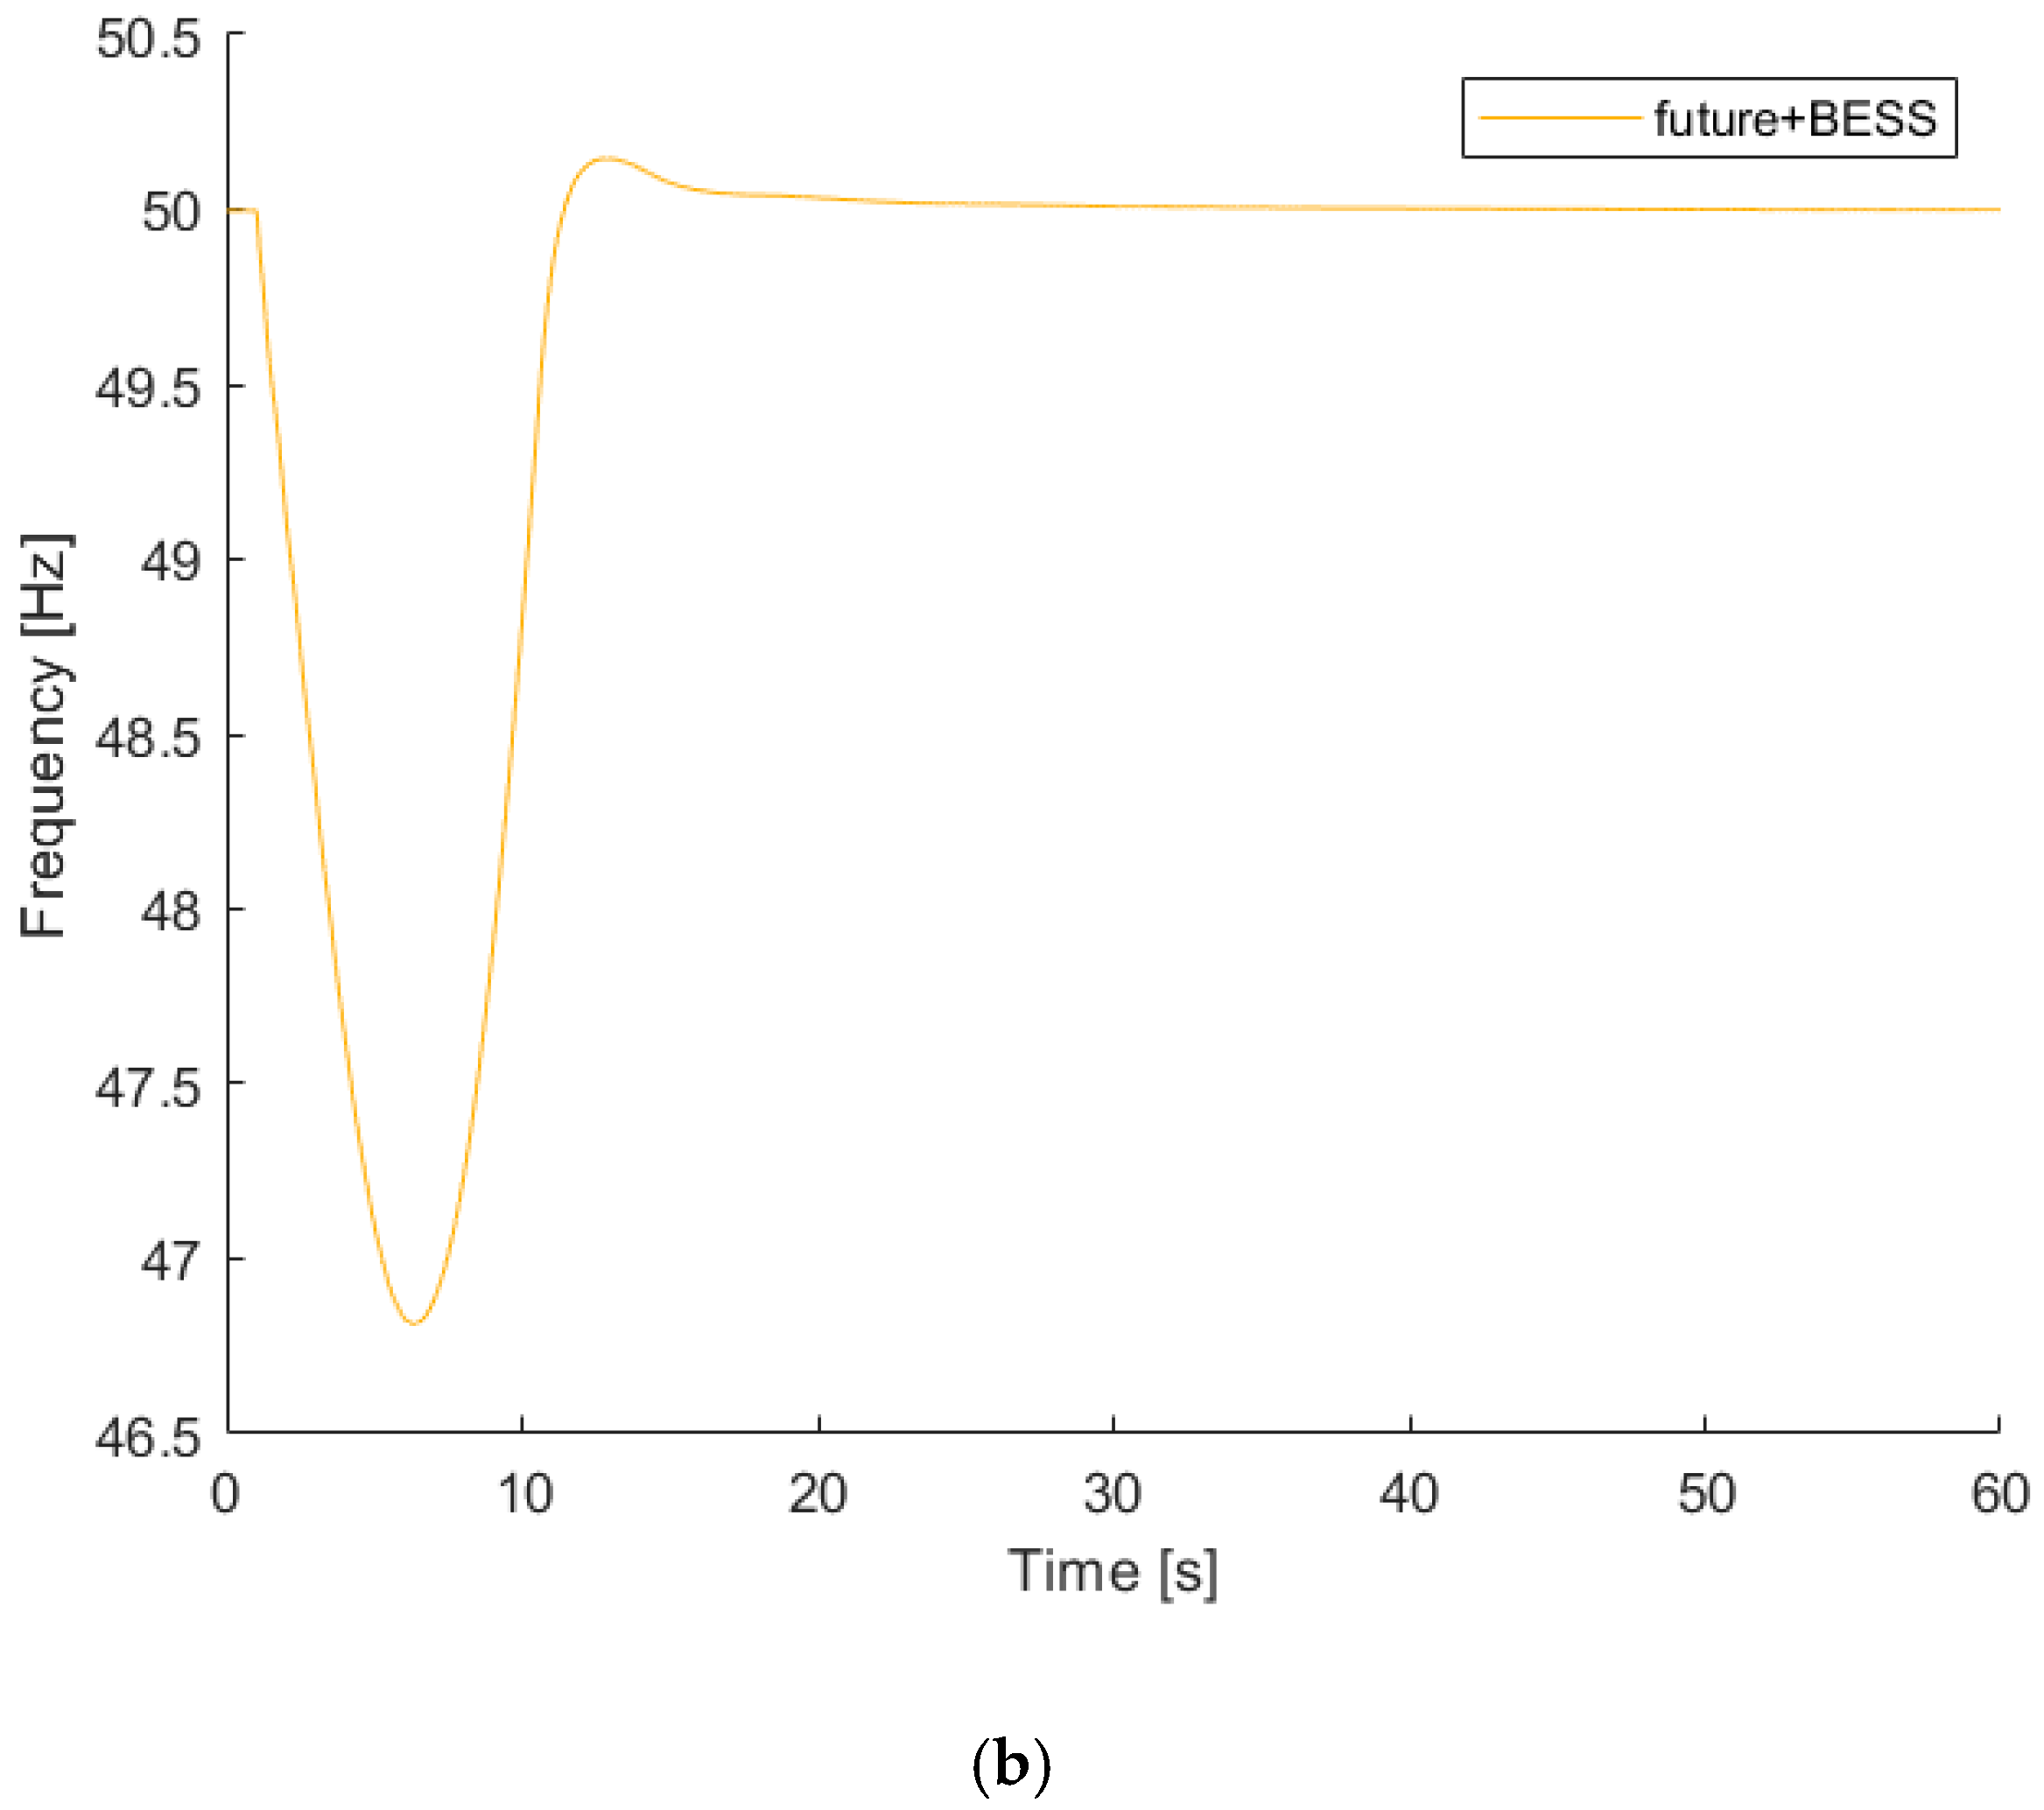
Figure 10. In the future scenario without a BESS, the SG desynchronized, and the system collapsed. However, when adding a BESS, the system could go back to a steady state, but not before reaching a minimal frequency of 46.81 Hz, which would undoubtedly cause problems in the grid. The grid’s frequency cannot reach such values because that would affect the work of industrial machines that depend on the grid frequency to be near 50 Hz. Therefore, in the real world, the frequency would not reach 46.81 Hz because the load-shedding protection would have been activated before that. However, it is still remarkable that the BESS brought the system back to a steady state, even for such a significant disturbance in the generation (−35 MW).
The spike across zero, which is visible in
Figure 10, is due to the frequency rising a bit above 50 Hz before falling to 50 Hz, as may be seen in
Figure 9a. This is illustrated in
Figure 9b, which shows a zoom-in of the y-scale of
Figure 9a.
5.3. Ground Fault
The third type of disturbance simulated was a three-phase ground fault in bus 5 at
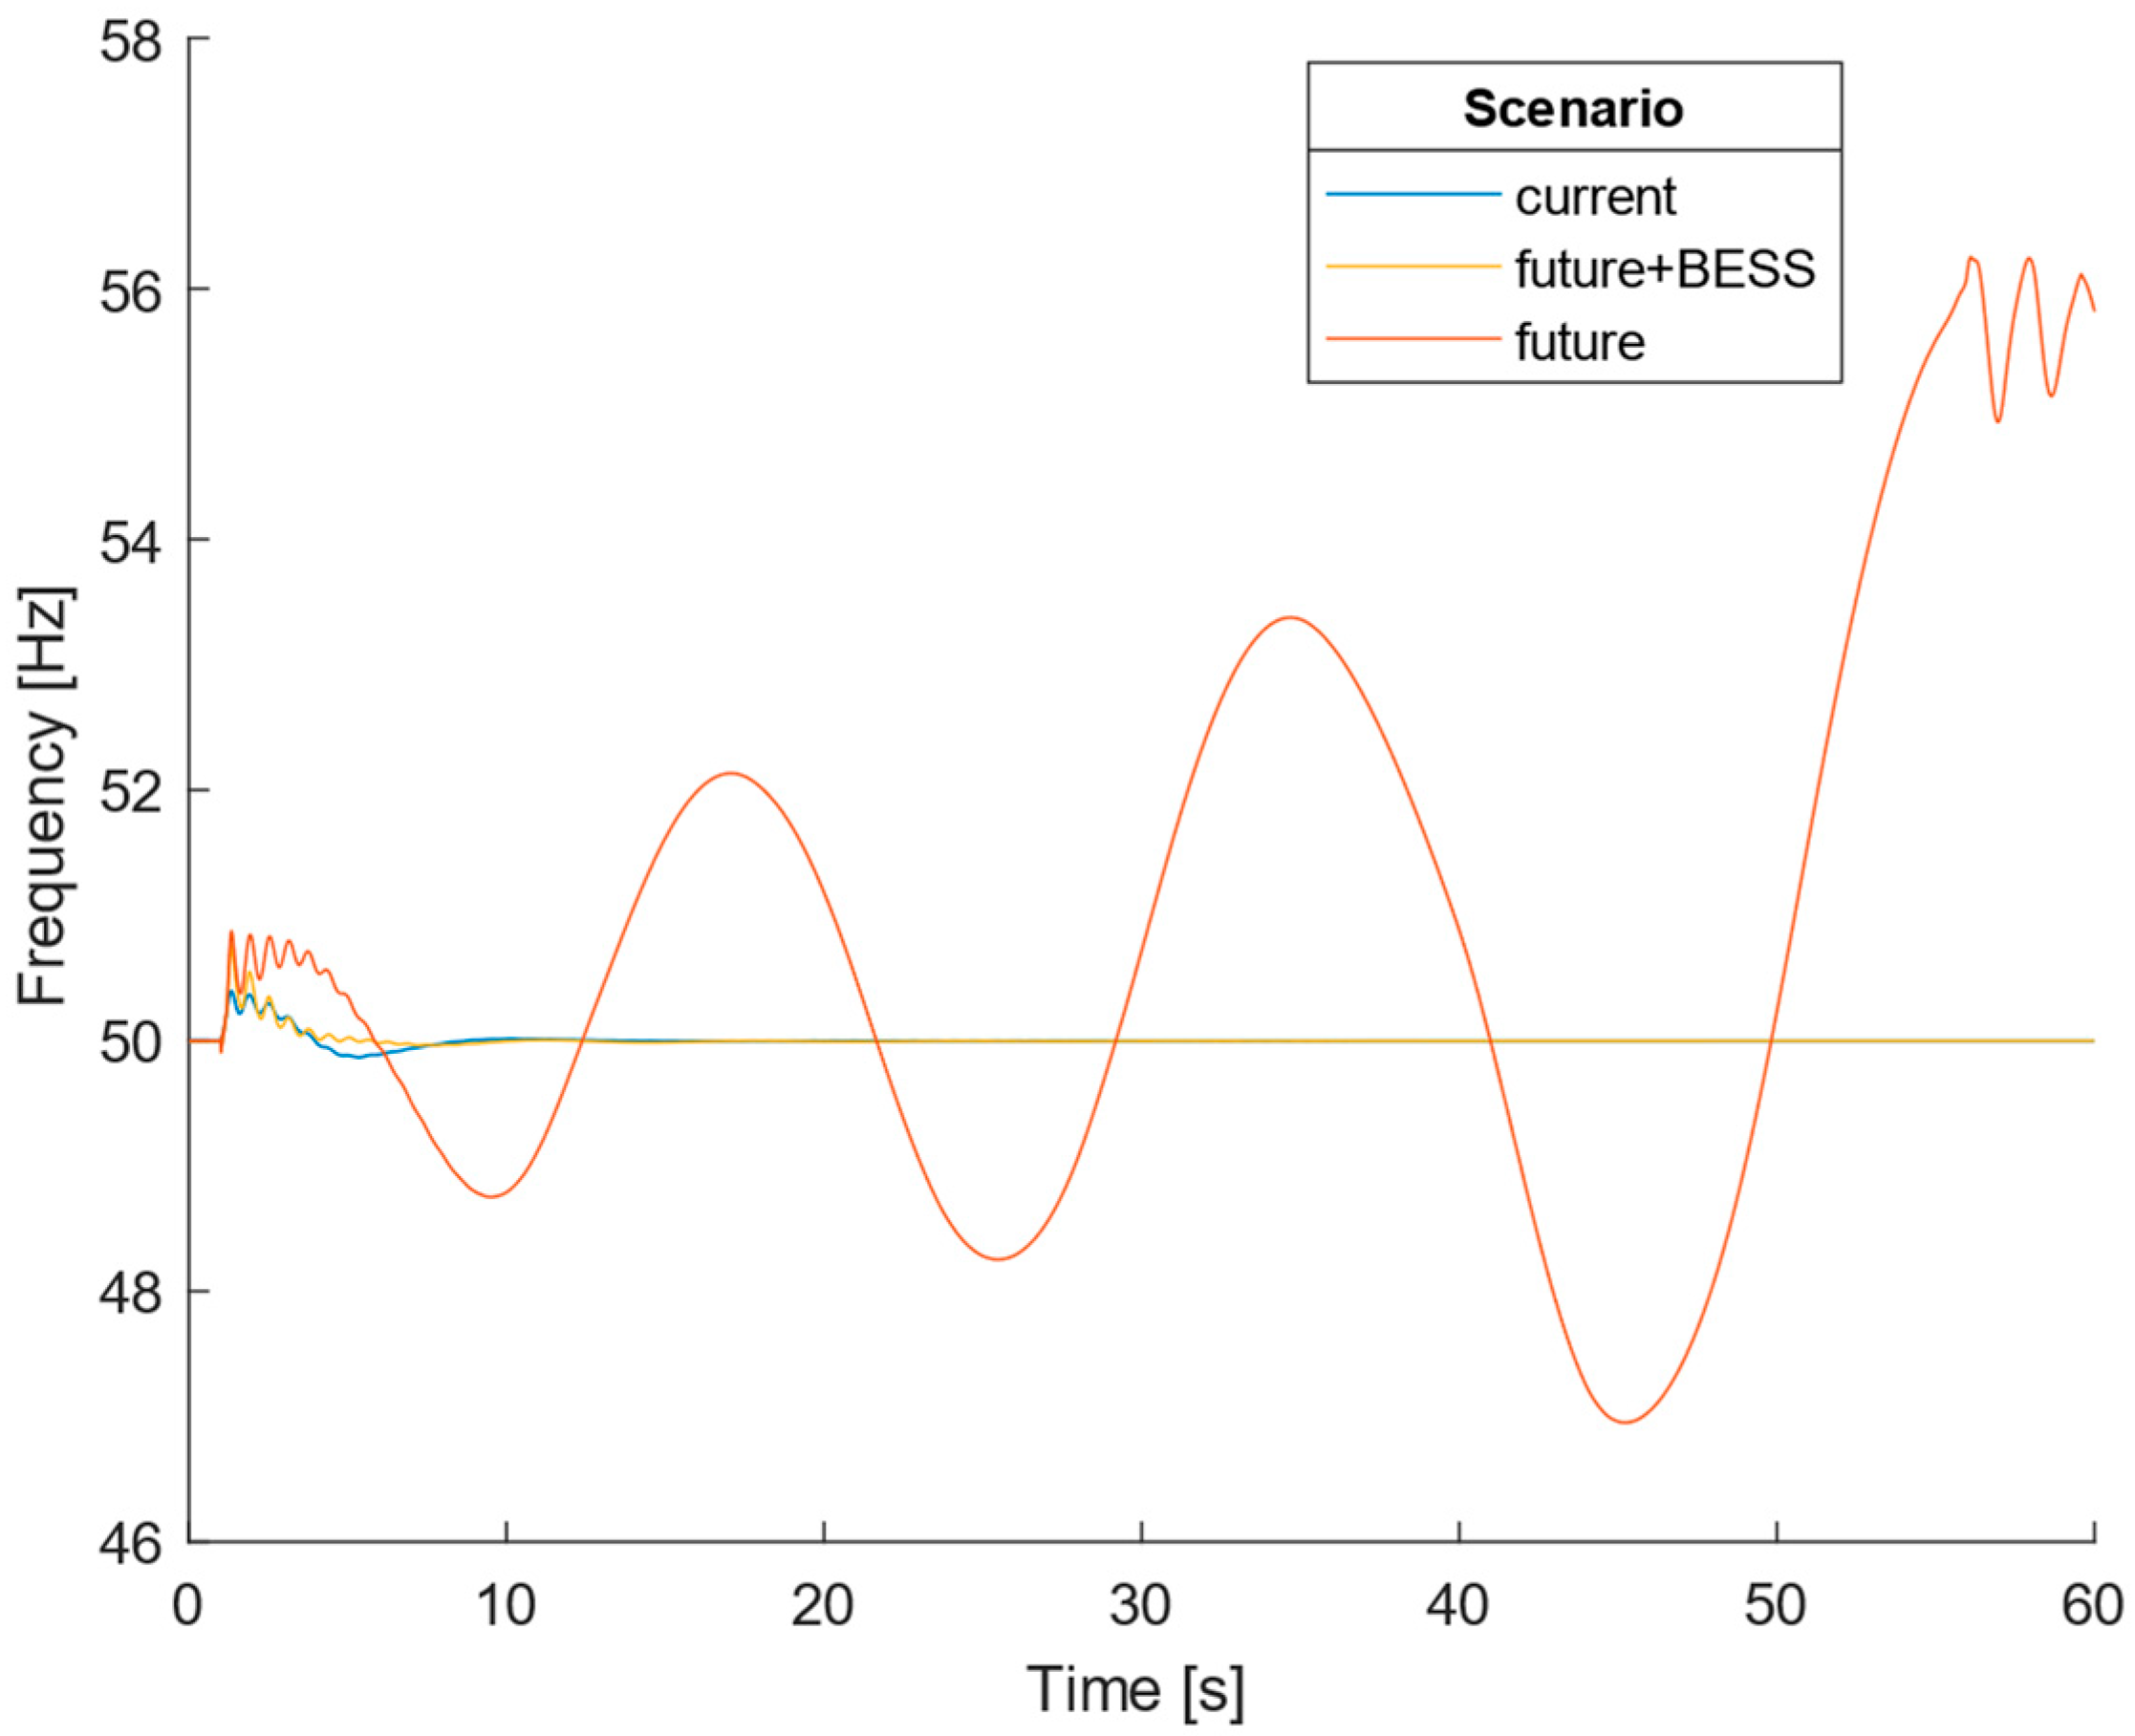
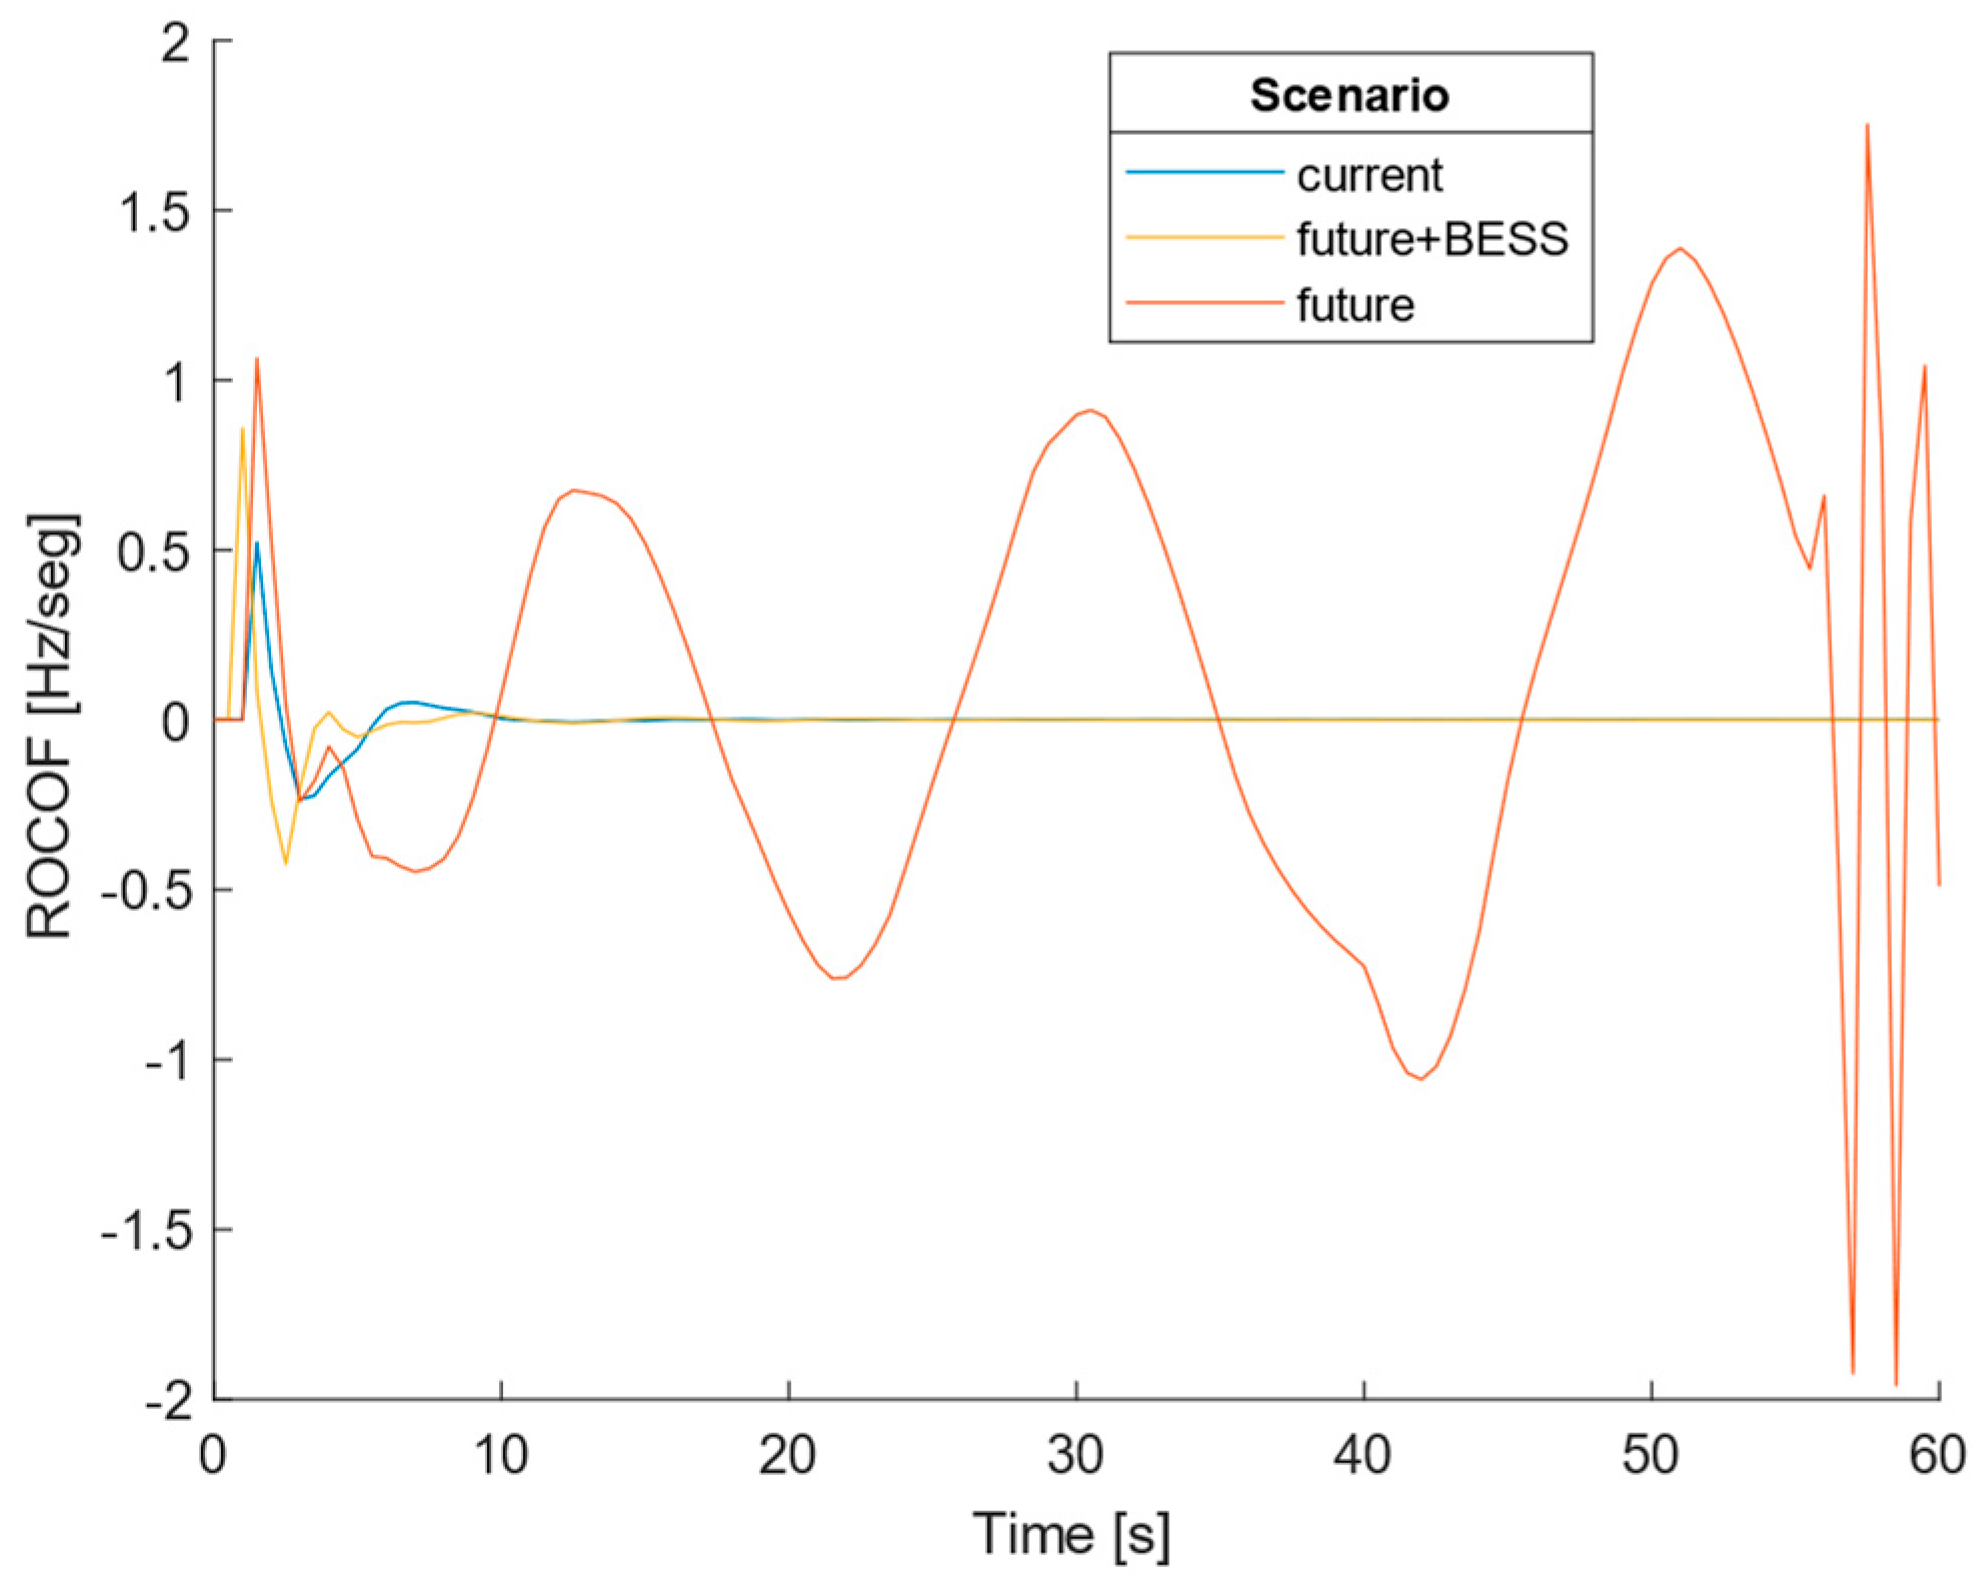
t = 1 s. By imposing a 200 ms short circuit in bus 5, the 72.5 MW/10 Mvar load connected to that bus gets short-circuited. The effect on the frequency and ROCOF of this disturbance is shown in
Figure 11 and
Figure 12. Once more, the system could not go back to a steady state in the future scenario without a BESS. On the other hand, the system could go back to a steady state 27.36 s after the disturbance in the future scenario with a BESS.
In the simulations, we have used validated and widespread software which uses detailed models to represent each element of the power system. Both the minimum/maximum frequency and the simulation waveforms are provided by the software and the equations can be obtained from the power system’s dynamics theory (see, for instance, [
36]). Together with the ROCOF behavior, we showed the frequency waveforms, which allow for the minimum/maximum frequency values to be retrieved.
The paper would have been enriched with a comparison of the theoretical results versus experimental results obtained from the real system. However, the authors were unable to obtain the necessary permits from the Madeira Island system operator; therefore, making it impossible to show such a comparison. We have tried to compensate for this failure by using validated and high-accuracy models, which is an indication that our results represent the behavior of the actual system.
6. Conclusions
This paper focuses on the impact of PV installations, which replace part of conventional generation, on the frequency stability of a weak grid, and proposes solutions to minimize this impact. As weak grids are isolated, they are more vulnerable to inertia decrease due to increasing shares of grid-connected converters. Three scenarios were considered: a current scenario based on the Madeira 2020 energy mix, a future scenario predicting increased PV generation, and a future with a BESS scenario, introducing a BESS to enhance system stability. The grid was modeled using Simulink/Matlab, considering detailed models for each grid element (PV power station, wind power station, thermoelectric power station, lines, transformers, etc.). Then, simulations with load/generation step changes and ground fault were performed for these three scenarios.
In the current scenario, the system reacted well to the disturbances, always returning to a steady state after a short period and not reaching dangerous values of frequency (never reached a frequency variation bigger than 0.4 Hz). Except for the ground fault, the maximum absolute values of ROCOF never reached a value higher than 0.26 Hz/s. The ground fault was the disturbance that had a more significant impact on the frequency stability in the current scenario, reaching a maximum absolute ROCOF of 0.52 Hz/s and a maximum frequency of 50.40 Hz.
On the other hand, when the share of solar generation increased from 8.5% to 30%, the system collapsed when certain disturbances were applied. When a 10 MW step increase in the load was applied, the SGs desynchronized, and the system could not go back to a steady state. The same occurred for a 50% solar generation loss (−35 MW) and for a 200 ms ground fault. This allows for the conclusion that as the PV integration increases, the grid’s susceptibility to faults also increases, increasing the frequency instability.
A BESS was added, and the same generation/load step change and ground fault simulations were performed. It was concluded that after a load step change of 6 MW, 8 MW and 10 MW, the system could always return to a steady state. Furthermore, the measured values of ROCOF maximum absolute were smaller than the ones recorded for the future scenario without a BESS and the current scenario. The derivative control used in the BESS explains this improvement in the ROCOF values. With the addition of the BESS, the minimum frequency recorded got closer to the nominal value of 50.00 Hz; the use of proportional control in the BESS explains this improvement. By adding a BESS, the system could also go back to a steady state after a 50% generation loss as opposed to the case without a BESS. The ground fault was the disturbance that caused more instability in the frequency. However, the BESS allowed the system to go back to a steady state situation. It is important to highlight that for the BESS to improve the frequency stability significantly, it is essential to have considerable power to respond to fast load and generation changes. For example, for a load step change of 10 MW, the BESS reached an output power of 8.58 MW. On the other hand, the storage capacity is not very important in frequency stabilization as the battery spends a small amount of energy on responding to these disturbances (the BESS spends 0.035 MWh to return the system to a steady state after a 10 MW load increase).
In conclusion, the obtained results confirm that an increase in PV integration augments the system’s vulnerability to disturbances. Specifically, it adversely affects frequency stability, leading to system collapse under significant disturbances. These simulation outcomes can be attributed to the reduction in inertia provided by thermoelectric power plants. Moreover, these findings support the positive impact of a BESS with a suitable control mechanism in enhancing frequency stability. In certain instances, it was demonstrated that the BESS could prevent system collapse.
However, to economically justify the installation of such a storage system, it is crucial to utilize the BESS for multiple purposes. For instance, in addition to enhancing frequency stability, it could serve purposes like arbitrage, peak-shaving, or power backup during outages. Regardless, the installation of a BESS in weak grids emerges as a potent ally in advancing renewable sources penetration and achieving the net-zero emissions goal.


