1. Introduction
In recent years, there has been a significant increase in demand for multimedia services, especially in the video field. Both subscribers and firms require higher resolutions, frame rates, and sampling precision, which is becoming a common part of video broadcasting and streaming. The research community is currently focusing more on 8K resolution. Higher frame rates are also in demand, particularly from post-production companies. Additionally, high dynamic range (HDR) technology has emerged as a common feature that can significantly improve image and video quality. However, these parameters have a significant impact on the final bitrate and bandwidth, as processing, storing, and transmitting such a vast amount of data becomes a major challenge for industry, researchers, and companies. Therefore, there is a need to develop new compression techniques and standards that can reduce the amount of data while maintaining the perceived quality.
Versatile video coding (VVC), also known as H.266 or MPEG-I Part 3, is the newest video codec from the MPEG family group and is a successor to high-efficiency video coding (HEVC). It was developed in 2020 by the Joint Video Experts Team (JVET), a joint video expert team of the VCEG working group of ITU-T Study Group 16, and the MPEG working group of ISO [
1].
The biggest advantage of the VVC codec, as its name implies, is its versatility, which means the efficient encoding of a wide range of video content and applications. Although it is not widely used at present, it holds great promise for the future [
2] AOMedia Video 1 (AV1) is an open, royalty-free video codec that was developed in 2015 by the Alliance for Open Media (AOMedia) to succeed Google’s VP9 codec. AOMedia is a huge consortium that includes many companies, providers, video content producers, software development firms, and web browser vendors [
3,
4]. High-efficiency video coding (HEVC), also known as H.265 or MPEG-H Part 2, is a video compression standard that was developed in 2013 to overcome H.264/AVC codec. HEVC is a video project of the ITU-T Video Coding Experts Group (VCEG) and the ISO/IEC Moving Picture Experts Group (MPEG) standardization organizations, working together in a partnership known as the Joint Collaborative Team on Video Coding (JCT-VC) [
4,
5]. Advanced video coding (AVC), also known as H.264 or MPEG-4 Part 10, is a video compression standard of the same standardization organizations as the HEVC codec. Although it was developed in 2003, it remains one of the most popular codecs for the recording, compression, and distribution of video content [
6].
Recently, many experts and researchers have provided quality performance analyses of the aforementioned codecs. The authors of [
7,
8] performed an analysis between the HEVC and VVC codecs for test sequences, with the resolution ranging from 240p up to Ultra HD (UHD), and in [
9], from 480p to UHD resolution, respectively. In both articles, the compression efficiency was evaluated by using the peak signal-to-noise ratio (PSNR) objective method. In [
10], the rate-distortion analysis of the same codecs using the PSNR, structural similarity index (SSIM), and video multi-method assessment fusion (VMAF) quality metrics was provided. The authors of [
11,
12] assessed the video quality of the HEVC, VVC, and AV1 compression standards for test sequences with resolutions that varied from 240p to UHD/4K, and in [
13,
14], at Full HD (FHD) and Ultra HD (UHD) resolutions, respectively. The compression efficiency was calculated using the PSNR objective metric. In [
13,
14], the multi-scale structural similarity index (MS-SSIM) method was also for the quality evaluation. The authors of [
15] provided a comparative experimental study of HEVC, VVC, and AV1, as well as the H.264 codec for the Full HD (FHD) test sequences. A rate-distortion analysis was provided by the PSNR, SSIM, and VMAF objective metrics. The authors of [
16] offer a comparative evaluation of the compression efficiency of H.264, HEVC, VVC, AV1, and VP9, but only for video sequences at 480p resolution. In [
17], a comparative performance assessment of five video codecs—HEVC, VVC, AV1, EVC, and VP9—is presented. The experimental evaluation was carried out on three video datasets with three different resolutions: 768 × 432, 560 × 488, and 3840 × 2160 (UHD). In [
18], the authors compared the performances of the HEVC, VVC, AV1, and VP9 codecs using video sequences from three different datasets with resolutions ranging from 480p up to Full HD (FHD). The rate-distortion analysis was performed by using both the PSNR and VMAF objective quality metrics. The authors of [
19] provide an objective performance evaluation of the HEVC, JEM, AV1, and VP9 codecs, which was carried out using the PSNR metric. A large test set of 28 video sequences with different resolutions varying from 240p to Ultra HD (UHD) was generated. In [
20], the coding performance of the HEVC, VVC, VP9, and AVS3 codecs is described. The datasets cover a wide range of video sequences at resolutions up to 4K. The authors of [
21] examined the compression performance of three codecs, namely HEVC, VVC, and AV1, which were measured by using the PSNR and SSIM objective video quality metrics. In [
22], the authors compared the coding performance of HEVC, EVC, VVC, and AV1 in terms of computational complexity.
Although the two articles mentioned above investigated the quality performance of the latest codecs using 8K video test sequences, the number of used sequences is still low. From the survey, it is apparent that a complex performance evaluation of popular codecs at 8K resolution is missing. Therefore, we have decided to conduct an objective assessment of well-known codecs in various resolutions and bitrates.
This paper aims to evaluate the performance of four commonly used video codecs—H.264/AVC, H.265/HEVC, H.266/VVC, and AV1. The assessment was conducted on seven different test sequences that have diverse spatial information (SI) and temporal information (TI) values. The codecs were tested at different bitrates for three different resolutions—8K, Ultra HD (UHD), and Full HD (FHD). The quality was evaluated using the PSNR, SSIM, and VMAF objective metrics.
The remainder of the paper is organized as follows.
Section 2 focuses on the experiment setup, where the used dataset, video encoding, and objective quality evaluation are described.
Section 3 deals with the analysis of the results, and
Section 4 provides the conclusion.
2. Experiment Setup
2.1. Dataset Description
There are many factors that can influence the results. Firstly, the selection of the test set, which means the test sequences, plays an important role. The more complex the test sequence, in terms of the SI-TI parameters, the higher the difficulty of the encoding process. On the contrary, sequences with slow motion or a small amount of spatial details can be coded with higher efficiency. The resolution, bit depth, framerate, i.e., the number of frames per second, and color space are input factors that can also affect the final results. Last but not least, the experimental setup, in terms of the adjustment of the encoding parameters, can influence the results. This includes, for instance, the group of pictures (GoPs) setting, encoding quality choice (either quantization parameter (QP) or bitrate (BR) constrain), the selection of encoding modes (constant bitrate (CBR), variable bitrate (VBR), or adaptive bitrate (ABR)), the choice of rate control modes (1-pass, 2-pass, or CRF encoding), and the selection of used presets, tunes, or profiles.
In our experiments, we used sequences from three different databases. As far as we know, these three datasets are the only ones that contain test sequences at 8K resolution. The first dataset, called “Fraunhofer”, was created in 2019 by the Fraunhofer HHI and is publicly available at [
23]. It is a set of seven 8K video sequences in BT.2020 SDR and BT.2100 PQ HDR versions. The sequences were recorded using the RED DSMC2 camera with a Helium 8K S35 35.4 Megapixel CMOS Sensor. The second dataset, called “SEPE”, contains 40 video sequences that were captured using a Canon R5C video camera in 10-bit Canon Cinema RAW Light (CRM) format, converted into the 8-bit RGBA pixel format and encoded in the lossless PNG format using Adobe Premiere Pro. The whole dataset is available in [
24]. The third dataset, called PP8K, contains 16 8K video sequences that were collected using a professional 8K camera (Sharp 8 C-B60A camcorder), which provides 16-bit raw data. Afterward, for practical use, they were converted into a 10-bit 4:2:0 YUV format by FFmpeg, where the command line was the following:
ffmpeg -f image2 -i 0000%d.tif -s 7680x4320 -pix_fmt yuv420p10le SeqName.yuv
The YUV, also known as YPbPr in analog or YCbCr in digital video, is a color model composed of luma (Y) and two chroma (UV) components. In the past, it was primarily used on an analog television. Nowadays, it is used for chroma subsampling, which is a type of compression that reduces the color information in a video signal in favor of luminance (Y) data in order to reduce bandwidth usage without significantly affecting picture quality. There are many types of subsampling modes, for instance, 4:2:2, 4:2:0, or 4:1:1. In our experiments, we have used the 4:2:0 subsampling format, which means the bandwidth of a video signal is reduced by half compared to no chroma subsampling signal.
The color space of these sequences is ITU-R BT.2020 and is available in [
25]. All the technical parameters, such as resolution, color space, bit depth, and framerate, as well as the duration of all three datasets, are presented in
Table 1.
The datasets have great diversity and universality. In order to evaluate the performance of all sequences, the spatial-temporal analysis, according to [
26], should be performed. The spatial perceptual information (SI) indicates the amount of spatial detail in a video frame and is based on the Sobel filter. It is generally higher for more spatial scene content. The temporal perceptual information (TI) indicates the amount of temporal changes in a video sequence. This change is called the motion difference property and is defined as a function of time. It is generally higher for high-motion video sequences. Both SI and TI are calculated for the luminance part of the video frames only [
26].
Since the spatial and temporal information varies with resolution, one SI-TI diagram should be drawn for every resolution. In our research, we decided to explore the video quality not only at 8K resolution but also at Ultra HD (UHD) and Full HD (FHD) resolution. For this reason, we had to downscale all test sequences from 8K resolution to UHD and FHD resolutions, respectively. For this purpose, we used the FFmpeg tool [
27] and the following command line:
ffmpeg -f rawvdideo -video_size {resolution} -pixel_format {color space} -framerate {framerate} -i {input_sequence} -vf scale={resolution} -c:v rawvideo {output_sequence}
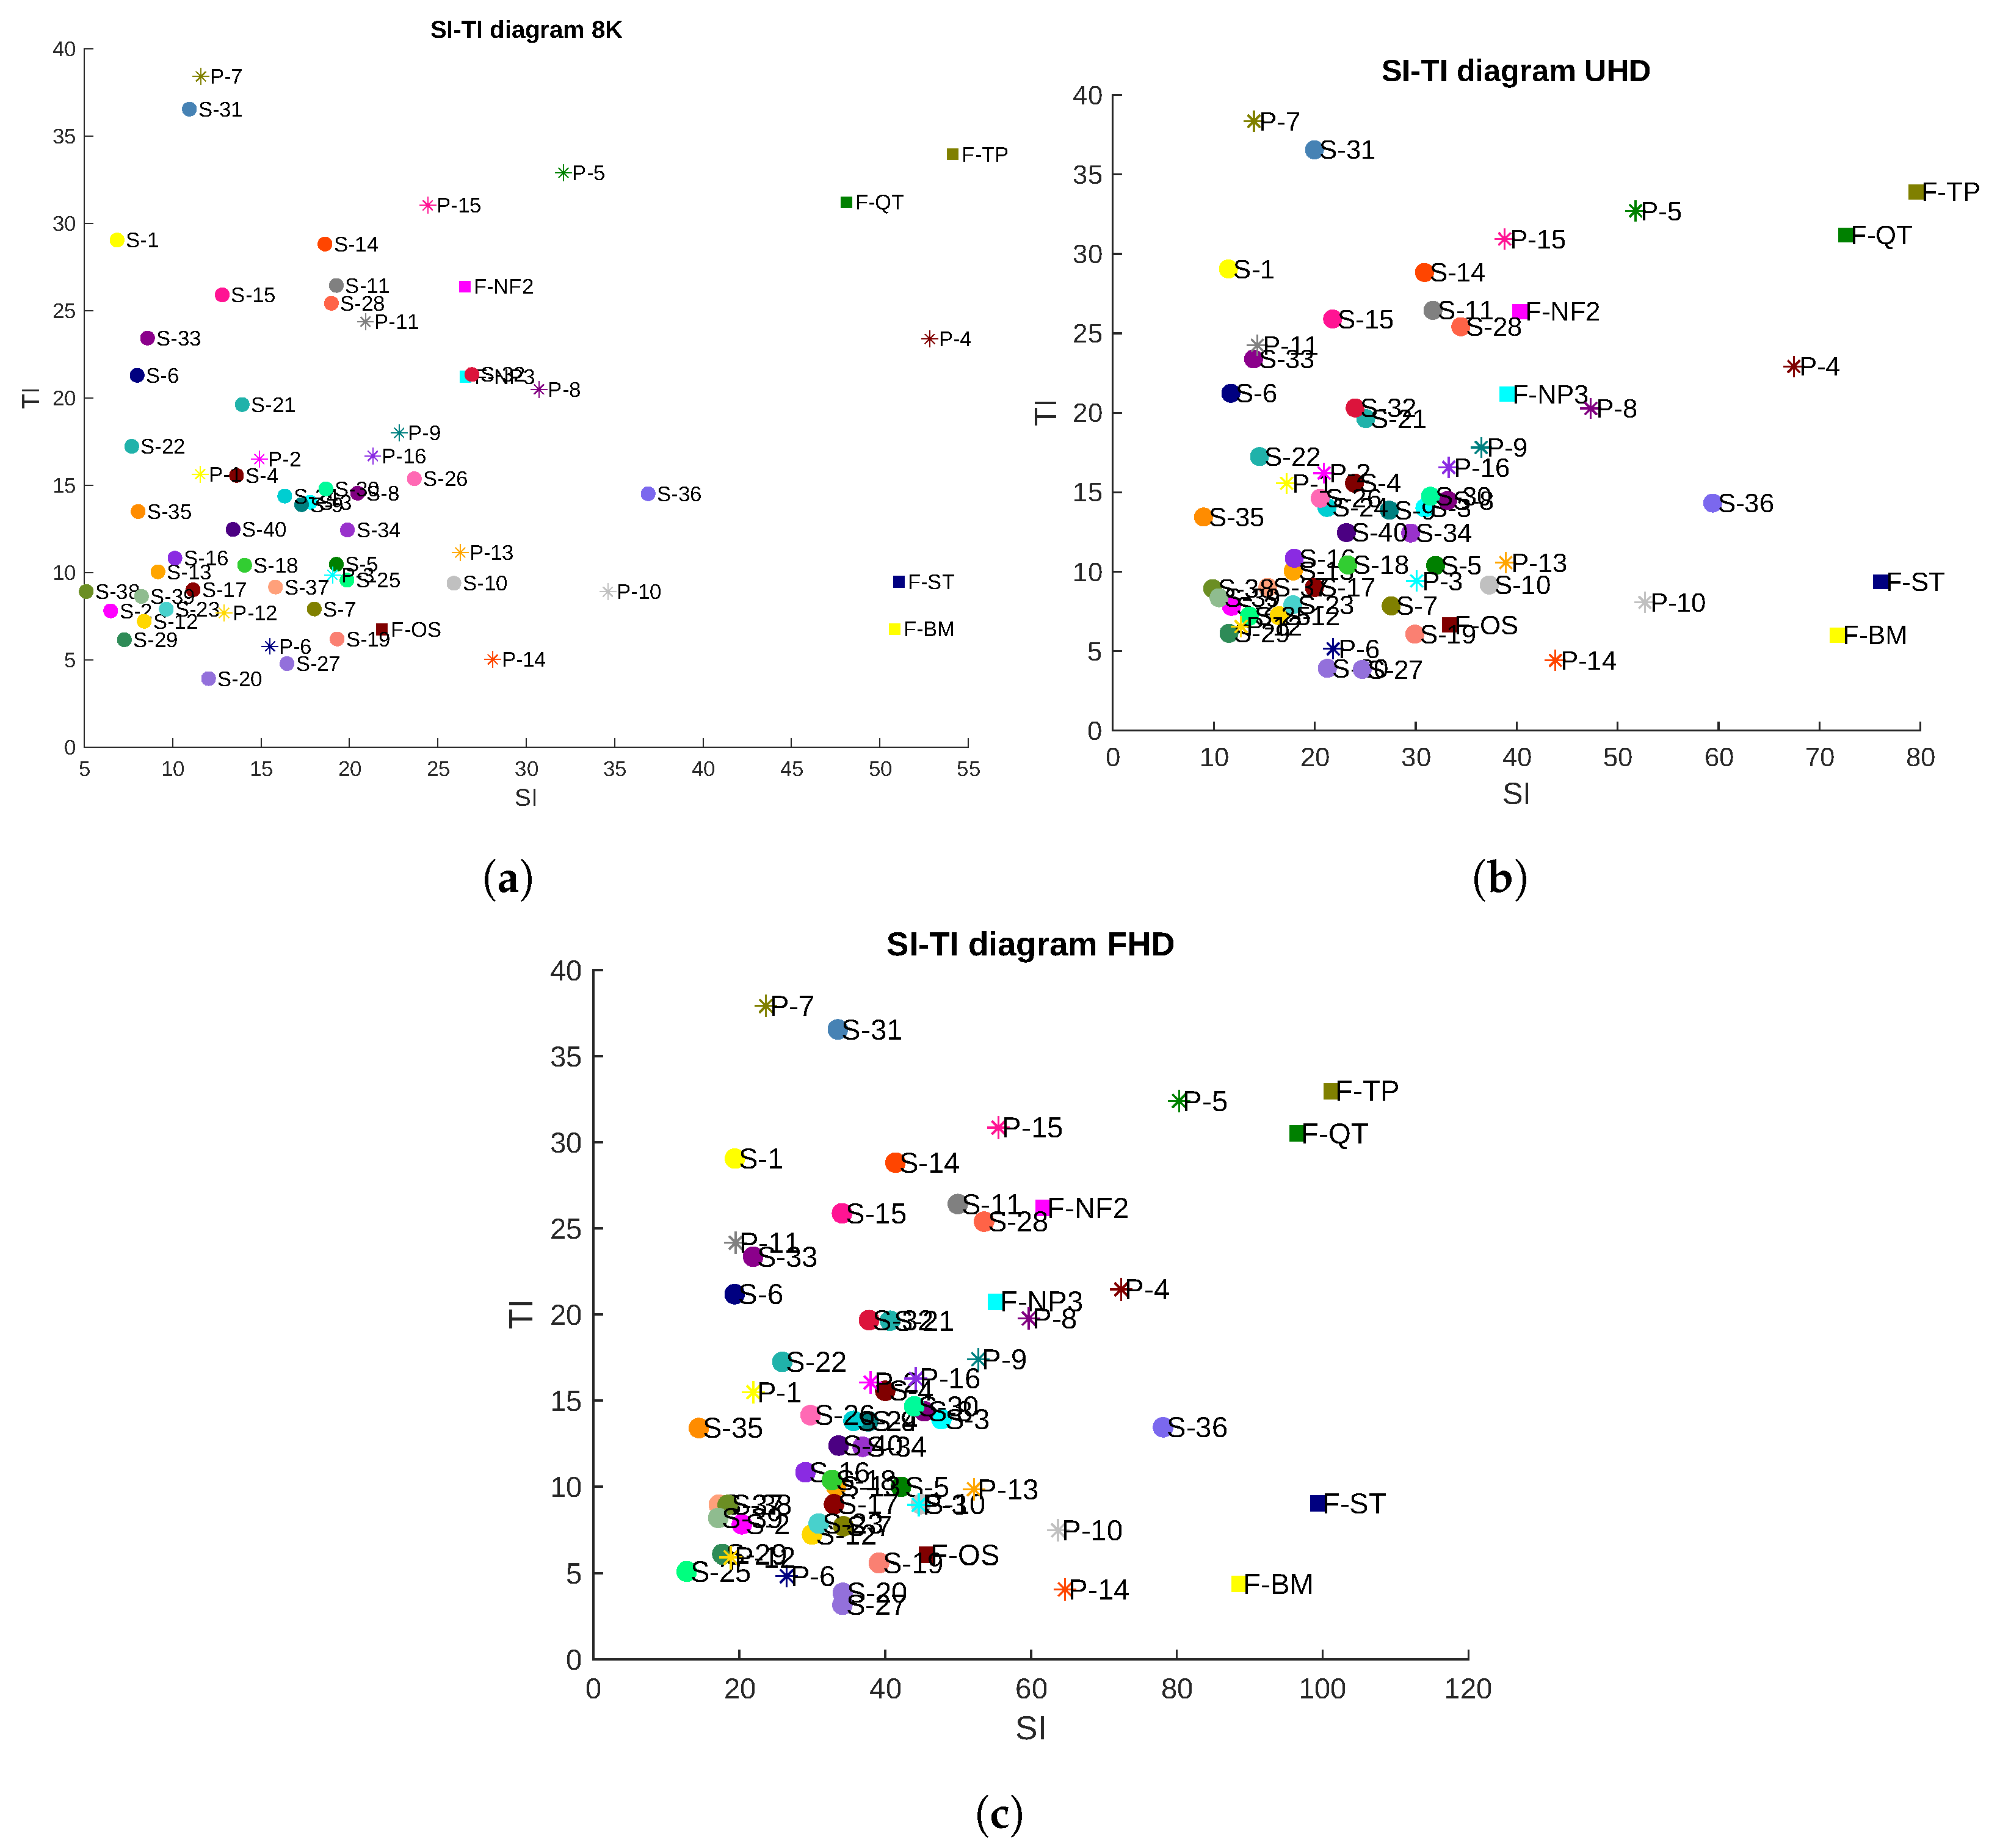
All three SI-TI diagrams, one for each resolution using the [
28], are shown in
Figure 1. In all these plots, all the sequences of all three datasets are depicted. Particular datasets are distinguished by different markers, namely the squares representing the Fraunhofer dataset, the circles representing the SEPE dataset, and the asterisks representing the PP8K dataset; each sequence is marked by a different color. Before the serial number of each sequence, a letter representing the abbreviation of the dataset is written, namely “F” for “Fraunhofer”, “S” for SEPE, and “P” for the“PP8K” dataset.
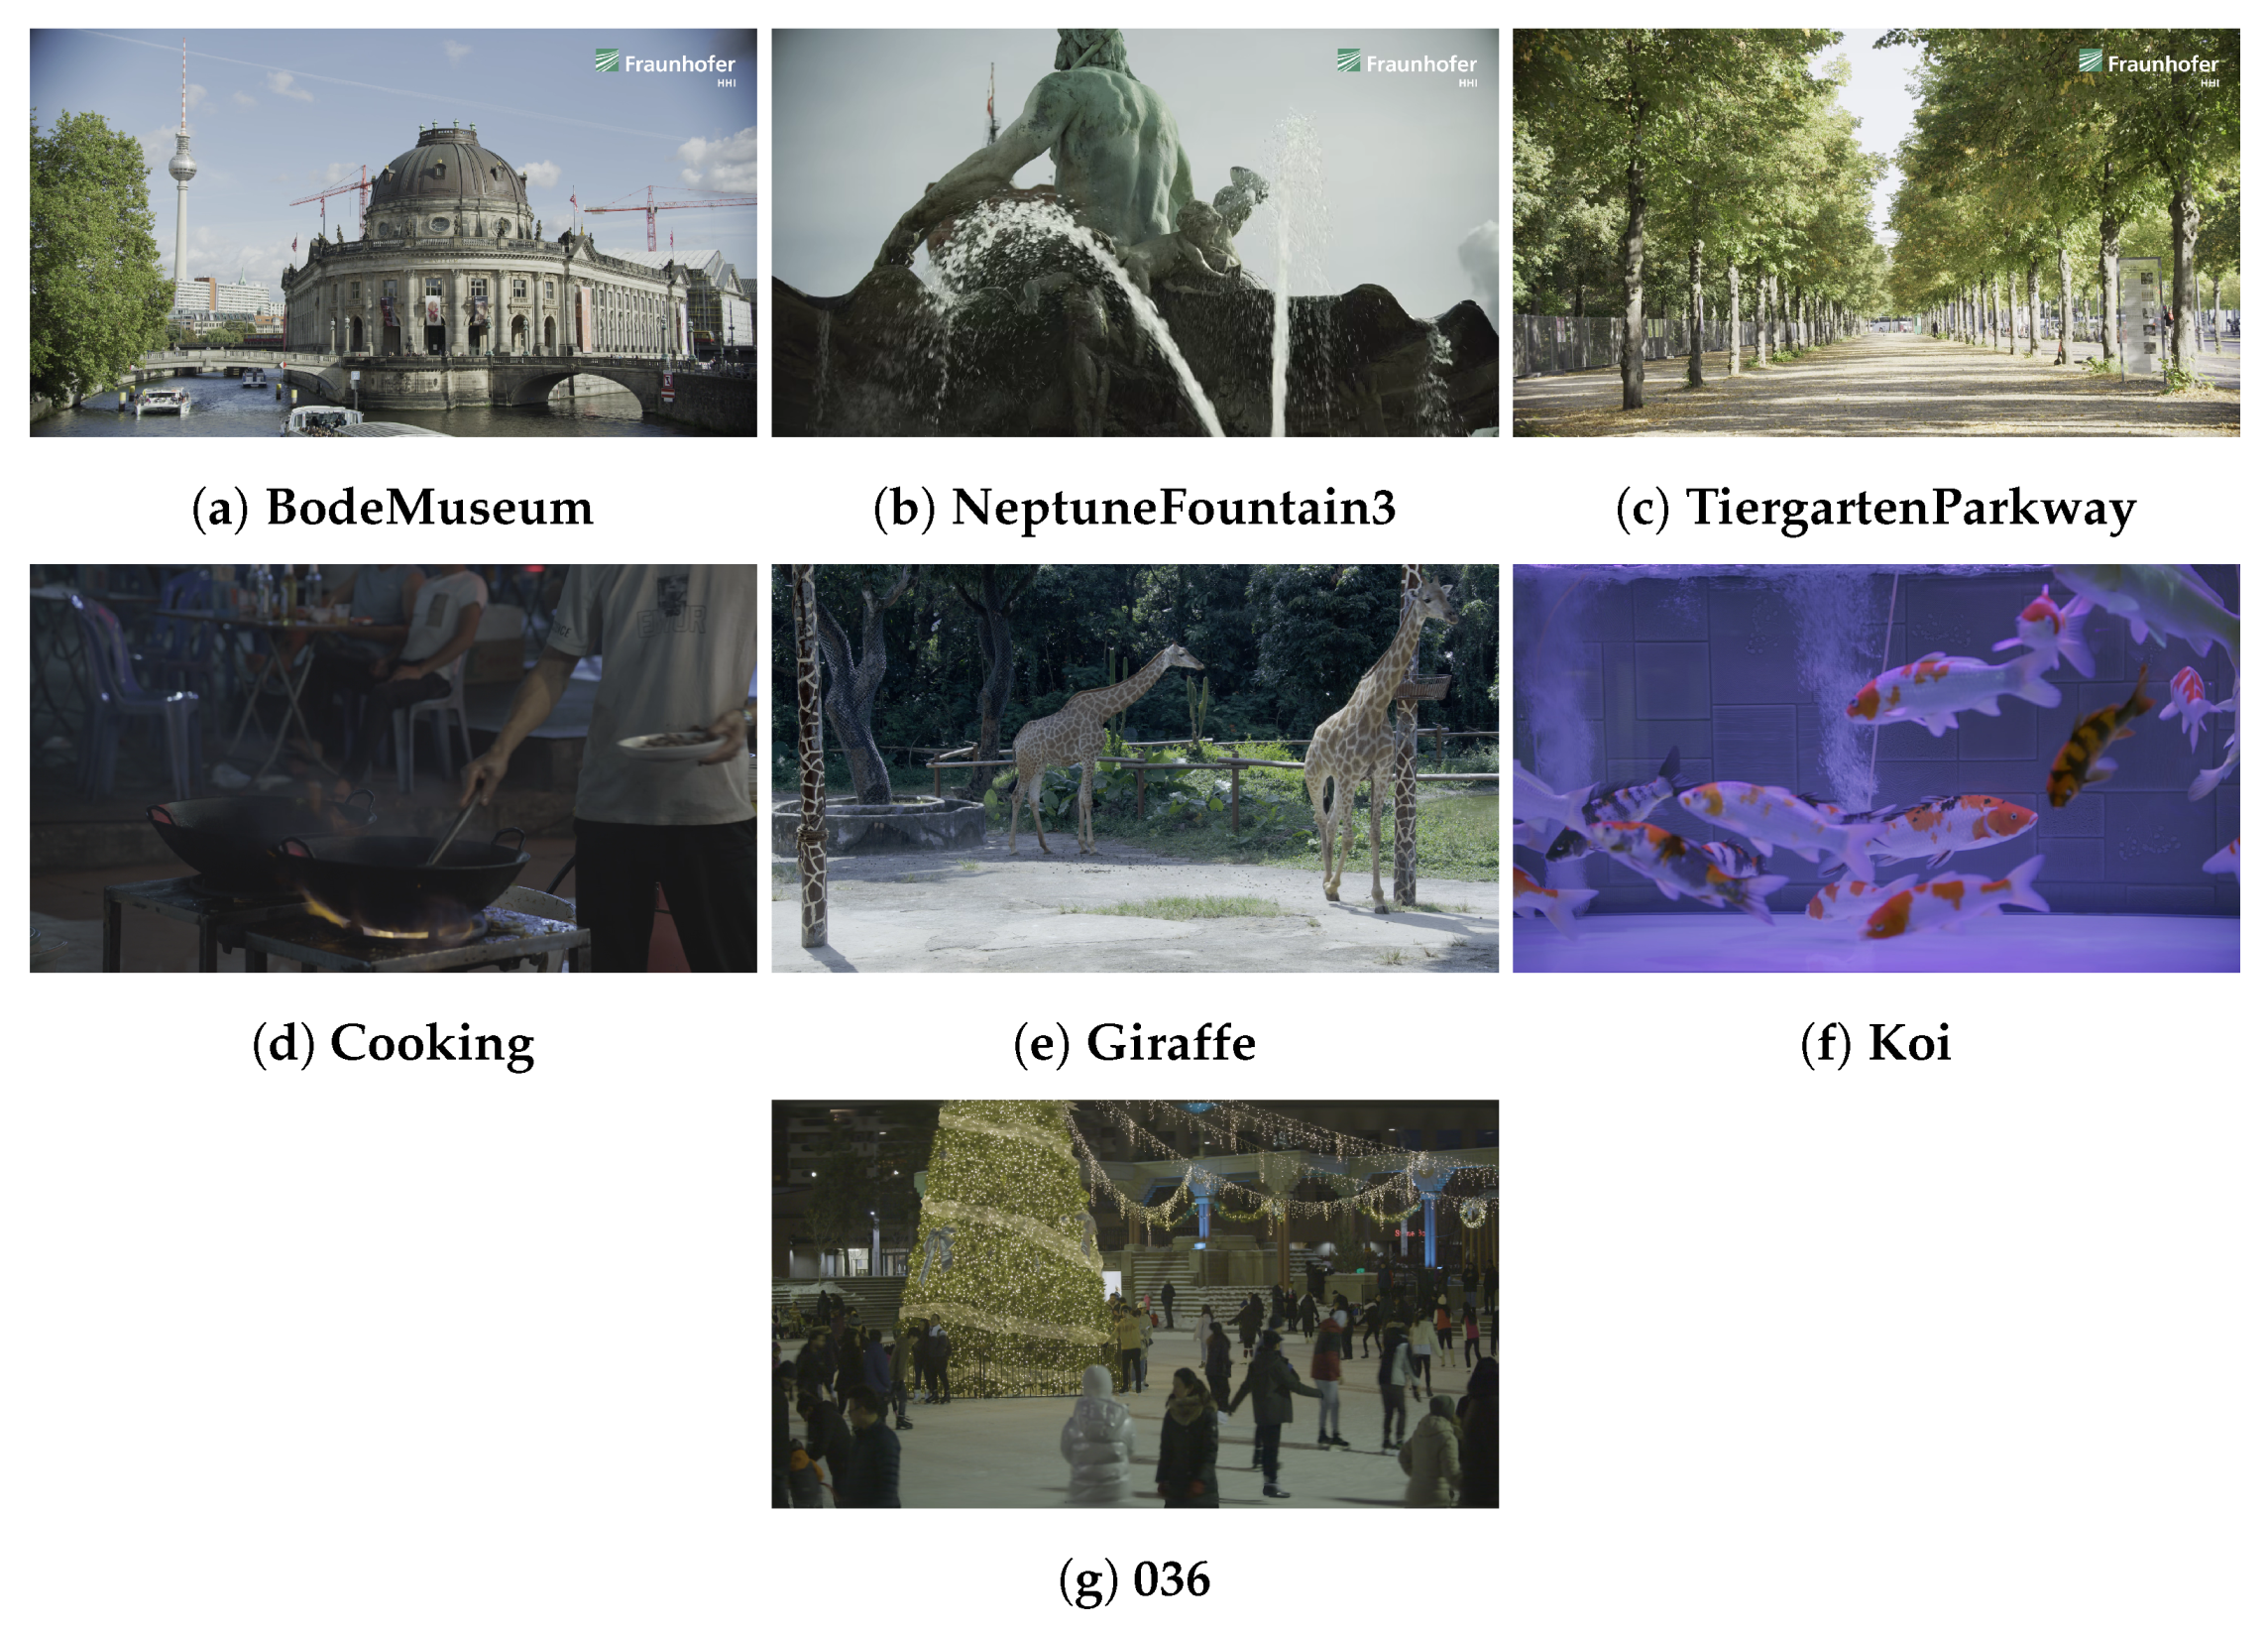
The entire dataset contains 63 test sequences altogether for each resolution. For our study, we had to select some of them. In order to cover all SI-TI diagrams, we decided to choose those sequences with a wide variety of SI and TI values. We picked one sequence from each of the four corners, namely “Cooking”, “TiergartenParkway”, “BodeMuseum”, and “Koi”, and three sequences from the middle of the SI-TI plot, namely “NeptuneFountain3”, “Giraffe”, and “36”. A short description of the characteristics (with given SI-TI values) of the selected test sequences is shown in
Table 2, and their previews are given in
Figure 2.
2.2. Video Encoding
For our study, all the test sequences were encoded to the tested compression standards, namely H.264/AVC, H.265/HEVC, H.266/VVC, and AV1 using the FFmpeg tool [
27]. Since there is no support for VVC in FFmpeg, according to [
29], the patch that included VVC support was manually submitted to FFmpeg. The bitrate range was set to 1, 3, 5, 7, 10, and 15 Mbps for FHD and UHD resolutions and to 5, 7, 10, 15, 30, and 50 Mbps for 8K resolution, respectively. Altogether, 420 test sequences were encoded. The group of pictures (GoPs) was set to 60 for the Fraunhofer and PP8K datasets and 30 for the SEPE dataset, which determines the condition that every second, an intraframe (I) frame occurs. The structure of the GoPs is referred to by two numbers—N and M, where N stands for the distance between two keyframes, i.e., I frames, also known as the length of the GoPs, and M stands for the distance between two anchor frames (I or P). Since the GoPs settings, except the I frame distance, were set as default by all codecs, the GoPs structure was as follows: the H.264/AVC N = 60 and the M = 4, the H.265/HEVC N = 60 and M = 5, and the AV1 N = 1 and M = 1. For H.266/VVC, the intraperiod was set to 64, perceptual optimization was enabled, and the decoding refresh type was CRA, which stands for clean random access. For all codecs, no certain profiles and presets were set within the encoding process. All the encoding parameters are displayed in
Table 3. We decided to use average bitrate coding (ABR), which means that only the target bitrate parameter was set. Since the H.264/AVC and H.265/HEVC codecs were not designed to encode videos at 8K resolution, two-pass encoding was used to ensure that the target bitrate was as accurate as possible for these two standards. The command lines that show the encoding settings for particular codecs are listed in
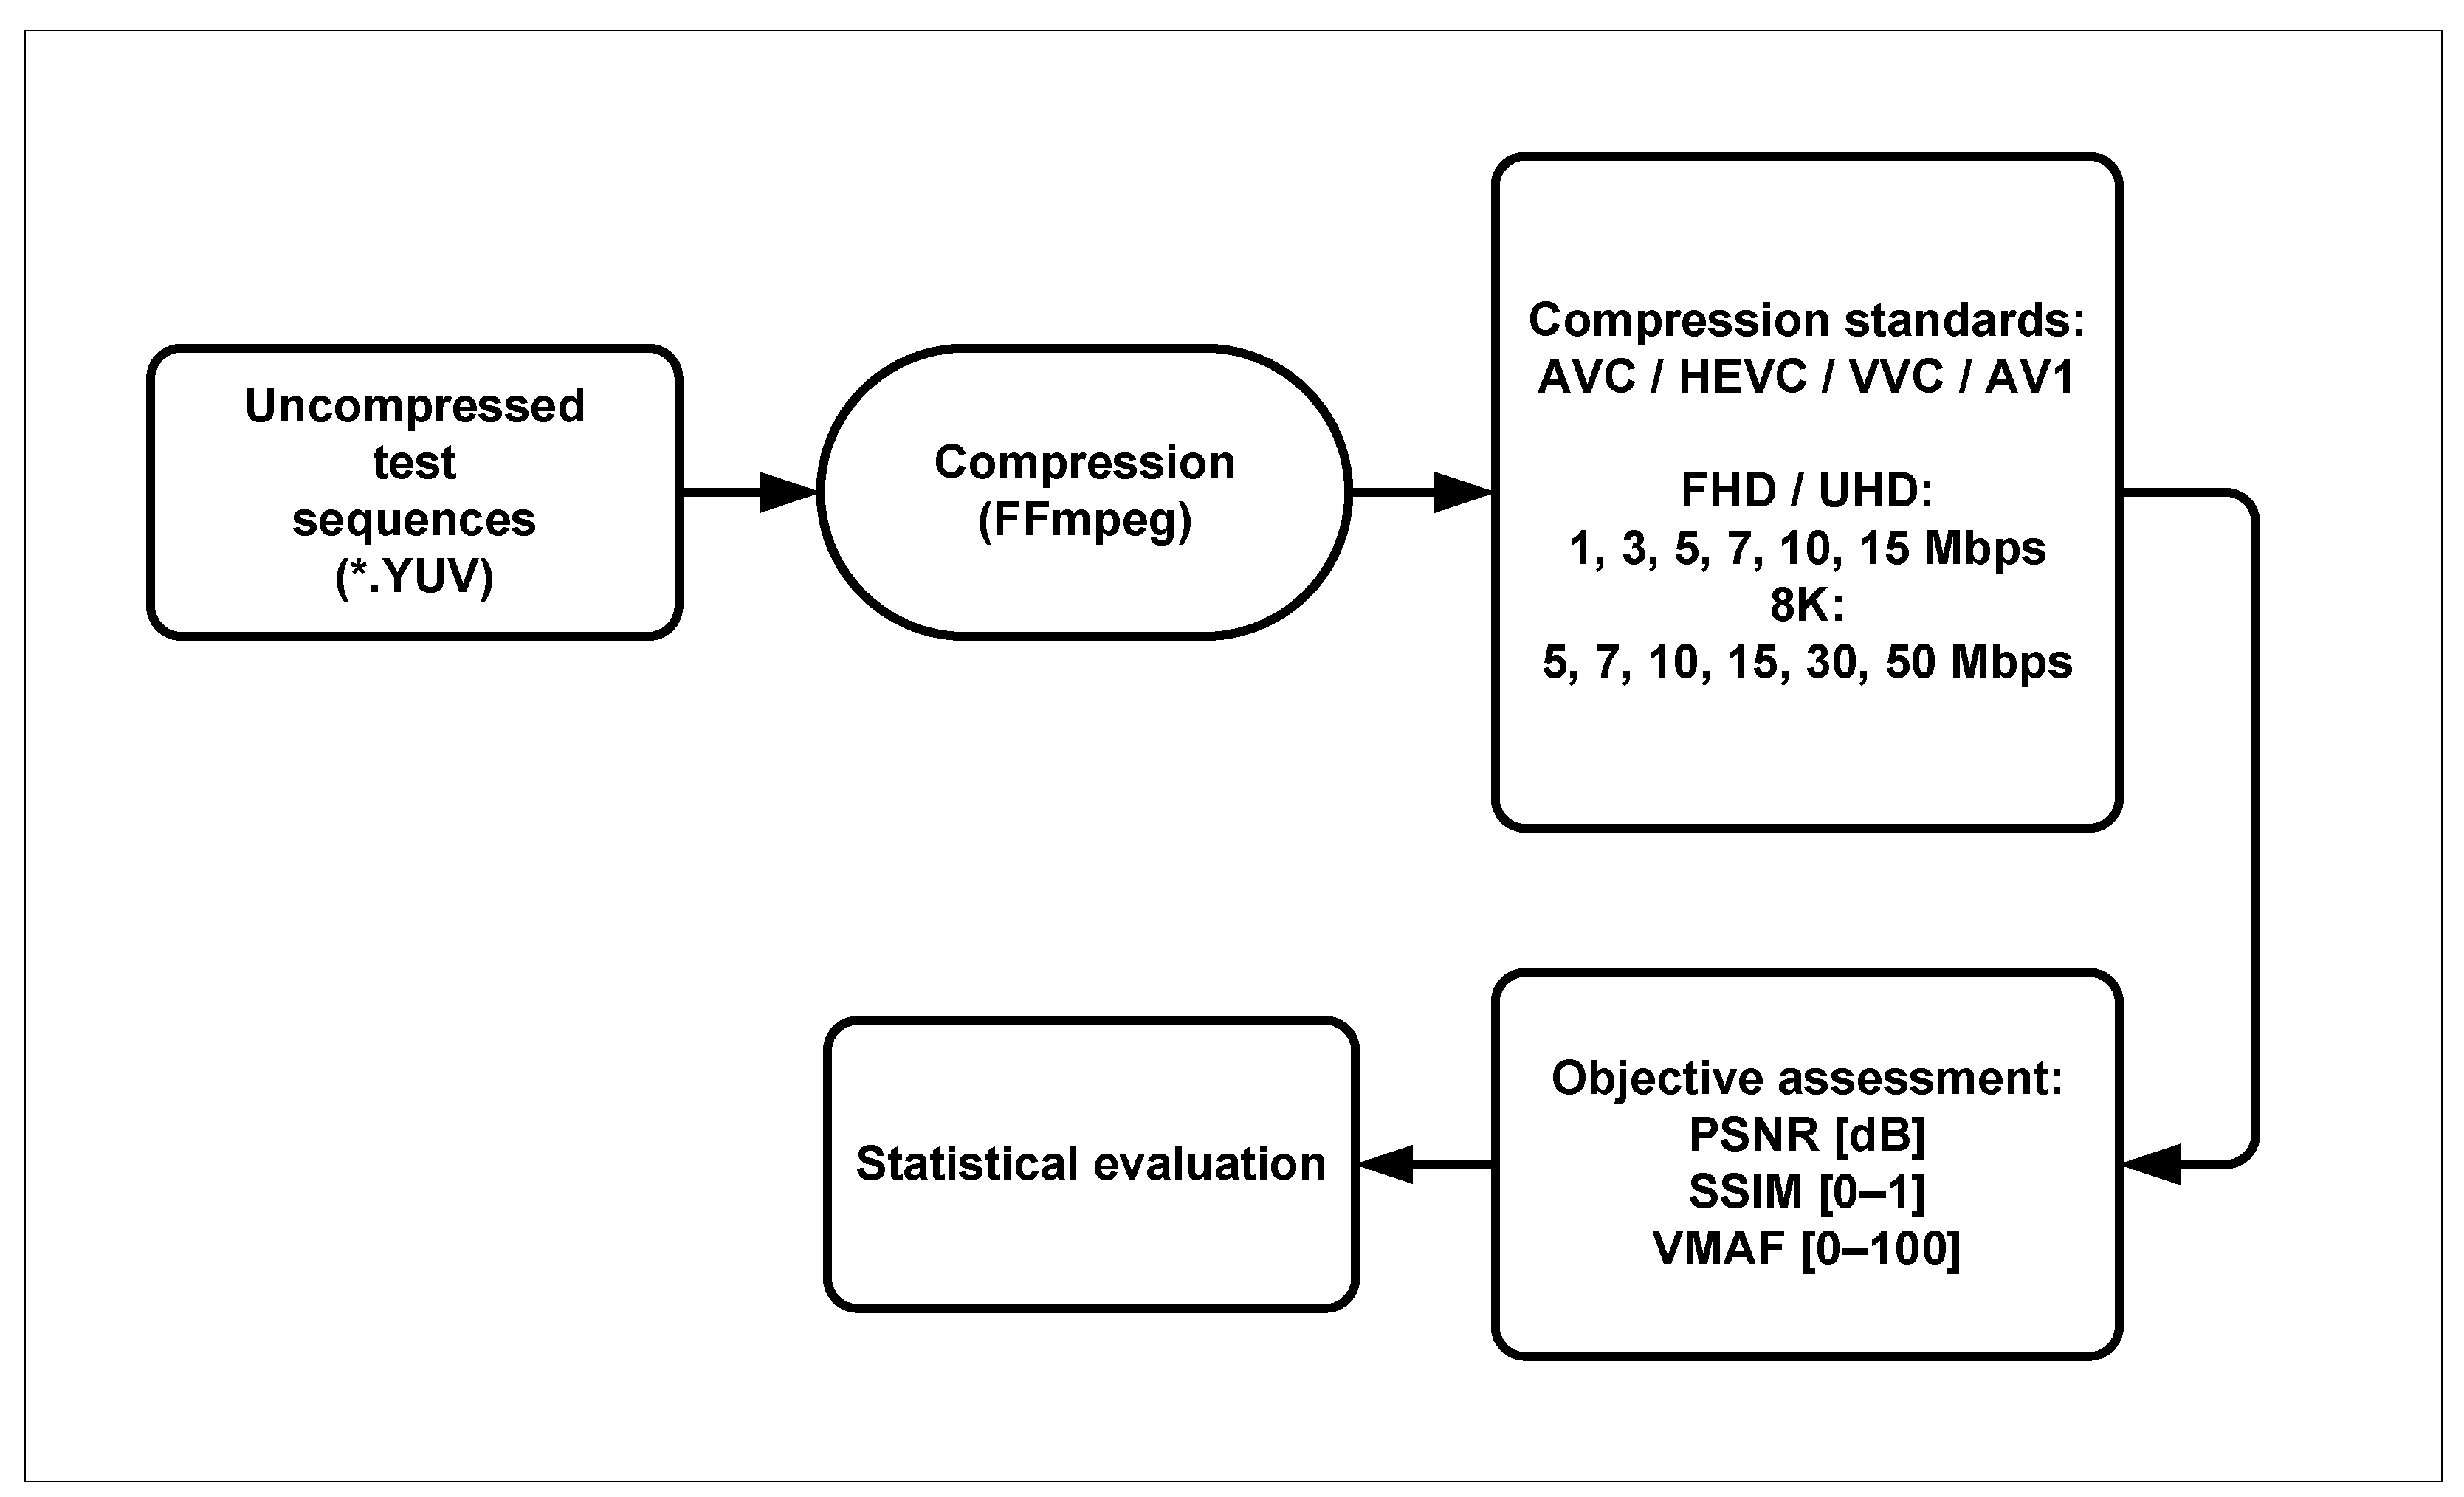
Table 4. A flowchart highlighting the encoding and evaluating process is depicted in
Figure 3.
2.3. Objective Quality Evaluation
A quality performance evaluation was conducted, and the following objective metrics were used: peak signal-to-noise ratio (PSNR), structural similarity index (SSIM), and video multi-method assessment fusion (VMAF). Although PSNR belongs to one of the oldest metrics and its results do not correlate well with subjective methods, it is still used. One reason is that this metric is very easy and fast for calculations, and the second is that it is used for the computation of the BD rate, which stands for the Bjøntegaard delta rate. The output value of this metric is given in decibels [dB]. Based on the measurements, the maximum value that PSNR can achieve is 100 dB, which essentially equals the quality of a reference video. The SSIM metric considers video degradation as a perceived change in structural information; it measures the distortions in the image structure resulting from changes in brightness, contrast, and the blurring of the image. This measurement is based on the assumption that the human visual system detects structural changes in a frame better than it identifies definite errors, which leads to a higher correlation with subjective quality evaluations. The results obtained using the SSIM metrics fall within the interval [0, 1], where 1 represents the best quality that can be achieved only if all the compared images or videos are identical [
30]. VMAF is a video quality metric developed by Netflix in collaboration with the University of Southern California, the IPI/LS2N lab at Nantes Université, and the Laboratory for Image and Video Engineering (LIVE) at The University of Texas at Austin. It uses extant video quality metrics and other properties to predict video quality: visual information fidelity (VIF), detail loss metric (DLM), and mean co-located pixel difference (MCPD). All features are concatenated using SVM-based regression to determine an output score ranging from 0 to 100 per video frame, where 100 represents identical quality compared to a reference video [
31]. All three of the above-mentioned metrics belong to so-called full-reference objective methods, which means that both the reference as well as the tested image/sequence must be available for evaluation, and the quality is computed as a direct comparison between both images or sequences. The objective assessment was conducted using the FFMetric tool, which can be used to calculate various visual quality metrics. FFMetrics is an FFmpeg GUI designed to visualize quality metrics calculated by FFmpeg. The tool is free to use and can be downloaded from [
32].
3. Analysis of the Results
The results are presented in two parts. In the first one, we selected PSNR to compute the bitrate savings in terms of the Bjøntegaard delta (BD-rate) model [
33], where the BD-rate (in percentage), as well as BD-PSNR (in dB), are calculated from the area located between two rate-distortion (RD) curves. The results are shown in
Table 5,
Table 6,
Table 7,
Table 8,
Table 9 and
Table 10, where each of these tables represents values at specific resolutions, i.e., 8K, Ultra HD, and Full HD, respectively. In each table, the bitrate savings for a particular test sequence are calculated and listed. In addition,
Table 11 and
Table 12 present the averaged bitrate savings depending on a specific codec. In the second part, we generated rate distortion plots using the aforementioned SSIM and VMAF quality metrics, as seen in
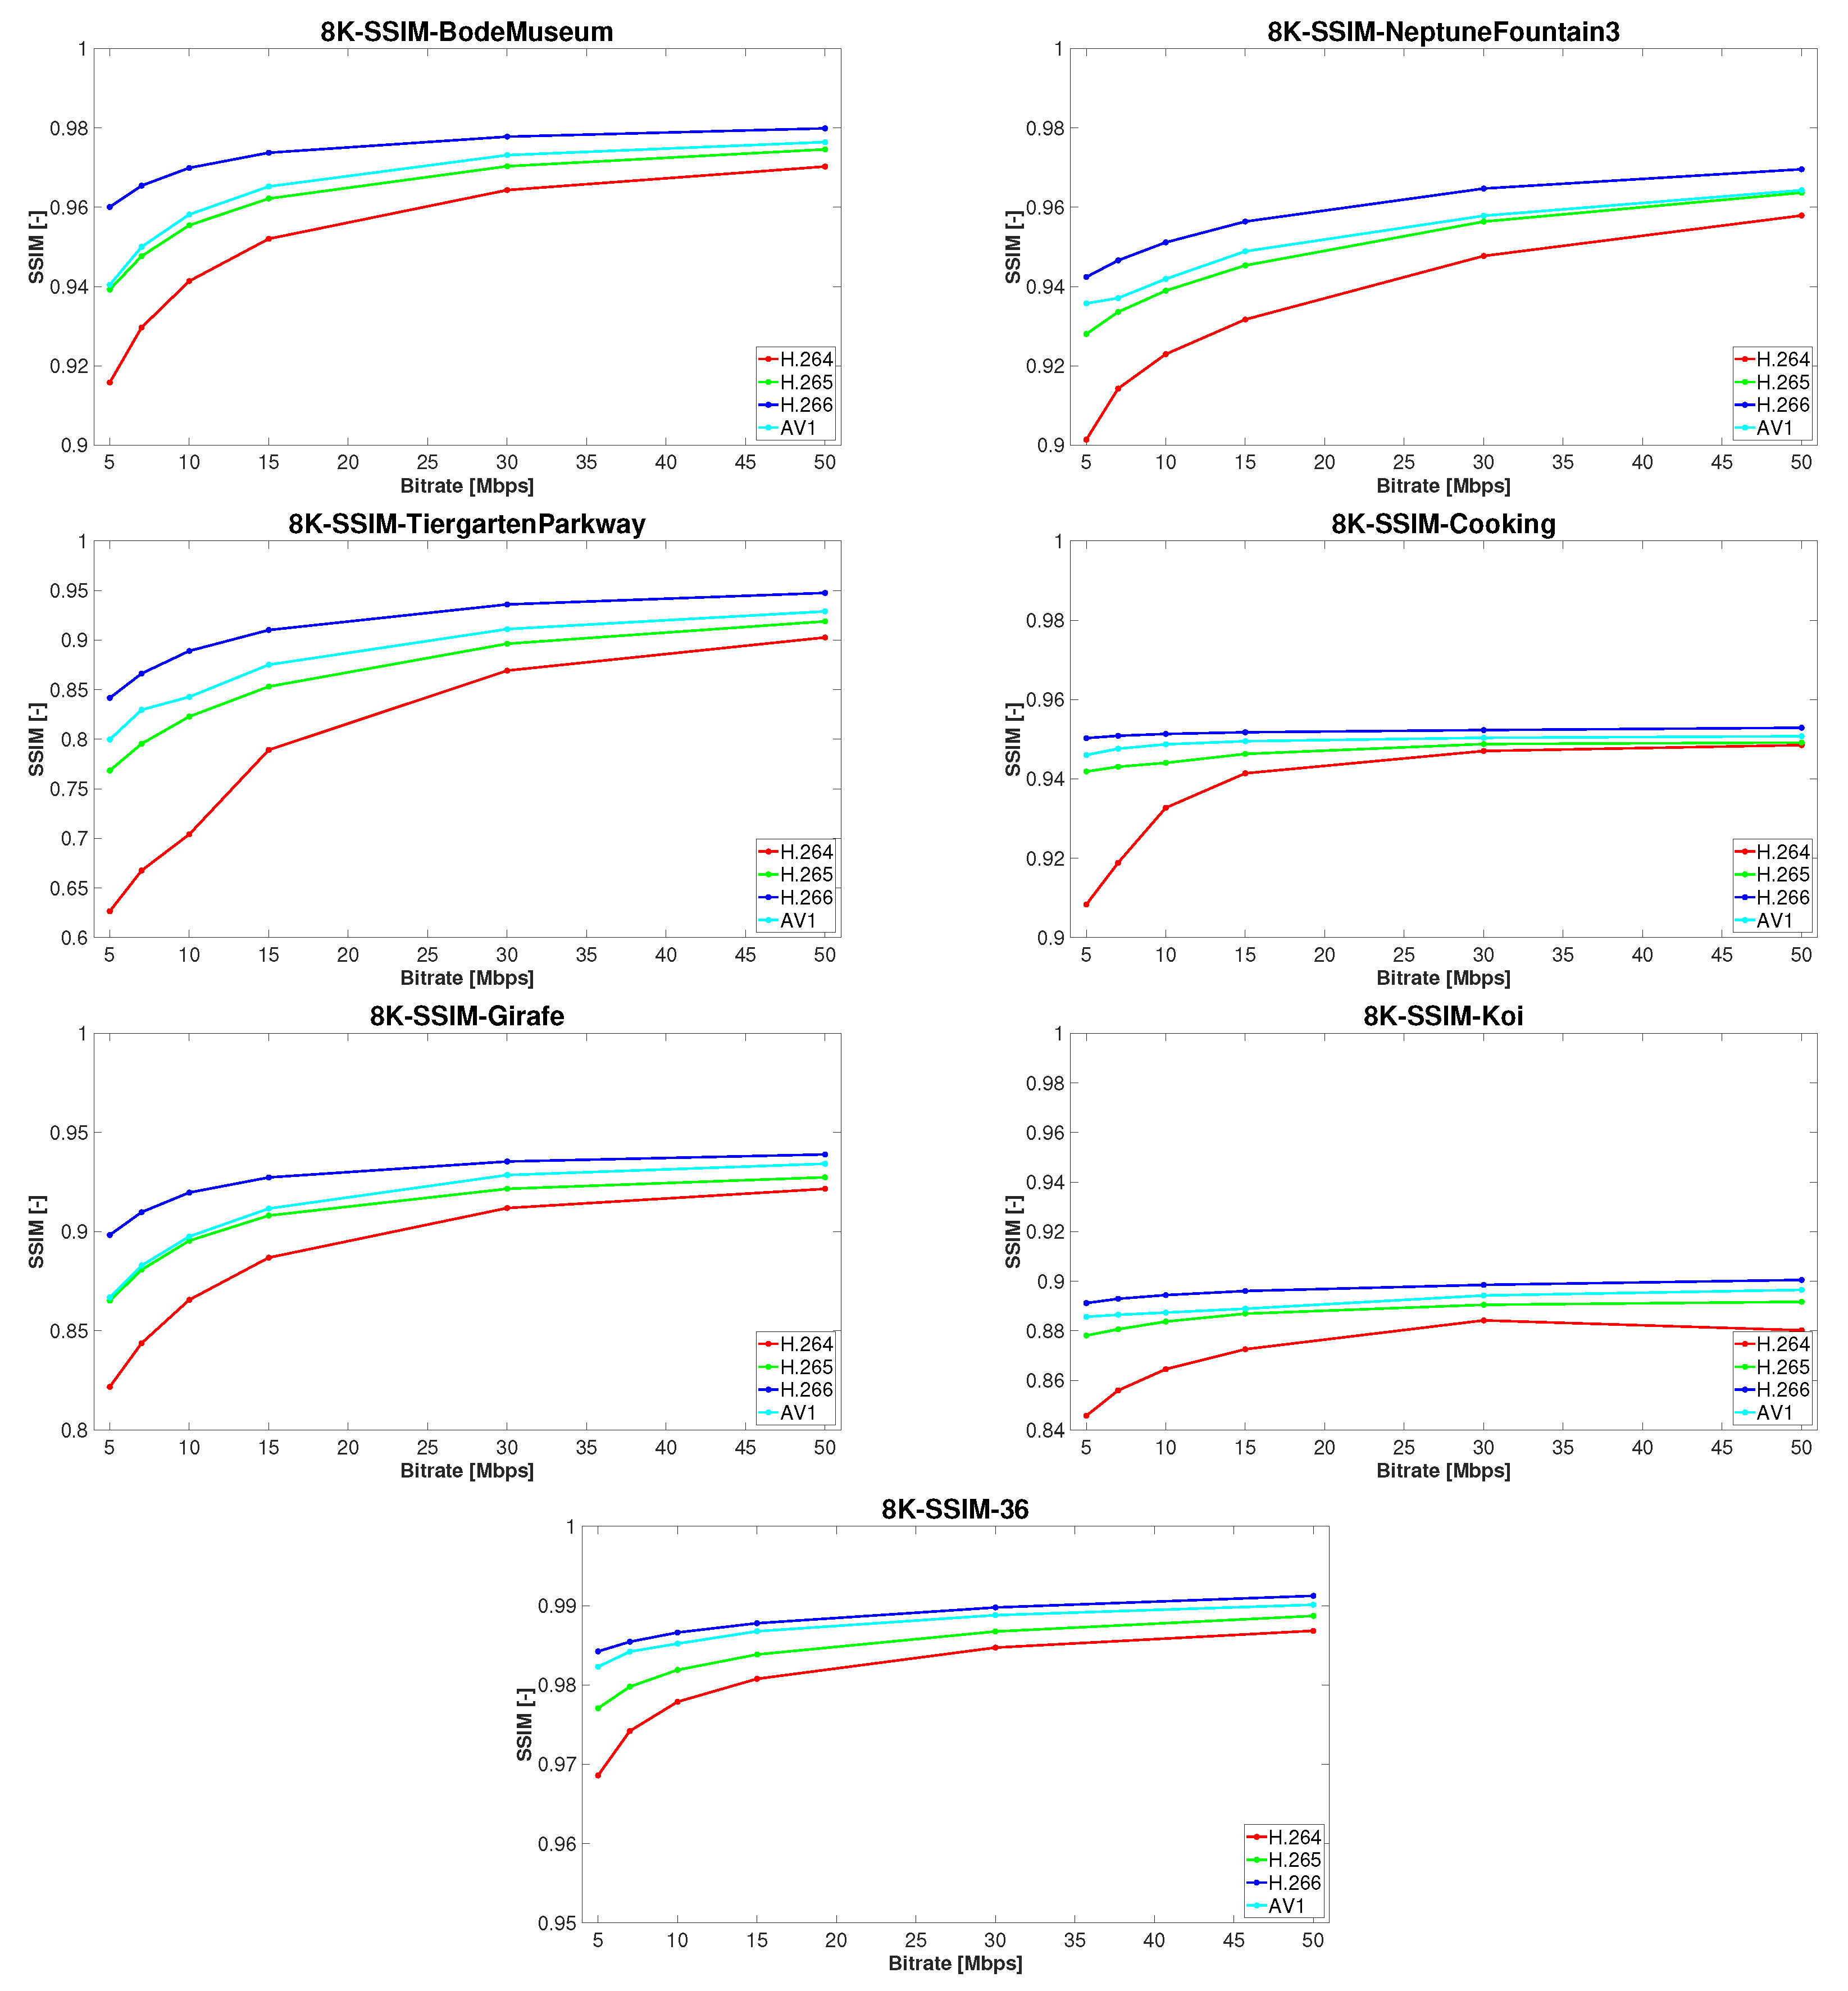
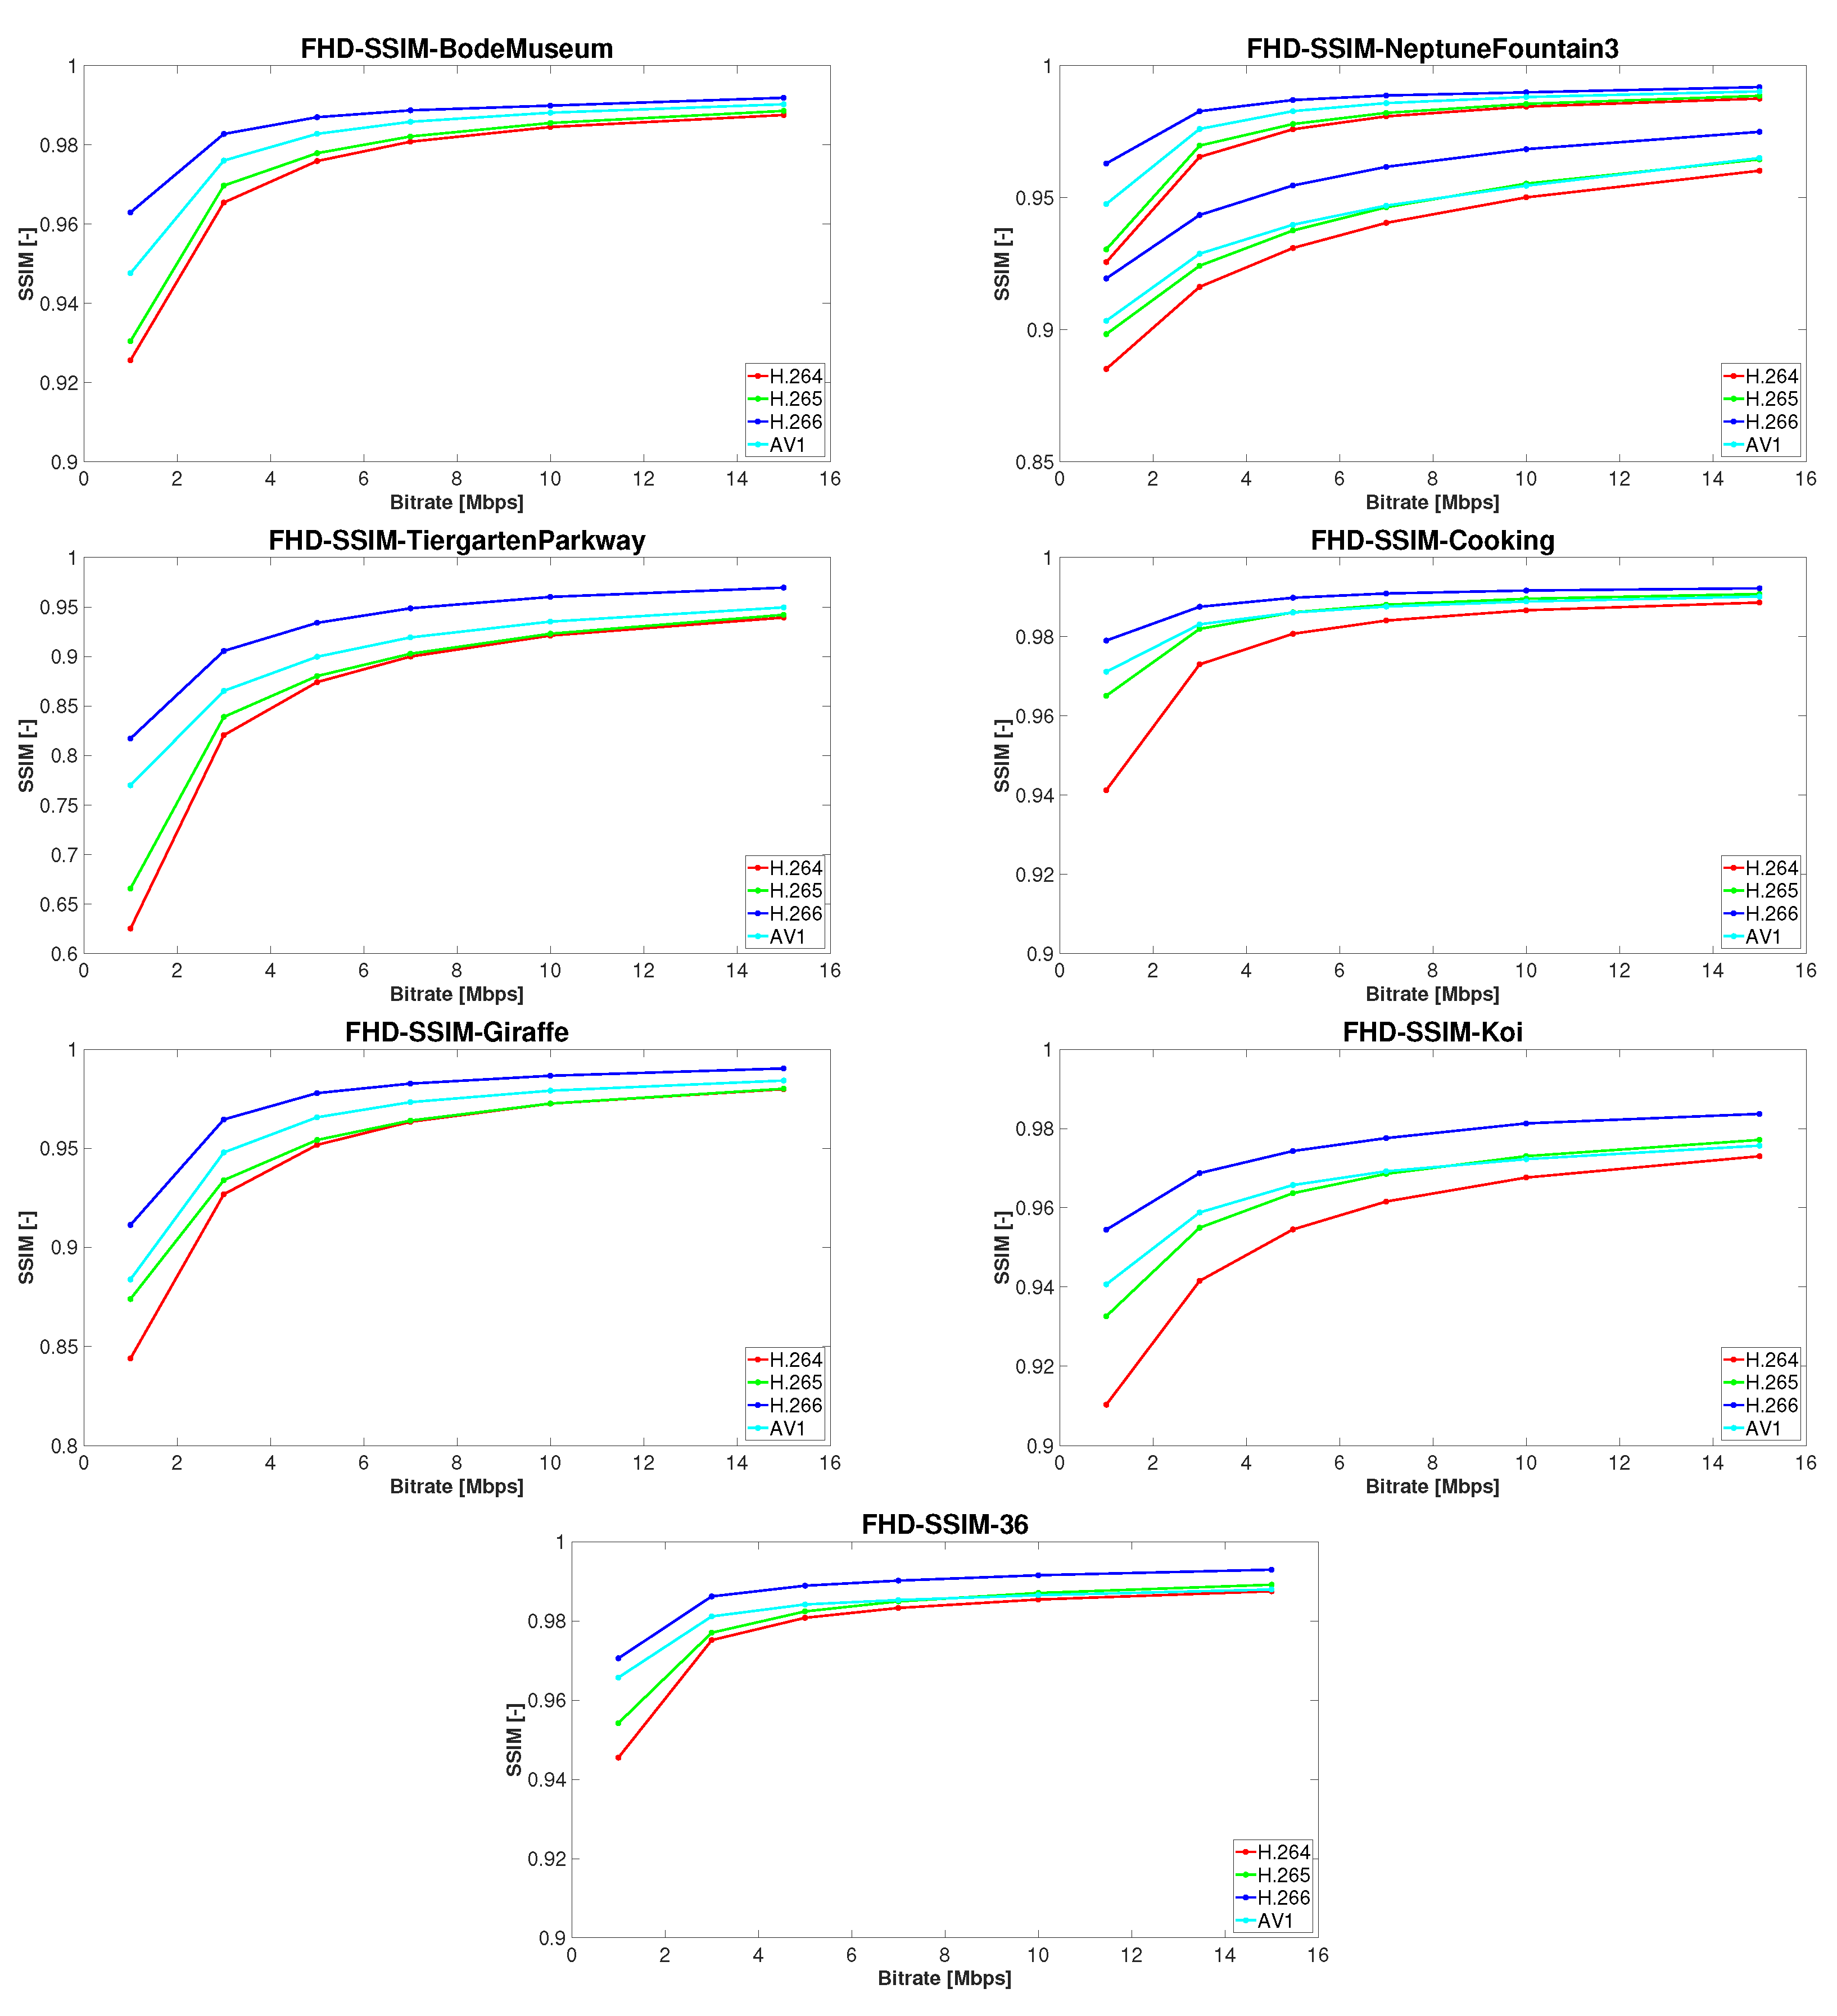
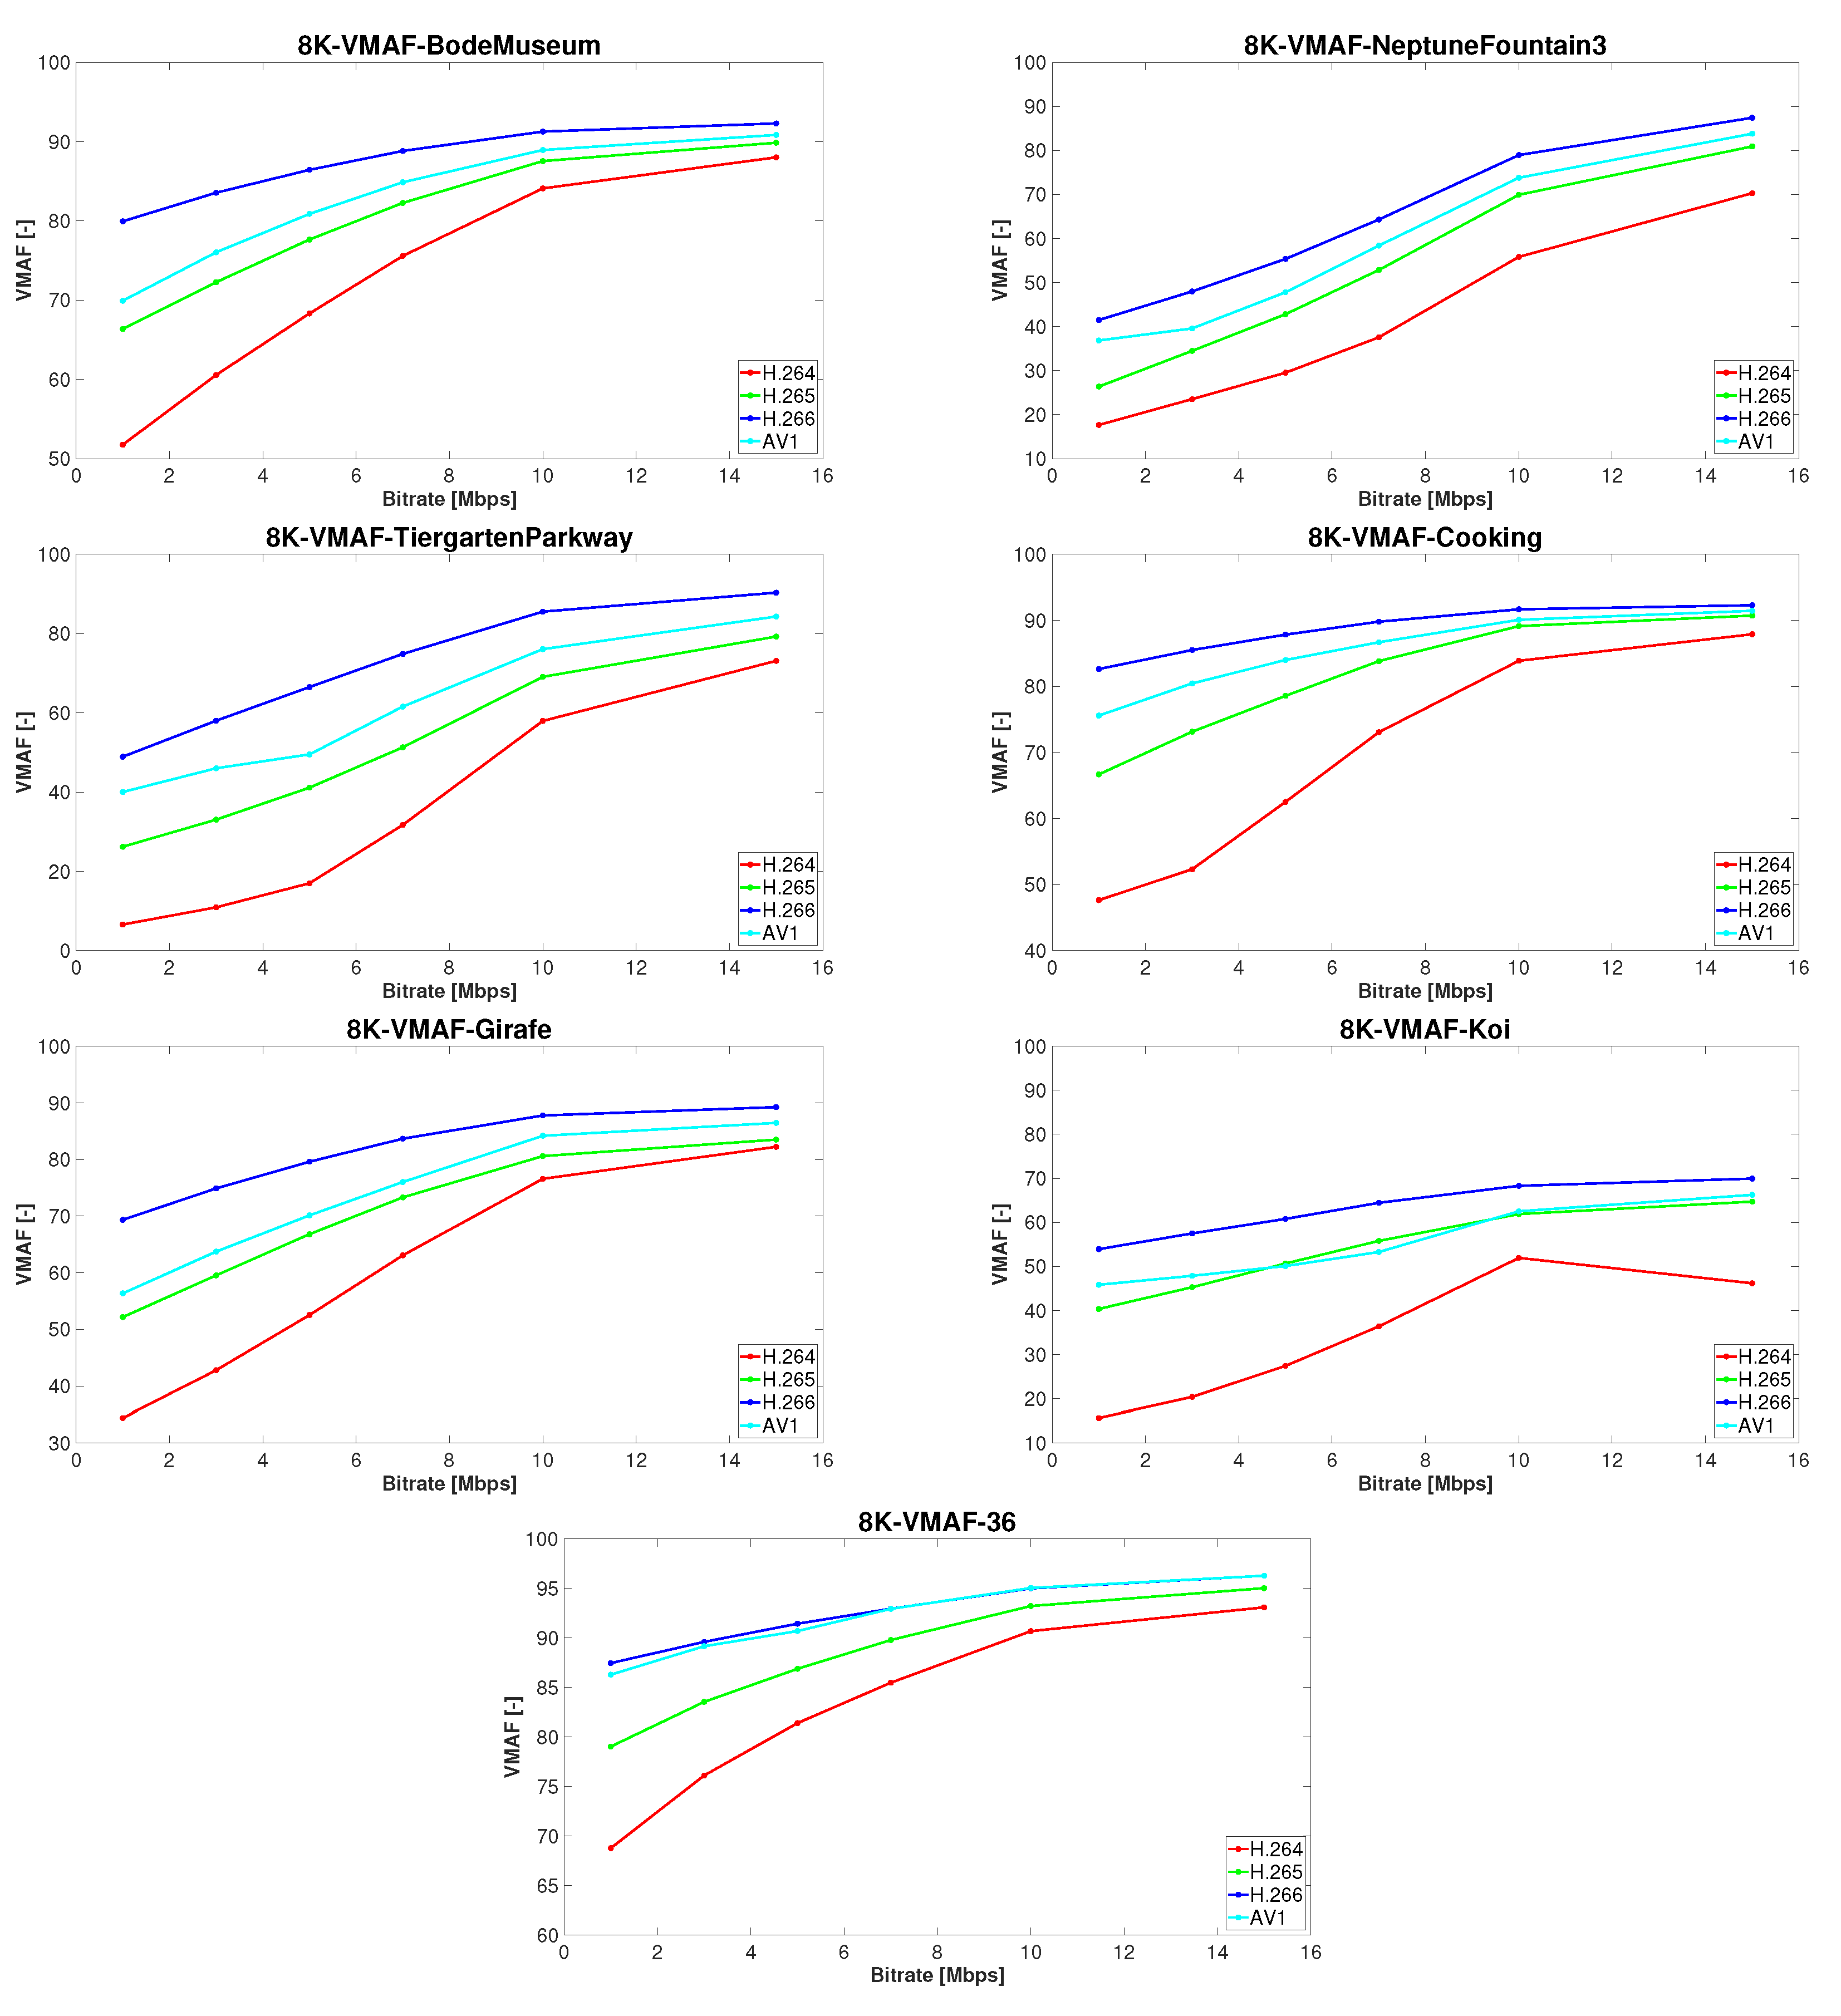
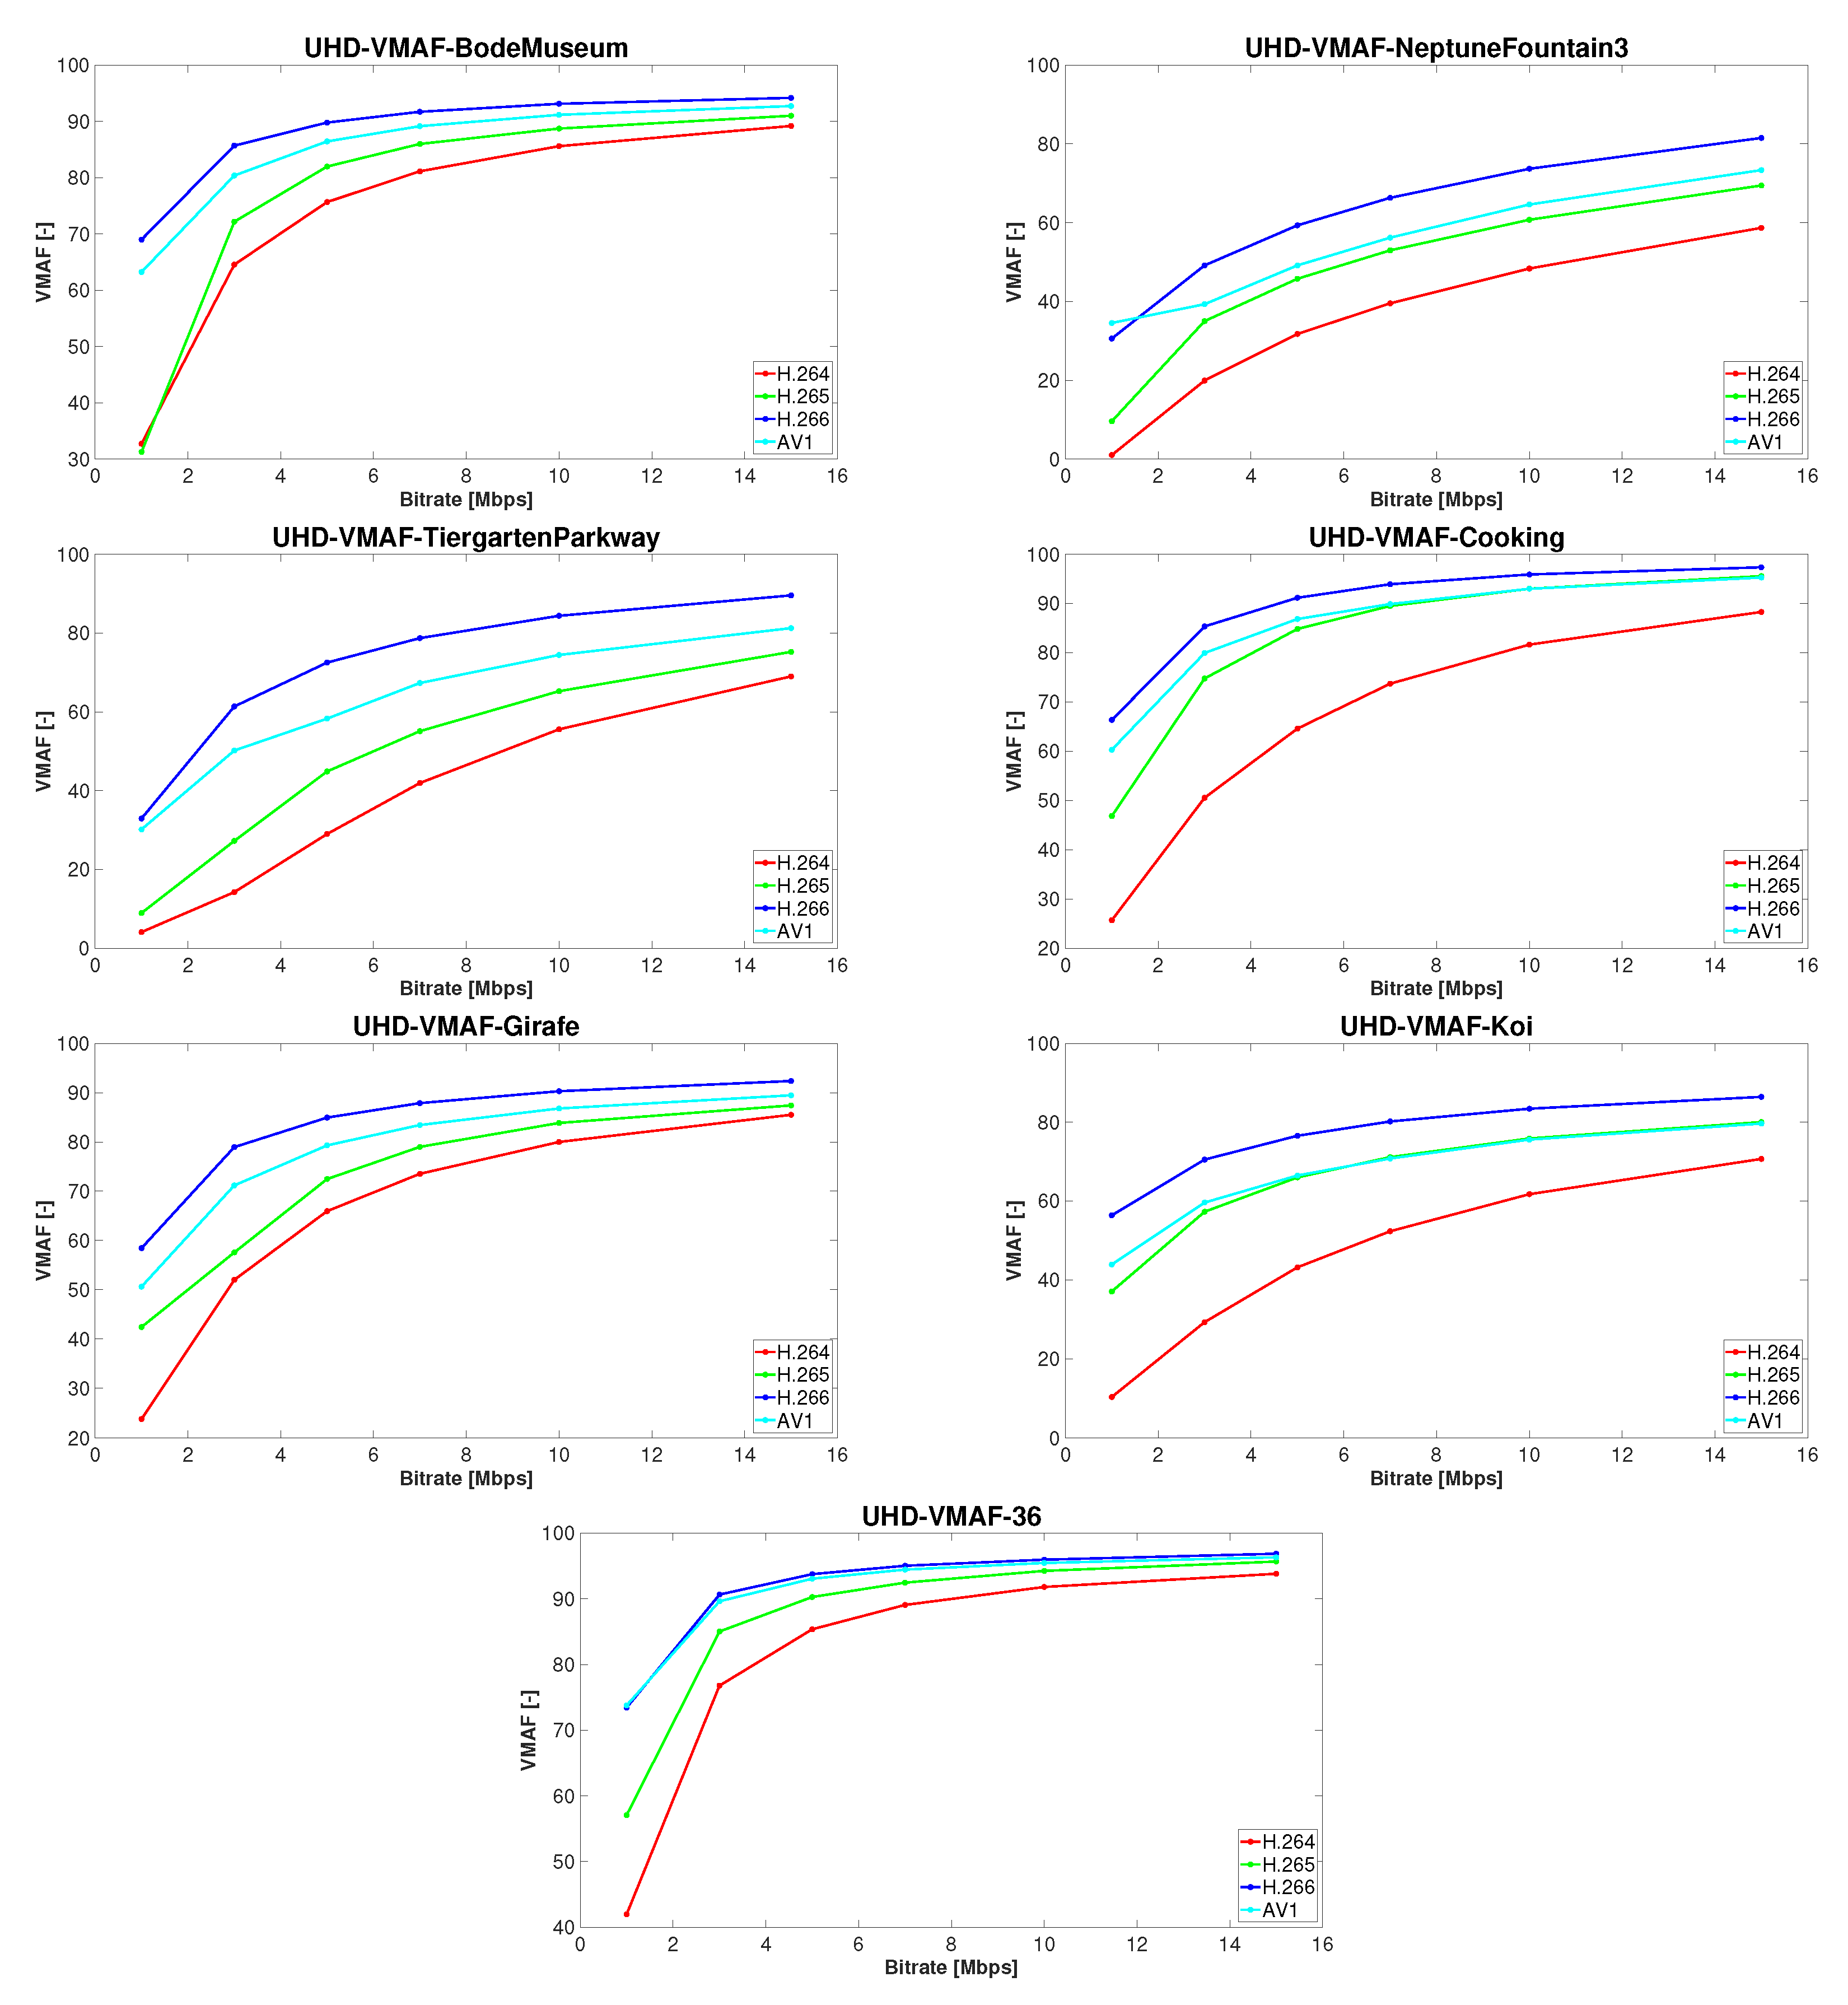
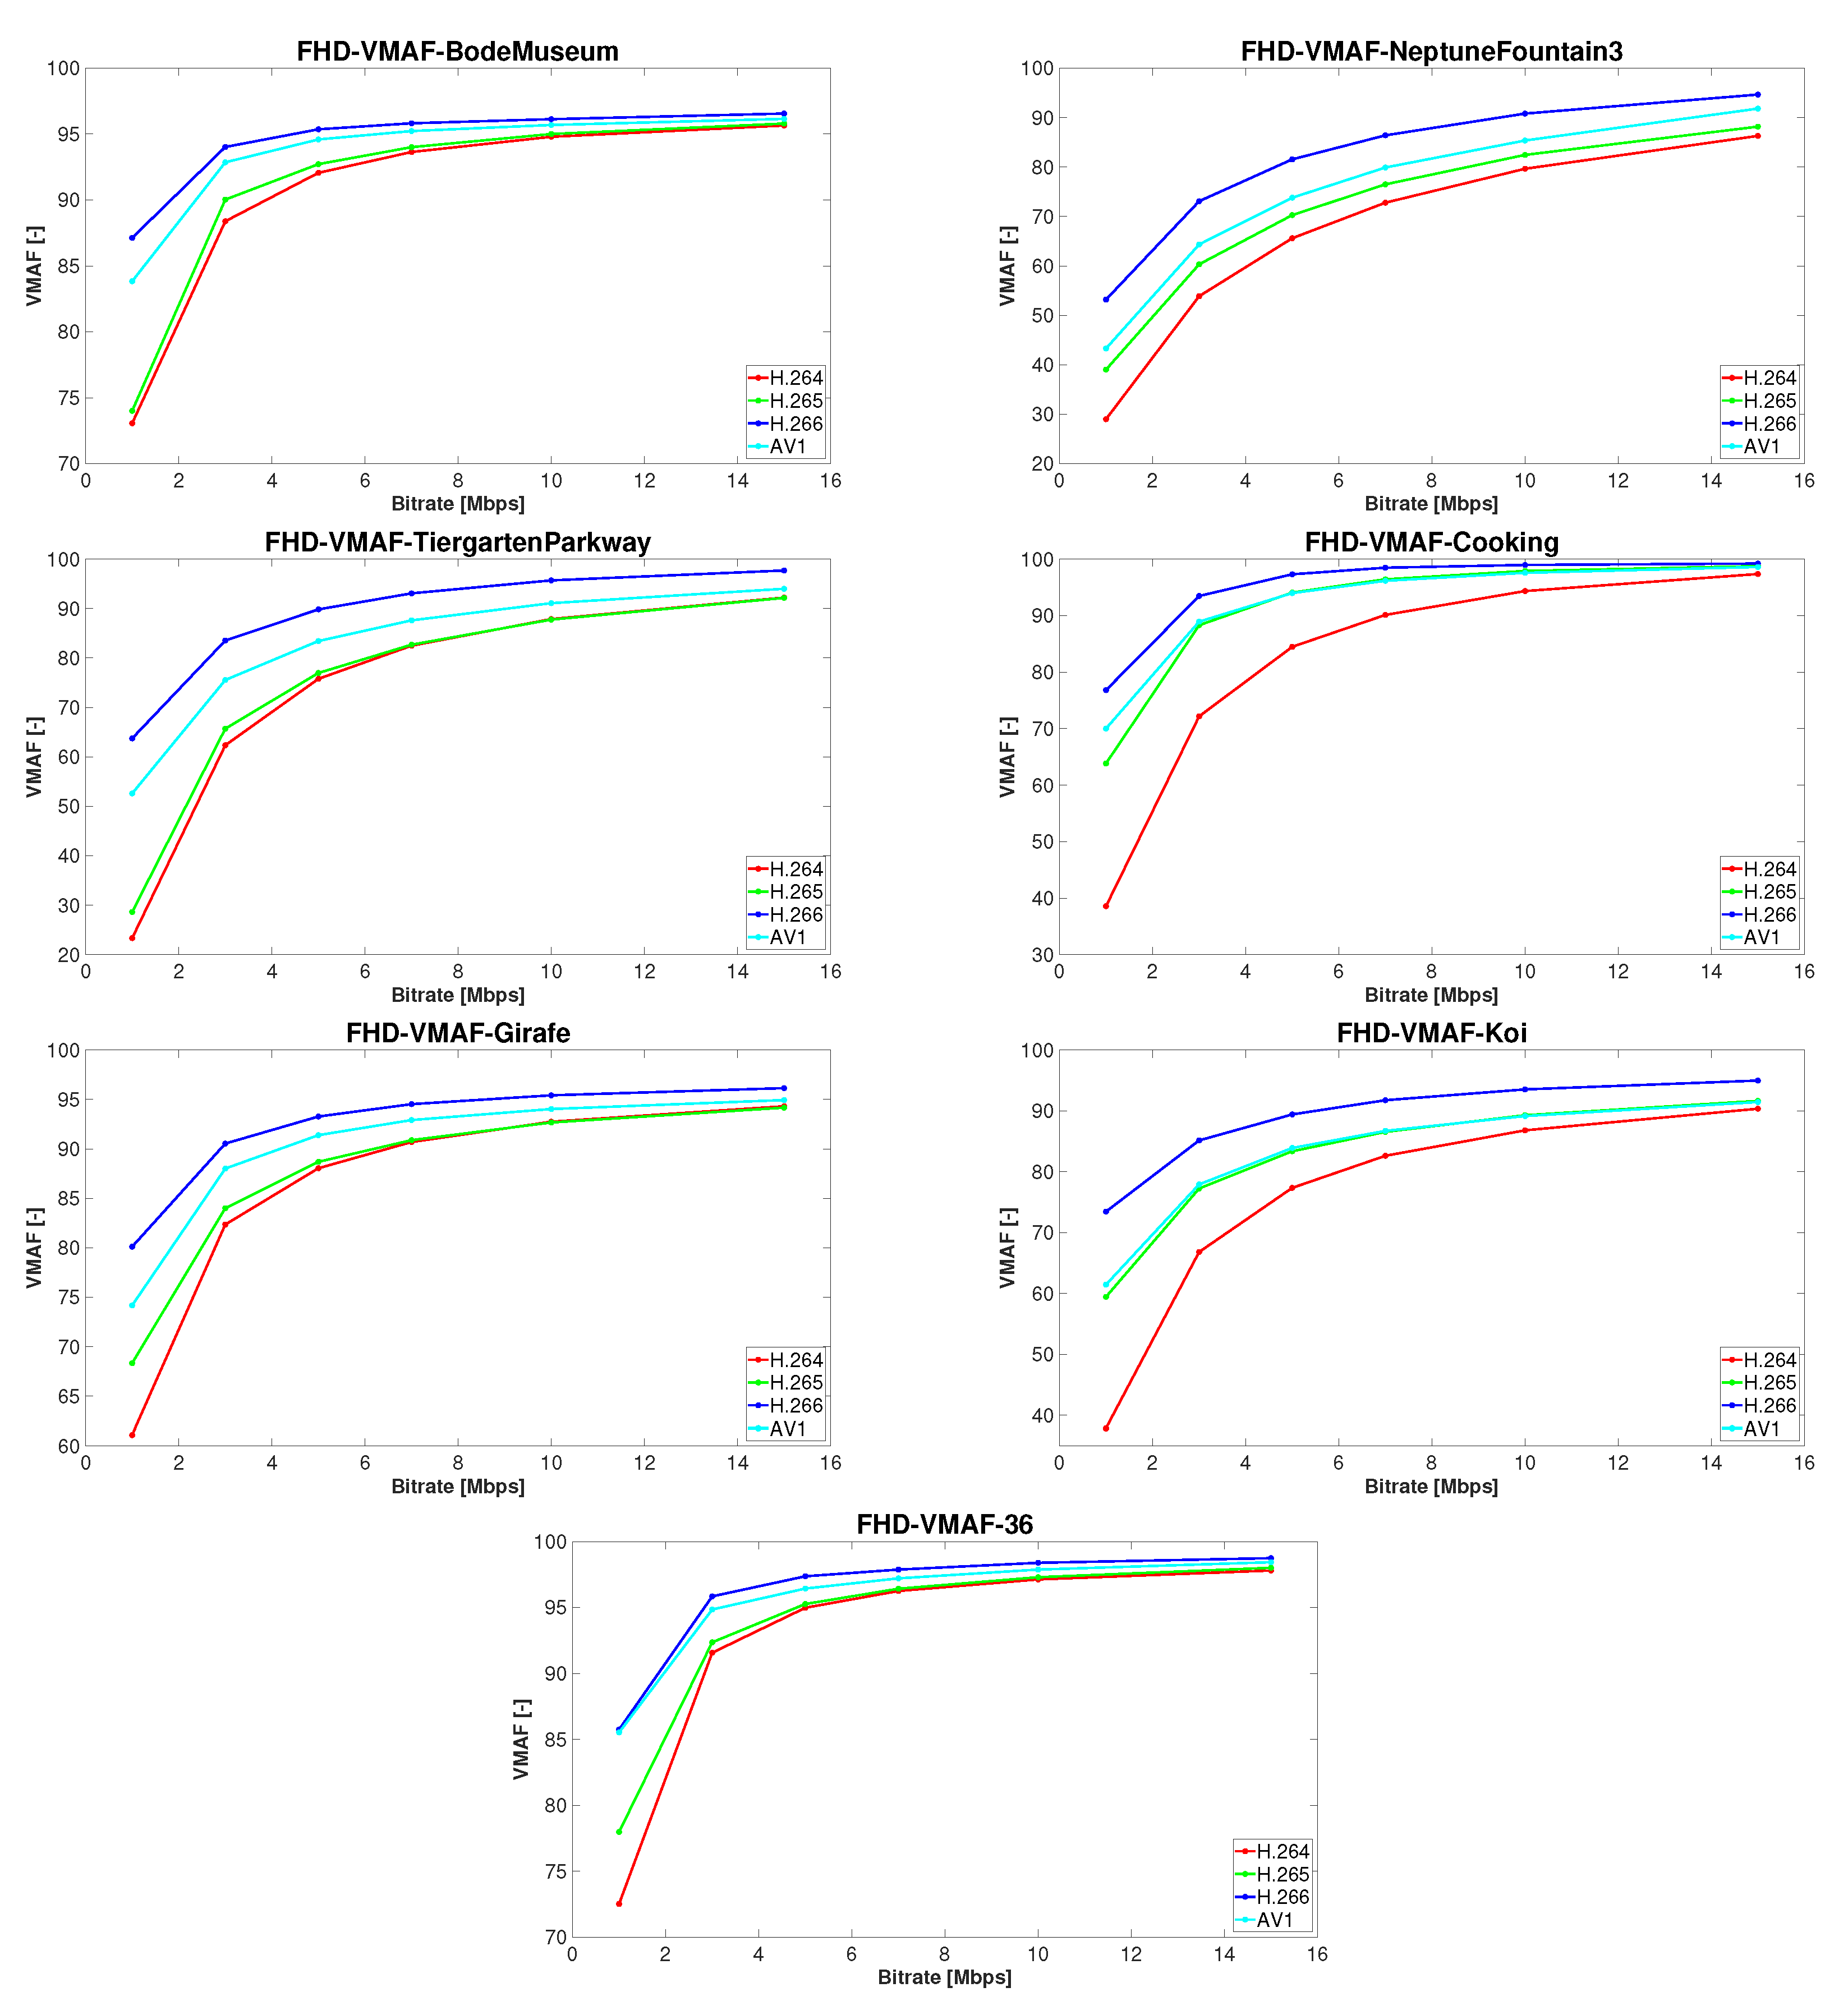
Figure 4,
Figure 5,
Figure 6,
Figure 7,
Figure 8 and
Figure 9. In each of these figures, seven plots are provided, one for each test sequence, which depict comparisons between the four codecs analyzed in our study. Each codec is highlighted in a different color, where red represents H.264/AVC, green represents H.265/HEVC, blue represents H.266/VVC, and cyan represents AV1.
Figure 4,
Figure 5 and
Figure 6 show the SSIM rate distortion plots for the 8K, UHD, and FHD resolutions, whereas
Figure 7,
Figure 8 and
Figure 9 depict graphs of the VMAF rate distortion for the same above-mentioned resolutions.
When looking at the results, we can notice that H.266/VVC outperforms all other codecs, namely H.264/AVC, H.265/HEVC, and AV1, respectively. The biggest difference, in terms of bitrate savings, is between VVC and H.264, starting at around 59% at FHD and ending at about 93% at 8K resolution. VVC also overcomes HEVC and varies from around 32% at UHD to about 78% at 8K resolution. AV1 appears to be the second most effective codec, as it outperforms H.264, ranging from around 33% at FHD to about 81% at 8K resolution, as well as HEVC, varying from 3% at FHD to around 44% at 8K resolution. The bitrate savings between the two currently most used compression standards, namely HEVC and H.264, start from around 14% at FHD to about 77% at 8K resolution. The difference in bitrate savings between the newly developed codecs, namely VVC and AV1, begins from around 1% for UHD and ends at about 70% at 8K resolution, which confirms that the H.266/VVC compression standard has the best coding efficiency and is promising for future utilization in storing and transmitting video content at 8K resolution. All the provided results vary depending on the test sequence used. Given the results, we can state that the bitrate savings between particular standards is greatest for sequences with low SI values, such as “Koi” or “Cooking” at 8K resolution, with approximately 69% and 67%; on the contrary, the smallest difference for sequences located in the middle of the SI-TI diagram were for “NeptuneFountain3” or “Giraffe” at 8K resolution at about 44% and 48%, respectively. Considering the results, it is also obvious that the bitrate savings between the newly developed compression standards (H.266/VVC or AV1) and the rest (H.265/HEVC or H.264/AVC) vary by resolution, with the largest at 8K resolution and gradually decreasing towards FHD resolution. This trend is also confirmed by
Figure 10, where each bar represents a value from
Table 11. The resolution is highlighted by color, where yellow represents 8K resolution, red represents Ultra HD resolution, and blue represents Full HD resolution. This confirms the fact that the VVC and AV1 codecs have been primarily developed for videos at high resolutions, such as 8K and/or UHD.
The reasons why the newly developed codecs—AV1 and H.266/VVC—achieve better video quality at high resolutions are given in the following lines.
Since the H.266/VVC codec was developed to be versatile, it comes with several new functionalities. One of them is random access capability, which refers to the ability to start consuming video content from positions other than at the very beginning of the bitstream. VVC also allows the spatial resolution to change at inter-coded pictures through the support of the feature referred to as reference picture resampling (RPR). In VVC, the coding tree units (CTUs), which are the basic processing units within a frame, can be larger than in HEVC, but the concept is the same and is similar to the approach of a macroblock in AVC. While the basic, well-known block-based hybrid video coding scheme used in all previous MPEG standards has been retained in VVC, the core compression technologies have been improved in some ways. First, we can mention the quadtree partitioning of a CTU, which has been extended by enabling more flexible partitioning and supporting larger block sizes. In intra-picture prediction, VVC also contains finer-granularity angular prediction for 93 angle modes, except the DC and planar modes, which are similar to HEVC and other matrix-based prediction modes for luma, as well as the cross-component prediction modes for chroma samples. In interframe prediction, VVC uses either a single motion vector (MV) nonprediction, referencing a frame in a list of previously decoded reference frames, or bi-prediction, using two MVs. In addition to this, VVC offers a variety of new coding tools for the more efficient representation, prediction, and coding of motion compensation control information, as well as enhancing the motion compensation processing itself. These techniques can be categorized into advances in coding motion information, advances in CU-level motion compensation, improved motion compensation processes using subblock-based motion derivation and prediction refinement at the decoder, and horizontal wrap-around motion compensation. In transform and quantization, VVC uses the same concept as HEVC, but VVC achieves better energy compaction of the prediction residual by extended transforms complemented by improved quantization and residual coding. The entropy coding in VVC is achieved by using CABAC coding, as in HEVC, but the efficiency is refined by some changes in the coefficient coding and probability estimation. In VVC, refined and new in-loop filters are used to reach better visual quality. Last but not least, VVC contains special coding tools that increase coding efficiency [
2].
AV1 has larger superblock partitioning of up to 128 × 128 luma samples. It can be partitioned into smaller block sizes, where the minimum block size is extended to 4 × 4 luma samples, which provides more coding flexibility. AV1 also enables a two-stage block partitioning search, where the first pass starts from the largest block size. In intraframe prediction, AV1 extends the directional Intra prediction options to support higher granularity and adds a new smooth prediction mode in nondirectional smooth intra prediction. AV1 also allows intraframe motion-compensated prediction, which uses the previously coded pixels within the same frame, namely intrablock copy (IntraBC). Moreover, other features increase coding efficiency, such as chroma from luma prediction models and the color palette mode. In interframe prediction, AV1 supports many toolsets to exploit the temporal correlation in video signals, which include adaptive filtering in translational motion compensation, affine motion compensation, and highly flexible compound prediction modes. AV1, unlike the older codecs, employs a dynamic motion vector referencing scheme that obtains candidate motion vectors from the spatial and temporal neighbors and ranks them for efficient entropy coding. In transform coding, AV1 extends its flexibility in terms of both the transform block sizes and kernels, where it extends the maximum transform block size to 64 × 64. In terms of kernels, AV1 allows each transform block to choose its own transform kernel independently. In the quantization step, where the transform coefficients are quantized, the quantization parameter (QP) ranges between 0 and 255. In the entropy coding system, AV1 employs the M-ary symbol arithmetic coding method, which was basically developed for the Daala codec. In postprocessing, AV1 allows three optional in-loop filter stages: a deblocking filter, a constrained directional enhancement filter (CDEF), and a loop restoration filter [
3].
All the above-mentioned features help both codecs achieve better coding efficiency and quality, especially for high-resolution video content.
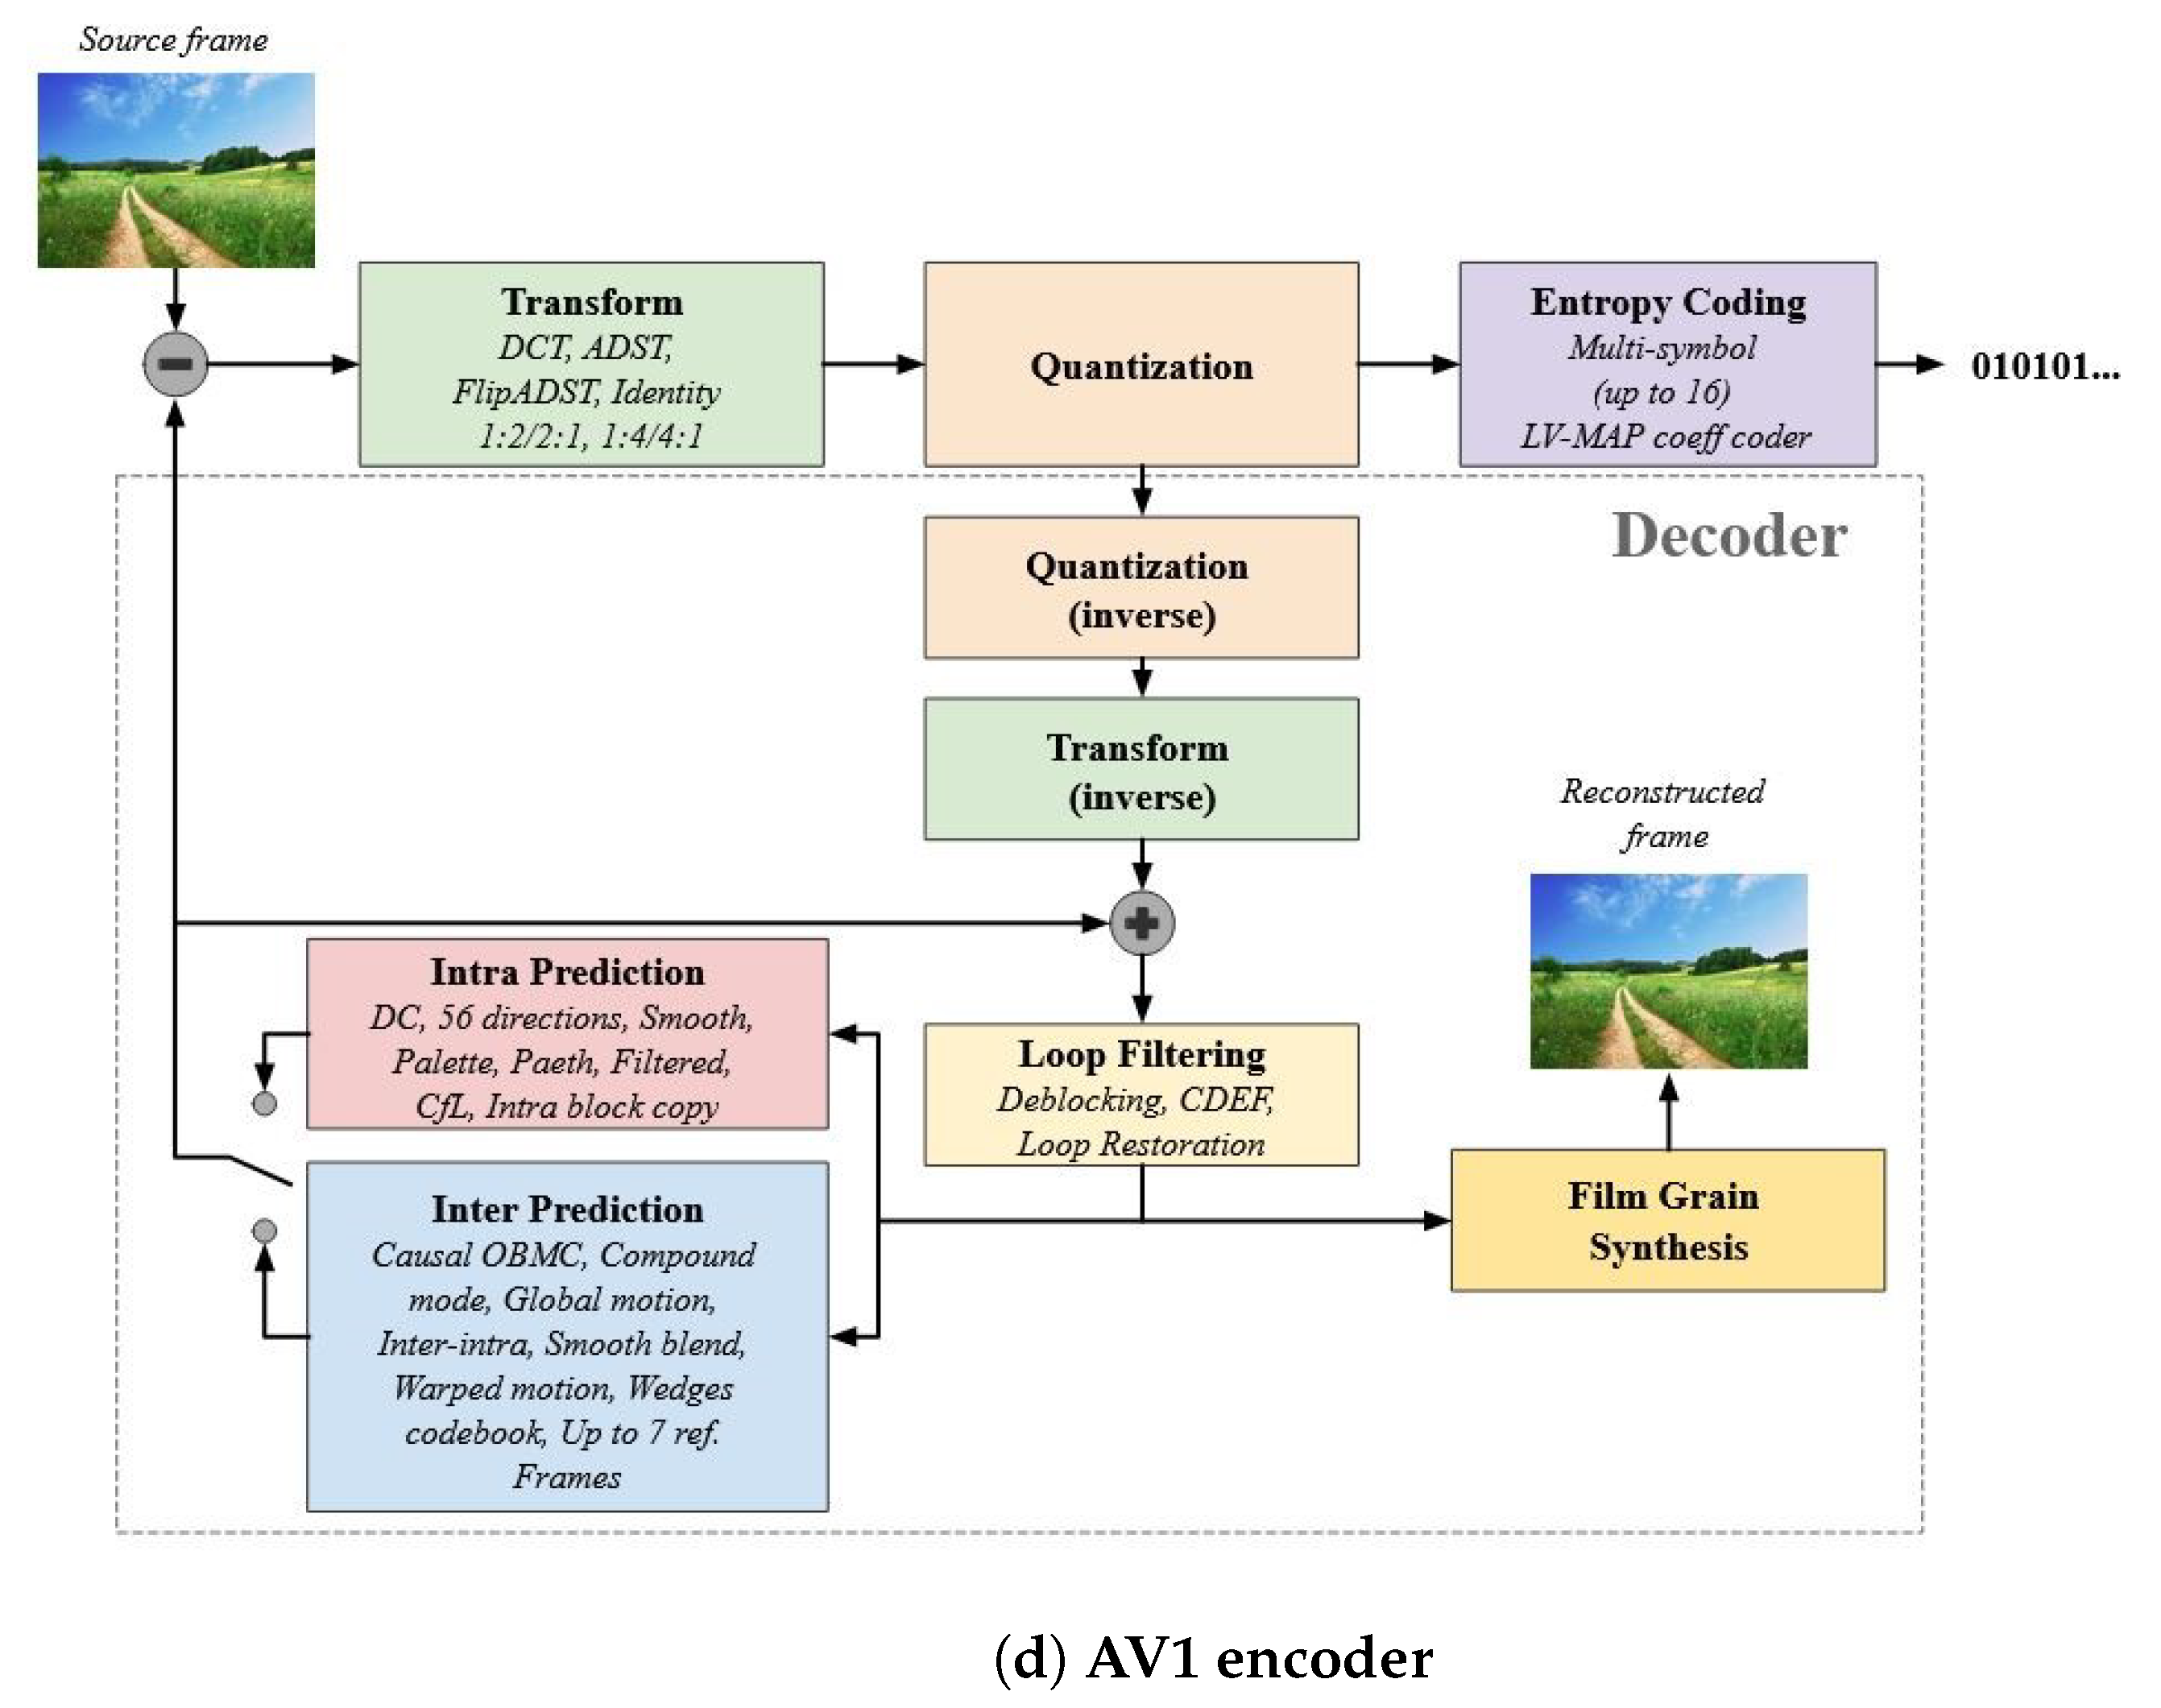
Flow charts for each coding standard discussed in the manuscript are depicted in
Figure 11 [
2,
3,
5,
6].
Apart from the bitrate savings, we have also noticed and compared the processing time of all codecs at all resolutions. For this analysis, we decided to choose the “NeptuneFountain3” test sequence, which is situated in the middle of the SI-TI plot.
Table 13 describes the parameters of the PC where the experimental setup was carried out.
Table 14 shows coding time, in seconds, and
Table 15 shows a comparison of coding times relative to the AV1 codec, which achieved the shortest time. As can be seen, H.264/AVC reaches a very similar coding time as AV1, and H.265/HEVC achieves about two times longer computational times compared to AV1. The longest coding time, as expected, is reached by the H.266/VVC codec, starting from 27 times longer at a bitrate of 1 Mbps under UHD resolution and ending at 174 times longer at a bitrate of 15 Mbps under FHD resolution when compared to the AV1 codec.
4. Conclusions
This paper deals with the compression performance of the latest and most used video codecs, namely H.266/VVC, AV1, H265/HEVC, and H.264/AVC. In our experiments, we worked with 63 test sequences from three different databases with large diversity. Firstly, we had to choose some of the sequences according to SI-TI analysis. We have selected seven sequences, one sequence from each of the four corners and three from the middle of the SI-TI plot. Subsequently, we encoded them to particular codecs, namely H.264/AVC, H.265/GEVC, H.266/VVC, and AV1 at Full HD (FHD), Ultra HD (UHD), and 8K resolution. The bitrates were set to 1, 3, 5, 7, 10, and 15 Mbps for FHD and UHD resolutions and 5, 7, 10, 15, 30, and 50 Mbps for 8K resolution, respectively. Altogether, 420 test sequences were encoded. For the encoding, we decided to use the average bitrate coding (ABR) mode and one-pass rate control mode, except for when encoding sequences to the AVC and HEVC codecs at 8K resolution, where the two-pass encoding mode was used. For quality assessment, we used objective metrics, namely peak signal-to-noise ratio (PSNR), structural similarity index (SSIM), and video multi-method assessment fusion (VMAF), which belong to full-reference methods. In terms of the Bjøntegaard delta (BD) model, the results showed that H.266/VVC outperforms all other codecs, namely H.264/AVC, H.265/HEVC, and AV1, respectively. The averaged bitrate savings were approximately 78% for H.266/VVC, 63% for AV1, and 53% for H.265/HEVC relative to H.264/AVC, 59% for H.266/VVC and 22% for AV1 compared to H.264/AVC, and 46% for H.266/VVC relative to AV1, with 8K resolution for all. The results also varied depending on the test sequence and resolution used—with higher resolution, the effectiveness of newly developed codecs, such as H.266/VVC and AV1, was greater. This confirmed the fact that the H.266/VVC and AV1 codecs have been primarily developed for videos at high resolutions, such as 8K and/or UHD. In addition to bitrate savings, we also compared the processing time of all codecs at all resolutions. To carry out the analysis, we selected the “NeptuneFountain3” test sequence, which is positioned in the middle of the SI-TI plot. Our findings revealed that H.264/AVC has a similar coding time to AV1, whereas H.265/HEVC takes about twice as long to compute as AV1. As expected, the H.266/VVC codec had the longest coding time, starting at 27 times longer at a bitrate of 1 Mbps under UHD resolution and ending at 174 times longer at a bitrate of 15 Mbps under FHD resolution when compared to the AV1 codec.
In the near future, we would like to assess other test sequences from 8K datasets using objective metrics. Subsequently, we plan to select appropriate sequences and evaluate them using subjective methods, such as absolute category rating (ACR), absolute category rating with hidden reference (ACR-HR), or the double stimulus impairment scale (DSIS). From the results, we intend to calculate the correlation between the objective and subjective results by using Pearson and Spearman’s correlation coefficients. Moreover, the results will be used as inputs to neural networks to refine our proposed model, which can predict quality based on objective metrics.


