Article

S2S-Sim: A Benchmark Dataset for Ship Cooperative 3D Object Detection

School of Computer Engineer and Science, Shanghai University, Shanghai 200444, China
*
Authors to whom correspondence should be addressed.
These authors contributed equally to this work.
Electronics 2024, 13(5), 885; https://doi.org/10.3390/electronics13050885
Submission received: 30 January 2024 / Revised: 21 February 2024 / Accepted: 23 February 2024 / Published: 26 February 2024
(This article belongs to the Special Issue Radar System and Radar Signal Processing)

Abstract

:
The rapid development of vehicle cooperative 3D object-detection technology has significantly improved the perception capabilities of autonomous driving systems. However, ship cooperative perception technology has received limited research attention compared to autonomous driving, primarily due to the lack of appropriate ship cooperative perception datasets. To address this gap, this paper proposes S2S-sim, a novel ship cooperative perception dataset. Ship navigation scenarios were constructed using Unity3D, and accurate ship models were incorporated while simulating sensor parameters of real LiDAR sensors to collect data. The dataset comprises three typical ship navigation scenarios, including ports, islands, and open waters, featuring common ship classes such as container ships, bulk carriers, and cruise ships. It consists of 7000 frames with 96,881 annotated ship bounding boxes. Leveraging this dataset, we assess the performance of mainstream vehicle cooperative perception models when transferred to ship cooperative perception scenes. Furthermore, considering the characteristics of ship navigation data, we propose a regional clustering fusion-based ship cooperative 3D object-detection method. Experimental results demonstrate that our approach achieves state-of-the-art performance in 3D ship object detection, indicating its suitability for ship cooperative perception.

1. Introduction

LiDAR-based cooperative object detection has become a core component of advanced autonomous driving perception systems. In this process, vehicle cooperative perception datasets covering diverse scenes have played an important role [1]. However, LiDAR applications on ships are relatively nascent compared to vehicles, and there is currently a lack of unified point cloud datasets in navigation scenes. This shortage has significantly impeded the development of intelligent perception technologies for ships at sea. Therefore, establishing a ship cooperative perception dataset for research and validation of cooperative perception technologies among ships is an urgent need in the field of intelligent ship perception.
Benefiting from the application and popularity of LiDAR, LiDAR has now become one of the core sensors for autonomous driving [2,3]. Compared to cameras, LiDAR offers the advantage of obtaining more precise object position information, which is crucial for the safety of autonomous driving. In recent years, datasets collected from single-source LiDAR, such as KITTI [4], Waymo [5], and NuScenes [6], have achieved promising results in single-source LiDAR-based object perception [7]. However, the use of a single-vehicle-mounted LiDAR is susceptible to occlusions and distance-related limitations when sensing the environment, which may result in insufficient object point cloud data [8]. This limitation significantly hinders the accurate perception of object categories, shapes, poses, and other relevant attributes. Cooperative perception technology for vehicles thus emerged, as vehicle cooperative perception leverages shared information obtained via vehicle-to-vehicle (V2V) or vehicle-to-infrastructure (V2I) communication to enrich single-sensor perception and enable more accurate sensing of objects in the driving environment. The performance of cooperative object perception among vehicles has also gradually improved with the maturation of datasets.
The early vehicle cooperative datasets were primarily derived from simulation. V2V-sim [9] was one of the earliest point cloud dataset proposed for vehicle cooperative perception, obtained by resampling from real collected data. OPV2V [10] is a dataset simulated using the OpenCDA and CARLA simulators that increased the number of collaborating communication vehicles in scenes. V2XSet [11] and V2X-sim [12] built upon V2V (vehicle-to-vehicle) collaboration by introducing simulated scenes of V2I (vehicle-to-infrastructure) collaboration, making the collected data more realistic. Simulated datasets promoted the development of vehicle cooperative perception technologies, and real collected cooperative datasets have gradually matured over the past two years. V2V4Real [13] is the first large-scale real-world multimodal dataset specifically designed for V2V perception. The data was collected by two vehicles equipped with multimodal sensors driving together in different scenes. On the other hand, the DAIR-V2X [14] dataset is the first large-scale, multimodal, and multi-view real-world dataset collected from real scenes. Currently, the volume of data, number of scenes, and sensor data in vehicle cooperative perception datasets are gradually increasing. This significant advancement has greatly facilitated the development and application of advanced autonomous driving technologies.
In contrast to the extensive application of LiDAR in autonomous driving, intelligent ship technologies are at an earlier stage of development. Currently, ships mainly rely on sensors such as AIS, radars and cameras to assist experienced crew in perceiving the environment and decision-making. While these sensors or systems play an important role in routine navigation scenes, there are also some issues. Firstly, not all ships are equipped with AIS, making it difficult to identify ships or objects without AIS. Moreover, the AIS system refresh rate is not fixed and can be as long as 30 s, which is disadvantageous for real-time ship perception [15]. For radar, it is subject to high levels of noise, has a significant short-range blind zone, and detects a limited number of object points, making it unable to accurately discern object contours. Therefore, it can only serve as an adjunct to human visual perception for navigation purposes. As for cameras, although cameras carried by ships contain visible light and infrared information, they generally lack depth information and are greatly affected by weather conditions such as rain and fog. Considering the above analysis, to achieve intelligent perception of the environment for ships, a more comprehensive sensor is required. LiDAR has already gained widespread application in the field of autonomous driving, thus driving the emerging research on ship object perception based on LiDAR.
The perception objects and ranges in ship navigation scenarios differ significantly from those in autonomous driving scenes. Conducting research on object perception in ship navigation scenarios also requires dataset construction first. Currently, several studies have constructed single-source ship navigation perception datasets for tasks such as object detection and tracking in navigation scenarios [15,16,17]. However, these datasets have not been widely promoted and applied. One reason for this is the relatively short time since the introduction of these datasets. Additionally, there are issues related to the scale and standardization of the data, which makes them less convenient to use. Additionally, the current ship navigation point cloud datasets are all based on single-source LiDAR acquisition and do not consider information obtained through ship-to-ship (S2S) communication, which hinders the research on ship cooperative perception, a technology with broad application prospects.
To address the above issues, this paper presents a standardized ship cooperative perception dataset, S2S-sim. And a regional clustering fusion method is proposed to enhance the precision of ship cooperative perception. The main contributions of this study are as follows:
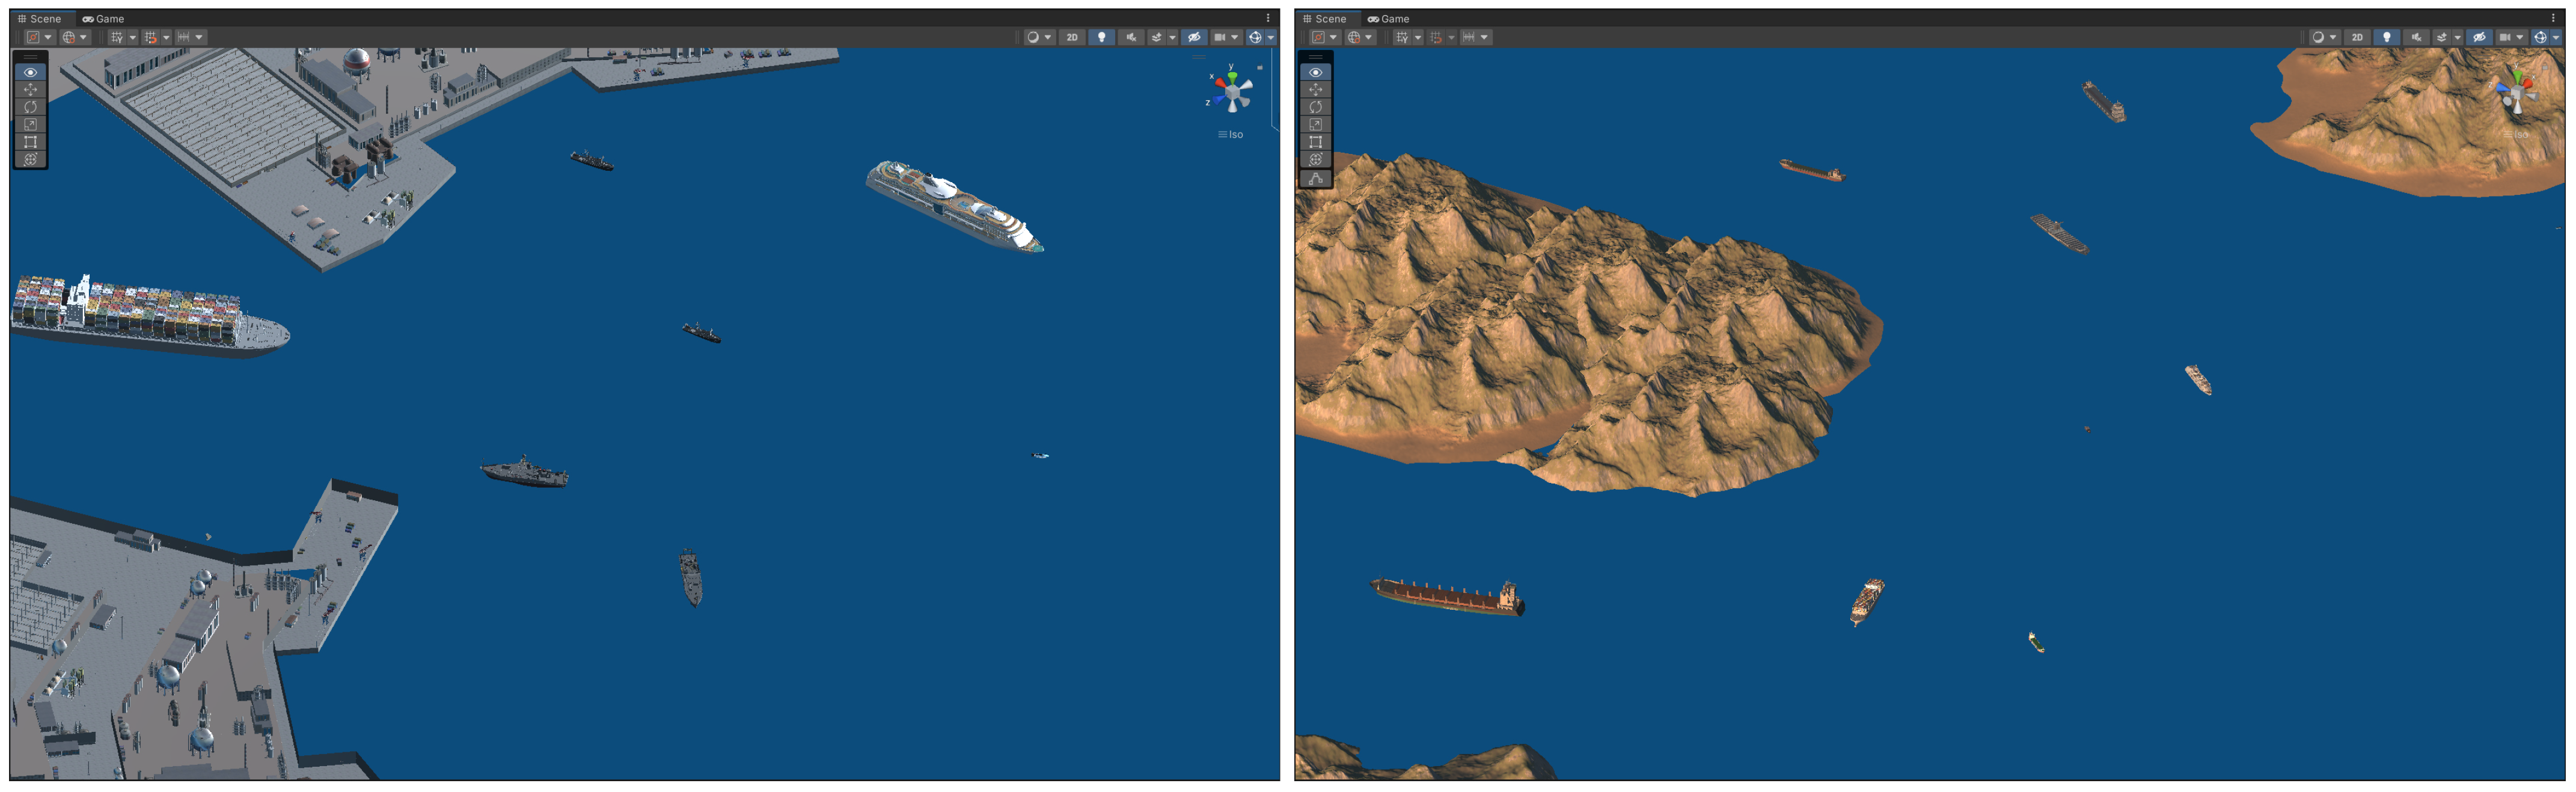
  • We proposed the ship cooperative perception dataset S2S-sim. Based on Unity3D, we simulated three typical navigation scenes and constructed a 64-line simulated LiDAR mounted on typical ships to collect data according to the characteristics of real LiDAR sensors. A total of 7000 frames of cooperative sensing data were collected for collaboration within a range of 2 km.
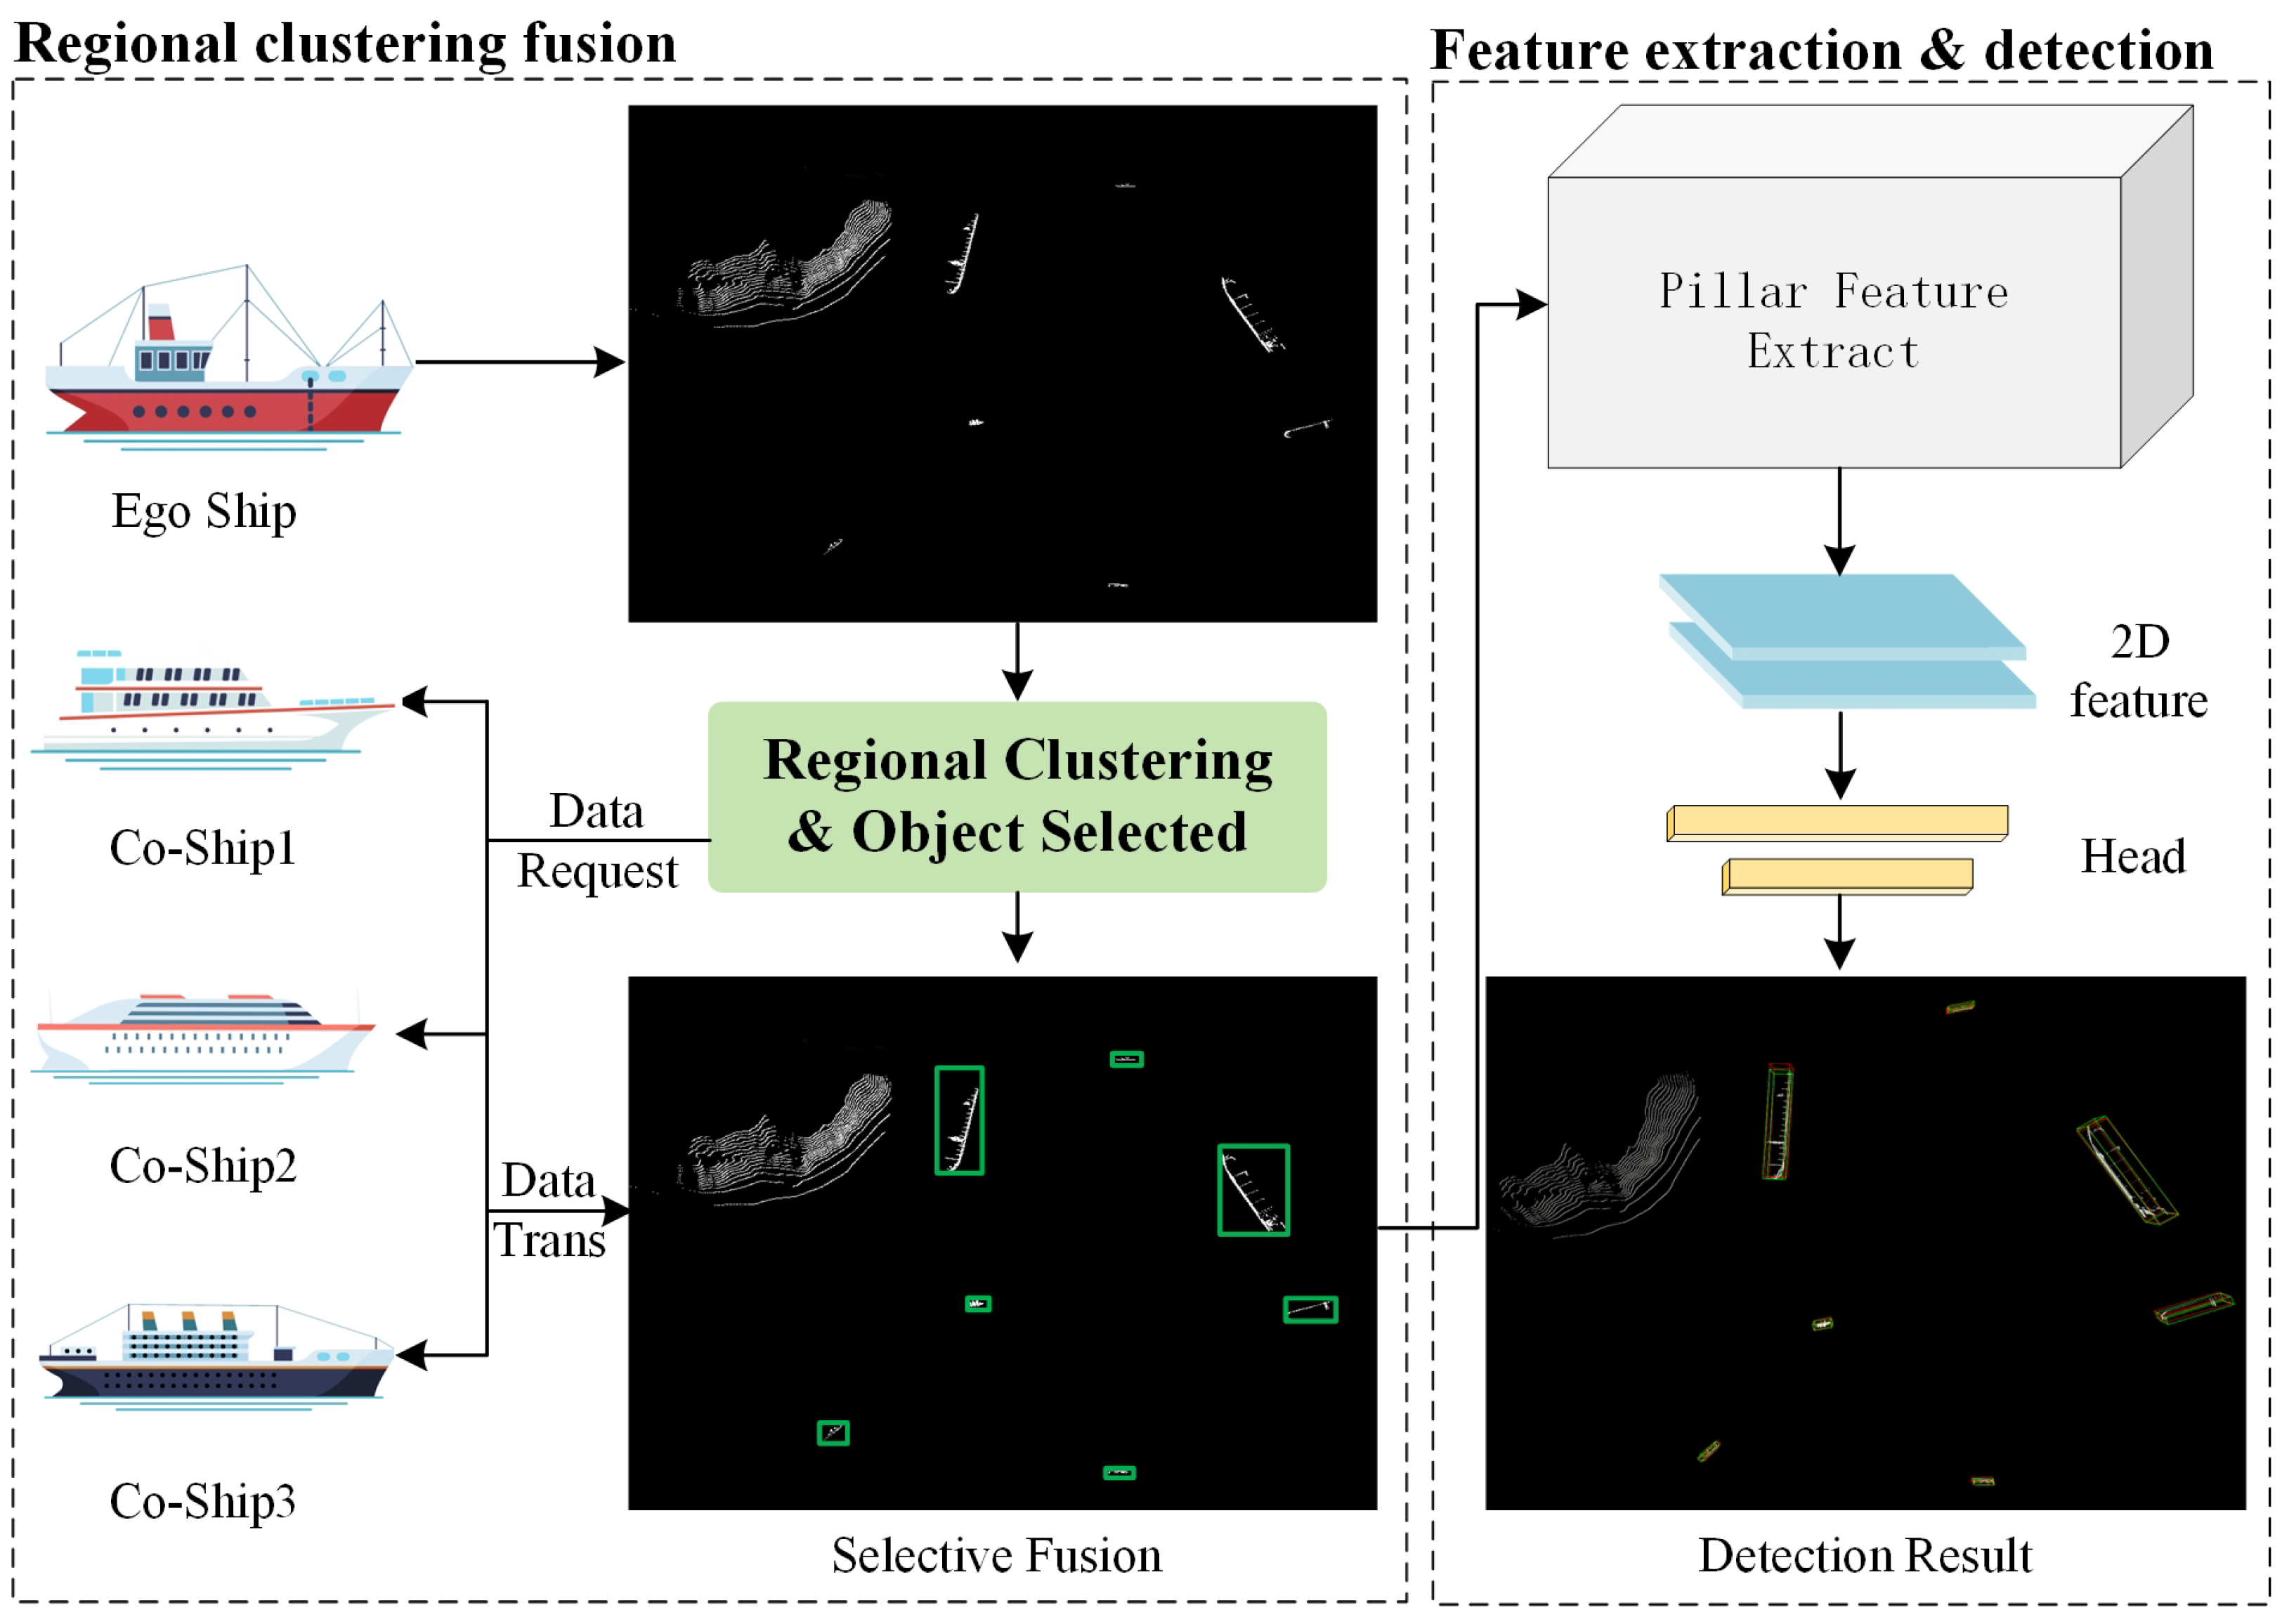
  • We proposed a regional clustering fusion-based ship cooperative 3D object-detection method. The method uses region division and clustering to improve the efficiency and accuracy of cooperative data fusion. Compared with existing multi-agent cooperative perception methods, our proposed method achieves the state-of-the-art object-detection performance.
  • The S2S-sim dataset proposed in this study is the first ship cooperative perception dataset, serving as a standardized dataset that is easy to use. Meanwhile, the cooperative perception method proposed in this paper is implemented based on the V2V cooperative perception framework, which facilitates research on ship cooperative perception methods as well as the transfer and application of vehicle cooperative perception methods to the domain of ship navigation.
The remainder of this paper is organized as follows. Section 2 provides an overview of the related work in the field. Section 3 introduces the proposed S2S-sim dataset. Section 4 presents the regional clustering fusion-based ship cooperative perception method proposed in this paper. Section 5 provides experimental comparisons of the proposed cooperative perception method with other multi-agent cooperative perception methods on the S2S-sim dataset and discusses the experimental results. Section 6 concludes this work and discusses future directions.

2. Related Work

2.1. Cooperative Perception Datasets

In recent years, with the increasingly widespread use of sensors such as LiDAR and multi-view cameras on intelligent systems such as autonomous vehicles, unmanned aerial vehicles (UAV) [18,19], unmanned surface vehicles (USV) [20,21], and industrial robots [22], data collection and enhancement of system perception capabilities have been greatly facilitated [23]. Notably, datasets from individual intelligent entities have significantly promoted perception performance improvement in various domains [24,25,26]. However, due to factors such as occlusion, truncation, distance, and blind spots in the field of view, data obtained from sensors carried by individual agents still suffer from the issue of incomplete information [27]. Which is highly unfavorable for fields requiring high perception accuracy such as autonomous driving and intelligent ships. Multi-agent cooperative perception, on the other hand, provides a promising solution to this problem [28]. Correspondingly, multi-agent cooperative perception datasets serve as the foundation for enhancing cooperative perception performance. Currently, multi-agent cooperative perception datasets can be classified into two categories based on data sources: simulation-based datasets and real-world datasets.
Simulation-based multi-agent cooperative perception datasets are primarily the result of the lack of real-world cooperative datasets in the early stages, but the simulation sensor parameters and data collection scenes are based on real-world conditions. V2V-sim [9] was the earliest point cloud dataset proposed for vehicle cooperative perception, primarily based on data collection using the high-fidelity LiDARsim sensor. OPV2V [10] was then a dataset generated using the OpenCDA and CARLA simulator, which enhances the number of cooperatively communicating vehicles in the scenes. As an open benchmark dataset, OPV2V also provides a fusion framework for vehicle cooperative perception, facilitating the testing of various methods. V2XSet [11] and V2X-sim [12] further built upon V2V cooperation by introducing V2I cooperative scene simulations, increasing diversity of interactions. Additionally, CoPerception-UAVs [29] is a dataset of drone swarms simulated based on AirSim and CARLA mainly for cooperative 3D object-detection tasks using cameras only among drone swarms. While simulated datasets have driven progress in cooperative perception research, they have also facilitated the creation of more real-world collected datasets.
In terms of real-world datasets, V2V4Real [13] is the first large-scale V2V multimodal dataset collected in the real world. To capture cooperative data, two vehicles equipped with multimodal sensors conducted cooperative data collection in various scenes. This dataset enables three perception tasks: cooperative 3D object detection, cooperative 3D object tracking, and Sim2Real domain adaptation for cooperative perception. The DAIR-V2X [14] dataset, on the other hand, consists of actual data collected from a vehicle equipped with cameras and LiDAR, and facilities. The main collection scenes are predefined intersections for cooperative perception between vehicles and facilities. Real-world cooperative datasets can better reflect actual scenes, but they often require higher data collection costs. As a result, there are currently relatively few large-scale real-world cooperative perception datasets available.
In terms of ship cooperative perception datasets, there is currently a lack of large-scale application of LiDAR in the field of ship navigation, resulting in the absence of such datasets. Presently, the available datasets for ship navigation mainly focus on single-source data. Zhang et al. [16] developed a LiDAR simulator oriented towards ocean navigation scenes to generate point cloud data of autonomous navigation in marine environments. They constructed a point cloud dataset containing 7 categories of ships such as cargo ships and engineering ships. Zhang et al. [15] collected a joint point cloud and image dataset containing 3180 frames in open waters, with 3 different scenes, for marine object-detection tasks. Yao et al. [17] equipped a yacht with a 16-line LiDAR, a monocular camera, an IMU, and a real-time kinematic (RTK) positioning module, and collected point cloud data in Xuanwu Lake, Nanjing, China, which can be used for multi-object tracking tasks. The aforementioned research related to the collected data has to some extent facilitated the development of maritime object perception technology based on LiDAR. However, the aforementioned datasets are all single-source perception datasets and do not take into account the enhancement of ship perception performance through ship cooperation. Therefore, this paper will focus on the research and construction of ship cooperative perception datasets to fill this gap in the field.

2.2. Multi-Agent Cooperative Perception

Multi-agent cooperative perception is primarily focused on sharing and complementing perception information among multiple agents to overcome the limitations of individual agents caused by environmental disturbances and achieve a more comprehensive perception [30]. The current research in multi-agent cooperative perception technology is primarily divided into several domains, including cooperative perception for autonomous driving vehicles [31], cooperative perception for unmanned aerial vehicles [32], and cooperative perception for robots [33]. Among these domains, cooperative perception technology for autonomous driving vehicles has received the most attention and has been the closest to practical implementation.
Early fusion in the context of cooperative perception primarily involves the exchange and fusion of data between vehicles (or between vehicle and infrastructure) to obtain comprehensive scene data and enhance object perception accuracy. Cooper [34] was among the first to investigate the feasibility of cooperative perception using sparse point cloud data between vehicles. OPV2V [10] further defined the fusion content of early fusion and proposed an early fusion benchmark model. However, the real-time interaction of raw data between vehicles imposes high bandwidth requirements, thereby limiting the development of such methods. In contrast to early fusion, intermediate fusion achieves improved interaction efficiency and reduces redundant information transmission through feature-level fusion between vehicles [35,36,37,38]. As a result, intermediate fusion has become the mainstream approach for cooperative perception. V2X-ViT [11] introduces Vision Transformer into the feature fusion stage to capture the spatial relationships between each vehicle. When2com [39] and Where2comm [40] optimize the efficiency of intermediate fusion from the perspectives of interaction timing and interaction objects, respectively. Overall, the key to intermediate fusion lies in designing an appropriate fusion mechanism to efficiently integrate features transmitted by different vehicles or facilities.
In addition to the aforementioned two types of fusion methods, there is another approach known as late fusion, which involves combining the perception results of different vehicles as the fusion content [14,41]. Late fusion typically involves the transmission of perception results such as object position and object size, resulting in lower bandwidth requirements. However, a drawback of this approach is that each vehicle’s perception result may contain defects, which can lead to instability in the fusion of cooperative perception results.
In summary, current research and applications of multi-agent cooperative perception primarily focus on the field of vehicle cooperative perception, with intermediate fusion being the predominant approach. On the other hand, intelligent perception methods in the domain of ship navigation are still in their early stages. Therefore, it is highly significant to explore how to transfer the research on cooperative perception from the field of autonomous driving to the field of ship navigation.

3. S2S-Sim Dataset

To facilitate the development of ship cooperative perception research, S2S-sim, a large-scale point cloud-based ship-to-ship cooperative simulation dataset specifically designed for ship navigation, is proposed in this paper. The dataset is collected using Unity3D and primarily consists of three common ship navigation scenarios: ports, islands, and open waters. The scenes include various types of ships such as container ships, bulk carriers, and cruise ships. In this section, we will present the construction of the scenes (Section 3.1), sensor simulation and data collection (Section 3.2), and dataset analysis (Section 3.3) to provide a comprehensive overview of our simulation dataset construction efforts.

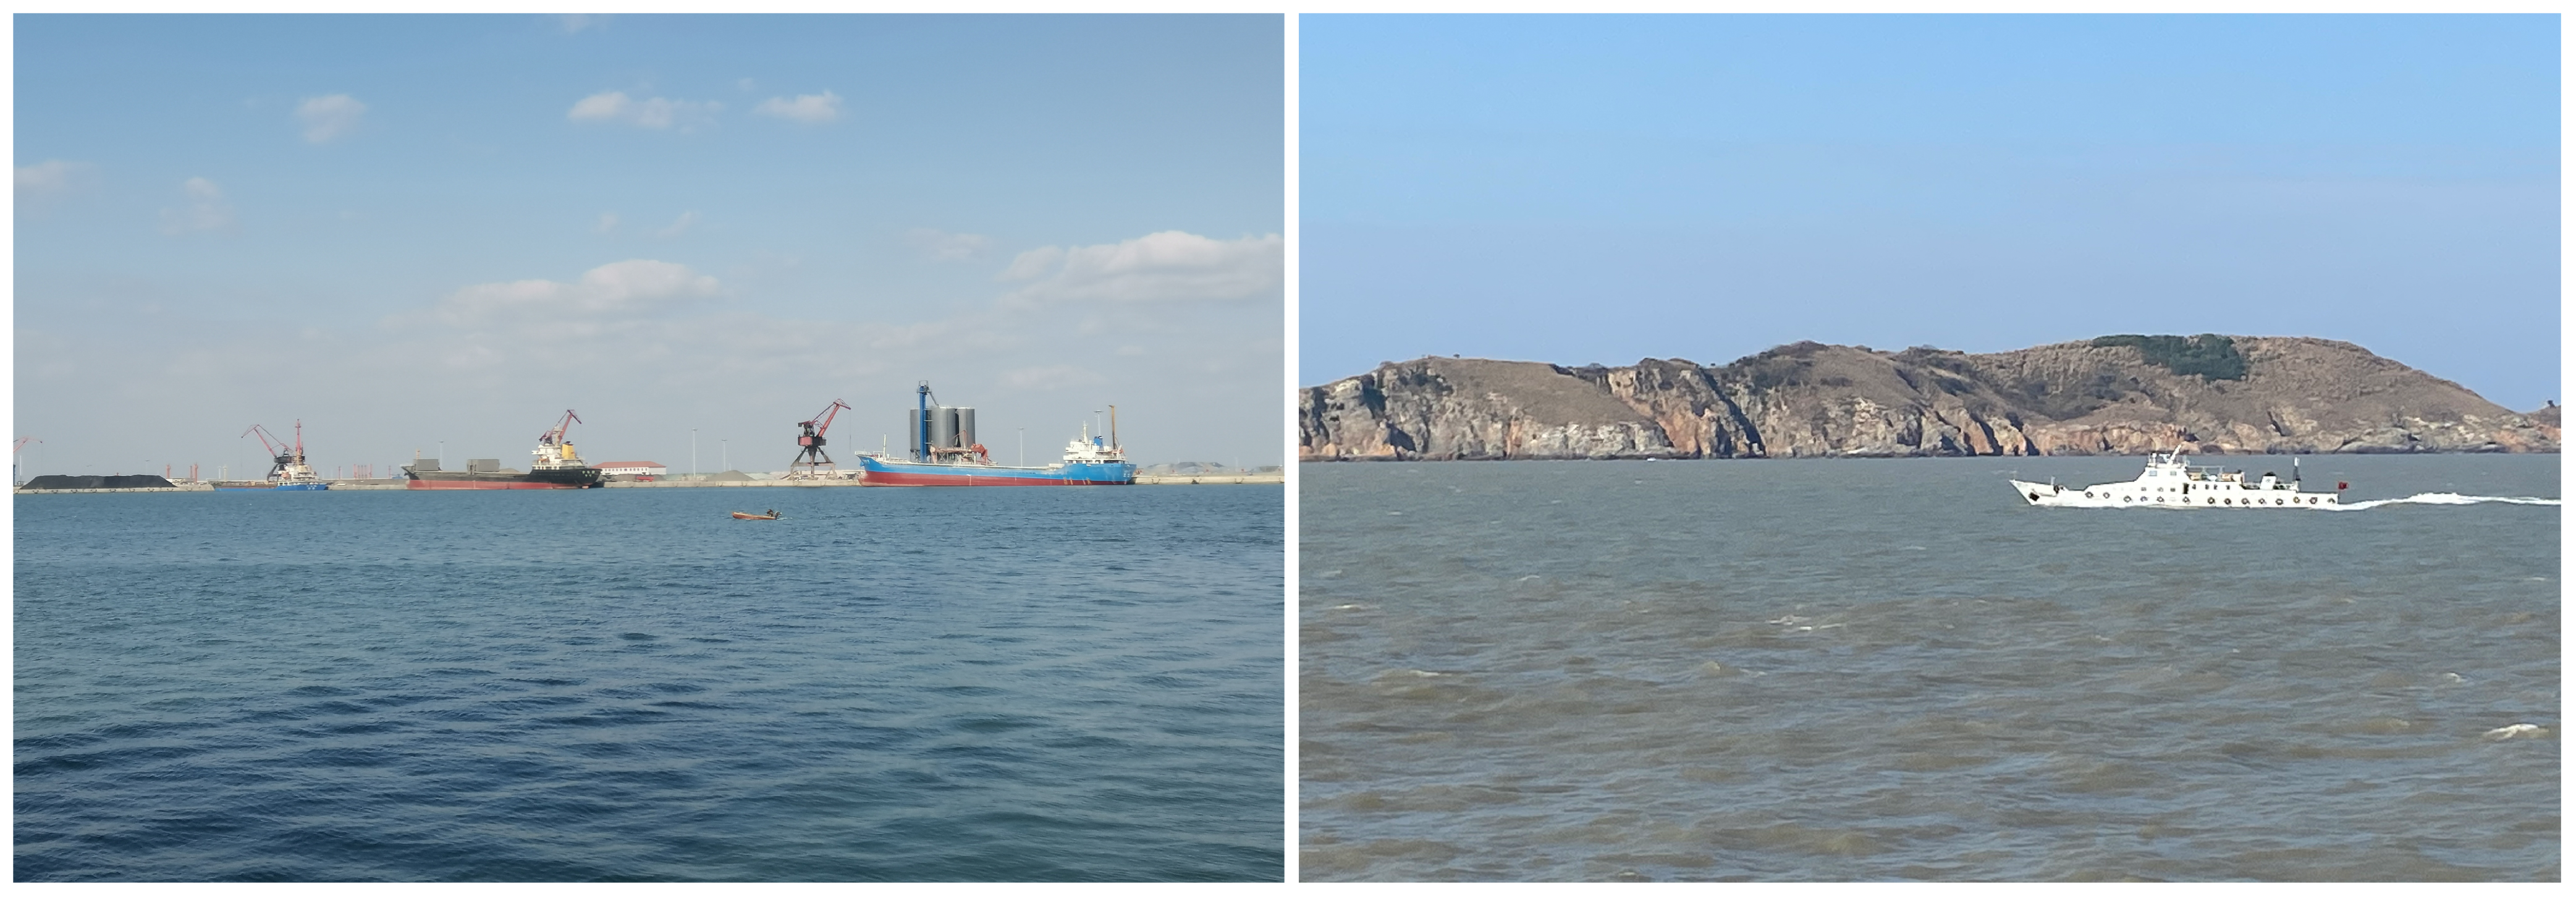
3.1. Construction of Ship Navigation Scenarios

The construction of scenarios serves as the foundation for simulating data collection. In order to achieve more realistic effects, the field of autonomous driving has made significant exploration in scenario construction. Initially, researchers directly relied on game scenes for data collection to reduce the time required for scene modeling. The vkitti dataset, on the other hand, utilized the Unity engine and a real-to-virtual cloning method to construct scenarios, thereby enriching the quantity of scenes. Datasets such as OPV2V and V2XSet were built on CARLA, a widely used simulator for development, training, and validation in autonomous driving, to create a digital city as the environment for cooperative perception data collection. The construction of these datasets’ scenes was primarily aimed at data collection services for autonomous driving. However, there is currently a lack of a publicly available maritime navigation scene specifically designed for data collection, which presents the first challenge in constructing a simulated dataset. To address this, we extensively drew upon the experience of constructing simulated data scenes in autonomous driving and, considering the freedom and richness of scene construction, decided to utilize Unity3D as the platform for scene construction.
As depicted in Figure 1, we initially referenced authentic ship navigation environments to establish three representative ship navigation scenarios: port scenes, island scenes, and open sea scenes. Subsequently, as illustrated in Figure 2, our simulated scenes were developed by considering ship categories, navigation attitudes, berthing attitudes, and occurrence frequencies observed in real environments. Moreover, the ship composition varied across different scenes. The ship categories primarily encompassed cruise ships, container ships, bulk carriers, warships and fishing ships. The navigation trajectories and speeds of each ship category were simulated to a certain extent to resemble real-world ship behavior.

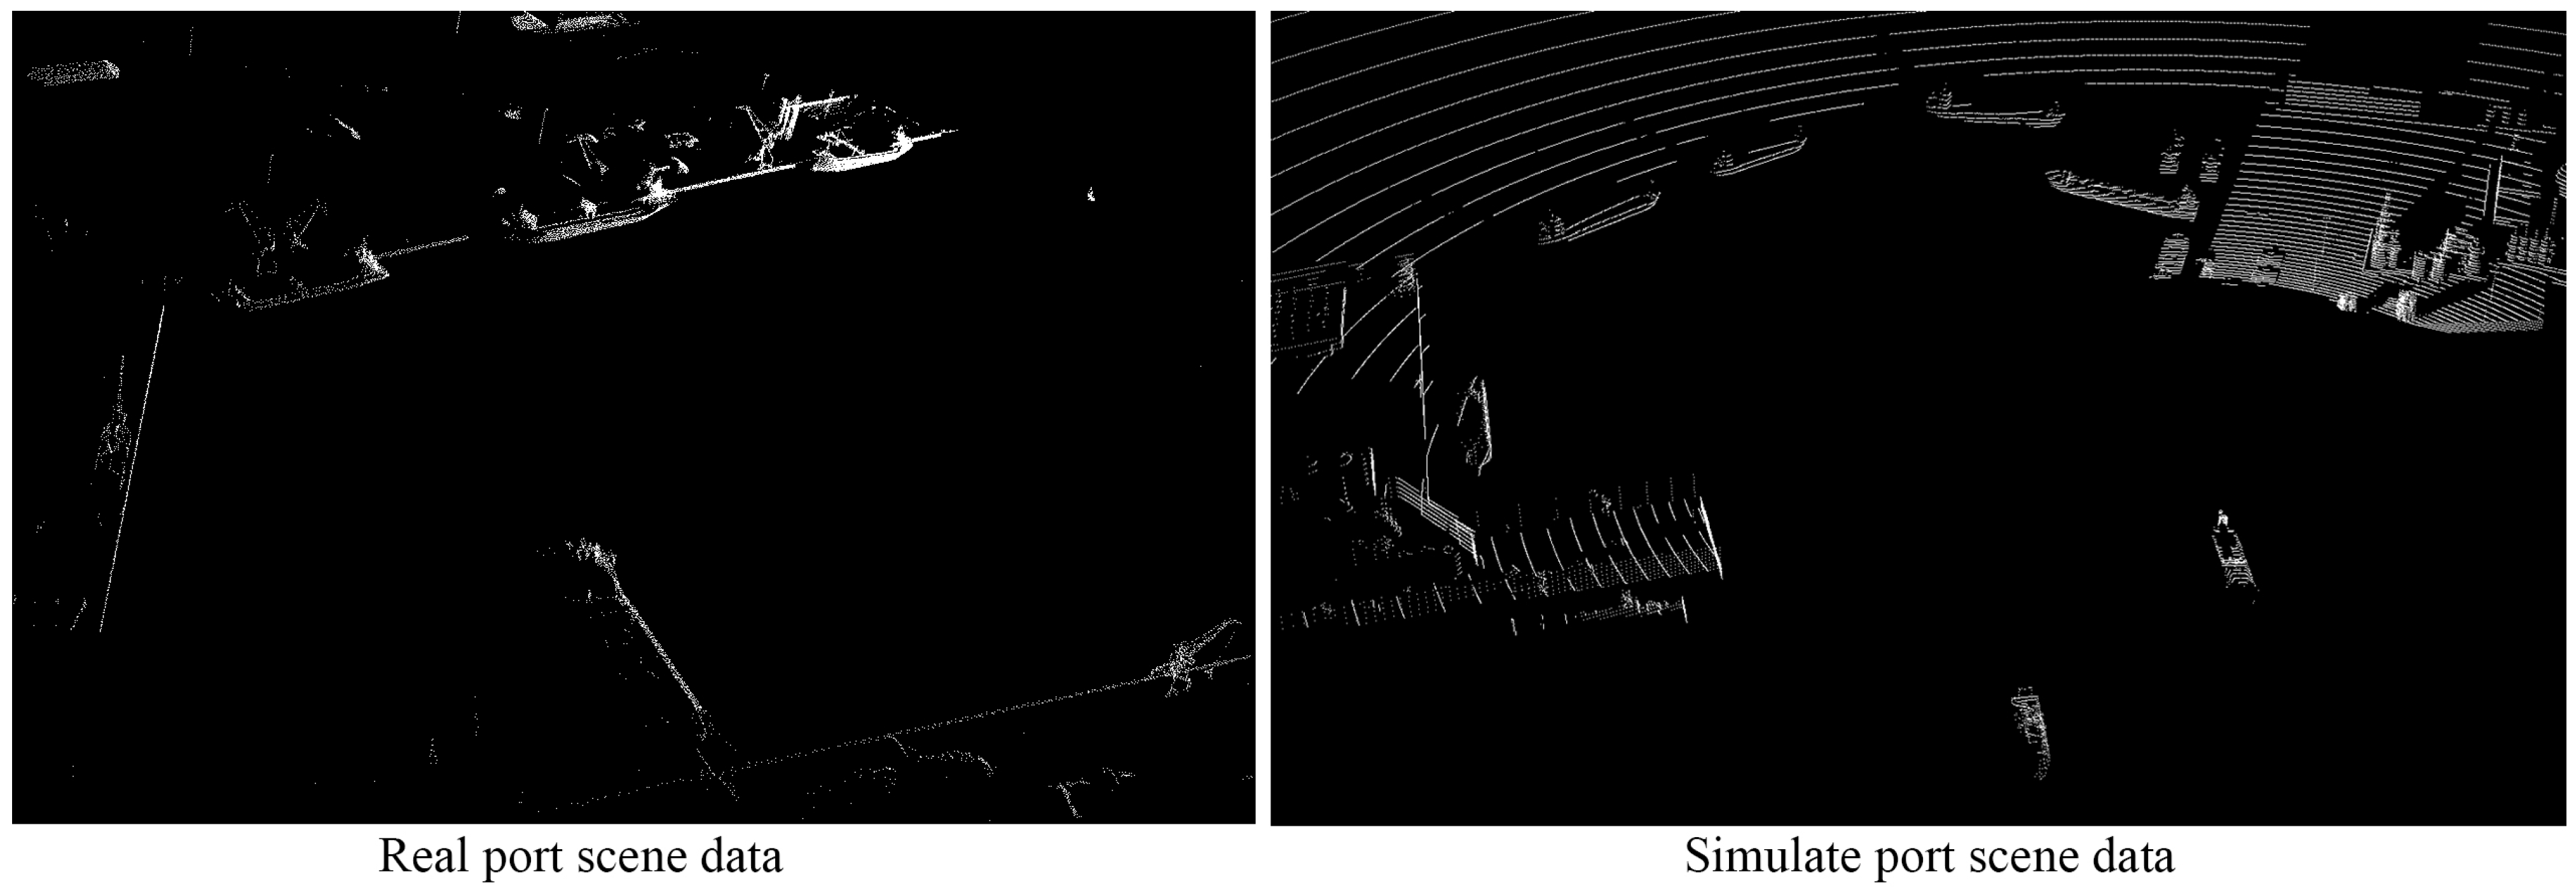
3.2. Sensor Simulation and Data Collection

The simulation of sensor effects has a significant impact on the weight of data collection. The design of the LiDAR as a core sensor used for ship cooperative perception is crucial. In the process of simulating the LiDAR, we primarily referred to a 128-line shipborne LiDAR developed by our cooperative institution. This LiDAR is deployed on ships and has an actual detection range of up to 2 nautical miles. The advantages of having a higher number of lines and a longer detection range are to enhance perception accuracy and range. However, this comes with increased data volume and a lower data acquisition frequency. The maximum data acquisition frequency of this LiDAR model is 2 Hz, which is lower compared to the conventional sampling frequency of 10 Hz for mainstream commercial vehicle-mounted LiDARs. The larger data volume and lower acquisition frequency are not conducive to real-time data transmission during ship cooperative processes, thereby affecting the accuracy of cooperative perception. Therefore, addressing how to ensure real-time cooperative perception while simulating the real LiDAR as faithfully as possible is another challenge we need to tackle.
Firstly, to simulate the data collection effect of a real LiDAR, we propose a ray-based detection method. Real mechanical LiDARs adopt a scanning approach to capture data from the entire scene in one revolution. We refer to the horizontal and vertical resolutions of a real LiDAR and set the rays emitted by the simulated LiDAR to detect object points. Additionally, considering that in cooperative perception, information between ships can be complemented through information interaction, we reduced the number of simulated LiDAR beams from 128 to 64 lines and the detection range to 2 km, while increasing the collection frequency to 10 Hz. This aims to reduce the amount of data collected by individual ships at single time instances, and improve the efficiency of cooperative data interaction and perception timeliness. Table 1 presents the parameters of the simulated LiDAR in comparison to the real LiDAR.
The ship cooperative dataset proposed in this study consists primarily of laser radar point cloud data, making the quality of the collected LiDAR data crucial for perception results. To obtain better data acquisition perspectives, we also took into full consideration the mounting ships and positions of the simulated LiDAR based on real-world scenarios. We selected three types of ships, namely bulk carriers, cruise ships, and container ships, as carriers for the LiDAR. They were mounted at high points on the ship’s mast to achieve better data acquisition results. Based on the characteristics of ports and islands, we designed 28 navigation segments, including ship entry and exit from ports, navigation along islands and reefs, and ship encounters in open waters. A total of 7000 frames of ship cooperative data were collected and filtered at different time intervals. The dataset was divided into a training set (5000 frames), a validation set (1000 frames), and a test set (1000 frames). Figure 3 shows a comparison sample between the actual port collection data and the simulated data presented in this paper. It can be seen that compared to the real data, the point density of the simulated data is sparser, as described earlier, because we reduced the number of lines.

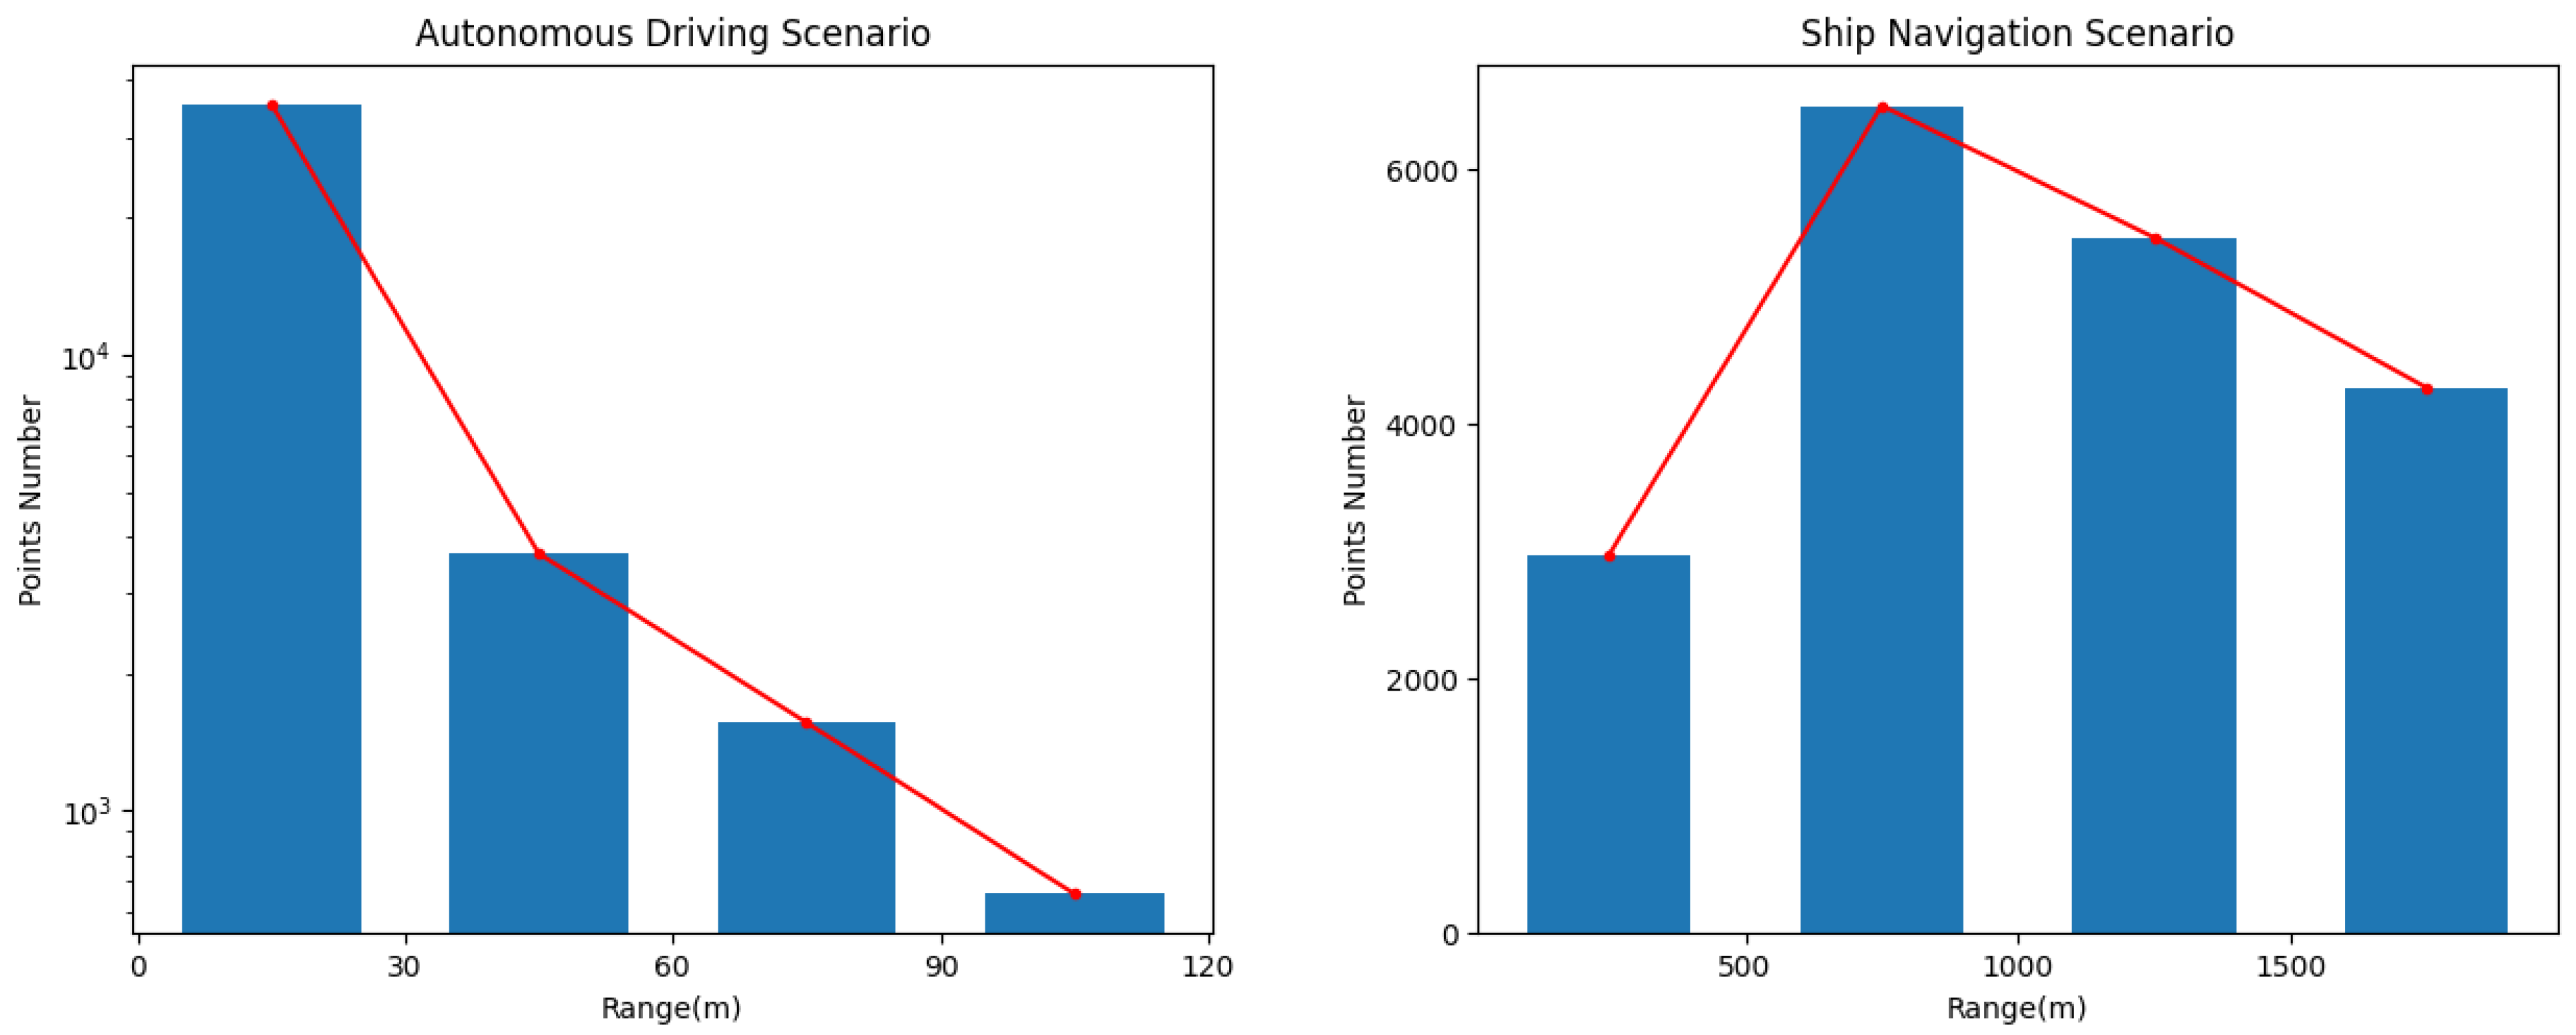
3.3. Dataset Analysis

The overall analysis information of the dataset is presented in Table 2. Our dataset covers three typical navigation scenarios: ports, islands, and open waters. Based on the complexity and frequency of occurrence of different navigation scenarios, we adjusted the data proportions for each scenario to make the research on ship cooperative 3D object detection more suitable for real-world navigation scenarios. To reduce data redundancy, we fixed the number of frames for each segment at 250 frames, with a maximum of 5 collaborating ships. Furthermore, from Table 2, it can be observed that the ship cooperative dataset has a lower ship density within the perception range compared to autonomous driving datasets. This is due to the characteristics of ship navigation, which require maintaining a greater safe encounter distance between ships.
The quality of dataset annotation is one of the main factors influencing the performance of perception algorithms. The task addressed in this paper primarily focuses on ship cooperative 3D object detection. Therefore, the annotation fields in the dataset mainly include the coordinates (x, y, z) of the objects, their dimensions (length, width, height), and the real-time pose angles (x-axis, y-axis, z-axis) of the objects. Prior to data collection, we had prior knowledge of the 3D information of various ship models and recorded the real-time pose information of the ships during data collection. As a result, our dataset was annotated in real-time with accuracy during the data collection process. A total of 28 navigation segments consisting of 7000 frames of point cloud data were collected, and a total of 96,881 ship annotations were made. Based on the annotation information, we conducted statistical analysis of the length, width, and height of ships in the overall point cloud data and compared them with the actual length, width, and height data of ships collected during real navigation, as shown in Figure 4. From the Figure 4, it can be observed that there are certain differences in the distribution of the length, width, and height of ships between the simulated collected data and the real data. This discrepancy is primarily due to the limited sample size of the actual collected data (463 frames). However, the simulated navigation data can compensate for this limitation and enhance the diversity of scenes and objects. In conclusion, the S2S-sim dataset proposed in this paper can provide a reference data support for research on ship cooperative perception.

4. Task and Pipeline

Real-time and accurate perception of navigation scenarios is crucial for safe ship navigation. Currently, ship navigation relies on systems such as GPS and AIS, which provide unstable external perception results. Although some exploratory research has equipped ships with advanced sensing devices such as LiDAR, the ship’s self-perception mainly relies on radar and human observation, providing only rough perception results and posing certain safety risks. In the field of autonomous driving, the use of LiDAR combined with vehicle cooperative perception technology allows vehicles to rely less on high-precision maps and provides precise perception results of the surrounding environment for autonomous vehicles. 3D object detection is a typical task in vehicle cooperative perception. Therefore, taking this as a reference, we set the research task in this paper as ship cooperative 3D object detection.

4.1. Ship Cooperative 3D Object Detection

As mentioned earlier, the Ship Cooperative 3D Object Detection (SC3D) studied in this paper is analogous to the Vehicle Cooperative 3D Object Detection (VC3D). The objective of this task is to investigate the effectiveness of ship cooperative perception in enhancing the perception capabilities of individual ships. However, there are significant differences between SC3D and VC3D, beyond scene variations. These differences encompass the required perception range for ships, data density and distribution in ship-collected data, and scene complexity, among others. Therefore, before introducing the pipeline, it is necessary to provide a definition of the SC3D task in this paper.

4.1.1. Ship Perception Range and Configuration

Firstly, considering that ship navigation requires a certain safe encounter distance, a large perception range is needed. We refer to the detection range of actual shipborne LiDAR and set the individual ship’s perception range as a rectangular region [−2048 m, −2048 m, −60 m, 2048 m, 2048 m, 60 m] during training and testing. Considering the need to maintain a certain safe distance during ship navigation, we set the communication range to 1 km. Additionally, considering that current shipborne LiDAR devices are relatively large, we only mount LiDAR on three types of large ships, namely bulk carriers, container ships, and cruise ships, during simulated data collection. Furthermore, we fix the number of collaborating ships for perception in the scene to 5.

4.1.2. Input, Output, and Ground Truth

The SC3D task, similar to the VC3D task, takes as input the perception data acquired by each ship at a specific moment. For the dataset proposed in this paper, this corresponds to the LiDAR point cloud data. During the task, the ego ship only communicates and exchanges information with the connected ships (co-ships) within its communication range, while ignoring the information from co-ships outside this range. The transmitted information can include data, features, and detection results, depending on the fusion methods mentioned in the related work. The output is the detection results of the objects within the perception range of the ego ship. It is worth noting that during data annotation, we annotated each ship object within the perception range of every co-ship. This means that for the same ship in the scene, there can be multiple annotations. However, this does not affect the training of the cooperative detection model, as we ultimately base our testing on the Ground Truth annotated using the ego ship’s data.

4.1.3. Evaluation Metrics

Similar to VC3D task, this paper evaluates the performance of cooperative perception models for the SC3D task using the average precision of 3D objects (AP40) at different IoU thresholds. However, considering that ship cooperative perception scenarios have sparser object data and higher detection difficulty, we also include the detection performance at an additional IoU threshold of 0.3, in addition to the conventional IoU thresholds of 0.7 and 0.5.

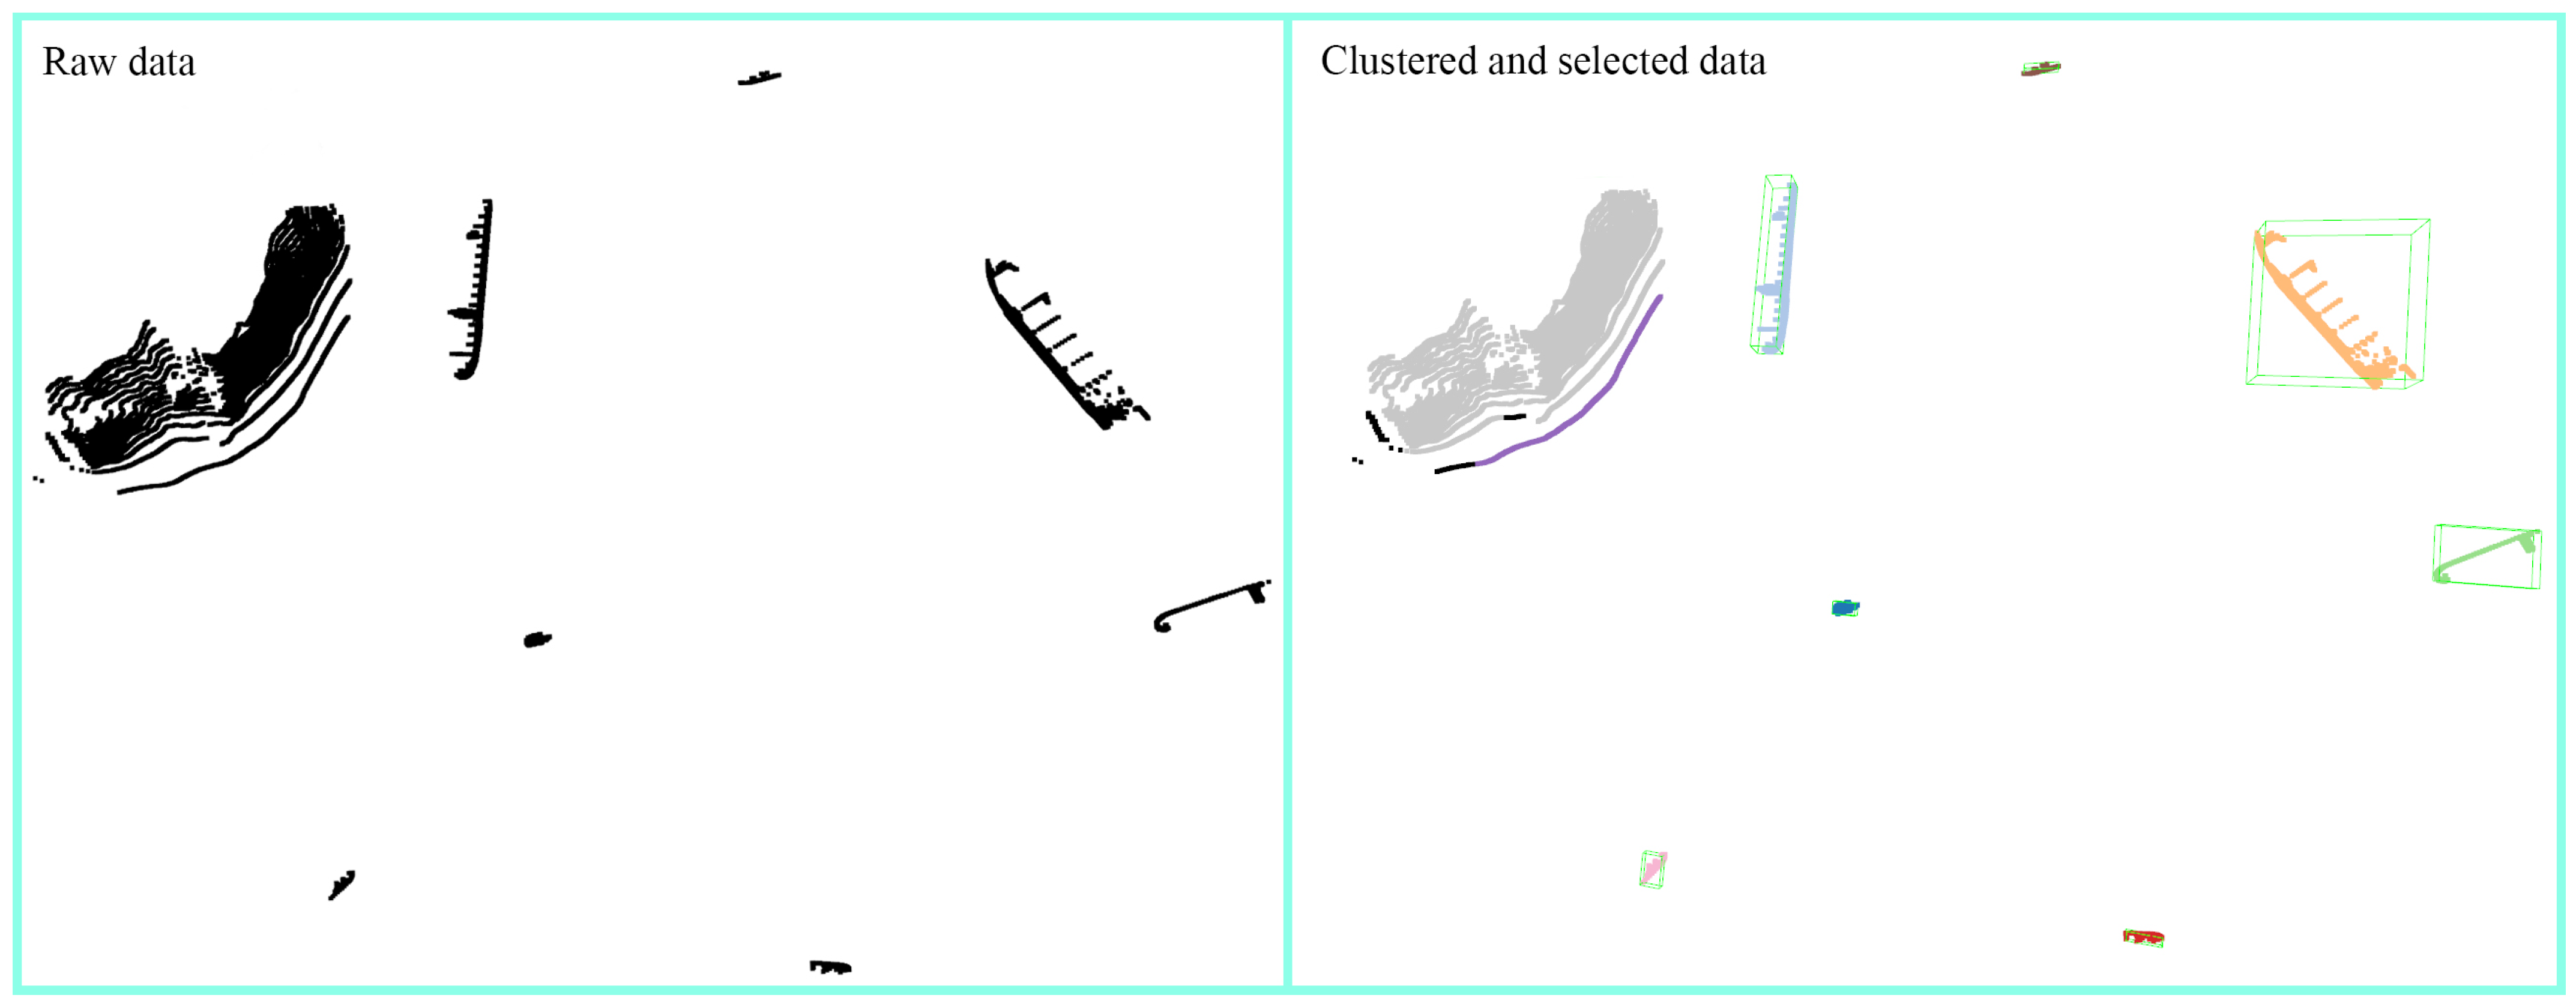
4.2. Regional Clustering Fusion

4.2.1. Motivation

As the SC3D task is introduced for the first time, it is natural to consider referring to the VC3D task. As described in Section 2, the current VC3D methods are mainly categorized into early fusion, intermediate fusion, and late fusion. We selected representative methods from these categories to conduct experiments on the S2S-sim dataset (see Section 5 for specific experimental settings). The results are presented in Table 3, which indicates that among the baseline methods, early fusion achieves the best detection performance. However, the intermediate fusion methods that perform well in the VC3D task did not exhibit satisfactory detection performance in the SC3D task. This prompted us to analyze the underlying reasons for this discrepancy.
To this end, we first analyzed the point cloud distribution at different distances in both autonomous driving and ship navigation scenarios using the OPV2V and S2S-sim datasets, as shown in Figure 5. It can be observed that in the context of autonomous driving, the collected laser points are concentrated within a radius range of 0–30 m, and the quantity decreases rapidly with increasing distance. However, the collected data in the ship navigation scenario exhibits different characteristics. The laser points within the closest radius range of 0–500 m are relatively sparse, while the highest number of points is found within the radius range of 500–1000 m. Subsequently, the number of points gradually decreases with increasing distance. The causes of this phenomenon are twofold. On the one hand, it is related to the characteristics of ship navigation, as ships need to maintain a safe encounter distance, resulting in objects appearing at relatively far positions. On the other hand, the scarcity of points at close distances is due to the water surface absorbing the laser beams emitted by the LiDAR sensor (for the current object detection LiDAR), resulting in no laser points being returned, while the ground reflects the laser beams as expected.
Different data distributions have minimal impact on early fusion, as the fusion at the data level does not affect the performance of the detector internally. However, large-scale data fusion imposes certain pressures on the communication bandwidth between ships. For various intermediate fusion methods, fusion occurs within the detector, and the feature fusion module is designed for specific scenes. Therefore, when significant changes occur in the data distribution, the detector’s performance is affected to varying degrees. In conclusion, we have decided to continue our research based on early fusion. The key question now is how to effectively reduce data transmission between ships while improving the performance of 3D object detection in ship navigation scenarios.

4.2.2. Method

As mentioned earlier, there is a difference between ship navigation and autonomous driving scenarios in that the water surface absorbs laser points while the ground reflects them. Therefore, in autonomous driving scenarios, we observe a continuity between object points and background points, whereas in shipborne LiDAR, the detected objects and background are relatively independent. Exploiting this characteristic, we propose a regional clustering fusion-based ship cooperative 3D object-detection method. The method aims to reduce data transmission redundancy and enhance the detection of object objects by first separating foreground object regions and then requesting foreground object data only from co-ships within the communication range.
The overall network framework is depicted in Figure 6. Our ship cooperative 3D object-detection method adopts an early fusion strategy and consists of two main modules: regional clustering fusion and feature extraction and detection. In the regional clustering fusion module, considering the characteristics of ship navigation data, we first partition the scene into regions and employ clustering algorithms to aggregate points into clusters. Subsequently, we perform an initial point selection for object regions based on a threshold and generate axis-aligned 3D bounding boxes. Finally, we request data within the bounding boxes only from ships within the communication range. This approach significantly reduces the redundancy issue in early fusion data, achieving efficient and selective data fusion and providing more effective data for the feature extraction and detection module. We will elaborate on this process in the following sections. In the feature extraction and detection module, we initially extract pillar features using a 3D backbone. Then, we employ 2D convolutional operations to acquire high-dimensional abstract features. Finally, classification and regression are performed using detection heads to obtain the 3D object-detection results.
The core of our 3D object-detection method lies in the regional clustering fusion module. As discussed earlier, the key characteristic of navigation point cloud data is that different foreground objects or backgrounds are relatively independent. As illustrated on the left side of Figure 7, taking the island scene data from the S2S-sim dataset as an example, it can be observed that there are no continuous point clouds between the island regions and different ships, while the points within each ship are relatively concentrated. Therefore, we employ a point cloud clustering algorithm to preliminarily separate the foreground objects and background islands within the scene. To improve clustering efficiency, prior to this step, we first partition the data P e s of the ego ship into n blocks by dividing it into regions.
P e s = P e s 1 , , P e s n , n = 4 ,
where n is a hyper parameter that can be adjusted according to the size of the scene, we set n = 4 as the default value. Clustering operations are simultaneously performed on each of the regions.
In the selection of clustering algorithms, we chose the DBSCAN (Density-Based Spatial Clustering of Applications with Noise) algorithm for the clustering operations in this study. This choice was primarily based on DBSCAN’s advantages over other clustering algorithms, as it does not require a predetermined number of clusters and exhibits higher time and space efficiency. In the DBSCAN algorithm, we need to preset the neighborhood radius R of points (in this paper, referring to the point resolution of LiDAR, R is set to 20) and the minimum number of neighborhood points M i n P t s (in this paper, MinPts is set to 30). For each point p P e s i in the data P e s i divided in the previous step, its neighborhood points are first found within the radius of:
N ( p ) = q P e s i | d i s t ( p , q ) R .
Then, we examine the number of neighboring points N ( p ) . If | N ( p ) | < M i n P t s , then point p is labeled as a noise point. Conversely, if | N ( p ) | M i n P t s , a new cluster is created with p as the core point. Recursively, points from N ( p ) are added to this cluster until no new core points can be found, indicating the completion of one clustering iteration. The process continues to iterate over the remaining points until all points are labeled, completing the clustering process. Return the final clustering set C.
C = ( p , l a b e l ( p ) ) | p P e s , l a b e l ( p ) ( 1 , 2 , , K ) ,
l a b e l ( p ) represents the cluster label, and K is the number of point clusters in the clustering. As shown on the right side in Figure 7, after clustering, both the foreground objects and background in the scene data obtained by the ego ship are partitioned into different colored point clusters. This includes individual ships as well as the island in the top left corner of the scene.
After completing the clustering process, the next step is to filter and select the data regions that require fusion. It is evident that we need to exclude irrelevant areas such as ports and islands, which may contain a large number of points. Instead, we only request foreground object region data from co-ships. To achieve this, we first calculate the axis-aligned bounding boxes (AABBs) for each point cluster c i . These AABBs store the center point ( x , y , z ) and the three-dimensional dimensions ( l , w , h ) of the detection boxes,
B B o x ( c i ) = ( x , y , z , l , w , h ) .
The reason for choosing AABB (Axis-Aligned Bounding Box) instead of MBR (Minimum Bounding Box) or OBB (Oriented Bounding Box) is to facilitate co-ships in selecting region data for transmission to the ego ship more conveniently. Additionally, considering that conventional large ships, such as bulk carriers and container ships, have lengths not exceeding 400 m, the longest object covered by the AABB box is equal to the length of the horizontal diagonal,
D ( c i ) = l 2 + w 2 .
Therefore, we set a threshold T = 400 m for the length of the horizontal diagonal of the detection boxes. We filter the detection boxes accordingly to obtain the final set of requested data regions, denoted as RDR:
R D R = R D R B B o x ( c i ) | c i C , D ( c i ) T ,
By employing this strategy, it is possible to achieve the preservation of foreground objects and the filtering of the background. The final result is depicted on the right side of Figure 7, where the majority of the objects within the green bounding boxes are ships, representing the data that the ego ship needs to request for fusion from co-ships. The data collected by co-ships within the communication range at the same time is denoted as P m c s .
P m c s = P c s 1 , P c s 2 , , P c s n , n 5 .
Thus, the requested data P r q can be represented as:
P r q = P m c s ( R D R ) .
Based on the previous steps, the final fused data P o u t can be expressed as:
P o u t = P e s P r q .
In summary, the specific algorithmic workflow of the regional clustering fusion module is illustrated in Algorithm 1.
Since data fusion occupies a portion of the 3D object-detection time, in order to enhance real-time detection, it is necessary to design a lightweight detector. For the specific architecture design of the 3D detector, this paper selects PointPillars [42] as the lightweight backbone network. There are two main reasons that led us to make this choice. Firstly, we believe that through data fusion, which can be viewed as data augmentation, the stability of detection can be ensured. Secondly, by partitioning the fused data into specialized voxels, namely pillars, and then performing 2D convolution, the computationally expensive 3D convolution operation can be avoided, thereby improving detection speed.
Algorithm 1 Regional Clustering Fusion
  1:
input: P e s , P m c s , R, T e a v , T.
  2:
output: fused data P o u t .
  3:
P e s = P e s 1 , , P e s n , n = 4 ;
  4:
for  P e s i in P e s  do
  5:
    for p in P e s i  do
  6:
         N ( p ) = q P e s i | d i s t ( p , q ) R ;
  7:
         c i = c i q | q N ( p ) , u n v i s i t e d ( q ) , | N ( p ) | M i n P t s ;
  8:
         B B o x ( c i ) = ( x , y , z , l , w , h ) ;
  9:
         D ( c i ) = l 2 + w 2 ;
10:
         R D R = R D R B B o x ( c i ) | c i C , D ( c i ) T ;
11:
    end for
12:
end for
13:
P r q = P m c s ( R D R ) ;
14:
return  P o u t = P e s P r q

5. Results and Experimental Discussion

In this section, we will present the transfer performance of the state-of-the-art VC3D methods on the S2S-sim dataset. We will also analyze the suitability of our proposed regional clustering fusion method for the SC3D task through comparative experiments.

5.1. Benchmark Models

Firstly, for VC3D tasks, it takes time for information transmission between multiple vehicles, so higher speed is required for the basic 3D object detector during the detection stage. Therefore, a single-stage detector is generally adopted, and PointPillars [42] is the most commonly used in VC3D tasks. This paper will adopt this design as the benchmark model. Secondly, as mentioned earlier, VC3D tasks can be divided into three cooperative methods according to the fusion strategy: early fusion, intermediate fusion (IM fusion), and late fusion. After selecting the basic 3D object detector, the three basic cooperative methods do not require complex designs. Therefore, we use the models trained with the three basic cooperative methods as the benchmark models to test the S2S-sim dataset in this paper. In addition, since we are the first to propose the SV3D task, there is a lack of comparative models. Therefore, we select mainstream high-performance vehicle cooperative 3D detection methods such as Fcooper, V2X-ViT, and Where2comm from the current cooperative 3D detection methods. We transfer them to the ship cooperative scenario and train models to evaluate their performance on the SC3D task.

5.2. Experiment Details

The training set, validation set, and test set are divided into 5000, 1000, and 1000 frames, respectively. The test set consists of three typical navigation scenarios: ports, islands, and open waters. During training, all methods are set with a batch size of 2. Since ships have a larger perception range ([−2048 m, −2048 m, −60 m, 2040 m, 2048 m, 60 m]), we set the voxel size to [8 m, 8 m, 120 m]. Our method employs the widely used Adam optimizer with an initial learning rate of 0.002. The learning rate changes at the 10th and 15th epochs, with a decay factor of 0.1. The total training duration is 30 epochs. The selected cooperative methods for different vehicles are trained based on their respective papers and default settings in the code. All training processes are conducted on a single RTX 4090.

5.3. Performance and Analysis

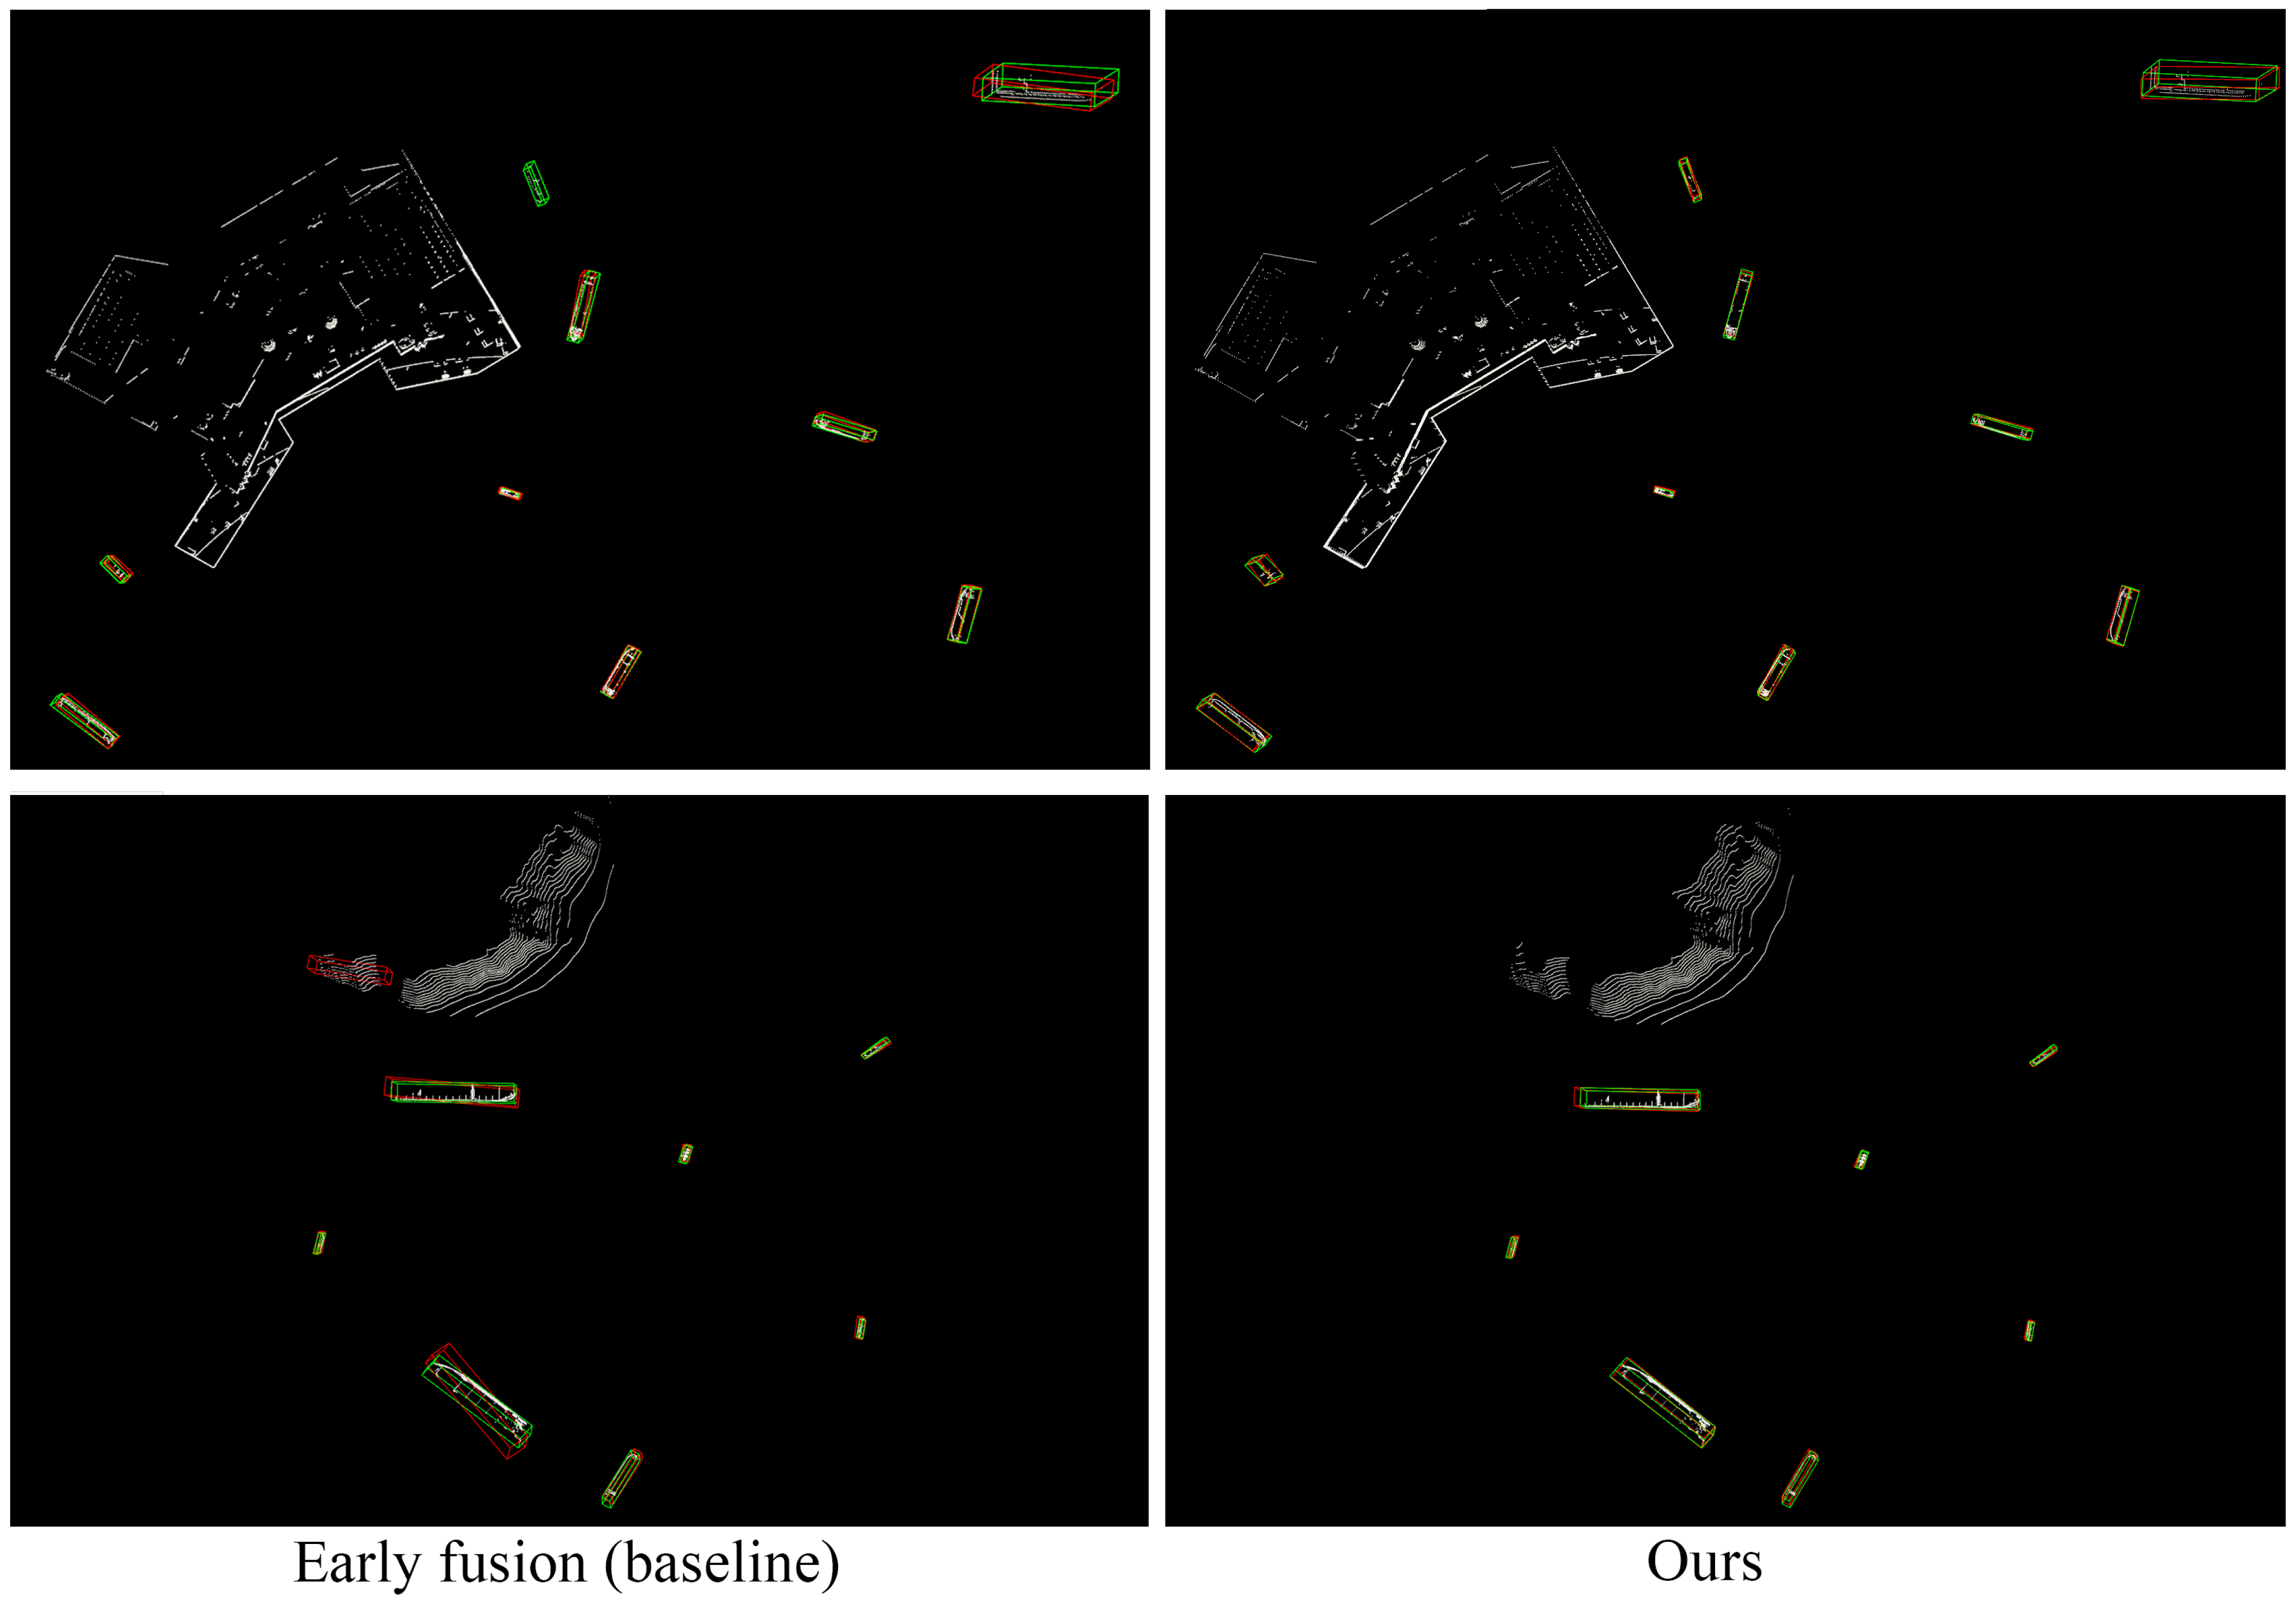
5.3.1. Overall Performance

Table 3 presents the detection results of the vehicle cooperative transfer methods and our proposed method on the S2S-sim dataset. Generally, due to the larger perceptual scope in maritime environments, the difficulty and uncertainty of cooperation are substantially increased. However, our method achieves the best detection performance at IoU = 0.7/0.5/0.3 thresholds. Notably, at the most challenging IoU = 0.7 threshold, only our method achieves detection results exceeding 50%. Figure 8 illustrates a comparison of 3D object-detection results between our proposed method and the early fusion baseline method on the S2S-sim dataset. The result images provide a visual demonstration that our proposed method effectively reduces instances of missed detections and false detections in scenes such as ports and islands, as compared to the baseline method.
Table 3. 3D detection performance comparison on S2S-sim.
MethodFusion Strategy3D Object Detection AP@IoU
0.70.50.3
No fusionNo24.8651.9659.75
Early fusionEarly37.9670.5778.95
IM fusionIntermediate30.3267.2077.64
Late fusionLate26.1761.9973.81
Fcooper [35]Intermediate43.6173.0980.82
Cobevt [37]Intermediate24.9856.6174.49
Where2comm [40]Intermediate25.2265.5777.38
V2xvit [11]Intermediate29.6757.3567.15
Coalign [36]Intermediate39.1163.8778.27
OursEarly51.0975.2982.14
Among the benchmark models, the early fusion method achieves the optimal detection outcomes, primarily attributable to its data-driven fusion strategy. Additionally, we observe that several intermediate fusion methods exhibiting strong performance in autonomous driving scenarios exhibit significant variability in performance on the S2S-sim dataset. This discrepancy is mainly attributed to the substantial differences in data distribution across diverse scenes. It also indicates that feature-based fusion approaches are influenced by data distribution and may hinder method transferability.

5.3.2. Performance with Different Perception Ranges

Due to the need to maintain a certain distance between ships, we set perception radii of 1 km, 1.5 km, and 2 km to test the 3D object-detection performance of different cooperative perception methods, as shown in Table 4. The results presented in Table 4 are intriguing. For early fusion methods based on data fusion and non-fusion methods, a smaller perception radius corresponds to better detection performance. Notably, our method, as an early fusion approach, achieves the optimal detection performance across different perception radii. This observation aligns with our common knowledge, as a closer distance implies denser distribution of object points, making it easier to extract features and obtain better detection results.
However, for intermediate fusion, counterintuitive detection results have emerged. The smaller the perception radius, the worse the detection performance. We believe that this is closely related to the feature fusion module designed for intermediate fusion. The methods transferred from VC3D tasks mainly consider the fusion of different vehicle perception features. However, as we have analyzed earlier, there are differences in data distribution between autonomous driving and ship navigation scenarios, resulting in differences in features. This indicates that the feature fusion module designed for VC3D is not suitable for SC3D tasks and instead becomes disruptive.
The late fusion benchmark models have also achieved counterintuitive detection results, which we attribute to interference from the detection results of co-ships. In summary, data fusion is applicable to different scenario tasks with minimal interference. However, it is challenging to achieve compatibility across different scenarios when it comes to feature and result fusion. Our proposed method, based on regional clustering fusion, serves as a data fusion method and can serve as a fundamental approach for ship cooperation. Improvements at the feature level can further enhance the performance of SC3D.

5.3.3. Collaborative Efficiency Analysis

As an early fusion method, the improvement in collaborative efficiency in this study primarily manifests in the amount of requested data. Table 5 presents a comparison of the requested data volume from the ego ship to co-ships within the communication range under different perception radii. Compared to the early fusion baseline method, the regional clustering fusion-based ship collaborative perception method proposed in this paper, significantly reduces the requested data volume. Moreover, this effect becomes more pronounced as the perception range increases. When the ego ship’s perception radius is 2 km, the requested data volume is reduced by 46% compared to the baseline method. This is highly beneficial in maritime navigation environments with unstable communication conditions. Simultaneously, due to the ability of regional clustering fusion to selectively enhance object data, our method maintains superior object-detection performance. Furthermore, our proposed method exhibits less degradation in detection performance compared to the baseline as the distance increases, indicating that our method has better robustness.

6. Conclusions and Future Work

Regarding the lack of dataset problem in current ship cooperative perception research, S2S-sim, a large-scale point cloud-based ship-to-ship cooperative simulation dataset specifically designed for ship navigation, is proposed in this paper. Developed using the Unity3D engine, the S2S-sim dataset simulates common real-world ship navigation scenarios such as ports and islands. Moreover, it simulates the physical characteristics of a real shipborne LiDAR sensor. The simulated ship cooperative data in S2S-sim conforms to the distribution of real-world data, providing a solid foundation for studying ship cooperative 3D object-detection tasks. Additionally, to address the issue that current multi-agent cooperative 3D object-detection methods are unsuitable for ship cooperative perception tasks, a regional clustering fusion-based ship cooperative 3D object-detection method is proposed. This method fully leverages the characteristics of maritime point cloud data by extracting key regions of the main ship through clustering. It only requests fusion of key region data from co-ships. This approach enhances data fusion efficiency while selectively strengthening the object data to be detected. Our method achieves the best performance on the S2S-sim dataset, indicating that our proposed method is better suited for ship cooperative 3D object detection.
Although we have constructed the first ship cooperative perception dataset and proposed a method suitable for ship cooperative 3D object detection, there is still room for improvement. In terms of the dataset, the data collected from cooperative ships in our dataset are assumed to be collected at the same moment, without considering the potential temporal deviations among data collected by different ships. Although these deviations are very short, it indicates that there is still room for improvement in our dataset. We will address this issue in future versions to enhance the dataset quality. Additionally, the dataset constructed in this paper does not include data under complex weather conditions such as rain and fog. In future versions, we will attempt to incorporate such data and discuss its impact on the results. Regarding the ship cooperative detection method, our proposed method focuses primarily on optimizing the data fusion aspect, while limited attention has been given to the design of the feature extraction module. We believe that making improvements in the feature layer to adapt to ship cooperative data can further enhance the accuracy of ship cooperative 3D object detection. We will investigate this aspect in our future work.

Author Contributions

Conceptualization, W.Y. and X.L.; methodology, W.Y. and X.W.; software, W.Y.; validation, W.Y. and X.W.; formal analysis, W.Y.; investigation, W.Y.; resources, X.L.; data curation, W.Y. and J.C.; writing—original draft preparation, W.Y.; writing—review and editing, X.W.; visualization, W.Y.; supervision, S.X.; project administration, X.L.; funding acquisition, S.X. All authors have read and agreed to the published version of the manuscript.

Funding

The research reported in this paper was supported by the National Natural Science Foundation of China under grant No. 61991415, the Development Project of Ship Situational Intelligent Awareness System under grant MC-201920-X01, the National Natural Science Foundation of China under Grant No. 72204155, and the Natural Science Foundation of Shanghai under Grant No. 23ZR1423100.

Institutional Review Board Statement

Written informed consent for publication of this paper was obtained from Shanghai University and all authors.

Data Availability Statement

The dataset proposed in this study are openly available at https://github.com/yb2019/S2S-sim.

Conflicts of Interest

The authors declare no conflicts of interest.

References

  1. Han, Y.; Zhang, H.; Li, H.; Jin, Y.; Lang, C.; Li, Y. Collaborative perception in autonomous driving: Methods, datasets and challenges. IEEE Intell. Transp. Syst. Mag. 2023, 15, 131–151. [Google Scholar] [CrossRef]
  2. Sun, X.; Song, S.; Miao, Z.; Tang, P.; Ai, L. LiDAR Point Clouds Semantic Segmentation in Autonomous Driving Based on Asymmetrical Convolution. Electronics 2023, 12, 4926. [Google Scholar] [CrossRef]
  3. Yang, W.; Sheng, S.; Luo, X.; Xie, S. Geometric relation based point clouds classification and segmentation. Concurr. Comput. Pract. Exp. 2022, 34, e6845. [Google Scholar] [CrossRef]
  4. Geiger, A.; Lenz, P.; Urtasun, R. Are we ready for autonomous driving? The kitti vision benchmark suite. In Proceedings of the 2012 IEEE Conference on Computer Vision and Pattern Recognition, Providence, RI, USA, 16–21 June 2012; IEEE: Piscataway, NJ, USA, 2012; pp. 3354–3361. [Google Scholar]
  5. Sun, P.; Kretzschmar, H.; Dotiwalla, X.; Chouard, A.; Patnaik, V.; Tsui, P.; Guo, J.; Zhou, Y.; Chai, Y.; Caine, B.; et al. Scalability in perception for autonomous driving: Waymo open dataset. In Proceedings of the IEEE/CVF Conference on Computer Vision and Pattern Recognition, Seattle, WA, USA, 13–19 June 2020; pp. 2446–2454. [Google Scholar]
  6. Caesar, H.; Bankiti, V.; Lang, A.H.; Vora, S.; Liong, V.E.; Xu, Q.; Krishnan, A.; Pan, Y.; Baldan, G.; Beijbom, O. nuscenes: A multimodal dataset for autonomous driving. In Proceedings of the IEEE/CVF Conference on Computer Vision and Pattern Recognition, Seattle, WA, USA, 13–19 June 2020; pp. 11621–11631. [Google Scholar]
  7. Yahia, Y.; Lopes, J.C.; Lopes, R.P. Computer Vision Algorithms for 3D Object Recognition and Orientation: A Bibliometric Study. Electronics 2023, 12, 4218. [Google Scholar] [CrossRef]
  8. Yuan, Y.; Cheng, H.; Sester, M. Keypoints-based deep feature fusion for cooperative vehicle detection of autonomous driving. IEEE Robot. Autom. Lett. 2022, 7, 3054–3061. [Google Scholar] [CrossRef]
  9. Wang, T.H.; Manivasagam, S.; Liang, M.; Yang, B.; Zeng, W.; Urtasun, R. V2vnet: Vehicle-to-vehicle communication for joint perception and prediction. In Proceedings of the Computer Vision—ECCV 2020: 16th European Conference, Glasgow, UK, 23–28 August 2020; Springer: Berlin/Heidelberg, Germany, 2020; pp. 605–621. [Google Scholar]
  10. Xu, R.; Xiang, H.; Xia, X.; Han, X.; Li, J.; Ma, J. Opv2v: An open benchmark dataset and fusion pipeline for perception with vehicle-to-vehicle communication. In Proceedings of the 2022 International Conference on Robotics and Automation (ICRA), Philadelphia, PA, USA, 23–27 May 2022; IEEE: Piscataway, NJ, USA, 2022; pp. 2583–2589. [Google Scholar]
  11. Xu, R.; Xiang, H.; Tu, Z.; Xia, X.; Yang, M.H.; Ma, J. V2x-vit: Vehicle-to-everything cooperative perception with vision transformer. In Proceedings of the European Conference on Computer Vision, Tel Aviv, Israel, 23–27 October 2022; Springer: Berlin/Heidelberg, Germany, 2022; pp. 107–124. [Google Scholar]
  12. Li, Y.; Ma, D.; An, Z.; Wang, Z.; Zhong, Y.; Chen, S.; Feng, C. V2X-Sim: Multi-agent collaborative perception dataset and benchmark for autonomous driving. IEEE Robot. Autom. Lett. 2022, 7, 10914–10921. [Google Scholar] [CrossRef]
  13. Xu, R.; Xia, X.; Li, J.; Li, H.; Zhang, S.; Tu, Z.; Meng, Z.; Xiang, H.; Dong, X.; Song, R.; et al. V2v4real: A real-world large-scale dataset for vehicle-to-vehicle cooperative perception. In Proceedings of the IEEE/CVF Conference on Computer Vision and Pattern Recognition, Vancouver, BC, Canada, 17–24 June 2023; pp. 13712–13722. [Google Scholar]
  14. Yu, H.; Luo, Y.; Shu, M.; Huo, Y.; Yang, Z.; Shi, Y.; Guo, Z.; Li, H.; Hu, X.; Yuan, J.; et al. Dair-v2x: A large-scale dataset for vehicle-infrastructure cooperative 3d object detection. In Proceedings of the IEEE/CVF Conference on Computer Vision and Pattern Recognition, New Orleans, LA, USA, 18–24 June 2022; pp. 21361–21370. [Google Scholar]
  15. Zhang, Q.; Shan, Y.; Zhang, Z.; Lin, H.; Zhang, Y.; Huang, K. Multisensor fusion-based maritime ship object-detection method for autonomous surface vehicles. J. Field Robot. 2023. [Google Scholar] [CrossRef]
  16. Zhang, Q.; Wang, L.; Meng, H.; Zhang, W. LiDAR Simulator for Autonomous Driving in Ocean Scenes. In Proceedings of the 2023 IEEE International Conference on Mechatronics and Automation (ICMA), Harbin, China, 6–9 August 2023; IEEE: Piscataway, NJ, USA, 2023; pp. 1082–1087. [Google Scholar]
  17. Yao, Z.; Chen, X.; Xu, N.; Gao, N.; Ge, M. LiDAR-based simultaneous multi-object tracking and static mapping in nearshore scenario. Ocean. Eng. 2023, 272, 113939. [Google Scholar] [CrossRef]
  18. Zhou, B.; Xu, H.; Shen, S. Racer: Rapid collaborative exploration with a decentralized multi-uav system. IEEE Trans. Robot. 2023, 39, 1816–1835. [Google Scholar] [CrossRef]
  19. Kurunathan, H.; Huang, H.; Li, K.; Ni, W.; Hossain, E. Machine learning-aided operations and communications of unmanned aerial vehicles: A contemporary survey. IEEE Commun. Surv. Tutor. 2023. [Google Scholar] [CrossRef]
  20. Shao, G.; Ma, Y.; Malekian, R.; Yan, X.; Li, Z. A novel cooperative platform design for coupled USV–UAV systems. IEEE Trans. Ind. Inform. 2019, 15, 4913–4922. [Google Scholar] [CrossRef]
  21. Sun, Z.; Sun, H.; Li, P.; Zou, J. Self-organizing cooperative pursuit strategy for multi-USV with dynamic obstacle ships. J. Mar. Sci. Eng. 2022, 10, 562. [Google Scholar] [CrossRef]
  22. Li, Y.; Zhang, J.; Ma, D.; Wang, Y.; Feng, C. Multi-robot scene completion: Towards task-agnostic collaborative perception. In Proceedings of the Conference on Robot Learning, Atlanta, GA, USA, 6 November 2023; pp. 2062–2072. [Google Scholar]
  23. Zhu, Z.; Du, Q.; Wang, Z.; Li, G. A survey of multi-agent cross domain cooperative perception. Electronics 2022, 11, 1091. [Google Scholar] [CrossRef]
  24. Yu, H.; Yang, W.; Ruan, H.; Yang, Z.; Tang, Y.; Gao, X.; Hao, X.; Shi, Y.; Pan, Y.; Sun, N.; et al. V2X-Seq: A Large-Scale Sequential Dataset for Vehicle-Infrastructure Cooperative Perception and Forecasting. In Proceedings of the IEEE/CVF Conference on Computer Vision and Pattern Recognition, Vancouver, BC, Canada, 17–24 June 2023; pp. 5486–5495. [Google Scholar]
  25. Axmann, J.; Moftizadeh, R.; Su, J.; Tennstedt, B.; Zou, Q.; Yuan, Y.; Ernst, D.; Alkhatib, H.; Brenner, C.; Schön, S. LUCOOP: Leibniz University Cooperative Perception and Urban Navigation Dataset. In Proceedings of the 2023 IEEE Intelligent Vehicles Symposium (IV), Anchorage, AK, USA, 4–7 June 2023; IEEE: Piscataway, NJ, USA, 2023; pp. 1–8. [Google Scholar]
  26. Arnold, E.; Dianati, M.; de Temple, R.; Fallah, S. Cooperative perception for 3D object detection in driving scenarios using infrastructure sensors. IEEE Trans. Intell. Transp. Syst. 2020, 23, 1852–1864. [Google Scholar] [CrossRef]
  27. Ngo, H.; Fang, H.; Wang, H. Cooperative Perception With V2V Communication for Autonomous Vehicles. IEEE Trans. Veh. Technol. 2023, 72, 11122–11131. [Google Scholar] [CrossRef]
  28. Wang, B.; Zhang, L.; Wang, Z.; Zhao, Y.; Zhou, T. Core: Cooperative reconstruction for multi-agent perception. In Proceedings of the IEEE/CVF International Conference on Computer Vision, Paris, France, 2–6 October 2023; pp. 8710–8720. [Google Scholar]
  29. Hu, Y.; Lu, Y.; Xu, R.; Xie, W.; Chen, S.; Wang, Y. Collaboration Helps Camera Overtake LiDAR in 3D Detection. In Proceedings of the IEEE/CVF Conference on Computer Vision and Pattern Recognition, Vancouver, BC, Canada, 17–24 June 2023; pp. 9243–9252. [Google Scholar]
  30. Yang, K.; Yang, D.; Zhang, J.; Li, M.; Liu, Y.; Liu, J.; Wang, H.; Sun, P.; Song, L. Spatio-temporal domain awareness for multi-agent collaborative perception. In Proceedings of the IEEE/CVF International Conference on Computer Vision, Paris, France, 2–6 October 2023; pp. 23383–23392. [Google Scholar]
  31. Ma, Y.; Lu, J.; Cui, C.; Zhao, S.; Cao, X.; Ye, W.; Wang, Z. MACP: Efficient Model Adaptation for Cooperative Perception. In Proceedings of the IEEE/CVF Winter Conference on Applications of Computer Vision, Waikoloa, HI, USA, 1–10 January 2024; pp. 3373–3382. [Google Scholar]
  32. Meng, Z.; Xia, X.; Xu, R.; Liu, W.; Ma, J. HYDRO-3D: Hybrid Object Detection and Tracking for Cooperative Perception Using 3D LiDAR. IEEE Trans. Intell. Veh. 2023, 8, 4069–4080. [Google Scholar] [CrossRef]
  33. Queralta, J.P.; Taipalmaa, J.; Pullinen, B.C.; Sarker, V.K.; Gia, T.N.; Tenhunen, H.; Gabbouj, M.; Raitoharju, J.; Westerlund, T. Collaborative multi-robot search and rescue: Planning, coordination, perception, and active vision. IEEE Access 2020, 8, 191617–191643. [Google Scholar] [CrossRef]
  34. Chen, Q.; Tang, S.; Yang, Q.; Fu, S. Cooper: Cooperative perception for connected autonomous vehicles based on 3d point clouds. In Proceedings of the 2019 IEEE 39th International Conference on Distributed Computing Systems (ICDCS), Dallas, TX, USA, 7–9 July 2019; IEEE: Piscataway, NJ, USA, 2019; pp. 514–524. [Google Scholar]
  35. Chen, Q.; Ma, X.; Tang, S.; Guo, J.; Yang, Q.; Fu, S. F-cooper: Feature based cooperative perception for autonomous vehicle edge computing system using 3D point clouds. In Proceedings of the 4th ACM/IEEE Symposium on Edge Computing, Washington, DC, USA, 7–9 November 2019; pp. 88–100. [Google Scholar]
  36. Lu, Y.; Li, Q.; Liu, B.; Dianati, M.; Feng, C.; Chen, S.; Wang, Y. Robust collaborative 3d object detection in presence of pose errors. In Proceedings of the 2023 IEEE International Conference on Robotics and Automation (ICRA), London, UK, 29 May–2 June 2023; IEEE: Piscataway, NJ, USA, 2023; pp. 4812–4818. [Google Scholar]
  37. Xu, R.; Tu, Z.; Xiang, H.; Shao, W.; Zhou, B.; Ma, J. CoBEVT: Cooperative bird’s eye view semantic segmentation with sparse transformers. arXiv 2022, arXiv:2207.02202. [Google Scholar]
  38. Qiao, D.; Zulkernine, F. Adaptive feature fusion for cooperative perception using lidar point clouds. In Proceedings of the IEEE/CVF Winter Conference on Applications of Computer Vision, Waikoloa, HI, USA, 3–7 January 2023; pp. 1186–1195. [Google Scholar]
  39. Liu, Y.C.; Tian, J.; Glaser, N.; Kira, Z. When2com: Multi-agent perception via communication graph grouping. In Proceedings of the IEEE/CVF Conference on Computer Vision and Pattern Recognition, Seattle, WA, USA, 13–19 June 2020; pp. 4106–4115. [Google Scholar]
  40. Hu, Y.; Fang, S.; Lei, Z.; Zhong, Y.; Chen, S. Where2comm: Communication-efficient collaborative perception via spatial confidence maps. Adv. Neural Inf. Process. Syst. 2022, 35, 4874–4886. [Google Scholar]
  41. Liu, C.; Chen, Y.; Chen, J.; Payton, R.; Riley, M.; Yang, S.H. Cooperative perception with learning-based V2V communications. IEEE Wirel. Commun. Lett. 2023, 12, 1831–1835. [Google Scholar] [CrossRef]
  42. Lang, A.H.; Vora, S.; Caesar, H.; Zhou, L.; Yang, J.; Beijbom, O. Pointpillars: Fast encoders for object detection from point clouds. In Proceedings of the IEEE/CVF Conference on Computer Vision and Pattern Recognition, Long Beach, CA, USA, 15–20 June 2019; pp. 12697–12705. [Google Scholar]
Figure 1. Real port and island scenes. The left side of the picture shows the scene of berthing ships at Yantai Port, and the right side shows the scene of Shengsi Island.
Electronics 13 00885 g001
Figure 2. Ship navigation simulation scenes. The left side of the picture shows the scene of port, and the right side shows the scene of island.
Electronics 13 00885 g002
Figure 3. Port scene collection data comparison.On the left is the actually collected point cloud data, while on the right is the data simulated through Unity3D.
Electronics 13 00885 g003
Figure 4. Comparison of data distribution between the S2S-sim dataset and actual collected ship data. Compared with the actual collected data, S2S-sim enhances the diversity of scenes and objects.
Electronics 13 00885 g004
Figure 5. The distribution of laser points within different perception radii of the ego agent in various field scenarios.
Electronics 13 00885 g005
Figure 6. Network architecture. The proposed regional clustering fusion-based ship cooperative 3D object-detection method comprises two modules. The regional clustering fusion module (left) mainly facilitates selective fusion of point cloud data in large-scale navigation scenes. The green boxes represent the selected object regions after clustering. The feature extraction and detection module (right) chiefly serves to extract object features and yield detection outcomes from the fused data.
Electronics 13 00885 g006
Figure 7. Raw data and selected object regions after clustering. On the left are the raw data collected by the ego ship. On the right are the clustered and selected object regions, with the green axis-aligned bounding boxes representing the ship object regions to be fused.
Electronics 13 00885 g007
Figure 8. Visualization of detected boxes in S2S-sim dataset. Green boxes are ground-truth while red ones are detection. While the navigation perception scene is relatively large, our method achieves significantly more precise detection compared to the baseline.
Electronics 13 00885 g008
Table 1. The parameters of the simulated LiDAR and the real LiDAR.
LiDAR TypeReal LiDARSimulated LiDAR (Ours)
Beam12864
Frequency2 Hz10 Hz
Range2n mile2 km
horizontal FOV 360 360
vertical FOV 20 to 10 20 to 10
error ± 2 cm ± 2 cm
Table 2. Overall analysis of S2S-sim dataset.
Scenario TypePercentage (%)Ship NumberDensity (/km2)Frame/Segment
Port28.621.565.14250
Island57.110.642.54250
Open water14.311.212.67250
Table 4. 3D detection performance comparison with different perception radii (IoU = 0.5).
MethodFusion StrategyR = 1 kmR = 1.5 kmR = 2 km
No fusionNo55.4654.6451.96
Early fusionEarly80.4577.2570.57
IM fusionIntermediate36.9752.8867.20
Late fusionLate42.1254.6661.99
FcooperIntermediate40.6558.0273.09
CobevtIntermediate25.9741.8356.61
Where2commIntermediate42.1861.0165.57
V2xvitIntermediate35.6149.1457.35
CoalignIntermediate41.8360.0663.87
OursEarly84.0781.4375.29
Table 5. Comparison of data request volume between our method and baseline under different perception radii (IoU = 0.5).
MethodRange (km)AP (%)Request
Data (KB)
Baseline180.4548.24
Ours184.0732.27
Baseline1.577.2586.44
Ours1.581.4346.09
Baseline270.57112.92
Ours275.2951.46
Disclaimer/Publisher’s Note: The statements, opinions and data contained in all publications are solely those of the individual author(s) and contributor(s) and not of MDPI and/or the editor(s). MDPI and/or the editor(s) disclaim responsibility for any injury to people or property resulting from any ideas, methods, instructions or products referred to in the content.

