Article

Improvement in Laptop Heat Dissipation with Taguchi Method

1
Department of Electrical Engineering, Chang Gung University, Taoyuan City 333, Taiwan
2
Department of Electrical Engineering, Ming Chi University of Technology, New Taipei City 243, Taiwan
*
Author to whom correspondence should be addressed.
Electronics 2024, 13(5), 882; https://doi.org/10.3390/electronics13050882
Submission received: 18 January 2024 / Revised: 22 February 2024 / Accepted: 23 February 2024 / Published: 25 February 2024

Abstract

:
This paper aims to investigate the feasibility of using system power consumption as a factor to improve laptop heat dissipation. The problems due to the CPU overheating are addressed. Based on the Taguchi method, the laptop fan parameters can be optimized with firmware adjustments only. In the Taguchi analysis, the fan speed, system power, and debounce time are considered as control factors, while the Cinebench point is utilized to evaluate the CPU performance. Experimental results demonstrate that the proposed heat dissipation scheme effectively reduces the idle time of a laptop fan. The improvement in heat dissipation can reduce CPU performance degradation because of overheating. According to the best combination of control factors, there is approximately a 5% increase in CPU performance despite a 0.35% increment in power consumption. This paper highlights the effectiveness of optimizing laptop fan parameters through firmware adjustments to improve heat dissipation and mitigate CPU overheating issues. Moreover, the study highlights the delicate balance between power consumption and performance gains. While there may be a slight increase in power consumption associated with the optimized heat dissipation scheme, the observed improvements in CPU performance outweigh this incremental power usage.

1. Introduction

Nowadays, the thinness and compactness of laptop computers have become a major trend in the consumer electronic market. However, this design trend also poses a serious challenge to heat dissipation. The performance of laptop heat dissipation is affected by the compressed internal space that causes performance degradation of the central processing unit (CPU). Therefore, it becomes important to improve the heat dissipation problem in laptops.
In general, when a current flows through an electronic component, there is some power loss, which is usually converted to heat energy in the surroundings. In modern electronic devices, compactness and small size are the prevailing development trends. As the computing performance increases, the limitation of the space for heat dissipation becomes more crucial. For instance, the higher the CPU’s computing performance, the greater the generated heat inside the laptop. The accumulation of heat inside the laptop casing can lead to a reduced lifespan of electronic components, indirectly causing a decrease in processing efficiency.
Passive heat dissipation and active heat dissipation are two common methods used to manage heat in laptops. Passive heat dissipation methods rely on natural processes such as heat conduction, radiation, and convection to remove heat from electronic components. Heat sinks and vaper chambers are commonly used in laptops and smartphones to manage and distribute heat from CPUs. According to the way to conduct heat, the active heat dissipation methods are divided into air cooling and liquid cooling [1,2,3]. Liquid cooling involves the use of a liquid coolant, such as water or a specialized fluid, to remove heat from electronic components. Liquid cooling is frequently employed in high-performance computers for more efficient cooling. Air cooling refers to a cooling method that uses air as the primary medium to dissipate heat, typically using fans and heat sinks. Air cooling in laptops is a common method to prevent overheating and maintain proper operating temperatures for the internal components. Two-phase liquid cooling involves the use of a coolant fluid that undergoes a phase change from liquid to vapor to absorb heat from electronic components. The vapor then condenses back into liquid form in a separate heat exchanger, releasing the absorbed heat [2]. The addition of nanoparticles to the base fluid could alter its thermophysical properties, such as thermal conductivity, viscosity, and specific heat capacity. Nanofluids have been explored for their potential application in CPU cooling due to their high stability and enhanced thermal properties [4,5]. In practice, the concerns regarding coolant selection and the risk of coolant leakage are similar in both liquid cooling and two-phase liquid cooling systems.
In the earliest laptops, heat dissipation was primarily achieved using heat sinks and fans positioned near the CPU. These components played a crucial role in preventing the CPU from overheating by effectively dissipating the heat generated during operation [6]. To improve the heat dissipation performance, there were improvements in hardware optimization and the operating logic of active components. For example, heat dissipation copper tubes, heat dissipation fins, fan design, heat flow fluid, and fan control logic are considered in the air-cooled heat dissipation system. The optimization of heat dissipation copper tubes in the air-cooled cooling system is due to the improvement in the internal filling. For example, a gallium–indium liquid alloy was added to the disguised material. Based on the excellent thermal conductivity characteristics of gallium–indium liquid alloys, the overall heat dissipation performance was improved [7]. The improvement in heat dissipation fins was through changing the shape and arrangement. For example, different geometric arrangements and redesigned shapes of the fins were considered. In simulations, the use of cylindrical fins could be a better choice [8]. In [9], the authors also used different arrangements of fins to investigate the related heat dissipation capacity. Thermal analysis and optimization of the entire thermal module of a laptop were also addressed, where a multi-objective optimization algorithm was used to optimize the thermal resistance of each component [10].
Heat pipes are commonly used in laptops for heat dissipation. These are passive thermal management devices that efficiently transfer heat away from heat-generating components such as the CPU and GPU to areas with better airflow or cooling solutions. In [11], a new type of vertical heat pipe radiator was presented for heat dissipation of vertical CPUs, where some condensation ends were considered and the cooling wind speed of the cold end of the vertical radiator was monitored. In [12], a novel solution was introduced in the form of a three-dimensional, flat plate, aluminum, pulsating heat pipe for the radial heat dissipation of high-power server chips. In [13], a loop heat pipe with a flat evaporator was proposed to ensure the heat dissipation requirement of a high heat flux server CPU. In [14], a U-shaped heat pipe-bonded heat sink was developed for CPU cooling. Overall, the development of a shaped heat pipe bonded heat sink is an advancement in CPU cooling technology, offering improved thermal performance, compatibility, and reliability for high-performance computing systems.
Furthermore, a complete experiment on the relationship between the heat dissipation capacity and the fan speed was conducted [15]. It suggested that higher fan speeds result in more heat dissipation, which can help mitigate the risk of thermal overload and potential collapse of the heat dissipation system by enhancing its ability to remove heat from the components. According to the interdependence between fan speed and heat dissipation, the adjustment of the fan startup logic can affect the ability to dissipate heat. In [16], the change in temperature conditions was considered a factor in determining the fan speed to manage heat dissipation, where a more stable power-saving heat dissipation logic was discussed. In addition, the Taguchi method was applied to optimize the cooling performance for a data center, where the flow rate, inlet–outlet configuration, and fan speed were addressed as the control factors [17]. In summary, the decrease in temperature was primarily affected by the fan speed. By adjusting the fan speed, the system can effectively dissipate heat, ensuring reliable performance and longevity of the components.
The Taguchi method has been widely used in various industries, including manufacturing, engineering, and product development, to improve quality, reduce variability, and enhance overall performance. It provides a systematic and efficient approach to experimental design and optimization, making it a valuable tool for quality improvement initiatives [18,19,20,21,22]. For example, the Taguchi experimental design was applied to optimize the vacuum printing encapsulation process, where a combination of process parameters was considered, including the squeegee moving speed, printing delay time, and the number of squeegee printings [18]. The Taguchi method combined with the analysis of variance was utilized to optimize the structure parameters of the receiving antenna [19]. The Taguchi method has also been used for parameter optimization in electrical machinery, such as optimizing geometric parameters and trigger positions of a coil gun [20] and optimizing the magnetic field density in a permanent magnet motor [21]. Moreover, in the research of biological chemistry, the Taguchi method was applied to investigate the optimal conditions for the preparation of pure parapyruvate, where the concentration of the solution and the pH value of the reaction were chosen as the control factors [22]. In [23], the Taguchi method was utilized to optimize the operating conditions of a thermoelectric generator, where the hot side temperature, the heat sink size, and the wind airspeed were the parameters to be optimized. Moreover, with imprecise or subjective data, fuzzy and genetic algorithm-based Taguchi methods have been investigated, which allow for a more realistic representation of uncertainties, leading to robust and reliable optimization results [24,25,26,27,28]. In general, the ways to improve heat dissipation can be categorized as liquid cooling and air cooling. The complexity and cost of liquid cooling can be higher compared to air cooling.
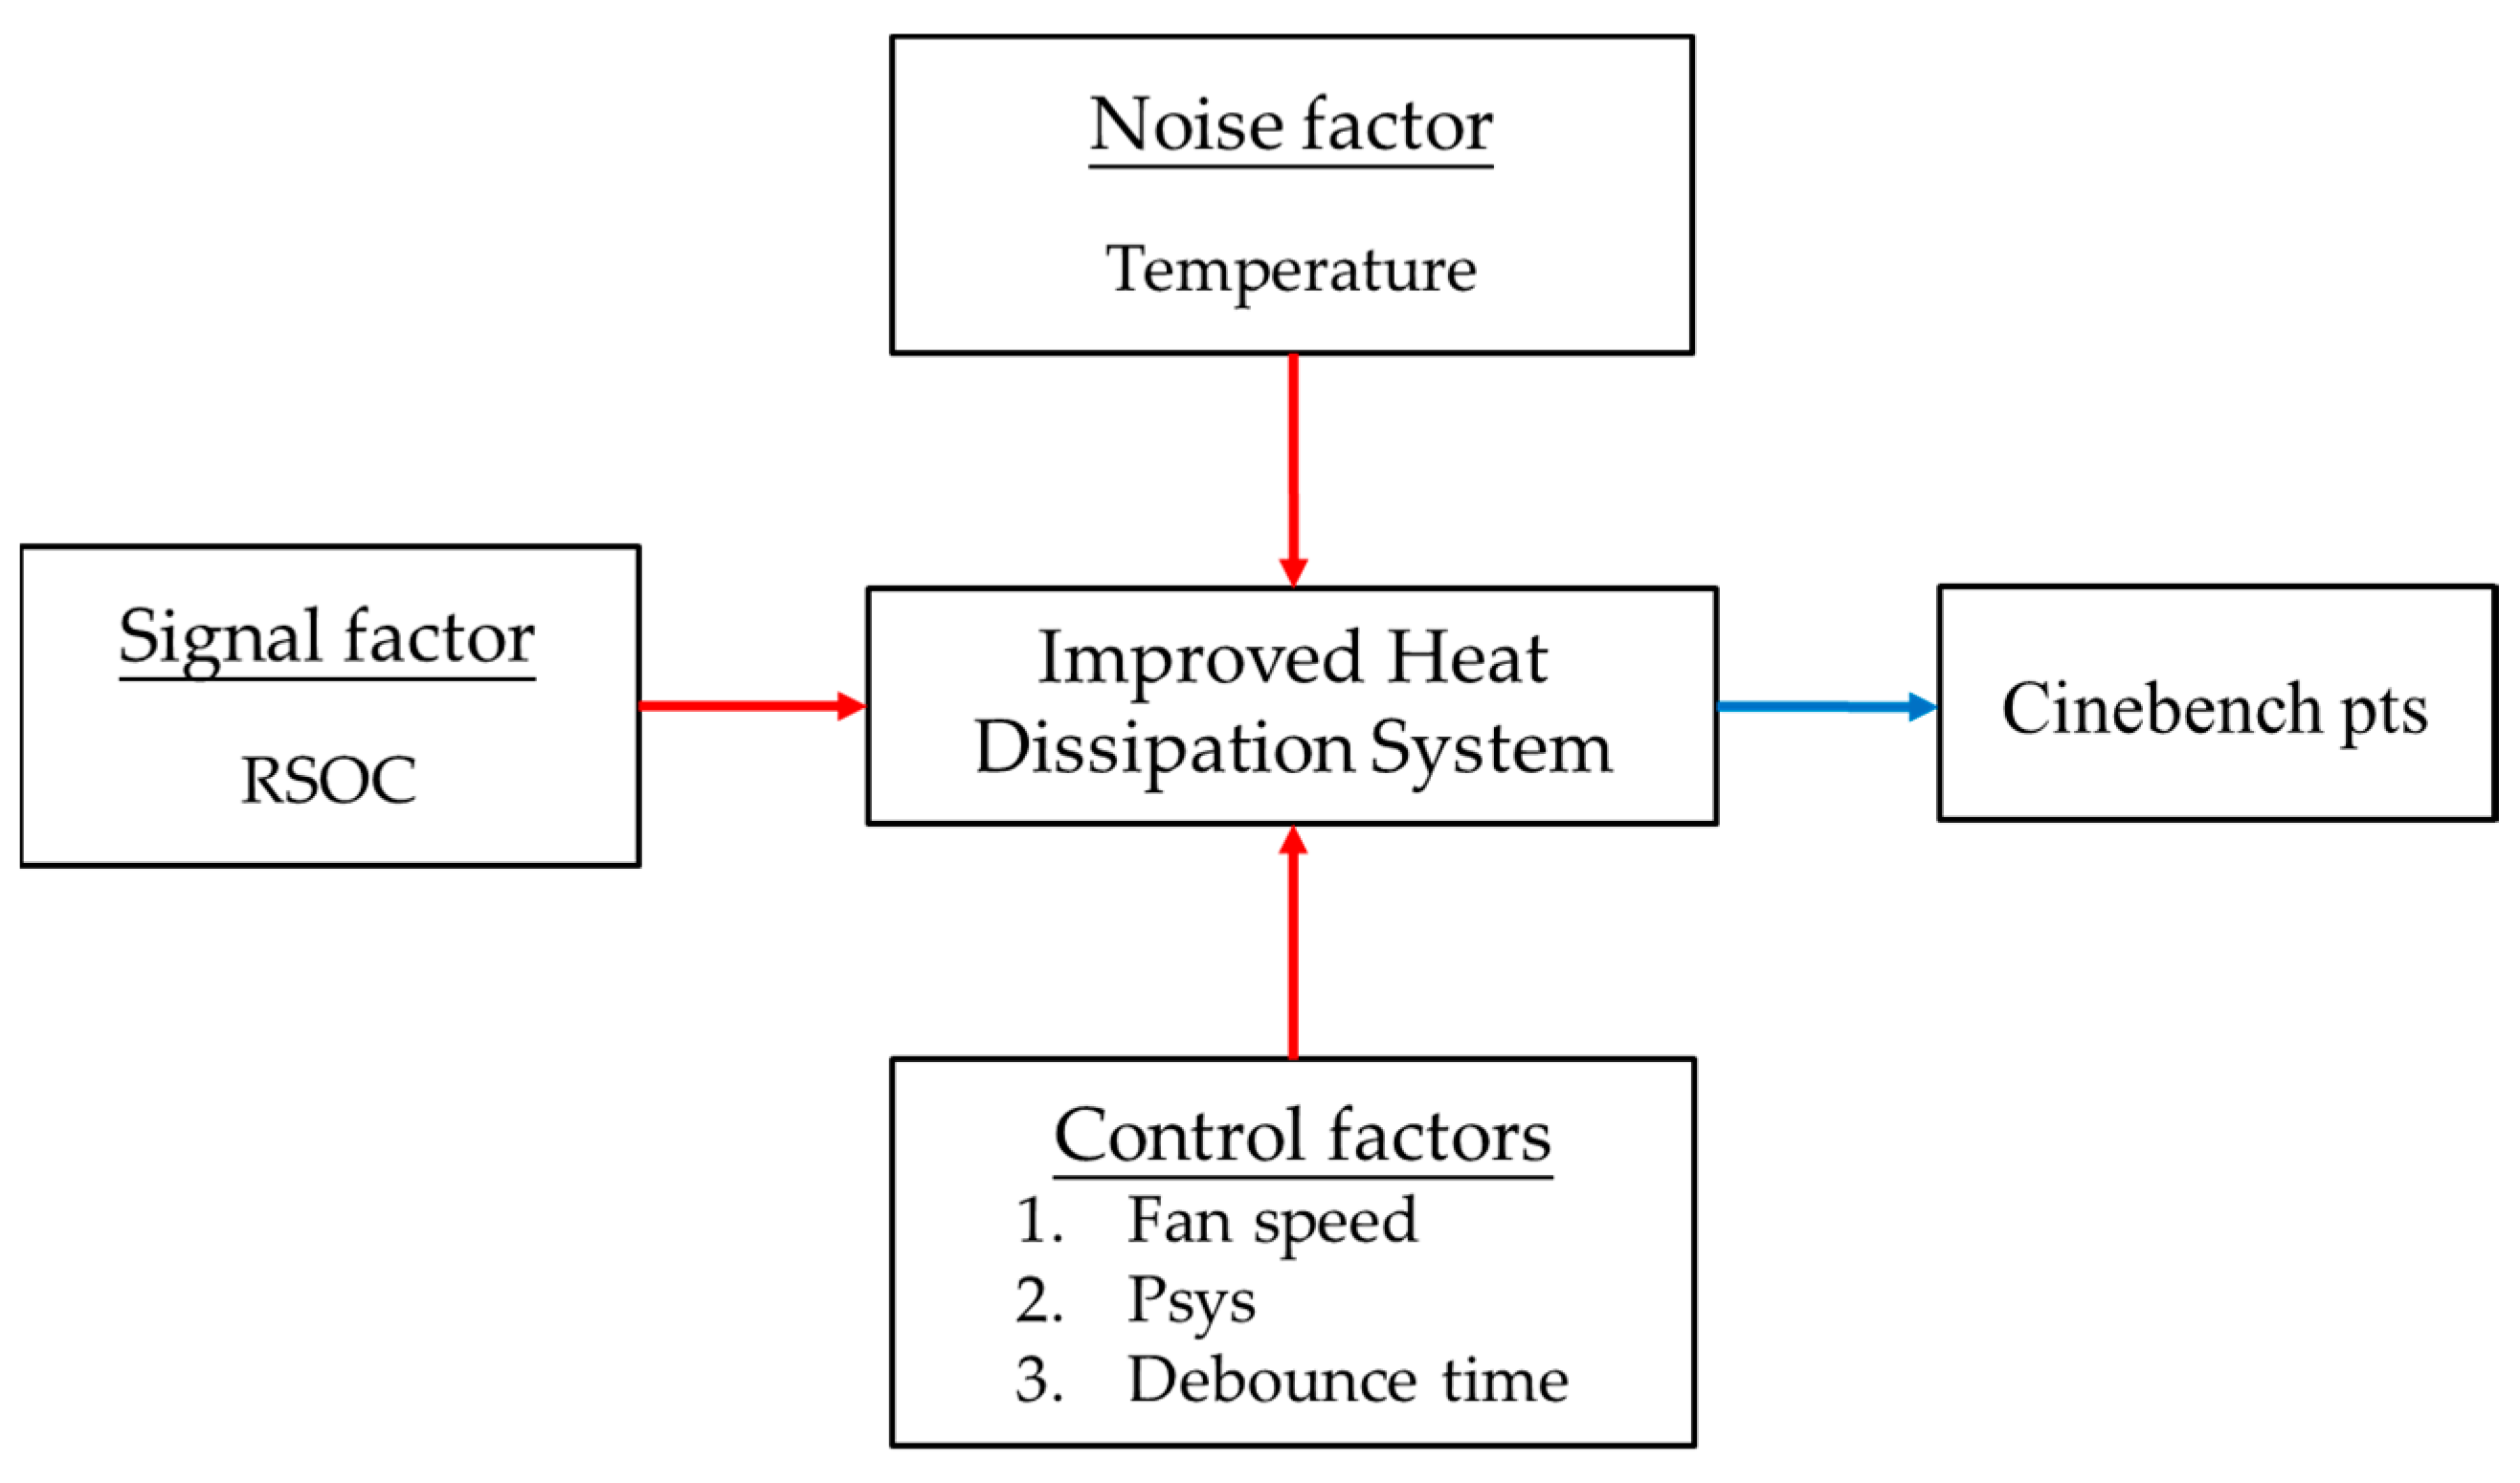
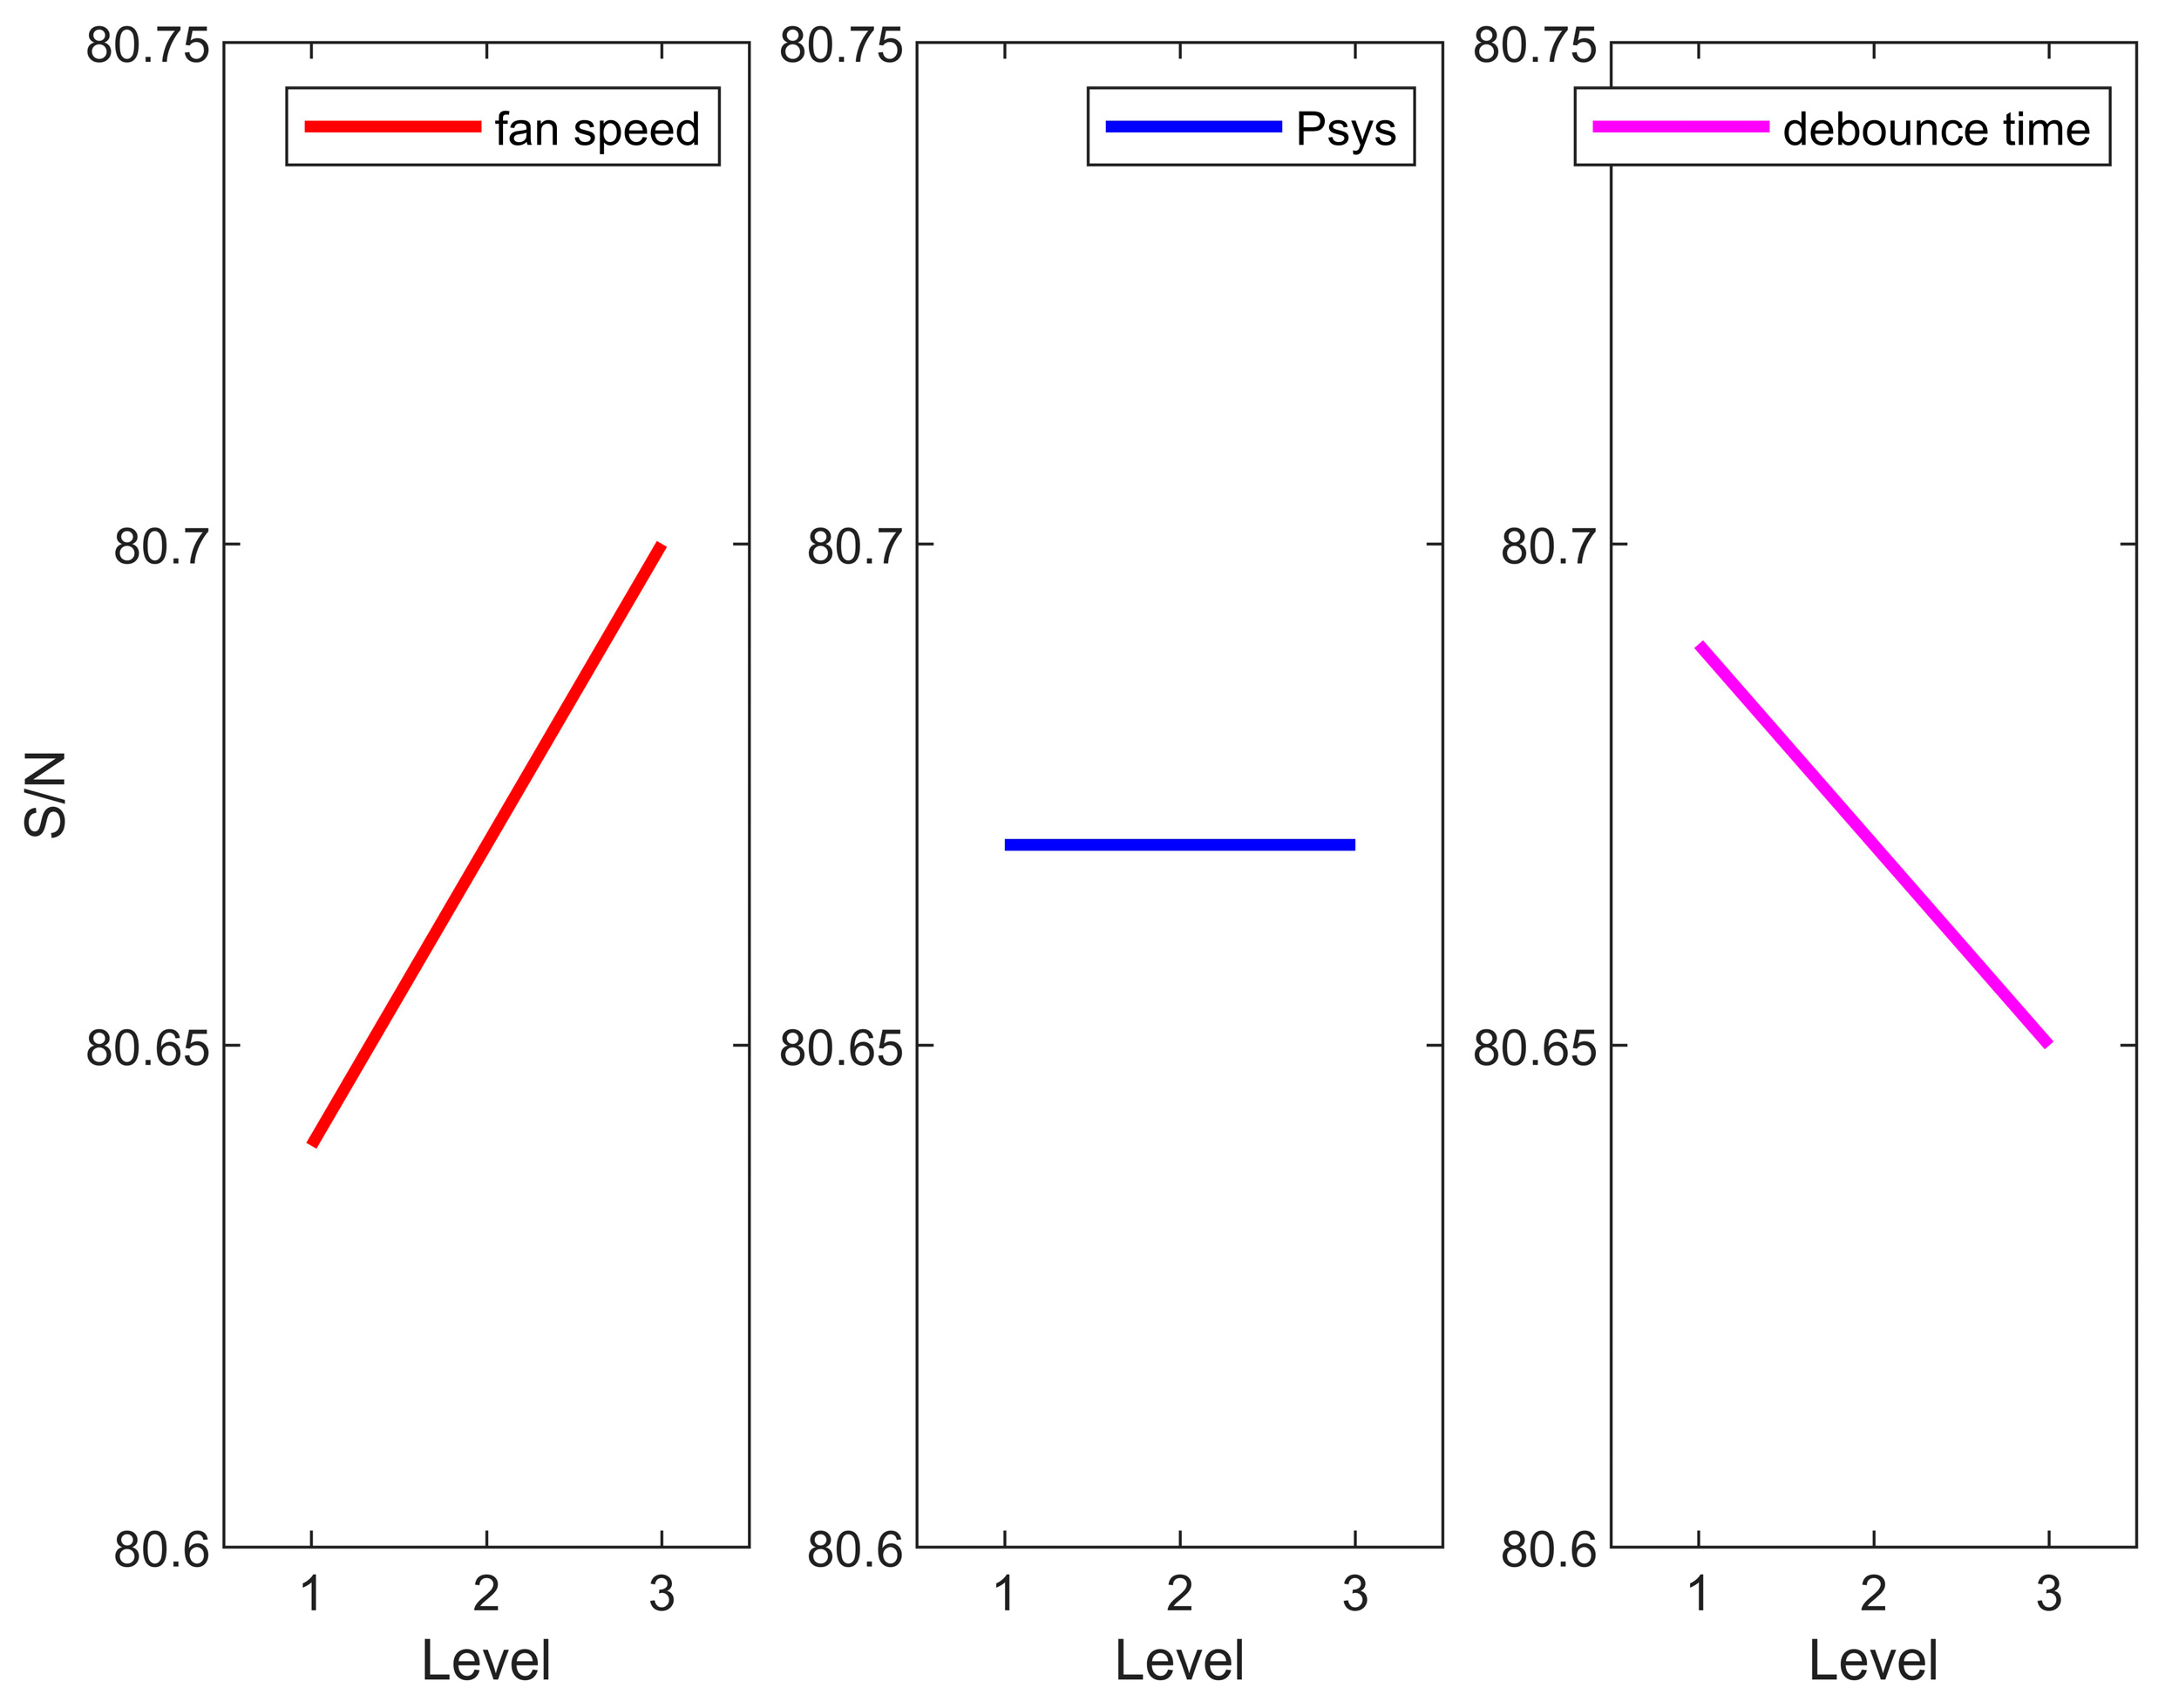
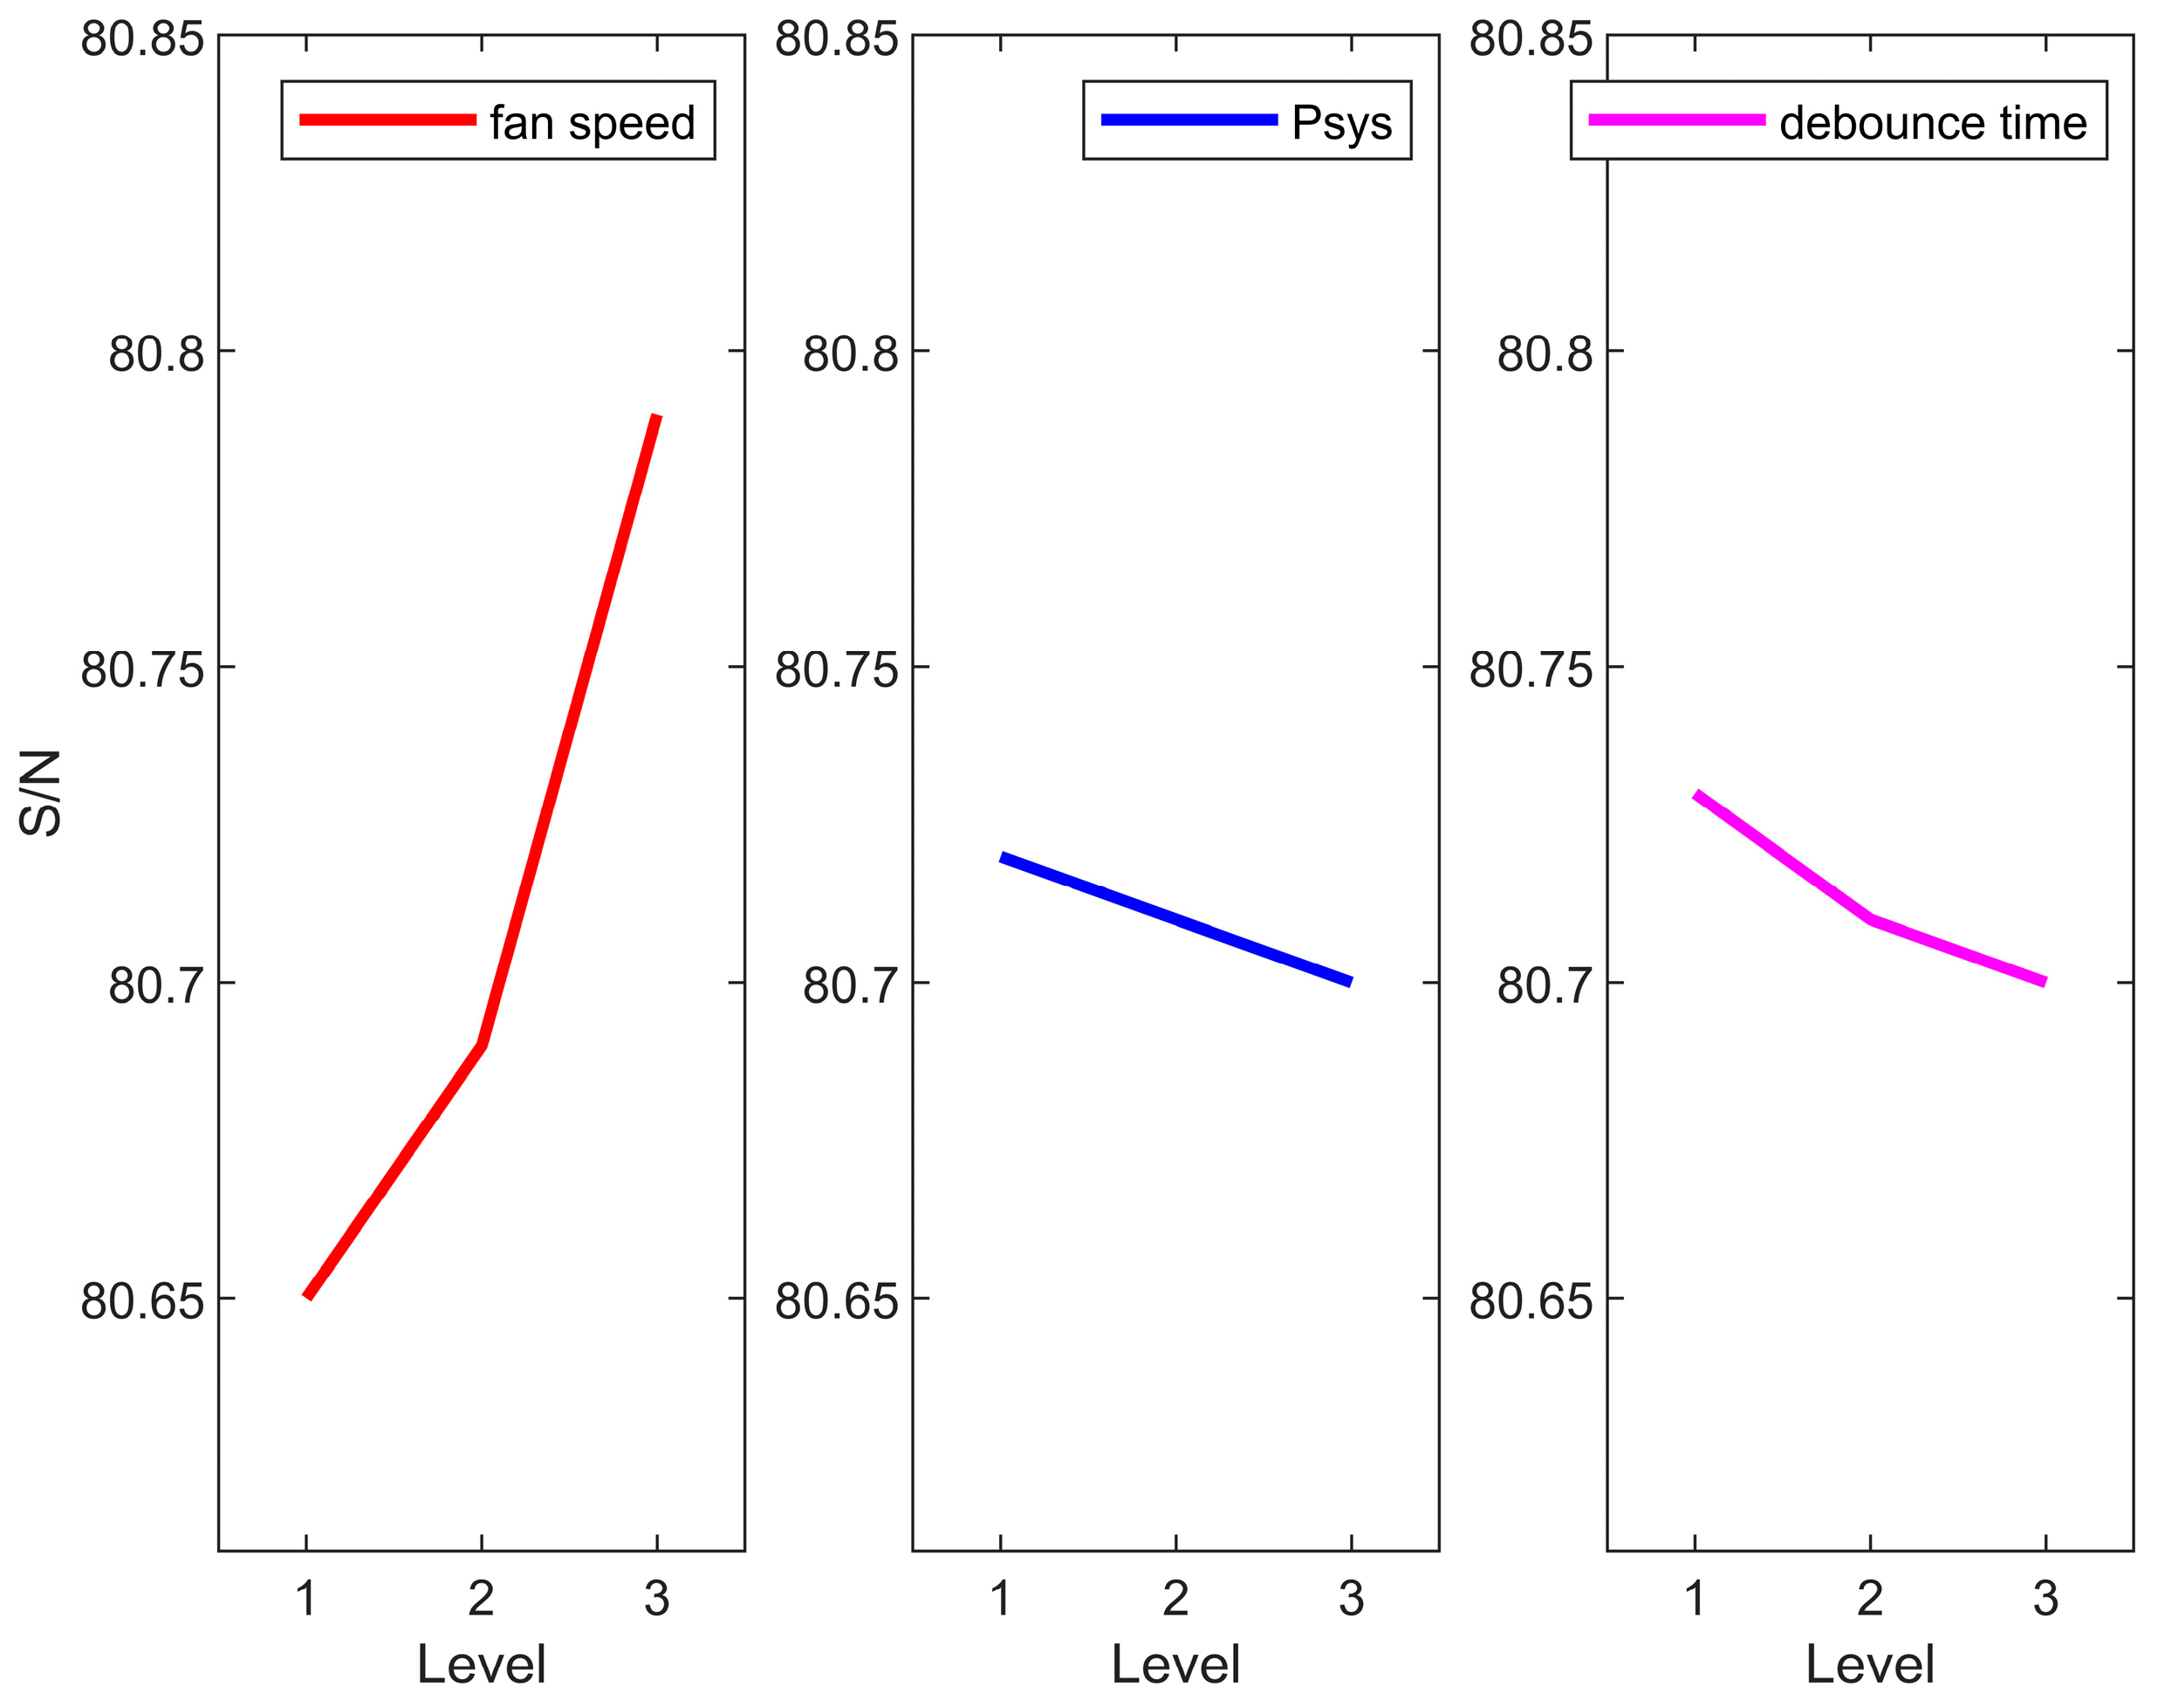
In this paper, the used laptop is a finished product, equipped with a heat sink, copper pipes, and fins, and using dual cooling fans as the active cooling components. To enhance heat dissipation in a cost-effective and easy-to-implement manner, the method of active control and improvement in heat dissipation components is adopted. By dynamically adjusting fan speeds, the goal is to improve the overall thermal performance without the need for major hardware modifications. Measuring power consumption is a crucial aspect in the design, testing, and optimization of electronic systems and devices. In this paper, through communication with the embedded controller (EC), the system power (Psys) can be measured from the charger’s integrated circuit (IC). The logic of using temperature alone as the starting condition of the fan has been changed to a mixed condition that combines temperature and system power consumption. The improved dynamic fan speed adjustment can provide better heat dissipation. The implementation of related hardware and software architectures will be addressed. Also, the Taguchi method will be applied for the optimization of system parameters, including fan speed, debounce time, and related trigger conditions. The degree of influence of each factor is quantified using the analysis of variance (ANOVA). Finally, we will compare the results of the Taguchi experiment with the original system and analyze the costs and risks incurred by this thermal solution. This will further elaborate on the advantages and feasibility of this approach. Through these analyses and experiments, we will be able to provide a feasible solution to improve the heat dissipation problem of laptops. The contributions of this paper are listed as follows:
  • By utilizing the Taguchi method, this paper explores the optimization of laptop fan parameters solely through firmware adjustments. This approach offers a cost-effective and non-invasive means to enhance heat dissipation without requiring hardware modifications.
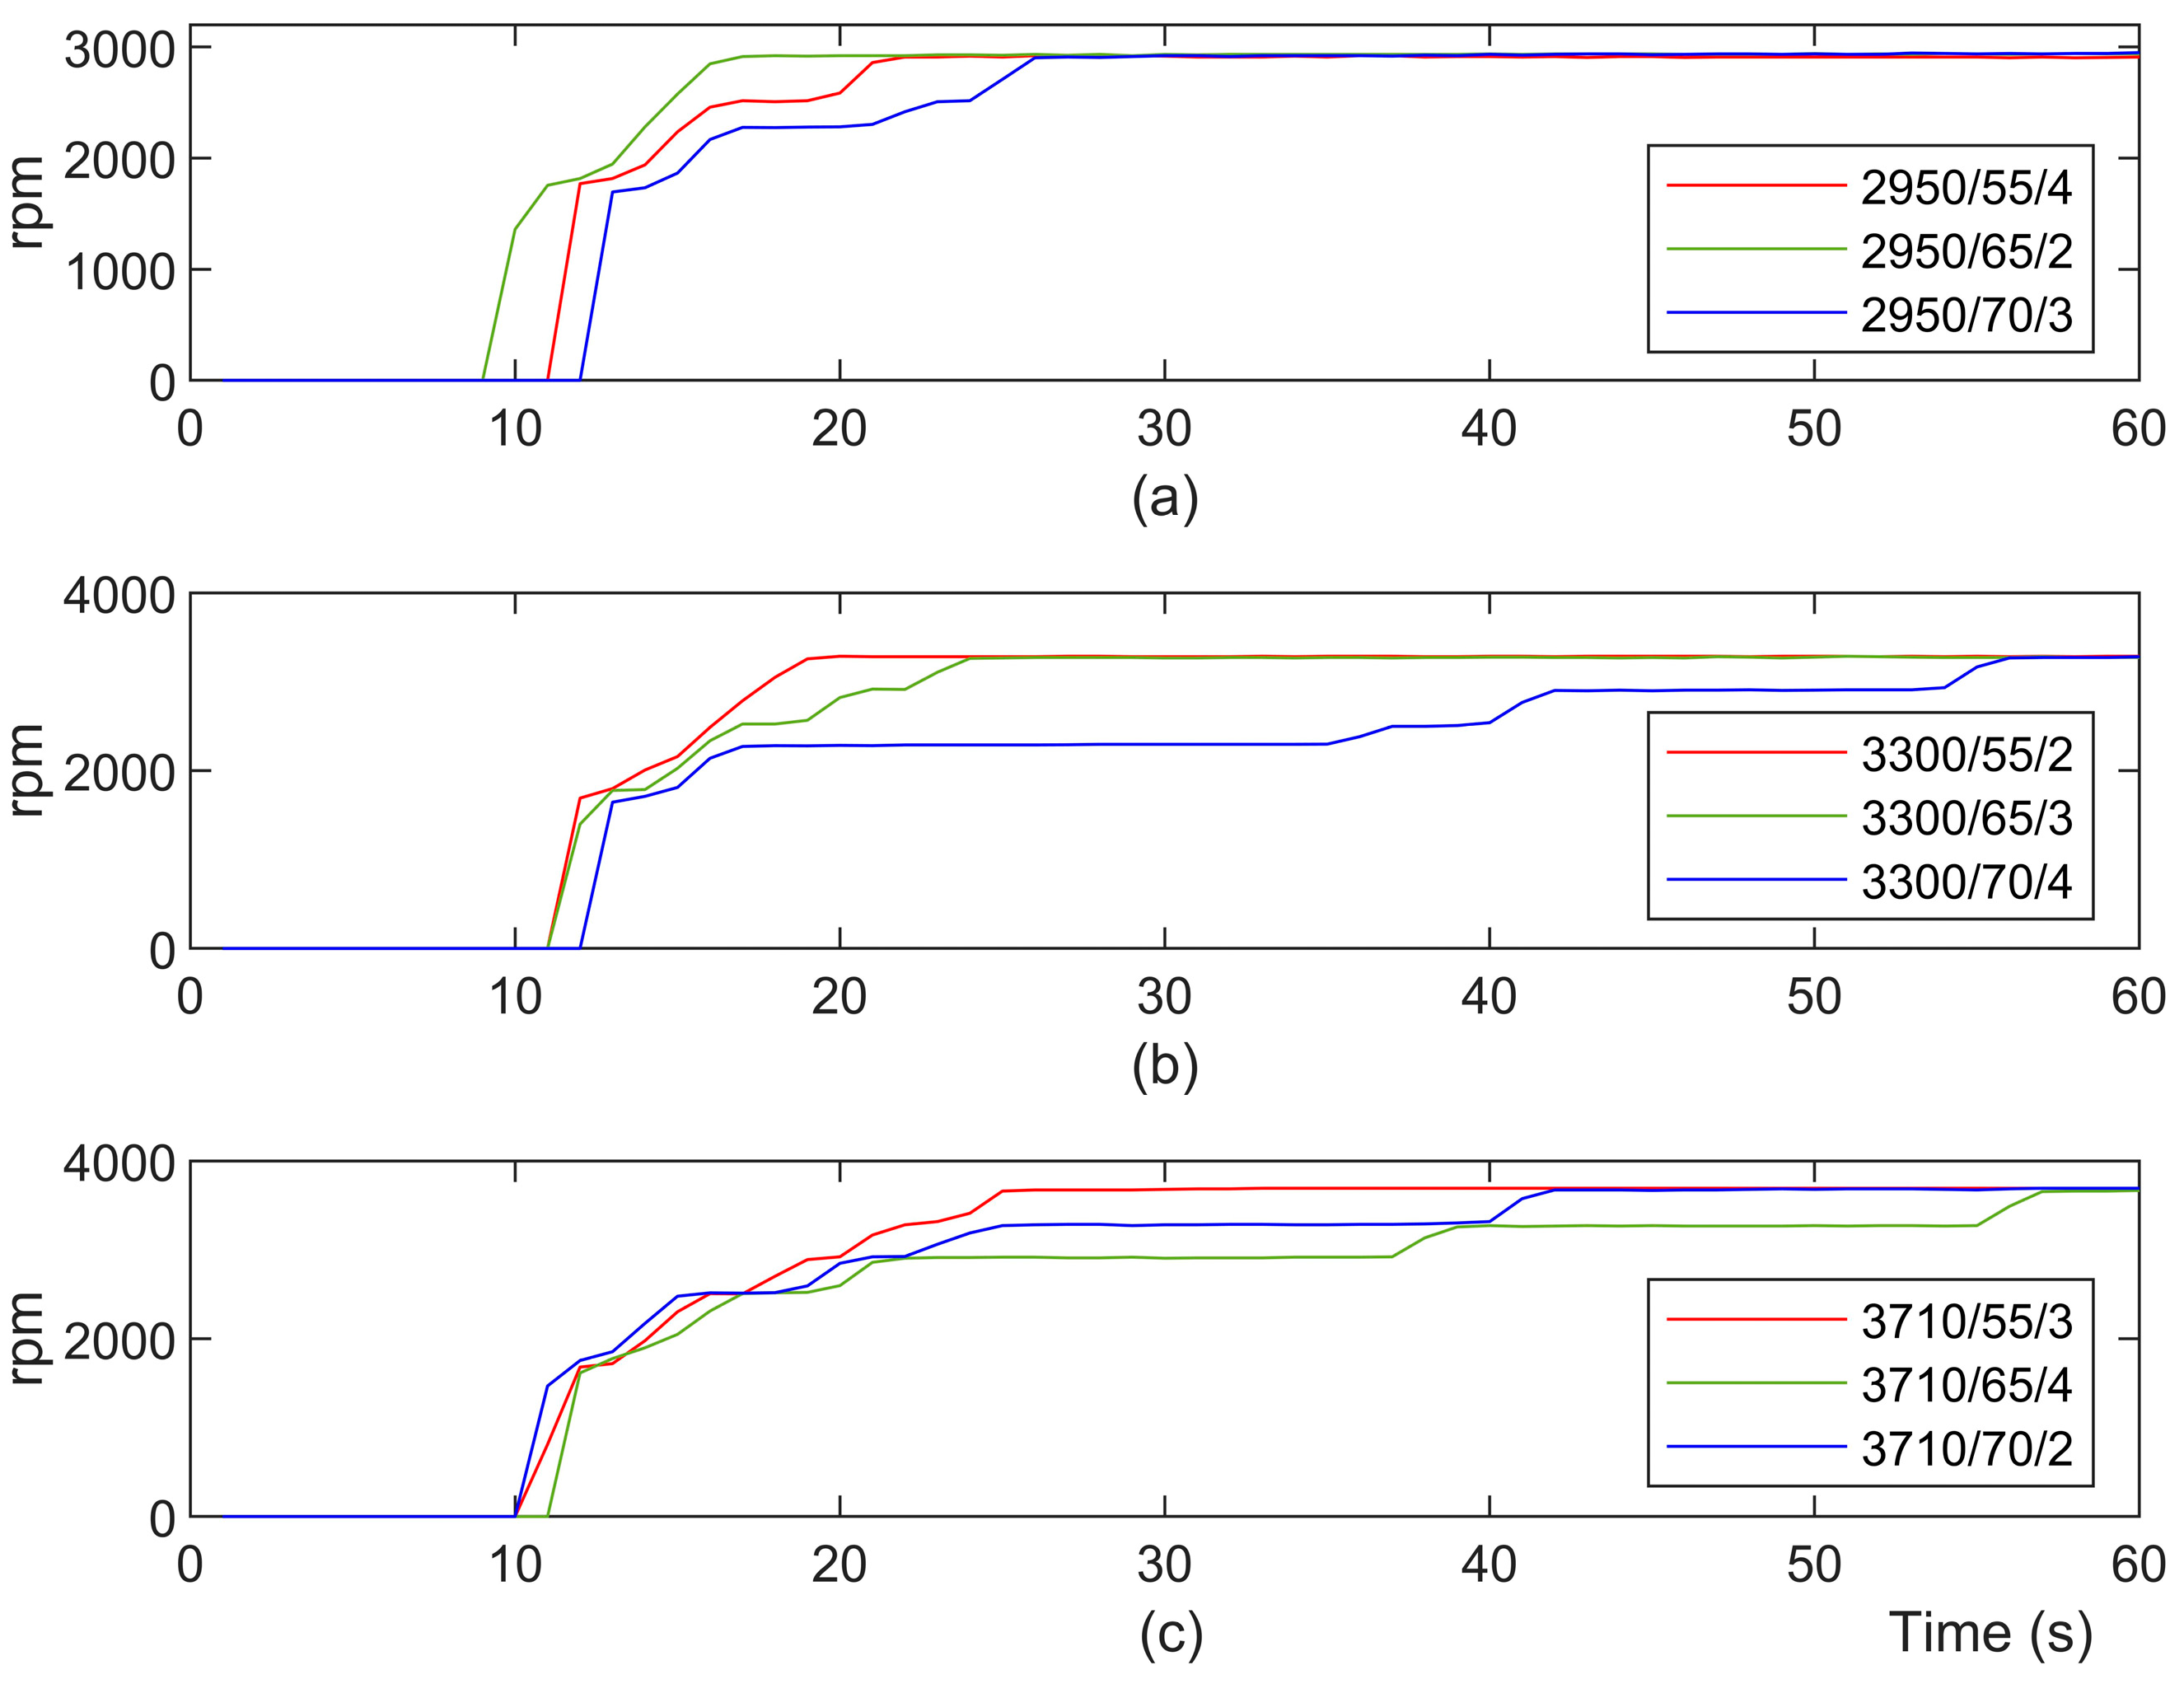
  • The experimental results indicate that the proposed heat dissipation scheme successfully reduces the idle time of the laptop fan. This improvement in fan operation contributes to more efficient heat dissipation, consequently alleviating CPU overheating issues.
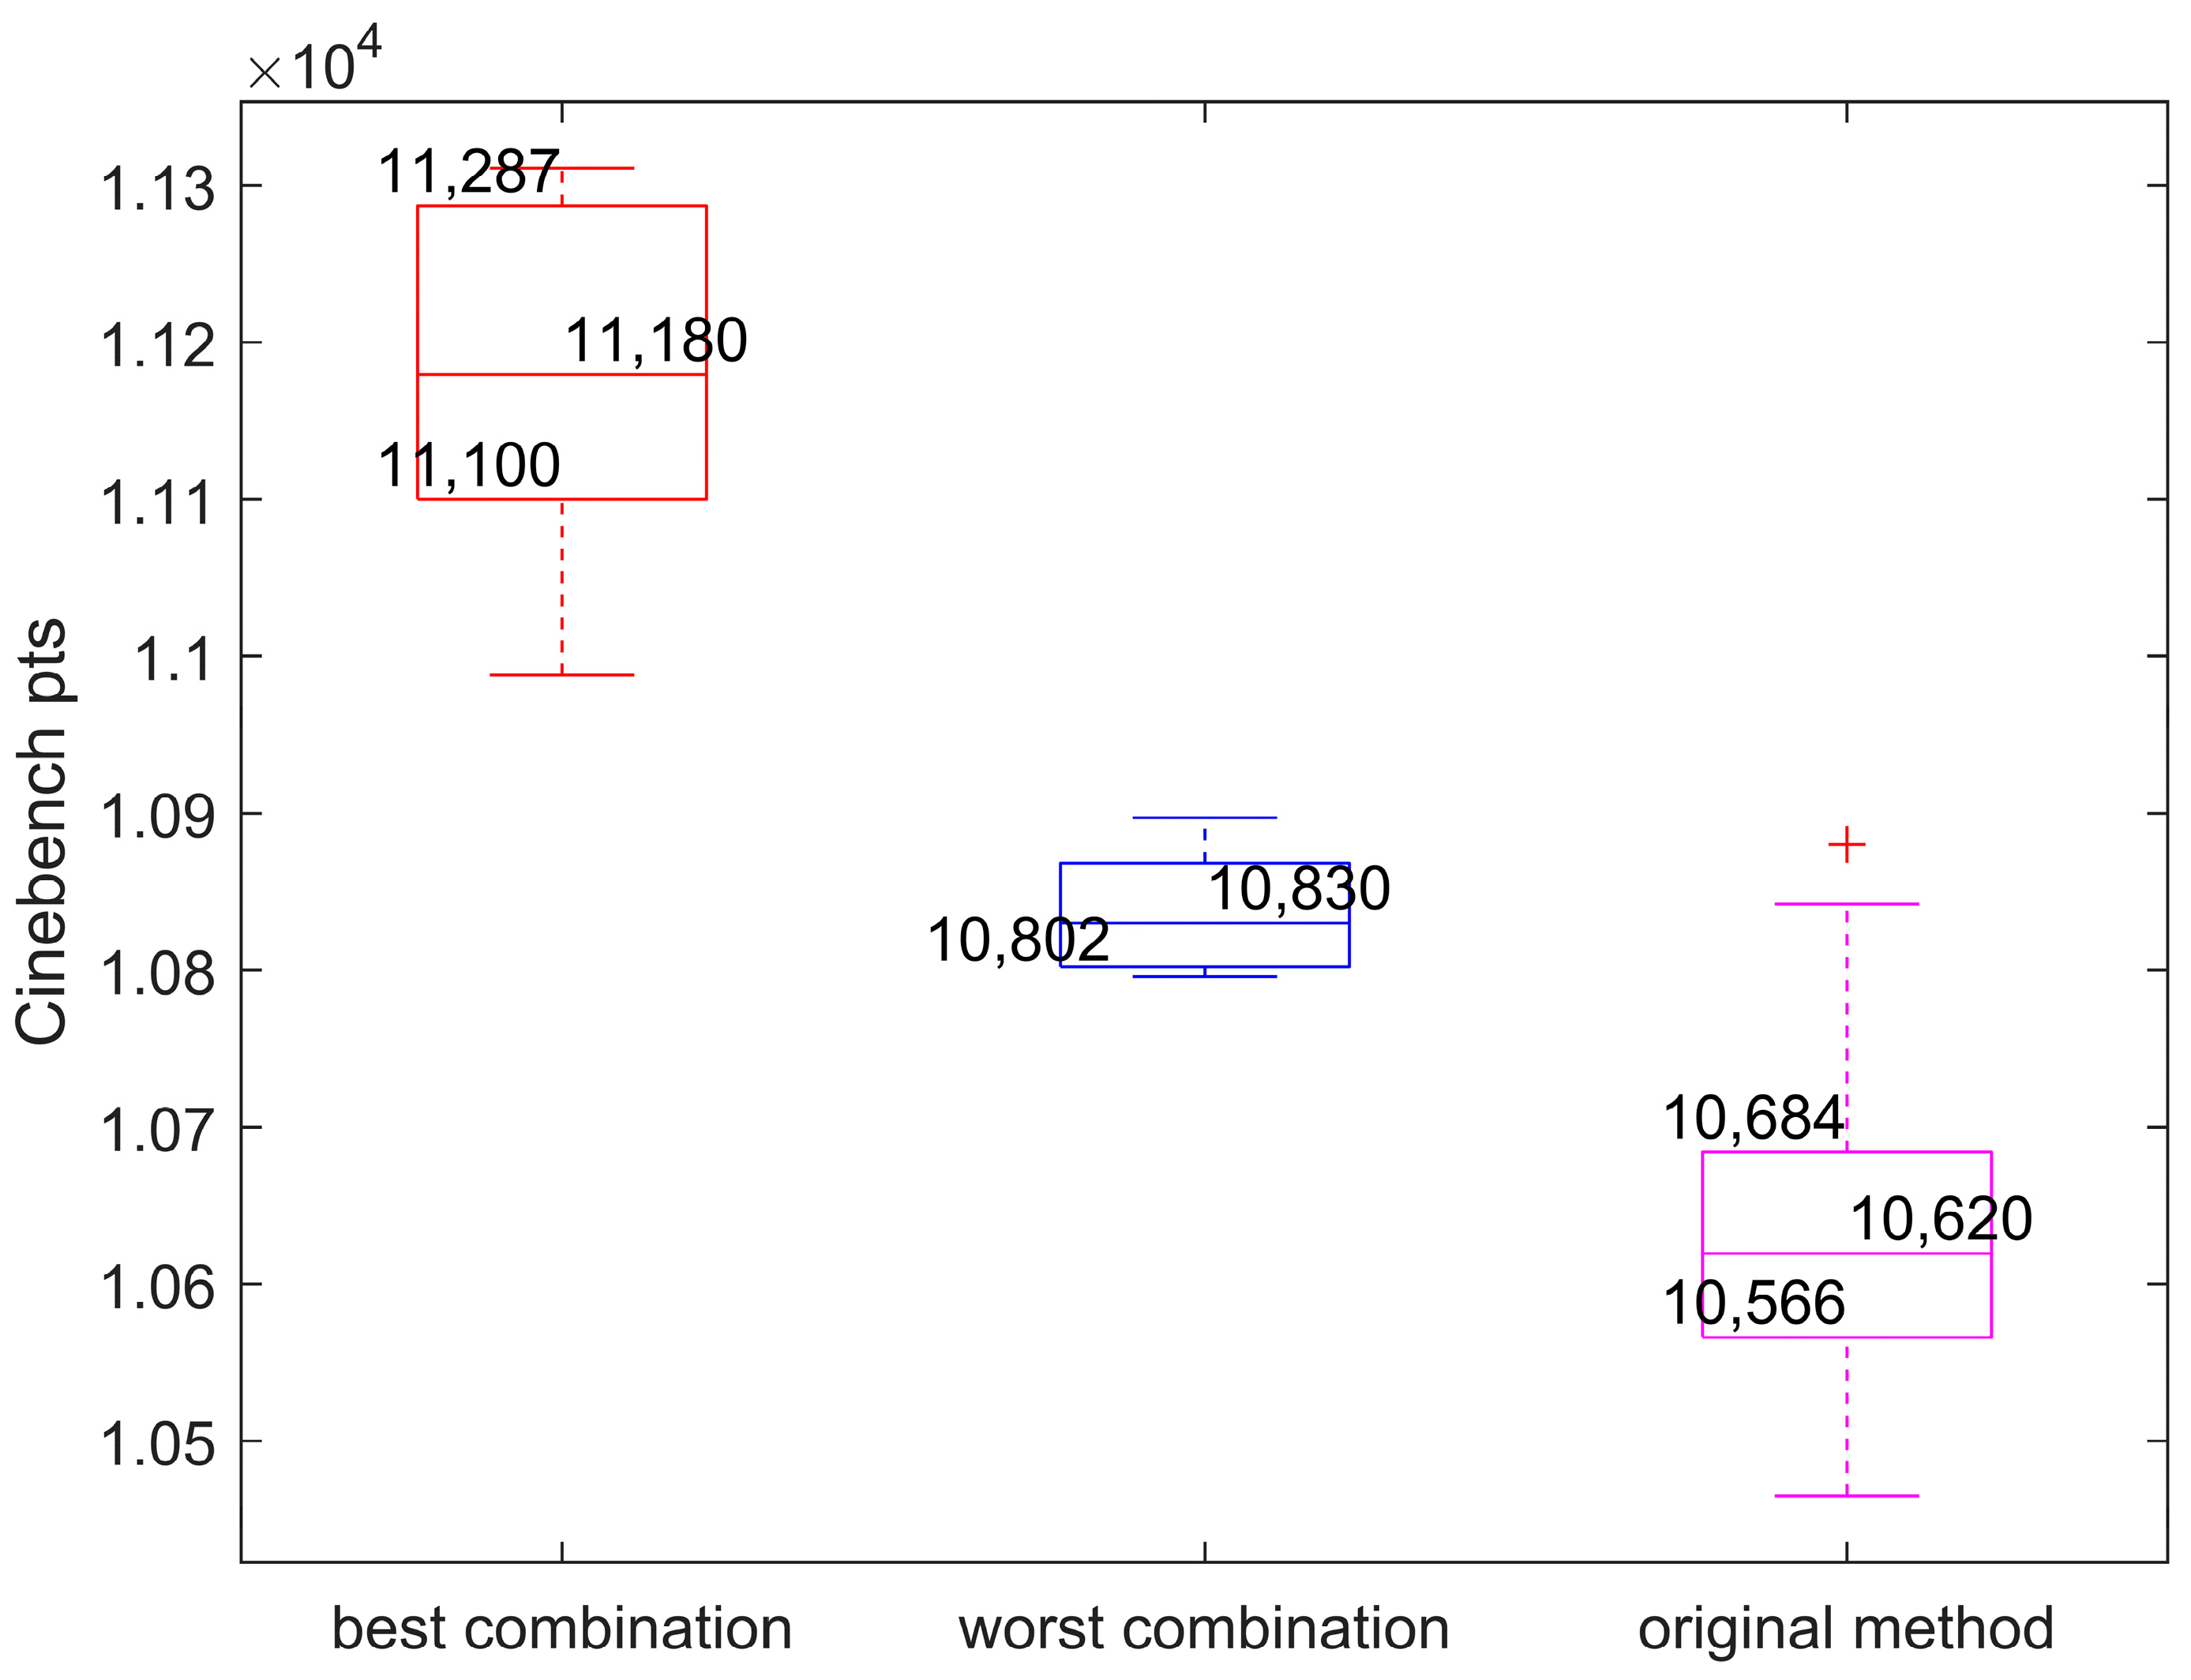
  • This study identifies the best combination of control factors that leads to a significant improvement in CPU performance, with an observed increase of approximately 5%. Despite a slight increment of 0.35% in power consumption, the overall benefits in terms of enhanced performance outweigh the minimal increase in power usage.

2. Materials and Methods

2.1. Experimental Materials

A laptop is considered as the experimental platform. The heat dissipation is performed by a heat dissipation copper tube with heat dissipation fins. In addition, a dual cooling fan is adopted as an active heat dissipation component. When internal waste heat is generated, the heat transfer fluid inside the copper tube will passively dissipate heat until the temperature triggers the fan start threshold. After the fan starts working, the heat accumulated in the thermal copper tube will pass through the heat vent in the back cover of the laptop to allow the fan to absorb cold air. Thus, the hot air is discharged through the rear or side heat vent to complete the active heat dissipation.
In commercially available computers, most of the hardware control comes from the embedded controller (EC). For example, the IT55xx series developed by ITE is a 16-bit single-chip microcomputer that is responsible for controlling the timing of the most important signals during the system opening process. In a laptop, the embedded controller continues to operate and waits for the user’s power-on information, regardless of whether the power is on or off, as long as the battery and adapter are not completely removed. In this work, the EC is responsible for the monitoring of the power, battery, and hardware statuses. In detail, the EC communicates with the charger’s IC through the I2C transmission protocol to control the battery’s charging/discharging and the related performance of power consumption. This allows the EC to effectively manage the use of power and batteries, ensuring their performance and durability. The embedded controller can also monitor the temperature of the computer to avoid damage caused by overheating. Some protective measures can be taken if necessary, such as turning the power off or reducing system performance. In addition, the EC can automatically adjust the fan speed to ensure proper heat dissipation. There are many charging management ICs from different brands. In this work, the BQ2572X series, developed by Texas Instruments, is adopted. Based on the arrow-voltage direct charge (NVDC) charging architecture, which can calculate and report the system power (Psys), the latter can be obtained. The CPU used in this work is the 12th generation mobile processor launched by Intel in 2021, in which the basic power consumption and maximum power consumption are crucial parameters that should be paid attention to.

2.2. Hardware and Signal Architecture

Usually, the adjustment of fan speed is mainly based on thermal conditions inside the laptop. If the temperature increases, the fan speed increases more to dissipate the thermal heat. In this work, the system power is considered to further improve the heat dissipation performance, as shown in Figure 1.
In Figure 1, the embedded controller (EC) generates the required PWM signal for fan speed control, and the real fan speed feeds back to the EC. Based on the temperature, system power, and measured fan speed, the EC can transmit the proper voltage and current settings to the charger’s IC for power management. The system power can be calculated as follows:
P s y s = V a d × I a d + V b a t × I b a t
where V a d and I a d are the voltage and current provided by the adapter. In addition, V b a t and I b a t are the voltage and current provided by the battery.
In this paper, debounce time settings are also used for piecewise speed increasing or decreasing. To further improve the heat dissipation performance, the adjusting rules for the fan speed proposed in this work are summarized in Table 1. In Table 1, both the thermal and system power conditions are considered. To explain how the operating mechanism works, the scenarios with and without consideration of system power are illustrated, respectively. Based on the original method, the adjustment of the fan speed mainly relies on the thermal conditions only. For example, when the temperature reaches 44 °C, triggered 20 times and once a second, then the situation switches from stage 0 to stage 1, and the fan’s speed is changed to 2300/2200 rpm. Similarly, at stage 2, as the temperature reaches 48 °C, triggered 15 times, the status switches to stage 3, i.e., the fan’s speed changes to 2950/2750 rpm. The slowing-down situation can be operated similarly. In the modified strategy, the system power (Psys) is taken into consideration. When the Psys reaches 65 W, the fan speed jumps up one step every three seconds to the fourth level (3300/3080 rpm). As for the slowing down of the speed, when the Psys drops below 52 W, the fan speed will drop by one stage every four seconds. The new settings keep the same operation scenario based on thermal conditions alone. Particularly, the modified fan speed adjustment takes the Psys as one more parameter to adjust the fan speed. The feasibility and the performance will be validated later.
To analyze the performance of CPU loading and thermal dissipation, some tools are available to provide insights into these aspects. In this work, BurnInTest is used to simulate a CPU-loading environment. BurnInTest generates a significant load on the CPU, which can lead to increased temperatures. This is useful for testing the effectiveness of the cooling system and ensuring that the CPU remains within safe temperature limits. In addition, the Intel Thermal Analysis Tool (TAT) is used to validate, analyze, tune, and debug the thermal, power, and performance features for the Intel platform on multiple OS. The power and thermal analysis tool (PTAT), developed by Intel, is used to monitor CPU data. Moreover, Cinebench R23, a benchmarking tool developed by MAXON, is used to assess the performance of a computer’s CPU. The scheme diagram of the experimental system is shown in Figure 2. The functional descriptions of the experimental tools are summarized in Table 2. In Figure 2, the Cinebench point represents the CPU performance, with higher scores indicating better performance. It serves as a standardized metric for comparing the rendering capabilities of different CPUs across various systems and configurations. The residual state of charge (RSOC) refers to the remaining charge in a battery, providing valuable information about its current state and available energy. In addition, pulse-width modulation (PWM) refers to the speed control command generated from the laptop to the cooling fans.

2.3. Taguchi Experiment Arrangement

In the following Taguchi experimental analysis, the ambient temperature is considered as the noise factor, and the control factors are the fan speed, system power, and debounce time. The system diagram is shown in Figure 3.
In this work, there are three control factors, and each control factor has three levels, as shown in Table 3. Thus, the L9 orthogonal table is applied for the Taguchi experiment analysis. On this basis, the test result score of the Cinebench pt is the quality factor. The higher the Cinebench point, the better the operation’s performance. In practice, the ambient temperature is added as a noise factor, so that the analysis results will be closer to the real situation. The experimental results regarding the designated orthogonal table will be discussed later.
Referring to Table 3, there are nine combinations of control factors. Let the relative responses, Cinebench points, be listed as y i , i = 1 ,   2 , , n , where the value n represents the number of experiments corresponding to the combination of control factors. The notation y ¯ represents the average value, and S/N is the signal-to-noise ratio. The relative S/N values can be obtained using Equations (2)–(4). Under the larger-the-better criterion in the Taguchi method, higher S/N values indicate better performance or quality.
y ¯ = 1 n i = 1 n y i
s 2 = n n 1 i = 1 n ( y i y ¯ ) 2
S N = 10 log 10 1 n i = 1 n 1 y i 2

3. Results

3.1. Stress Test Experiments

During a stress test, various parameters, such as temperature, power consumption, and system performance, are monitored and analyzed to identify any potential issues. Performing a stress test with the CPU working at full load allows for the evaluation of its stability, thermal performance, and overall reliability under heavy workload conditions. In the following stress tests, the CPU works with full loading during the first 600 s, after which the CPU loading returns to normal levels.
After conducting multiple experiments at room temperature, the conditions of fan operations can be divided into two situations, where the maximum speeds attained are 3300/3080 rpm and 3710/3520 rpm, respectively. The corresponding experiment results of the package power, system power, temperature, and fan speed are shown in Figure 4 and Figure 5, respectively. It can be seen that both cases have the same situation about the package power in the first 90 s. During the first 90 s, the package power rises to PL2 and then goes back to PL1, but the fan does not perform any actions for active heat dissipation. The reason for the inactivity of the fans can be observed from the variation in temperature, where the rise in temperature is quite smooth. Here, we can consider the delay time of the fan to be 90 s. To reduce the delay time of the fan and to be closer to the CPU load, the parameter Psys is considered as another decision factor for the fan’s operation. In this work, the setting condition is 3300/65/3/52/4, i.e., the starting fan speed is 3300 rpm, the threshold of the Psys is 65 W, and the debounce time is 3 s. Based on the improved scenario, the experimental results are shown in Figure 6. It is clear that the idle time of the cooling fans can be effectively reduced.
After performing the testing six times with the original and the new and improved systems, the averaged package powers are shown in Figure 7. It can be observed that the package power under the new system is higher than that of the original system before the beginning of 200 s. This implies that the CPU performance of the new system is better. This observation is consistent with the results of Cinebench tests. Basically, the higher the Cinebench point, the better the performance of the hardware being tested. As shown in Table 4, there was a 2.1% increase in Cinebench points for the new system compared to the original system. The Cinebench point of the new system increased by 2.1%. From the BurnInTest results and the Cinebench tests, it can be concluded that the higher the package power, the higher the Cinebench points.
In addition, it was verified that having a high or low battery capacity did not have much effect on the quality performance, as shown in Table 5. It can be seen that there exists a very small difference between the average Cinebench points of 100% and 50% residual state of charge (RSOC). In the following Taguchi experiments, we focus on the quality variations due to the conditions of fan speed, Psys, and debounce time.

3.2. Taguchi Experimental Results

In the following Taguchi experimental analysis, the ambient temperature is considered as the noise factor, and the control factors are the fan speed, system power, and debounce time. In this work, the L9 orthogonal table is used for Taguchi experimental analysis. There are nine combinations of control factors, shown in Table 6. The relative Cinebench points are listed as y i , i = 1 ,   2 ,   3 . The notation y ¯ represents the average value, and S/N is the signal-to-noise ratio. It is noticed that, for each case of control factors, the corresponding experiments have been performed five times. With the data trimming, the rest of the three outcomes are used for the following computation of mean-averaged and S/N values. From (2)–(4), the S/N values can be obtained as in Table 6.
From Table 6, the S/N analysis regarding the individual control factor is summarized in Table 7 and Figure 8 concerning the ambient temperature of 25 °C. Similarly, the S/N analyses corresponding to other ambient temperatures are shown in Table 8 and Table 9 and Figure 9 and Figure 10. From the experimental results, the biggest factor influencing the quality factor is the fan speed, followed by the debounce time, and finally the system power consumption trigger condition. For example, at the ambient temperature of 25 °C, the ΔS/N of the fan speed is 0.14, while the ΔS/N of the debounce time and system power are 0.06 and 0.04, respectively.
Furthermore, the Taguchi experiments were conducted at different temperatures corresponding to the L9 factor combination, shown in Table 10. It can be observed that, in the environment of 25 °C~27 °C, the fan speed affects the overall mass factor with the maximum ΔS/N = 0.14. The impact analyses of each control factor on the S/N ratio are summarized in Table 11 and Figure 11. Obviously, the ΔS/N of the fan speed factor is more significant than the other two factors.

3.3. Confidence Verification

From Figure 11, the combination of the best quality factor is 3710/55/2, meaning that the fan speed is 3710 rpm, the Psys value is 55 W, and the debounce time is 2 s. From [29], the corresponding predicted S/N can be obtained as 80.83. The calculation details can be found in Equations (5) and (6).
S / N ¯ = 1 9 i = 1 9 ( S / N ) i
( S / N ) p r e d i c t = ( S / N ) s p e e d _ L 3 + ( S / N ) P s y s _ L 1 + ( S / N ) d e b o u n c e _ L 1 ( 9 3 ) S / N ¯
where ( S / N ) s p e e d _ L 3 is the S/N ratio corresponding to the level 3 fan speed, i.e., ( S / N ) s p e e d L 3 = 80.79 . Similarly, ( S / N ) P s y s _ L 1 = 80.72 and ( S / N ) d e b o u n c e _ L 1 = 80.73 .
In addition, the worst combination of the control factors is 2950/70/4. Similarly, from Equations (5) and (6), the worst predicted S/N can be obtained as 80.65. To verify the confidence of the addressed Taguchi experiment settings, the experiments of the best and worst combinations with respect to ambient temperature are shown in Table 12 and Table 13, respectively. The S/N ratio of the best combination is 80.85, and the S/N of the worst combination is 80.67. In each case, the difference between the experimental S/N and the predicted S/N is less than 0.03%. Because the experimental results align with the predicted values, it indicates the effectiveness of the chosen factor levels in optimizing performance.

3.4. Comparison Results

After the verification of confidence, it can be seen that there is no problem with the experimental design, so the best combination and worst combination systems and the original system are taken to undergo multiple statistical analyses, and the results are shown in Table 14 and Figure 12.
The results of Taguchi’s experiment and confidence verification show that the design and process of the experiment are correct. To quantify the influence of controllable factors on quality factors, the variation analysis formula is used to calculate and obtain quantitative results. From the experimental results, in the best combination of 3710/55/2, through confidence regression verification, the measured value of the S/N ratio differs by 0.02% from the estimated value, which is very small, and it can be considered that the experimental planning and testing method is correct. After many Cinebench running scores, the average running score reached 11,177 pts, an increase of 4.96% compared with the original system. In addition, in the verification of the worst combination, 2950/70/4, the measured value differed by 0.02% from the estimated S/N, which once again confirmed that the experiment was correct. The average running score was 10,835 pts, an increase of 1.75% compared with the original system.

4. Discussion

4.1. Taguchi Controllable Factors

In this work, the fan speed, system power, and debounce time are three controllable factors conducted in the Taguchi experiments. From the experimental results, fan speed has the greatest impact on laptop heat dissipation among the controllable factors. For the remaining two controllable factors, the debounce time has a little higher impact than that of the system power (Psys). For more details, the experimental results are grouped together along with the fan speed and shown in Figure 13. According to concepts in thermodynamics, the heat transfer coefficient with a cooling fan is much higher than in a situation without a cooling fan. In practice, the higher the fan speed, the better the heat dissipation capacity. From Figure 13, it can be found that, at the same speed, the smaller the debounce time, the shorter the delay time of the fan. Equivalently, the fan will start earlier when the debounce time is smaller.
The setting of the debounce time will also affect the transient responses of cooling fans. For example, the fan speed will meet the speed setting in a shorter time with a smaller debounce time compared to the situation with a larger debounce time. For example, in the case of 3300/70/4, it takes about 55 s to approach a fan speed of 3300 rpm; however, in the case of 3300/55/2, it takes about 20 s to reach the setting of the fan speed, as shown in Figure 13b. In addition, under lower Psys, the desired fan speed will be more easily attained. In general, the natural convective heat transfer coefficient is often smaller than the forced convective heat transfer coefficient. Depending on whether the fan is turned on or not, the heat energy dissipated by the system can be 4~5 times different, and the subsequent set speed will also continue to affect the heat dissipation quality. In summary, the fan speed has the greatest impact on the CPU heat dissipation, followed by the debounce time, and then the system power consumption trigger condition, which is aligned with the experimental results.

4.2. Cost Analysis

Furthermore, the electricity cost of the fan operation will be addressed. First, the experimental system is initially idle, then the fan speed is set to be 2750, 3300, and 3710 rpm, respectively, as shown in Figure 14. During the 120 s period, the fan turns on for the first 60 s and then turns off for the next 60 s. The energy difference between these two intervals can be considered as the energy consumption of the fan. The measured power consumption per second can be obtained as in Table 15.
To estimate the cost of operating a fan under the optimal combination of control factors 3710/55/2, the following scenarios are considered. First, in a 10 min test of Cinebench, the average power consumption of the system is 62 W per second, and the total energy consumption is 37.2 KJ. Referring to Figure 4 and Figure 5, the delay time between two fans is 80 s. Thus, from Table 14, the energy cost of a fan is 114.4 J, which is about 0.35% of the total system energy consumption. In this work, the test platform is equipped with a battery with a capacity of 80 Wh, which is equivalent to about 288 KJ. The previously mentioned energy cost is 114.4 J, which is approximately 0.05% of the overall battery capacity. In summary, the operating cost is extremely low with the improved fan control settings.

5. Conclusions

In this paper, a way to improve the heat dissipation of a laptop has been discussed. Based on the Taguchi method, the CPU performance can be improved when the system power is newly considered a factor for experiment settings. From the experimental results, it can be concluded that the fan speed is a major factor in heat dissipation, followed by the debounce time, and then the trigger condition of the system power. To verify the confidence of the experimental arrangements, the related testing results indicate that the predicted S/N is very close to the experimental S/N. This means that the experimental results are aligned with the predicted results. Based on the experimental conditions and factors considered, they suggest that increasing the fan speed has a positive impact on the desired heat dissipation. Under the same fan speed, the delay in fan starting becomes shorter subject to a lower debounce time. Furthermore, the fan will approach the predefined fan speed earlier if the system power designated for the fan triggering is smaller. In a cost-effective analysis related to a working fan, the energy consumption can be determined by calculating the energy difference between the fan in an idle state and the fan in operation. The measurement results indicate that the energy cost of a working fan is about 0.35% of the energy consumption of the overall system. This means that the cost associated with operating the fan is low compared to the total energy consumption of the entire system. In conclusion, from the results of the Taguchi experiment and cost analysis, the optimization of the fan speed, debounce time, and trigger condition of the system power improve the heat dissipation of a laptop. The cost of introducing the functionality of the new system is small, and the benefits are significant. Overall, the best combination of control factors can result in an approximately 5% improvement in CPU performance. Despite an increment of 0.35% in power consumption, the benefits in terms of enhanced performance outweigh the slight increase in power usage. Therefore, it is possible to continue to use this newly improved system in future products to improve the thermal performance and overall system performance.

Author Contributions

Conceptualization, Y.-H.C. and C.-H.C.; methodology, Y.-H.C. and C.-H.C.; software, C.-H.C.; validation, Y.-H.C. and H.-W.L.; formal analysis, Y.-H.C. and C.-H.C.; investigation, Y.-H.C. and C.-H.C.; resources, C.-H.C.; data curation, C.-H.C.; writing—original draft preparation, Y.-H.C. and C.-H.C.; writing—review and editing, Y.-H.C. and H.-W.L.; visualization, Y.-H.C. and C.-H.C.; supervision, Y.-H.C. and H.-W.L. All authors have read and agreed to the published version of the manuscript.

Funding

This research received no external funding.

Data Availability Statement

Data are contained within the article.

Conflicts of Interest

The authors declare no conflicts of interest.

References

  1. Aglawe, K.R.; Yadav, P.K.; Thool, S.B. Current technologies on electronics cooling and scope for future improvement: A typical review. In Proceedings of the International Conference on Industrial and Manufacturing Systems, Jalandhar, India, 26–28 June 2020. [Google Scholar]
  2. Liu, C.; Yu, H. Experimental investigations on heat transfer characteristics of direct contact liquid cooling for CPU. Buildings 2022, 12, 913. [Google Scholar] [CrossRef]
  3. Wang, H.; Gan, Y.; Li, R.; Liu, F.; Li, Y. Experimental study on the thermal performance of a liquid-cooled heat sink integrating heat pipes for dual CPU servers. Appl. Therm. Eng. 2024, 236, 121851. [Google Scholar] [CrossRef]
  4. Saleh, M.; Bellouf, Y.; Boutera, Y.; Chamkha, A.; Sahraoui, A.; Hroub, Q. A new design for a heat sink within a convex-parabolic microchannel filled with hybrid nanofluid for cooling Core I7 CPU. J. Therm. Anal. Calorim. 2023, 148, 11315–11324. [Google Scholar] [CrossRef]
  5. Souby, M.; Salman, M.; Prabakaran, R.; Kim, S.C. Hydrothermal characteristics and irreversibility behavior of microchannel heat sink operated with hybrid nanofluids: A critical assessment. Case Stud. Therm. Eng. 2023, 49, 103387. [Google Scholar] [CrossRef]
  6. Pandi, K.; Jaganathan, V.M.; Suresh, S.; Krishnan, S.R.A. Experimental analysis and simulation of passive flexible heat transfer device. Int. J. Therm. Sci. 2024, 109, 108902. [Google Scholar] [CrossRef]
  7. Wang, J.X.; Qian, J.; NWang, N.; Zhang, H.; Cao, X.; Liu, F.; Hao, G. A scalable micro-encapsulated phase change material and liquid metal integrated composite for sustainable data center cooling. Renew. Energy 2023, 213, 75–85. [Google Scholar] [CrossRef]
  8. Ambreen, T.; Saleem, A.; Park, C.W. Pin-fin shape-dependent heat transfer and fluid flow characteristics of water- and nanofluid-cooled micropin-fin heat sinks: Square, circular, and triangular fin cross-sections. Appl. Therm. Eng. 2019, 158, 113781. [Google Scholar] [CrossRef]
  9. Sharma, A.K.; Bhattacharya, S.; Vishwakarma, D.K.; Dey, K. Numerical investigation on heat transfer in CPU heat sink by hybrid shaped pin-fins. Fluid Mech. Fluid Power 2023, 3, 429–435. [Google Scholar]
  10. Shuang Yuan, S.; Long, L.; Xu, K.; Zuo, P.; Ye, Z.; Meng, X.; Zhu, J.; Ye, H. Multi-objective optimization of thermal modules in high heat flux laptops. Appl. Therm. Eng. 2024, 239, 122105. [Google Scholar] [CrossRef]
  11. Xuzhou, G.; Zhang, J.; Ma, R.; Liu, Y. Novel heat pipe radiator for vertical CPU cooling and its experimental study. Int. J. Heat Mass Transf. 2019, 130, 912–922. [Google Scholar]
  12. Li, C.; Li, J. A dumbbell-shaped 3D flat plate pulsating heat pipe module augmented by capillarity gradient for high-power server CPU onsite cooling. Energy Convers. Manag. 2023, 292, 117384. [Google Scholar] [CrossRef]
  13. Changning Xiong, K.; Meng, L.; Wang, S. Design, fabrication, investigation and analysis of a novel flat evaporator loop heat pipe for cooling high heat flux server chips. Appl. Therm. Eng. 2022, 201, 117775. [Google Scholar] [CrossRef]
  14. Wang, Y.; Wang, J.; He, X.; Duan, J. Experimental investigation of the thermal performance of a heat sink with U-shaped heat pipes. Appl. Therm. Eng. 2021, 186, 116387. [Google Scholar] [CrossRef]
  15. Shang, F.; Yang, Q.; Fan, S.; Liu, C.; Liu, J. Experimental study on novel pulsating heat pipe radiator for horizontal CPU cooling under different wind speeds. Therm. Sci. 2022, 26, 449–462. [Google Scholar] [CrossRef]
  16. Rahimi, P.; Singh, A.K.; Wang, X. Fan speed control-based defense for thermal covert channel attacks in multi-core systems. In Proceedings of the 29th IEEE International Conference on Electronics, Circuits and Systems, Glasgow, UK, 24–26 October 2022. [Google Scholar]
  17. Kuncoro, I.W.; Pambudi, N.A.; Biddinika, M.K.; Budiyanto, C.W. Optimization of immersion cooling performance using the Taguchi method. Case Stud. Therm. Eng. 2020, 21, 100729. [Google Scholar] [CrossRef]
  18. Huang, C.-Y.; Shen, L.-C.; Chan, C.J.; Wang, C.-H. Applying Taguchi method to optimize vacuum printing encapsulation process. IEEE Trans. Compon. Pack. Manuf. Technol. 2022, 12, 185–191. [Google Scholar] [CrossRef]
  19. Peng, X.; Kong, L.; Sun, X.; Lyu, H. Design and analysis of optical receiving antenna for LED visible light communication based on Taguchi method. IEEE Access 2019, 7, 186364–186367. [Google Scholar] [CrossRef]
  20. Le, D.-V.; Go, B.-S.; Song, M.-G.; Park, M.; Yu, I.-K. Design of an electromagnetic induction coilgun using the Taguchi method. IEEE Trans. Plasma Sci. 2018, 46, 3612–3618. [Google Scholar] [CrossRef]
  21. He, J.; Li, G.; Zhou, R.; Wang, Q. Optimization of permanent-magnet spherical motor based on Taguchi method. IEEE Trans. Magn. 2020, 56, 8200107. [Google Scholar] [CrossRef]
  22. Lee, I.; Yang, N.-C. Using Taguchi method to determine the optimum conditions for synthesizing parapyruvate. Molecules 2022, 27, 1870. [Google Scholar] [CrossRef]
  23. Chen, W.H.; Uribe, M.C.; Luo, D.; Jin, L.; Saw, L.H.; Lamba, R. Taguchi optimization and analysis of variance for thermoelectric generators with forced convection air cooling. Appl. Therm. Eng. 2023, 231, 120878. [Google Scholar] [CrossRef]
  24. Sun, X.; Shi, Z.; Zhu, J. Multiobjective design optimization of an IPMSM for EVs based on fuzzy method and sequential Taguchi method. IEEE Trans. Ind. Electron. 2021, 68, 10592–10600. [Google Scholar] [CrossRef]
  25. Ngo, M.T.; Hoang, V.; Hoang, S.V. Taguchi-fuzzy multi-response optimization in fly cutting process and applying in the actual hobbling process. Int. J. Mech. Mater. Eng. 2018, 13, 6. [Google Scholar] [CrossRef]
  26. Lan, T.-S.; Chuang, K.-C.; Chen, Y.-M. Optimization of machining parameters using fuzzy Taguchi method for reducing tool wear. Appl. Sci. 2018, 8, 1011. [Google Scholar] [CrossRef]
  27. Yang, C.-D.; Luo, C.-C.; Liu, S.-J.; Chang, Y.-H. Applications of genetic-Taguchi algorithm in flight control designs. J. Aerosp. Eng. 2005, 18, 232–241. [Google Scholar] [CrossRef]
  28. Li, Y.; Shieh, M.-D.; Yang, C.-C.; Zhu, L. Application of fuzzy-based hybrid Taguchi method for multiobjective optimization of product form design. Math. Probl. Eng. 2018, 2018, 9091514. [Google Scholar] [CrossRef]
  29. Venkata Vishnu, A.; Jamaleswara Kumar, P. Investigations on high-speed machining of EN-353 steel alloy under different machining environments. IOP Conf. Series Mater. Sci. Eng. 2018, 330, 012085. [Google Scholar] [CrossRef]
Figure 1. Scheme diagram of the fan speed adjustment based on temperature and system power.
Electronics 13 00882 g001
Figure 2. Scheme diagram of the experimental system.
Electronics 13 00882 g002
Figure 3. Experiment-related quality factors.
Electronics 13 00882 g003
Figure 4. BurnInTest results with the original method (fan speeds: 3300/3080 rpm).
Electronics 13 00882 g004
Figure 5. BurnInTest results with the original method (fan speeds: 3710/3520 rpm).
Electronics 13 00882 g005
Figure 6. BurnInTest results with the improved method (fan speeds: 3300/3080 rpm).
Electronics 13 00882 g006
Figure 7. Averaged package power consumption of original and new methods.
Electronics 13 00882 g007
Figure 8. Impact analysis of control factors on S/N ratio (T = 25 °C).
Electronics 13 00882 g008
Figure 9. Impact analysis of control factors on S/N ratio (T = 26 °C).
Electronics 13 00882 g009
Figure 10. Impact analysis of control factors on S/N ratio (T = 27 °C).
Electronics 13 00882 g010
Figure 11. Impact analysis of control factors on S/N ratio corresponding to different temperatures.
Electronics 13 00882 g011
Figure 12. Variations in the Cinebench points corresponding to different combinations.
Electronics 13 00882 g012
Figure 13. Fan speed curves: (a) 2950 rpm, (b) 3300 rpm, (c) 3710 rpm.
Electronics 13 00882 g013
Figure 14. Experimental results for the energy consumption of working fans.
Electronics 13 00882 g014
Table 1. Improved fan speed control based on thermal and Psys conditions.
Stage012345678
Fan 1 speed (rpm)off23002530295033003710410044604980
Fan 2 speed (rpm)off22002330275030803520390042604780
ThermalSpeed up: Temp (°C)44464850555860
Speed up: debounce (s)20201515787
Slow down: Temp (°C) 404244464850
Slow down: debounce (s) 55 555555
PsysSpeed up: Psys (W)65
Speed up: debounce (s)3333
Slow down: Psys (W) 52
Slow down: debounce (s) 4444
Table 2. Description of the tools used in experimental system.
ToolFunction
Cinebench R23Adjust the computation load of CPU and assess the CPU performance
EC toolkitMonitor the RSOC and fan speed
Intel PTATAdjust power delivery and performance based on real-time temperature measurements
Test firmwareControl and extract the fan speed
Table 3. Levels of control factors.
Fan Speed
(rpm)
Psys
(W)
Debounce Time
(s)
Level 12950552
Level 23300653
Level 33710704
Table 4. Comparison of Cinebench points.
Cinebench pts
123456Average
Original10,88010,68410,56810,65510,55810,67910,671
New11,15210,57910,59411,01911,18010,84710,895
Table 5. Comparison of Cinebench points under different battery capacities.
RSOCCinebench pts
123456Average
100%11,15210,57910,59411,01911,18010,84710,895
50%10,82410,88410,96610,90510,80511,02010,884
Table 6. L9 orthogonal array table (Temp = 25 °C).
Temp = 25 °C
Fan SpeedPsysDebounce Time y 1 y 2 y 3 y ¯ S/N
1330065310,94210,93410,94710,94180.78
2330055211,03510,98810,98011,00180.83
3330070410,87210,84310,81310,84380.70
4295065210,84210,87810,85510,85880.72
5295055410,90410,91510,87710,89980.75
6295070310,84910,84410,84410,84680.71
7371065410,95111,02911,04711,00980.83
8371055310,88411,13511,12911,04980.87
9371070211,08511,13011,20011,13880.92
Table 7. S/N ratio and control factor (temp = 25 °C).
LevelFan SpeedS/NPsysS/NDebounce TimeS/N
1295080.735580.82280.82
2330080.776580.78380.79
3371080.877080.78480.76
Table 8. S/N ratio and control factor (temp = 26 °C).
LevelFan SpeedS/NPsysS/NDebounce TimeS/N
1295080.615580.68280.68
2330080.646580.68380.67
3371080.787080.66480.67
Table 9. S/N ratio and control factor (temp = 27 °C).
LevelFan SpeedS/NPsysS/NDebounce TimeS/N
1295080.645580.67280.69
2330080.676580.67380.67
3371080.707080.67480.65
Table 10. Taguchi experimental results corresponding to different temperatures.
Fan SpeedPsysDebounce Time 25   ° C 26   ° C 27   ° C y ¯ S/N
1330065310,94110,78010,80010,84080.70
2330055211,00110,75910,83710,86680.72
3330070410,84310,74310,80010,79580.66
4295065210,85810,73210,78810,79380.66
5295055410,89910,73710,73610,79180.66
6295070310,84610,68510,77510,76980.64
7371065411,00910,98010,82210,93780.78
8371055311,04910,93410,84010,94180.78
9371070211,13810,95910,85210,98380.81
Table 11. Summary of S/N corresponding to control factors.
LevelFan SpeedS/NPsysS/NDebounce TimeS/N
1295080.655580.72280.73
2330080.696580.71380.71
3371080.797080.70480.70
Table 12. Experimental results with best combination.
Best CombinationCinebench pts
25   ° C 26   ° C 27   ° C
Fan speed (rpm)371011,16711,00210,907
Psys (w)5511,15610,95010,882
Debounce time (s)211,30410,99110,887
S/N = 80.85
Table 13. Experimental results with worst combination.
Worst CombinationCinebench pts
25   ° C 26   ° C 27   ° C
Fan speed (rpm)295010,89210,80610,729
Psys (W)7010,86010,76910,738
Debounce time (s)410,87710,77510,725
S/N = 80.67
Table 14. Comparisons between different combinations.
Cinebench pts
12345678910Average
Best conbination11,01211,10011,16711,15611,30411,25111,28711,31110,98811,19211,177
Worst combination10,86810,81010,82510,80010,80210,88110,83710,87910,83510,79610,835
Original method10,88010,68410,56810,65510,55810,67910,84210,58410,56610,46510,648
Table 15. Comparison of power consumption.
Fan Speed (rpm)295033003710
Idle system power consumption (W)9.769.899.87
Operational system power consumption (W)10.4910.9211.3
Operational fan power consumption (W)0.731.031.43
Disclaimer/Publisher’s Note: The statements, opinions and data contained in all publications are solely those of the individual author(s) and contributor(s) and not of MDPI and/or the editor(s). MDPI and/or the editor(s) disclaim responsibility for any injury to people or property resulting from any ideas, methods, instructions or products referred to in the content.

