Abstract
In recent years, the informatization of the educational system has caused a substantial increase in educational data. Educational data mining can assist in identifying the factors influencing students’ performance. However, two challenges have arisen in the field of educational data mining: (1) How to handle the abundance of unlabeled data? (2) How to identify the most crucial characteristics that impact student performance? In this paper, a semi-supervised feature selection framework is proposed to analyze the factors influencing student performance. The proposed method is semi-supervised, enabling the processing of a considerable amount of unlabeled data with only a few labeled instances. Additionally, by solving a feature selection matrix, the weights of each feature can be determined, to rank their importance. Furthermore, various commonly used classifiers are employed to assess the performance of the proposed feature selection method. Extensive experiments demonstrate the superiority of the proposed semi-supervised feature selection approach. The experiments indicate that behavioral characteristics are significant for student performance, and the proposed method outperforms the state-of-the-art feature selection methods by approximately 3.9% when extracting the most important feature.
1. Introduction
Data mining, as a powerful tool for information extraction, aims to discover potential patterns, associations, and knowledge from large-scale datasets, providing strong support for decision-making and problem-solving [1,2,3]. Its application covers various fields such as business, healthcare, and machine learning [4,5,6,7], specifically used in technologies of non-negative matrix factorization [8,9], multi-view clustering [10,11]. In the field of education, the use of data mining techniques is also becoming increasingly widespread [12,13]. With the increased popularity of digital teaching and online learning tools, the data generated by students is growing rapidly during the learning process. The application of data mining technology in the field of education involves analyzing extensive educational datasets to optimize the teaching process. This application is referred to as educational data mining (EDM) [14,15].
EDM encompasses the gathering of information from diverse outlets, including students’ academic achievements, online learning platform interactions, as well as scores from tests and assignments. Subsequently, data mining techniques are employed to unveil patterns, trends, and associations within these data [16]. This analytical process aids educators in gaining deeper insights into students’ learning methods, recognizing hurdles in their learning journeys, and offering tailored educational support and suggestions. Based on the results of EDM, educators can develop targeted instructional strategies and interventions for students’ learning needs and characteristics to enhance student learning outcomes [17,18].
In the field of education, collected labeled data are generally limited, typically encompassing student exam scores and personal background information. However, there are also a large amount of unlabeled data, such as students’ classroom performances and discussion records, which contain great potential information value but lack corresponding labeling [19]. The presence of abundant unlabeled data increases the complexity and difficulty of educational data mining tasks [20]. Therefore, it has become a critical challenge to effectively utilize unlabeled data, to discover patterns and regularities [21].
In the research on EDM, there has been a significant focus on the impact of different student characteristics on their academic performance [22]. Student characteristics encompass aspects such as the frequency of raising hands, online learning activities, and assignment submissions. There may be potential associations between these characteristics and students’ academic performance. By delving deeper into the relationship between different student characteristics and academic performance, this can help to understand students’ learning patterns and behavioral habits, and provide important clues for personalized education and student intervention [23]. The identification of the primary characteristics that influence student performance is an essential task in educational data mining. However, educational datasets often contain numerous irrelevant features that can negatively affect the accuracy of models. If a dataset contains many features, the corresponding model may encounter disruptions from redundant or noisy elements, leading to challenges in precisely assessing the influence of student characteristics on academic performance.
To tackle these issues, this paper introduces an approach called semi-supervised feature selection based on generalized linear regression (SFSGLR), with the objective of identifying the most critical characteristics influencing students’ academic performance. Specifically, the proposed method adopts the idea of semi-supervised learning to process a large amount of unlabeled data by using only a small number of labeled instances. This approach can efficiently utilize data resources and reduce the workload of manually labeling data. A feature-selection-based model is introduced to select the features that affect the academic performance of students. By solving a feature selection matrix, the importance of each feature for student performance is determined and ranked. Finally, to evaluate the performance of the proposed semi-supervised feature selection method, four popular classifiers were employed and extensive experiments were conducted. The experimental results indicated that the proposed method demonstrated superior performance in identifying key features, and it was found that behavioral features are crucial factors influencing students’ academic performance. This enables educators and policymakers to focus on such features to develop targeted teaching strategies and intervention measures.
The remaining sections of this paper are structured as follows: Section 2 provides the background. Section 3 introduces the materials and methods used in the paper. In Section 4, a semi-supervised feature selection method based on generalized linear regression is proposed. In Section 5, an optimization approach is designed to solve the proposed model. In Section 6, experiments are conducted to analyze the important characteristics and demonstrate the effectiveness of the proposed method. The conclusions are discussed in Section 7.
2. Background
With the development of the education field and the advancement of technology, EDM is rapidly emerging and has become a much-anticipated research direction in the field of education [24,25]. This section reviews the existing literature and research relevant to this paper’s topic, aiming to achieve a comprehensive understanding of the current state of research on the impact of student characteristics on academic performance.
2.1. Research on Student Performance Based on Semi-Supervised Learning
In [20], the authors employed various widely recognized semi-supervised methods to forecast the performance of high school students in the ’Mathematics’ module’s final exam. The experiment conducted in this study was divided into two stages. In each stage, the attributes of students in their first semester were first evaluated, followed by an evaluation of all attributes across two semesters. The evaluation employed semi-supervised algorithms such as self-training, co-training, tri-training, de-tri-training, and democratic co-learning. These algorithms were combined with several supervised classifiers, including naive Bayes (NB), C4.5 decision tree, K-nearest neighbors (KNN), and sequential minimal optimization (SMO). The experimental results revealed that self-training, tri-training, and co-training, among the semi-supervised methods, outperformed the commonly used supervised method (NB classifier). The work in [26] explored the effectiveness of semi-supervised methods in forecasting academic performance in distance higher education. The work in [27] utilized semi-supervised learning to classify the performance of first-year students. It adopted k-means clustering to classify students into three clusters and then used a naive Bayes classifier to classify them and predict student performance. The work in [28] investigated the role of social influence in predicting academic performance. The study first constructed students’ social relationships by analyzing their school behaviors and finding similarities in academic performance among friends. Next, a semi-supervised learning approach was used to build social networks to predict student achievement.
2.2. Research on Student Performance Based on Feature Selection Methods
The work in [22] proposed an academic performance classification model aimed at investigating the impact of student behavioral characteristics on academic performance in educational datasets. The study used the experience API (xAPI) tool to collect data and three common data mining methods (artificial neural networks (ANN), decision tree classifier (DT), and NB) to classify the data and assess student behaviors during the learning process and their impact on academics. The work in [29] employed four data mining techniques (NB, ANN, DT, and support vector machine (SVM)) for predicting students’ academic performance and identifying the features that impacted their learning outcomes. The results indicated that the SVM method exhibited a superior performance. The work in [30] aimed to establish an effective model for predicting students’ learning performance by discussing various data mining techniques. Four feature selection methods, including a genetic algorithm, gain ratio, relief, and information gain, were utilized to preprocess the data. Subsequently, five classification algorithms, namely KNN, NB, bagging, random forest, and J48 decision tree, were employed to analyze and evaluate the students’ performance. The experimental results demonstrated that the combination of a genetic algorithm and KNN classifier exhibited the best accuracy measurement compared to other the methods.
3. Material and Methods
3.1. Notations and Definitions
Some notations and definitions are summarized in Table 1. In this paper, scalars are written as lowercase letters, vectors are written as boldface lowercase letters, and matrices are written as boldface uppercase letters.
Table 1.
Notations and Definitions.
3.2. Research Methodology
The workflow for semi-supervised feature selection of educational data mining for student performance analysis is shown in Algorithm 1.
First, pro-processing is performed on the data , where m is the number of the features, n is the number of the samples. The original educational data matrix always contains some texts, and it is hard to employ directly for feature selection based on generalized linear regression. Thus, the texts are replaced by numerical values to obtain a numerical dataset . Then, in order to reduce the influence of certain samples with large values, normalization is employed on j-th column using .
Second, the proposed semi-supervised feature selection method is employed to obtain a feature selection matrix , where c is the number of classifications. The feature selection matrix represents the importance of each feature, sorting features according to in descending order, so that the f most important features can be selected. In order to prevent accidental results, the experiment was performed 10 times.
The final stage is computing the classification results using some classifiers. The data matrix can be reconstructed as , where f is the number of selected features in the last stage. Then, the final classification results are computed using some classifiers on the data matrix after selection. A 10-fold cross-validation was used in the experiment.
| Algorithm 1 Workflow of the semi-supervised feature selection on educational data mining for student’s performance analysis. |
|
4. The Proposed Method
is a data matrix with c classes, where m denotes the number of features, n denotes the number of samples, and is the label matrix, which represents the relationships between samples and classes. In semi-supervised learning, supposing l samples are labeled, and samples are unlabeled, it can be seen that which are associated with . denotes the labeled data, denotes the unlabeled data, represents the feature selection matrix with labeled data, and represents the feature selection matrix with unlabeled data. is a binary matrix in which if belongs to the j-th class.
A generalized linear regression to represent the relationship between and can be expressed as follows [31]:
where is the feature selection matrix, which represents the importance of each feature for different clusters, denotes the bias, and is a column vector where all entries are 1.
Then, in order to reduce the gap between and , the loss function can be denoted by
where is a regularization term of the feature selection matrix , and is the parameter used to control the term.
The Frobenius norm is commonly used to denote the loss of the generalized linear regression in feature selection methods. In order to select the most important features, several methods employ a norm for a feature select matrix to enhance the sparseness [32]. However, the norm is more effective when the data have numerous features. In educational data mining, although the number of samples is large, the features are more difficult to extract and their number is not always large. Therefore, the norm may cause over sparseness of . In addition, in educational data mining, the feature selection methods also aims to analyze the the importance of all features relatively. Thus, reserving the values in the feature selection matrix of all features is significant. Therefore, the Frobenius norm is taken for in the proposed method. Equation (2) can be written as
As a subspace is projected from the original data space, the manifold structures of features in subspace should be similar to the original space [33,34]. In other words, when two features are similar in the original space, they are also similar in the subspace. Maintaining manifold structures between the features is beneficial for extracting a well-structured feature selection matrix. The Euclidean distance is commonly employed to measure the similarity of the features. If the Euclidean distance between two features and is close, their similarity is large. Thus, the manifold regularization is expressed as
where is the graph Laplacian matrix and , is the similarity matrix, and is the degree matrix.
Considering the above aspects, the final objective function can be formulated as
where is the data matrix, is the features selection matrix, is the bias vector, and is the label matrix. and are non-negative parameters.
5. Optimization
5.1. Optimization Steps
An efficient alternating optimization algorithm with a variable that is updated with the other variables fixed is designed to solve the objective function (5).
Update while fixing and :
When and are fixed, the objective function (5) becomes
By taking the partial derivative of the formula (6) with respect to , and setting the derivative to zero, we have
Then, the optimal solution of is
Update while fixing and :
When and are fixed, can be updated by solving
By taking the partial derivative of the formula (9) with respect to and setting the derivative to zero, the closed-form solution of is expressed as
Update while fixing and :
This can be
The augmented Lagrangian function of problem (11) is
where are the Lagrangian multipliers, and .
Then, following the solution method in [35], the optimal solution of is
where can be obtained by solving .
The convergent condition of the algorithm is expressed as
where denotes the value of the objective function in the t-th iteration. is a small positive parameter that controls the convergent condition of the algorithm. The entire update process is summarized in Algorithm 2.
| Algorithm 2 Semi-supervised Feature Selection via Generalized Linear Regression (SFSGLR) for Students’ Performance Analysis |
|
5.2. Computational Complexity
The computational complexity of Algorithm 2 is analyzed in this section. Where m denotes the number of features, n denotes the number of samples, c denotes the number of classes, and u denotes the number of unlabeled samples. Updating costs , updating costs , and updating costs . Therefore, the overall complexity in an iteration is in one iteration.
5.3. Convergence Analysis
The convergence of the Algorithm 2 is demonstrated in this section. The update rules for and are all based on the closed-form solutions. Thus, only the convergence of updating needs to be demonstrated. An auxiliary function construction method [36] can be adopted to solve the problem.
Definition 1.
is an auxiliary function of if the following conditions are satisfied:
Lemma 1.
If ϕ is an auxiliary function, then F is non-increasing under the following updating rule:
Proof.
If a suitable auxiliary function can be found to satisfy (17), convergence with respect to can be proved. □
Let denote the function of Problem (6), which has
The first and second partial derivatives of with respect to the variable can be calculated as follows:
Therefore, the Taylor series expansion of can be expressed as
Lemma 2.
The function ϕ is an auxiliary function for when it satisfies the following condition:
where
Proof.
According to Equations (21) and (22), it can be obtained that . Then, holds if the following formula satisfies:
The following three formulas hold:
Therefore, is an auxiliary function for . Finally, it can be obtained that the value of the objective function of Algorithm 2 is non-increasing until achieving convergence. □
6. Experiments
6.1. Dataset
The educational dataset xAPI was adopted in the experiments.
xPAI [22] (https://www.kaggle.com/datasets/aljarah/xAPI-Edu-Data, accessed on 10 November 2023) is a student academic performance dataset collected from a learning management system. It consists of 480 student records. Sixteen features are contained in the dataset, including gender, nationality, place of birth, stage ID, grade ID, section ID, topic, semester, relation, raised hands, visited resources, announcements view, discussion, parent answering survey, parent school satisfaction, and student absence days. The label used in xAPI is ’class’, including three classifications: low-level, middle-level, and high-level.
xAPI contains text data that are hard to process directly with the proposed algorithm. Thus, text data are replaced with numeric data. For example, the feature ’student absence days’ includes two kinds of text data, which are ’under-7 ’ and ’above-7’. Thus, ’under-7’ is replaced by ’1’ and ’above-7’ is replaced by ’0’. Statistical information of the xAPI educational dataset is given in Table 2. Some statistical information is shown in Figure 1.
Table 2.
The statistical information of the xAPI dataset.
Figure 1.
Some statistical information of features form the xAPI dataset.
Figure 1a illustrates the distribution of student nationalities. The figure shows that Kuwait and Jordan have the highest representation, with 179 and 172 individuals, respectively.
Figure 1b presents the students’ birthplaces. Kuwait and Jordan, with 180 and 176 individuals, respectively, emerged as the most prevalent birthplaces.
Figure 1c illustrates the distribution of students across different grade levels. The figure indicates that G-02 has the highest number of students, with 147 individuals, while G-01 and G-03 have no students.
Figure 1d showcases the subjects the students are studying, referred to as course topics. The most popular subjects include IT, French, Arabic, Science, and English. The popularity of these subjects may be indicative of students’ interests, future career choices, or the curriculum offered by the school.
Figure 1e displays the frequency of student participation in class by raising their hands. The figure reveals that 90 individuals raised their hands between 10 and 20 times, 80 individuals raised their hands between 70 and 80 times, and 66 individuals raised their hands between 80 and 90 times.
Figure 1f displays the frequency of student access to course content. The figure reveals that 107 students accessed the course content between 80 and 89 times, 76 students accessed it between 90 and 99 times, and 63 students accessed it between 0 and 9 times.
Figure 1g presents the frequency of students viewing new announcements. The figure indicates that 78 students viewed the announcements between 10 and 19 times, 72 students viewed them between 0 and 9 times, and 63 students viewed them between 20 and 29 times.
Figure 1h showcases the frequency of student participation in discussion groups. The figure shows that 77 students participated in discussions between 11 and 20 times, 69 students participated between 31 and 40 times, and 66 students participated between 21 and 30 times.
6.2. Experimental Settings
Using Algorithm 2, a feature selection matrix can be obtained. The feature selection matrix indicates the importance of each feature. By calculating and sorting in descending order, a ranking of the importance of the characteristics can be obtained.
After selecting different numbers for the most important features, the four classifiers K-Nearest neighbors (KNN), decision tree (Dtree), random forest (RF), and support vector machine (SVM) are adopted to measure the performance of the proposed method.
6.2.1. Comparison Methods
To demonstrate the effectiveness of the proposed SFSGLR, three feature selection methods are adopted to compare with SFSGLR, and they are introduced briefly as follows:
Unsupervised discriminate feature selection (UDFS) [32]: UDFS is a unsupervised feature selection method based on linear discrimination, with a norm in the feature selection matrix to enhance sparseness.
Non-negative discriminant feature selection (NDFS) [37]: NDFS is a unsupervised feature selection method based on non-negative spectral analysis and norm regularization.
Semi-supervised feature selection via rescaled linear regression (SFSRLR) [35]: This is a semi-supervised feature selection method with linear regression and a norm.
6.2.2. Classifiers
In this paper, four classification techniques are employed to assess the factors that influenced students’ performance or grade level. The methods used for classification included K-nearest neighbors (KNN), decision tree (Dtree), random forest (RF), and support vector machine (SVM).
K-nearest neighbors (KNN) is an instance-based classification algorithm that determines the class of a new sample based on the distance between the samples [38]. It selects the nearest K samples as a reference, and determines the category of the new sample based on the majority voting principle.
The automated rule discovery technique known as decision tree (Dtree) [39] analyzes and learns from training data, producing a series of branching decisions that classify the data based on the values of different feature attributes.
Random forest (RF) [40] represents an ensemble learning method that accomplishes classification by constructing numerous decision trees and combining their outcomes. This widely used machine learning algorithm harnesses the diversity and collective knowledge of multiple decision trees to enhance prediction accuracy and robustness. The ultimate classification decision is reached by aggregating the predictions from all individual trees, typically through a majority voting mechanism.
Support vector machine (SVM) [29] is a binary classification algorithm that aims to find an optimal hyperplane in a high-dimensional feature space, to separate different classes of data points. The key idea is to map the data into a high-dimensional feature space and transform a nonlinear problem into a linearly separable or approximately linearly separable problem.
6.2.3. Evaluation Metrics
Four widely used evaluation metrics are adopted to measure the performance of the classification: accuracy (ACC), Fscore, precision and recall. They are formulated as follows:
where is the parameter for Fscore and always equals to 1, while TP, TN, FP, and FN denote true negative, true positive, false positive, and false negative, respectively. For all of the four metrics, a larger value means a better performance.
6.3. Student Performance Characteristic Analysis
In the student performance characteristics experiments, the proposed algorithm is adopted to sort the importance of the different features for the students’ academic performance. Figure 2d shows the ranking of the most important features.
Figure 2.
Student performance characteristics ranking. (a) UDFS. (b) NDFS. (c) SFSRLR. (d) The proposed SFSGLR.
Of all the features, f11 influences the students’ performance most, making up about 30% of the importance. f11 denotes times of visited resources, which means how many times a student visited course contents. Next, f10 and f7 are of equal importance, with each accounting for approximately 15% of the total importance. f10 and f7 represent the number of times a student raises his or her hand in class and course topics, respectively. In addition, it is found that the importance of f1, f14, f8, and f15 are all lower than 1%. Thus, they were not important for the students’ academic performance.
The 16 features have different tendencies and they can be divided into five categories. The first category is personal features, including f1 (gender) and f16 (student absence days). The second category is a social-related category, including f2 (nationality), f3 (place of birth), and f9 (relation). The third category is a school-related category, including f4 (stage ID), f5 (grade ID), f6 (section ID), f7 (topic), and f8 (semester). The fourth is a behavioral category, including f10 (times of raising hands), f11 (times of visiting resources), f12 (times of announcements), and f13 (times of discussions). The fifth is a family-related category, including f14 (parents answering survey) and f15 (student absence days).
The top four most important features are f11, f10, f7, and f12. And the top eight most important features are f11, f10, f7, f12, f5, f6, f13, and f2. This means that all the behavioral characteristics are significant for the student’s performance.
Figure 2 shows a comparison of the student’s performance characteristics ranking with different methods. Differently from the proposed SFSGLR, the importance matrices of the other methods are more sparse. The proposed method adopts the Frobenius norm for the feature selection matrix, while the others adopts the norm. As Figure 2 shows, the importance values of most of the features with the comparison methods were close to 0. This is not convenient for comparing the importance between features. With UDFS, the top five most important features are f15 (33.28%), f4 (31.7%), f9 (18.36%), f1 (14.95%), and f5 (1.66%). For NDFS, the top four most important features are f10 (31.56%), f13 (25.4%), f11 (22.06%), and f12 (20.97%). NDFS also indicates that the behavioral characteristics are important for the features. The feature selection matrix for SFSRLR seems overly sparse, with only two important values of features being larger than 1%. With SFSRLR, the top two most important features are f12 (69.17%) and f13 (30.61%). In SFSRLR, the behavioral characteristics also makes up the greatest percentage of importance.
Table 3 shows the classification results with the different methods and the number of features on xAPI with 50% labeled data. The feature selection methods aims to extract the most important features, and xAPI has only 16 features in total. Thus, the classification results with few most important features reflect the performance of the methods. With respect to ACC, the proposed SFSGLR performs the best of the four methods. While using 1 most important feature, SFSGLR+RF outperforms UDFS+RF, NDGS+RF, and SFSRLR+RF by approximately 18.2%, 3.9%, and 6.0%, respectively. When using 3 most important features, SFSGLR+RF outperforms UDFS+RF, NDGS+RF, and SFSRLR+RF by approximately 19%, 10%, and 8.1%, respectively. This indicates that the proposed SFSGLR selects the correct features.
Table 3.
Classification (mean ± standard deviation) with the different methods and the number of features on xAPI with 50% labeled data.
6.4. Student Performance Characteristics Analysis for Different Topics
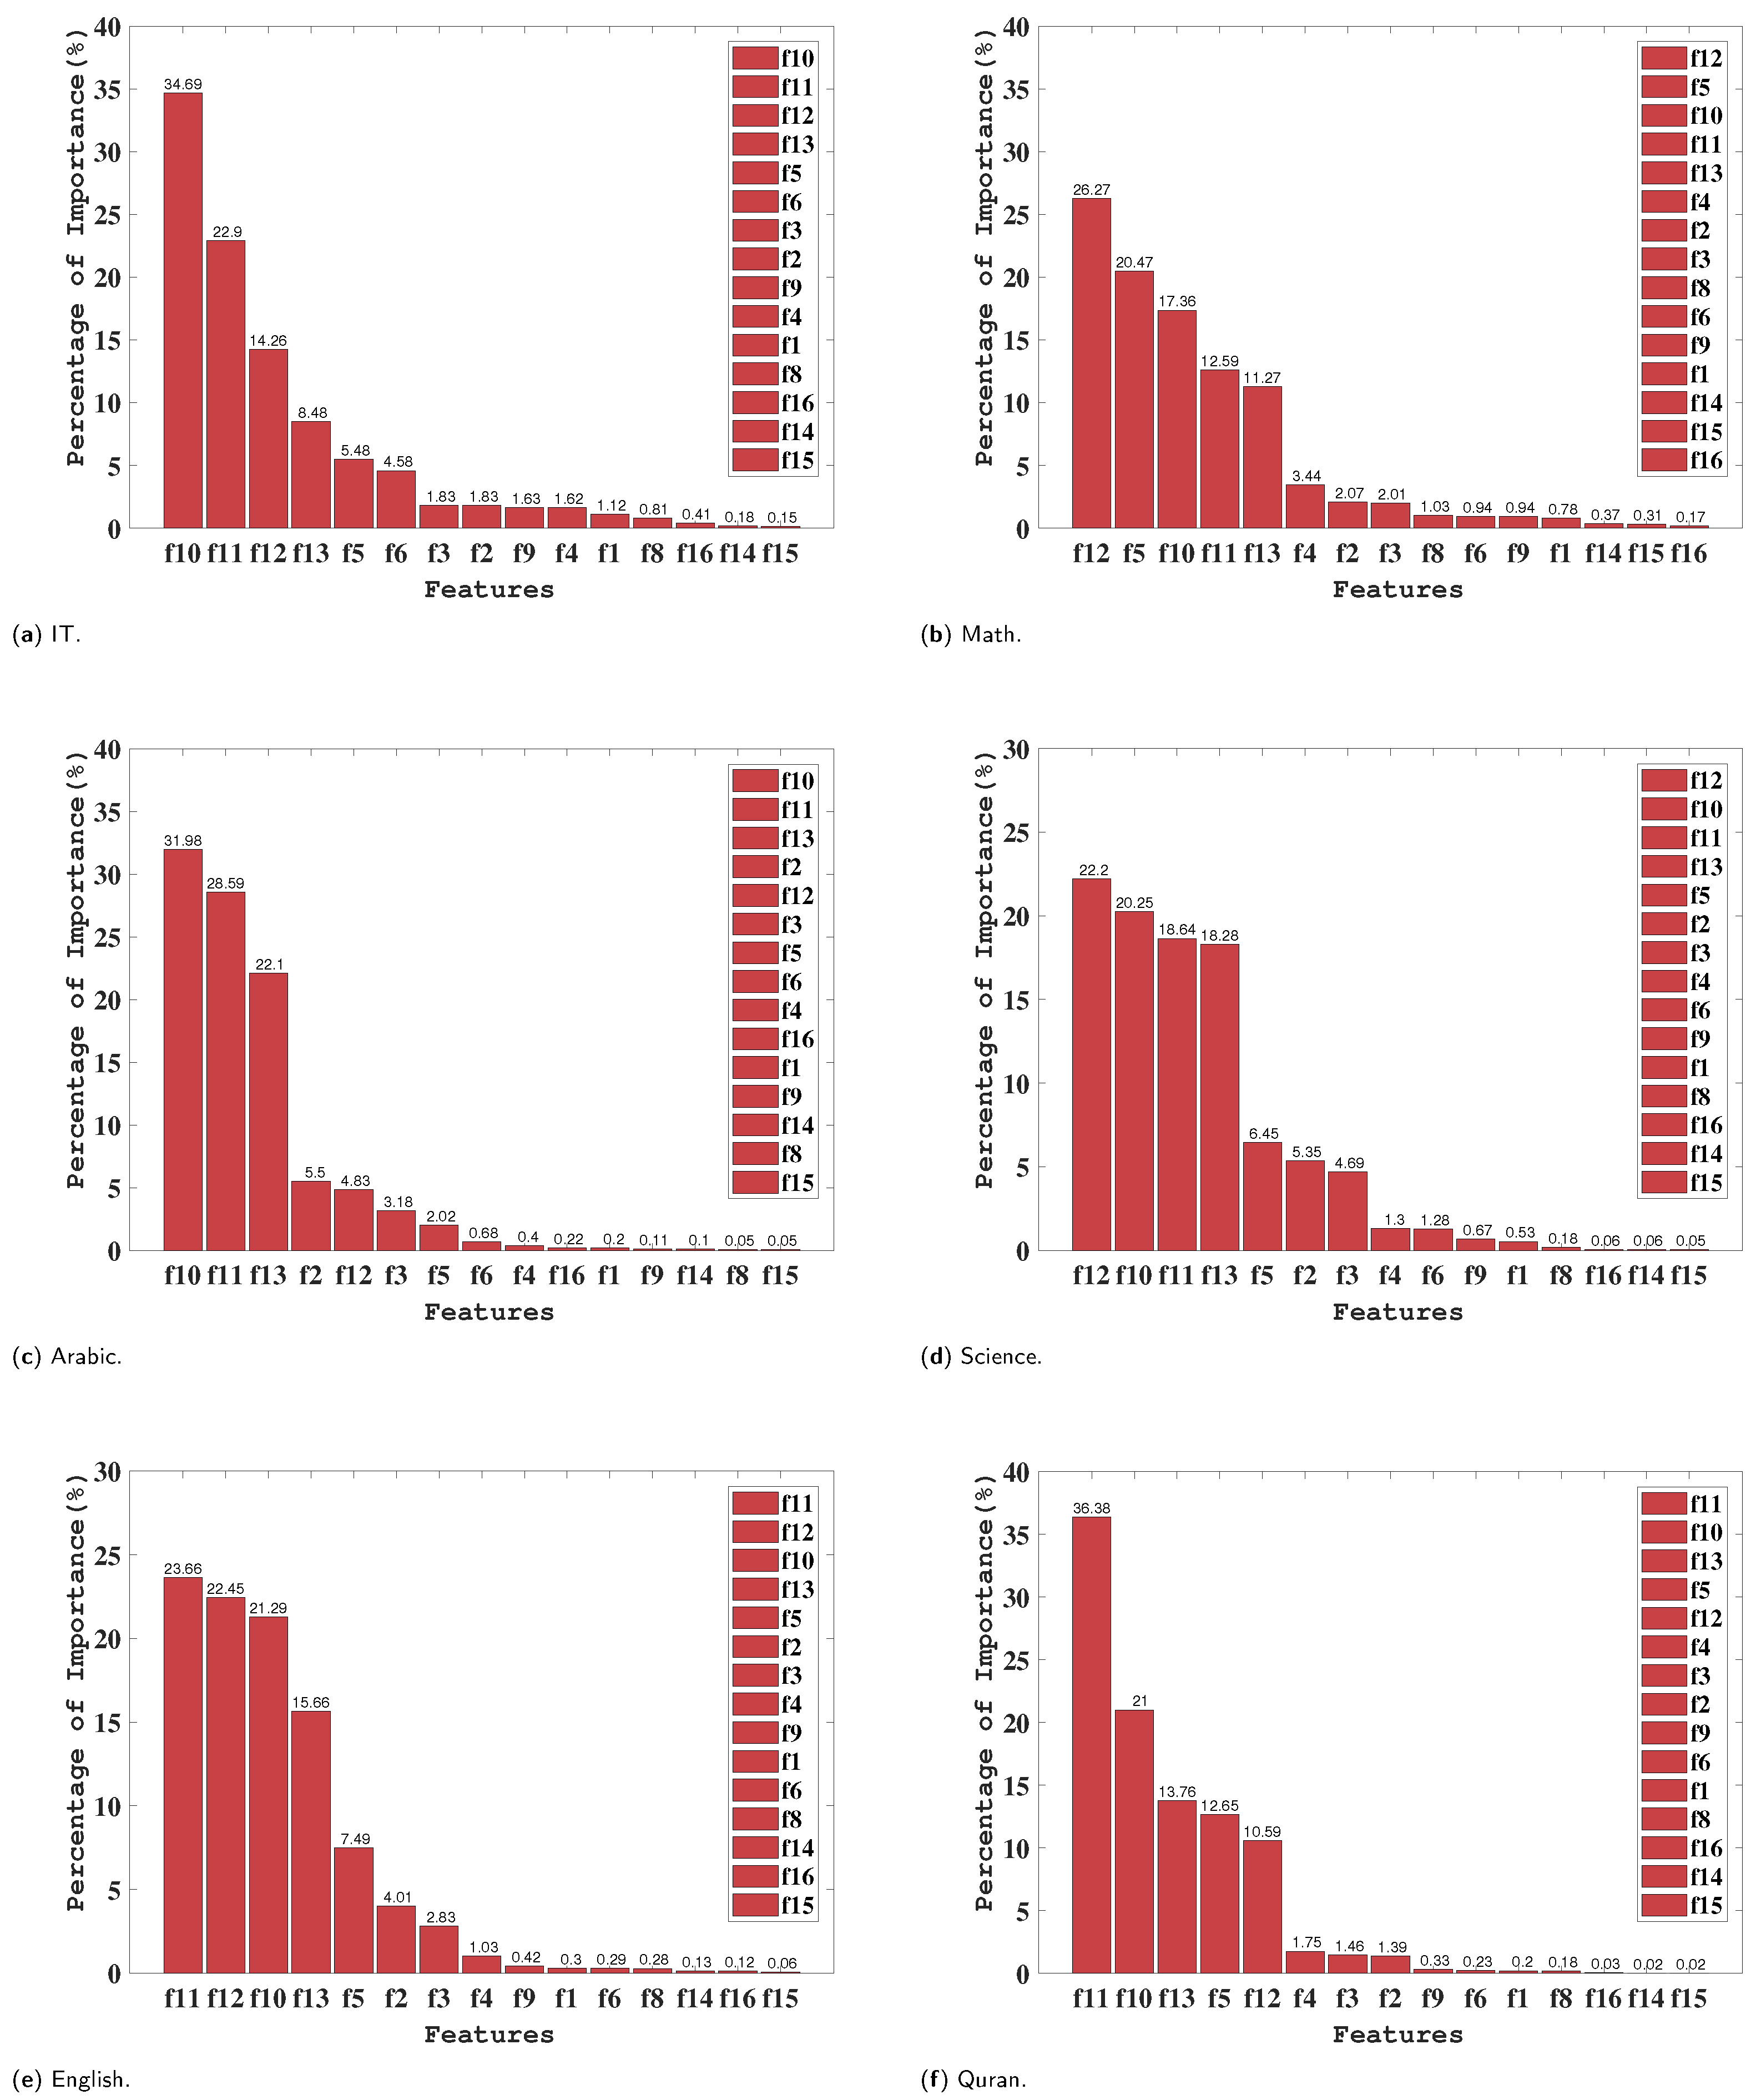
The top four most important features are f11, f10, f7, and f12, with f11, f10, and f12 all being behavioral characteristics, and f7 being a school-related characteristic. Thus, in this section, the content in f7 (topic) is used as a basis to select the importance of each feature under different topics. The results are shown in Figure 3 and Figure 4. Based on the figures, the importance of each feature for different topics can be observed. And through further analysis, a deeper understanding of these results could be gained.
Figure 3.
Student performance characteristics ranking for different topics. (a) IT. (b) Math. (c) Arabic. (d) Science. (e) English. (f) Quran.
Figure 4.
Student performance characteristics ranking for different topics. (a) Spanish. (b) French. (c) History. (d) Biology. (e) Chemistry. (f) Geology.
For the IT, Arabic, and Spanish topics, the number of times of times students raised hands (f10) accounts for the highest importance. This indicates that students’ active participation in class discussions has a greater impact on their academic performance in these topics.
In five topics, English, Quran, French, History, and Chemistry, the number of times students accesses a particular course content (f11) emerges as the most important characteristic. This indicates that in these subjects, in-depth learning and exploration of course materials play a crucial role in students’ academic performance. Regularly accessing course resources and materials helps students better understand concepts, retain knowledge, and apply it to real-world problems. Within the domains of math and science, the paramount factor is the frequency of students checking for new announcements (f12). This underscores that, in these subjects, students’ attention to updated information and course announcements significantly influences their academic performance.
Conversely, in the realms of biology and geology, the most critical characteristic is the frequency of student participation in discussion groups (f13). This implies that students can enhance their understanding of course concepts and gain more learning benefits through active engagement in group discussions.
To summarize, the varying importance of different characteristics across different topics highlights the diverse influences on students’ academic performance. Nevertheless, a closer examination of the figures reveals that f10, f11, f12, and f13 consistently hold higher rankings for importance across these twelve topics. This suggests that these four characteristics generally play a pivotal role in shaping students’ academic performance.
These findings emphasize the importance of active participation in class discussions, in-depth study of course contents, attention to updated information, and participation in discussion groups. Educators can use this information to develop teaching strategies. This could help to improve students’ academic performance and foster their academic development.
6.5. Performance with Different Numbers of Selected of Features
After sorting in descending order, the ranking of the importance of characteristics can be obtained. In order to demonstrate the effectiveness of the proposed SFSGLR algorithm, four classifiers are adopted to measure the performance after selecting different numbers of the features.
In general, when more features are selected for classifying, the classifiers obtain a better performance. In Table 4, the classification results are shown. A 10-fold cross-validation is performed, and the mean and standard deviation of the results are recorded. While selecting the two most important features, SFSGLR+KNN has around 94% the performance of selecting all 16 features. SFSGLR+DTree, SFSGLR+RF, and SFSGLR+SVM have approximately 79%, 74%, and 86% in this case, respectively. While selecting the four most important features, SFSGLR+KNN has around 91% the performance of selecting all 16 features. SFSGLR+DTree, SFSGLR+RF, and SFSGLR+SVM have approximately 84%, 85%, and 86% in this case, respectively. Therefore, the performance of the proposed SFSGLR in selecting important features is superior.
Table 4.
Classification results (Mean ± Standard Deviation) with respect to different features number of different classifiers on xAPI with 50% labeled data.
Figure 5 shows the classification performance of SFSGLR with four classifiers. It can be seen that when increasing the number of selected features, the classification performance increased gradually. On xAPI, SFSGLR+RF performs best and SFSGLR+KNN performs worst. When selecting eight features, SFSGLR+RF shows around an 17%, 8%, and 11% improvement compared with SFSGLR+KNN, SFSGLR+DTree, and SFSGLR+SVM, respectively.
Figure 5.
The classification performance with respect to the different number of features of the different classifiers on xAPI. (a) ACC. (b) Fscore. (c) Precision. (d) Recall.
6.6. Performance with Different Percentages of Labeled Data
Table 5 shows the classification results with different percentages of labeled data while selecting the top six most important features. Figure 6 shows the curves of the SFSGLR with four classifiers on four evaluation metrics. As shown in Figure 6, the curves of SFSGLR+RF, SFSGLR+SVM, and SFSGLR+DTree increase when increasing the amount of labeled data. SFSGLR+KNN performs unstably when the percentage of labeled data varies from 10% to 90%.SFSGLR+RF performs best of the four classifiers, while SFSGLR+KNN performs worst. When 80% data are labeled, SFSGLR+RF obtains the best performance. It shows around 34%, 11%, and 9% improvements compared with SFSGLR+KNN, SFSGLR+DTree, and SFSGLR+SVM, respectively.
Table 5.
Classification results (mean ± standard deviation) with respect to different percentages of labeled data with the top 6 most important features on xAPI.
Figure 6.
The classification performance with respect to different percentages of labeled data with the top 6 most important features on xAPI. (a) ACC. (b) Fscore. (c) Precision. (d) Recall.
6.7. Parameter Sensitivity Analysis
In the proposed method, is used to control the and is used to control the manifold regularization. In the experiments, the percentage of labeled data is set to 50%, and SVM is adopted to obtain the classification performance. The grid search method is adopted to tune the parameters, which means that and are selected from the set of [0.001, 0.01, 0.1, 1, 10, 100]. In Figure 7, the classification performance between the different and the number of selected features when fixing are shown. Figure 8 shows the classification performance between different and the number of selected features when fixing . It is shown that both and are not very sensitive in the range [0.001, 0.1]. In addition, the proposed method obtains the best performance when the values of and are selected in the range of [0.01, 0.1]. Generally, the recommended selections of and are in the interval [0.01, 0.1].
Figure 7.
Classification performance between the different and numbers of selected features. (a) ACC. (b) Fscore.
Figure 8.
Classification performance between different and numbers of selected features. (a) ACC. (b) Fscore.
6.8. Convergence Study
The convergence of the proposed algorithm is demonstrated theoretically in Section 5.3. Figure 9 shows the curve of objective function value (5) with respect to the number of iterations. Solving the objective function (5) in the Algorithm 2 can obtain the optimal feature selection matrix . In Figure 9, it is evident that the objective function value declines gradually with the increase in iterations in the proposed algorithm on the xAPI dataset. In the first 100 iterations, the objective function value decreases quickly, which demonstrates the superior convergence performance of the proposed method. Therefore, the convergence analysis in Section 5.3 is validated in the experiment.
Figure 9.
Convergence study of the proposed algorithm with the xAPI.
7. Conclusions
In order to process unlabeled data and identify the most crucial characteristics impacting student performance, a semi-supervised feature selection approach is presented using generalized linear regression. The experiments lead to the conclusion that behavioral characteristics play a pivotal role in a student’s performance. Experiments that compared with other state-of-the-art methods demonstrates the effectiveness of the proposed method. Furthermore, analyzing the impact factors across different subjects reveals that IT, Arabic, Science, English, History, Chemistry, and Geology are most influenced by the behavioral characteristics. In addition to the behavioral factors, Math, Quran, and Spanish are noticeably influenced by school-related factors. In addition, French and Biology are impacted by social factors. Finally, four classifiers are employed to evaluate the performance of the proposed method. The extensive experiments demonstrate the superiority of the semi-supervised feature selection approach.
The semi-supervised feature selection approach aims to rank the importance of the characteristics, greatly aiding in the analysis of factors affecting student performance. Consequently, the proposed method can greatly assist education departments in decision-making processes. However, a notable limitation of the proposed method is its lack of predictive ability, which restricts its applicability in certain scenarios. In the future, it would be advantageous to develop a semi-supervised feature selection method that also has a superior predictive capability.
Author Contributions
Conceptualization, S.Y., Y.C. and B.P.; methodology, S.Y., Y.C. and B.P.; software, S.Y., Y.C. and B.P.; validation, Y.C., B.P. and M.-F.L.; formal analysis, B.P. and M.-F.L.; investigation, Y.C. and B.P.; resources, B.P. and M.-F.L.; data curation, B.P. and M.-F.L.; writing—original draft preparation, S.Y.; writing—review and editing, Y.C. and M.-F.L.; visualization, S.Y., Y.C. and B.P.; supervision, Y.C. and B.P.; project administration, M.-F.L.; funding acquisition, M.-F.L. All authors have read and agreed to the published version of the manuscript.
Funding
This research received no external funding.
Data Availability Statement
The data used to support the findings of the study are available from the first author upon request. The author’s email address is c2022333002214@email.swu.edu.cn.
Conflicts of Interest
The authors declare that there are no conflicts of interest regarding the publication of this paper.
References
- Hussain, S.; Dahan, N.A.; Ba-Alwib, F.M.; Ribata, N. Educational data mining and analysis of students’ academic performance using WEKA. Indones. J. Electr. Eng. Comput. Sci. 2018, 9, 447–459. [Google Scholar] [CrossRef]
- Adekitan, A.I.; Noma-Osaghae, E. Data mining approach to predicting the performance of first year student in a university using the admission requirements. Educ. Inf. Technol. 2019, 24, 1527–1543. [Google Scholar] [CrossRef]
- Azevedo, A. Data mining and knowledge discovery in databases. In Advanced Methodologies and Technologies in Network Architecture, Mobile Computing, and Data Analytics; IGI Global: Hershey, PA, USA, 2019; pp. 502–514. [Google Scholar]
- Jin, J.; Liu, Y.; Ji, P.; Kwong, C.K. Review on recent advances in information mining from big consumer opinion data for product design. J. Comput. Inf. Sci. Eng. 2019, 19, 010801. [Google Scholar] [CrossRef]
- Keserci, S.; Livingston, E.; Wan, L.; Pico, A.R.; Chacko, G. Research synergy and drug development: Bright stars in neighboring constellations. Heliyon 2017, 3, e00442. [Google Scholar] [CrossRef] [PubMed]
- Liu, C.; Wu, S.; Li, R.; Jiang, D.; Wong, H.S. Self-supervised graph completion for incomplete multi-view clustering. IEEE Trans. Knowl. Data Eng. 2023, 35, 9394–9406. [Google Scholar] [CrossRef]
- Pan, B.; Li, C.; Che, H. Nonconvex low-rank tensor approximation with graph and consistent regularizations for multi-view subspace learning. Neural Netw. 2023, 161, 638–658. [Google Scholar] [CrossRef]
- Che, H.; Wang, J. A nonnegative matrix factorization algorithm based on a discrete-time projection neural network. Neural Netw. 2018, 103, 63–71. [Google Scholar] [CrossRef] [PubMed]
- Che, H.; Wang, J.; Cichocki, A. Bicriteria sparse nonnegative matrix factorization via two-timescale duplex neurodynamic optimization. IEEE Trans. Neural Netw. Learn. Syst. 2021, 34, 4881–4891. [Google Scholar] [CrossRef]
- Pu, X.; Che, H.; Pan, B.; Leung, M.F.; Wen, S. Robust Weighted Low-Rank Tensor Approximation for Multiview Clustering With Mixed Noise. IEEE Trans. Comput. Soc. Syst. 2023. [Google Scholar] [CrossRef]
- Cai, Y.; Che, H.; Pan, B.; Leung, M.F.; Liu, C.; Wen, S. Projected cross-view learning for unbalanced incomplete multi-view clustering. Inf. Fusion 2024, 102245. [Google Scholar] [CrossRef]
- Tair, M.M.A.; El-Halees, A.M. Mining educational data to improve students’ performance: A case study. Int. J. Inf. 2012, 2, 140–146. [Google Scholar]
- Senthil, S.; Lin, W.M. Applying classification techniques to predict students’ academic results. In Proceedings of the 2017 IEEE International Conference on Current Trends in Advanced Computing (ICCTAC), Bangalore, India, 2–3 March 2017; pp. 1–6. [Google Scholar]
- Bharara, S.; Sabitha, S.; Bansal, A. Application of learning analytics using clustering data Mining for Students’ disposition analysis. Educ. Inf. Technol. 2018, 23, 957–984. [Google Scholar] [CrossRef]
- Arcinas, M.M.; Sajja, G.S.; Asif, S.; Gour, S.; Okoronkwo, E.; Naved, M. Role of data mining in education for improving students performance for social change. Turk. J. Physiother. Rehabil. 2021, 32, 6519–6526. [Google Scholar]
- Bakhshinategh, B.; Zaiane, O.R.; ElAtia, S.; Ipperciel, D. Educational data mining applications and tasks: A survey of the last 10 years. Educ. Inf. Technol. 2018, 23, 537–553. [Google Scholar] [CrossRef]
- Bousbia, N.; Belamri, I. Which contribution does EDM provide to computer-based learning environments? In Educational Data Mining: Applications and Trends; Springer: Cham, Switzerland, 2014; pp. 3–28. [Google Scholar]
- Romero, C.; Ventura, S. Educational data science in massive open online courses. Wiley Interdiscip. Rev. Data Min. Knowl. Discov. 2017, 7, e1187. [Google Scholar] [CrossRef]
- Subramanya, A.; Talukdar, P.P. Graph-Based Semi-Supervised Learning; Springer Nature: Cham, Switzerland, 2022. [Google Scholar]
- Kostopoulos, G.; Livieris, I.E.; Kotsiantis, S.; Tampakas, V. Enhancing high school students’ performance based on semi-supervised methods. In Proceedings of the 2017 8th International Conference on Information, Intelligence, Systems & Applications (IISA), Larnaca, Cyprus, 27–30 August 2017; pp. 1–6. [Google Scholar]
- Wang, Y.; Wang, J.; Che, H. Two-timescale neurodynamic approaches to supervised feature selection based on alternative problem formulations. Neural Netw. 2021, 142, 180–191. [Google Scholar] [CrossRef] [PubMed]
- Amrieh, E.A.; Hamtini, T.; Aljarah, I. Preprocessing and analyzing educational data set using X-API for improving student’s performance. In Proceedings of the 2015 IEEE Jordan Conference on Applied Electrical Engineering and Computing Technologies (AEECT), Amman, Jordan, 3–5 November 2015; pp. 1–5. [Google Scholar]
- Almutairi, S.; Shaiba, H.; Bezbradica, M. Predicting students’ academic performance and main behavioral features using data mining techniques. In Proceedings of the First International Conference on Computing, ICC 2019, Riyadh, Saudi Arabia, 10–12 December 2019; pp. 245–259. [Google Scholar]
- Alsulami, A.A.; AL-Ghamdi, A.S.A.M.; Ragab, M. Enhancement of E-Learning Student’s Performance Based on Ensemble Techniques. Electronics 2023, 12, 1508. [Google Scholar] [CrossRef]
- Tran, H.; Vu-Van, T.; Bang, T.; Le, T.V.; Pham, H.A.; Huynh-Tuong, N. Data Mining of Formative and Summative Assessments for Improving Teaching Materials towards Adaptive Learning: A Case Study of Programming Courses at the University Level. Electronics 2023, 12, 3135. [Google Scholar] [CrossRef]
- Kostopoulos, G.; Kotsiantis, S.; Pintelas, P. Predicting student performance in distance higher education using semi-supervised techniques. In Proceedings of the 5th International Conference, MEDI 2015, Rhodes, Greece, 26–28 September 2015; pp. 259–270. [Google Scholar]
- Widyaningsih, Y.; Fitriani, N.; Sarwinda, D. A Semi-Supervised Learning Approach for Predicting Student’s Performance: First-Year Students Case Study. In Proceedings of the 2019 12th International Conference on Information & Communication Technology and System (ICTS), Surabaya, Indonesia, 18 July 2019; pp. 291–295. [Google Scholar]
- Yao, H.; Nie, M.; Su, H.; Xia, H.; Lian, D. Predicting academic performance via semi-supervised learning with constructed campus social network. In Proceedings of the 22nd International Conference, DASFAA 2017, Suzhou, China, 27–30 March 2017; pp. 597–609. [Google Scholar]
- Li, F.; Zhang, Y.; Chen, M.; Gao, K. Which factors have the greatest impact on student’s performance. J. Phys. Conf. Ser. 2019, 1288, 012077. [Google Scholar] [CrossRef]
- Ahmed, M.R.; Tahid, S.T.I.; Mitu, N.A.; Kundu, P.; Yeasmin, S. A comprehensive analysis on undergraduate student academic performance using feature selection techniques on classification algorithms. In Proceedings of the 2020 11th International Conference on Computing, Communication and Networking Technologies (ICCCNT), Kharagpur, India, 1–3 July 2020; pp. 1–6. [Google Scholar]
- Zeng, Z.; Wang, X.; Zhang, J.; Wu, Q. Semi-supervised feature selection based on local discriminative information. Neurocomputing 2016, 173, 102–109. [Google Scholar] [CrossRef]
- Yang, Y.; Shen, H.T.; Ma, Z.; Huang, Z.; Zhou, X. l2,1-norm regularized discriminative feature selection for unsupervised learning. In Proceedings of the 22nd IJCAI International Joint Conference on Artificial Intelligence, Barcelona, Spain, 16–22 July 2011. [Google Scholar]
- Dong, Y.; Che, H.; Leung, M.F.; Liu, C.; Yan, Z. Centric graph regularized log-norm sparse non-negative matrix factorization for multi-view clustering. Signal Process. 2023, 217, 109341. [Google Scholar] [CrossRef]
- Li, C.; Che, H.; Leung, M.F.; Liu, C.; Yan, Z. Robust multi-view non-negative matrix factorization with adaptive graph and diversity constraints. Inf. Sci. 2023, 634, 587–607. [Google Scholar] [CrossRef]
- Chen, X.; Yuan, G.; Nie, F.; Huang, J.Z. Semi-supervised Feature Selection via Rescaled Linear Regression. In Proceedings of the 26th International Joint Conference on Artificial Intelligence (IJCAI-17), Melbourne, VIC, Australia, 19–25 August 2017; Volume 2017, pp. 1525–1531. [Google Scholar]
- Chen, K.; Che, H.; Li, X.; Leung, M.F. Graph non-negative matrix factorization with alternative smoothed L0 regularizations. Neural Comput. Appl. 2023, 35, 9995–10009. [Google Scholar] [CrossRef]
- Li, Z.; Yang, Y.; Liu, J.; Zhou, X.; Lu, H. Unsupervised feature selection using nonnegative spectral analysis. Proc. AAAI Conf. Artif. Intell. 2012, 26, 1026–1032. [Google Scholar] [CrossRef]
- Amra, I.A.A.; Maghari, A.Y. Students performance prediction using KNN and Naïve Bayesian. In Proceedings of the 2017 8th International Conference on Information Technology (ICIT), Amman, Jordan, 17–18 May 2017; pp. 909–913. [Google Scholar]
- Han, J.; Kamber, M.; Mining, D. Concepts and Techniques; Morgan Kaufmann: Burlington, MA, USA, 2006; Volume 340, p. 94104-3205. [Google Scholar]
- Ahmed, N.S.; Sadiq, M.H. Clarify of the random forest algorithm in an educational field. In Proceedings of the 2018 International Conference on Advanced Science and Engineering (ICOASE), Duhok, Iraq, 9–11 October 2018; pp. 179–184. [Google Scholar]
Disclaimer/Publisher’s Note: The statements, opinions and data contained in all publications are solely those of the individual author(s) and contributor(s) and not of MDPI and/or the editor(s). MDPI and/or the editor(s) disclaim responsibility for any injury to people or property resulting from any ideas, methods, instructions or products referred to in the content. |
© 2024 by the authors. Licensee MDPI, Basel, Switzerland. This article is an open access article distributed under the terms and conditions of the Creative Commons Attribution (CC BY) license (https://creativecommons.org/licenses/by/4.0/).