

Leveraging Swarm Intelligence for Optimal Thermal Camera and Sensor Placement in Industrial Environments


Abstract
1. Introduction
- Unique methodology: We implement a distinctive method utilizing the bat algorithm to effectively solve the sensor placement optimization problem (SPOP).
- Algorithm fine-tuning: The solution involves fine-tuning the bat algorithm and its parameters to enhance the overall efficiency.
- Dual optimization goals: We apply a two-fold approach of maximizing coverage and minimizing sensor excess, ensuring a balanced and effective placement strategy.
- Integration of multiple sensor types: We simultaneously utilize two types of sensors, namely thermal cameras and motion sensors, to comprehensively address monitoring requirements.
2. Camera and Sensor Specifications
2.1. DS-2TD1228-2/QA Camera Overview
- Horizontal Field of View: 90°
- IR LED illumination range at night: 15 m;
- Image sensor: 1/2.7″ 4MP PS CMOS;
- Thermal sensor: uncooled VOx;
- Max resolution: 2688 × 1520 px at 25 fps;
- Transmission type: wired;
- Thermal lens: 2.1 mm (F1.0);
- Thermal sensitivity: <40 mK @ F1.1; 25 °C;
- Acusense false alarm filtering;
- Measurement range: −20–150 °C (±8 °C).
2.2. DS936 Ceiling Alarm Sensor
- 360° field of view;
- Detection range: up to 7.5 m;
- Detection method: PIR;
- Microprocessor signal processing;
- PIR sensitivity adjustment.
3. Application of the Bat Algorithm to Sensor Placement
3.1. Bat Algorithm
3.2. Algorithm Steps for Applying BA to Sensor Placement
- Objective function:The BA introduces an objective function to evaluate the quality of sensor placement. In this context, the function is tailored to optimize the spatial arrangement of the camera and motion sensor. The objective function is expressed as follows: = Fitness measure of sensor placement at position X This function assesses the quality of a given sensor placement configuration based on the spatial arrangement of the camera and motion sensors. The algorithm aims to optimize this objective function, guiding the iterative search for an optimal sensor layout within the sensor placement space.
- Frequency tuning ():Bats emit pulses with frequencies adjusted dynamically based on the algorithm’s exploration and exploitation phases. The frequency tuning, denoted by fmin and fmax, controls the rate at which bats emit pulses, influencing the search intensity for optimal solutions.
- Loudness (A):The loudness of bat calls, represented by A, determines the amplitude of emitted pulses. In the context of sensor placement, A contributes to refining the search space and optimizing the bats’ dynamic adjustment of behavior.
- Random walks:Random walks introduce controlled randomness into the algorithm, ensuring diversity in the exploration of the solution space. The stochastic nature of random walks contributes to the adaptability of the algorithm and its ability to escape local minima. The proposed input parameters for the bat algorithm include the population size, frequency range , random walk coefficient , and a scaling factor for loudness decay . The conditions for implementation involve assessing the quality of sensor placements based on coverage, sensor proximity, and key points. The algorithm adapts to specific application needs and constraints, terminating either after a predefined number of iterations or upon meeting quality-related conditions associated with sensor placement.
- Initialization:Initialize the bat population with random positions and velocities in the multidimensional space.
- Objective function evaluation:Evaluate the objective function for each bat’s position, assessing the quality of the current sensor placement. The fitness measure is a combination of the following factors:where X represents the current sensor placement configuration; is a function measuring how well the sensors cover the target; is a function assessing the proximity of sensors to each other; is a function assessing the proximity of sensors to key points; and are weight coefficients that allow to adjust the importance of each metric in the overall fitness measure.
- Frequency adjustment:Adjust the frequency of bat emissions based on the exploration–exploitation trade-off, influencing the algorithm’s search dynamics.where represents the frequency of bat i; represents the minimum frequency parameter; represents the maximum frequency parameter; and is a randomly generated value from a uniform distribution in the range .
- Velocity update:Update bat velocities using the frequency-tuned information and incorporate randomness through random walks. The velocity update equation within the bat algorithm is expressed as follows:where ) represents the updated velocity of bat i at time ; represents the velocity of bat i at time t; represents global best position found by any bat at time t; represents the current position of bat i at time t; represents the frequency of bat i (from the frequency adjustment formula); is a random coefficient controlling randomness; and is a random value in the range .
- Position update:Update bat positions based on their velocities, ensuring dynamic adjustments in the search space. The formulae are as follows:where represents the updated position of bat i at time ; represents the current position of bat i at time t; and represents the updated velocity of bat i at time t + 1 (from the velocity update formula).
- Loudness update:Update bat loudness to refine the search intensity, contributing to the optimization of sensor placements. The formula is as follows:where represents the updated loudness of bat i at time ; represents the loudness of bat i at time t; and is a caling factor controlling the loudness decay, which is chosen within the range [0.8, 1.0] to balance exploration and exploitation.
- Termination criteria:The algorithm terminates either after a predefined number of iterations or upon meeting quality-related conditions associated with sensor placement. This flexibility allows the BA to adapt to specific application needs and constraints.
| Algorithm 1: Algorithm for sensor placement optimization using the bat algorithm |
 |
4. Evaluation of Experimental Results
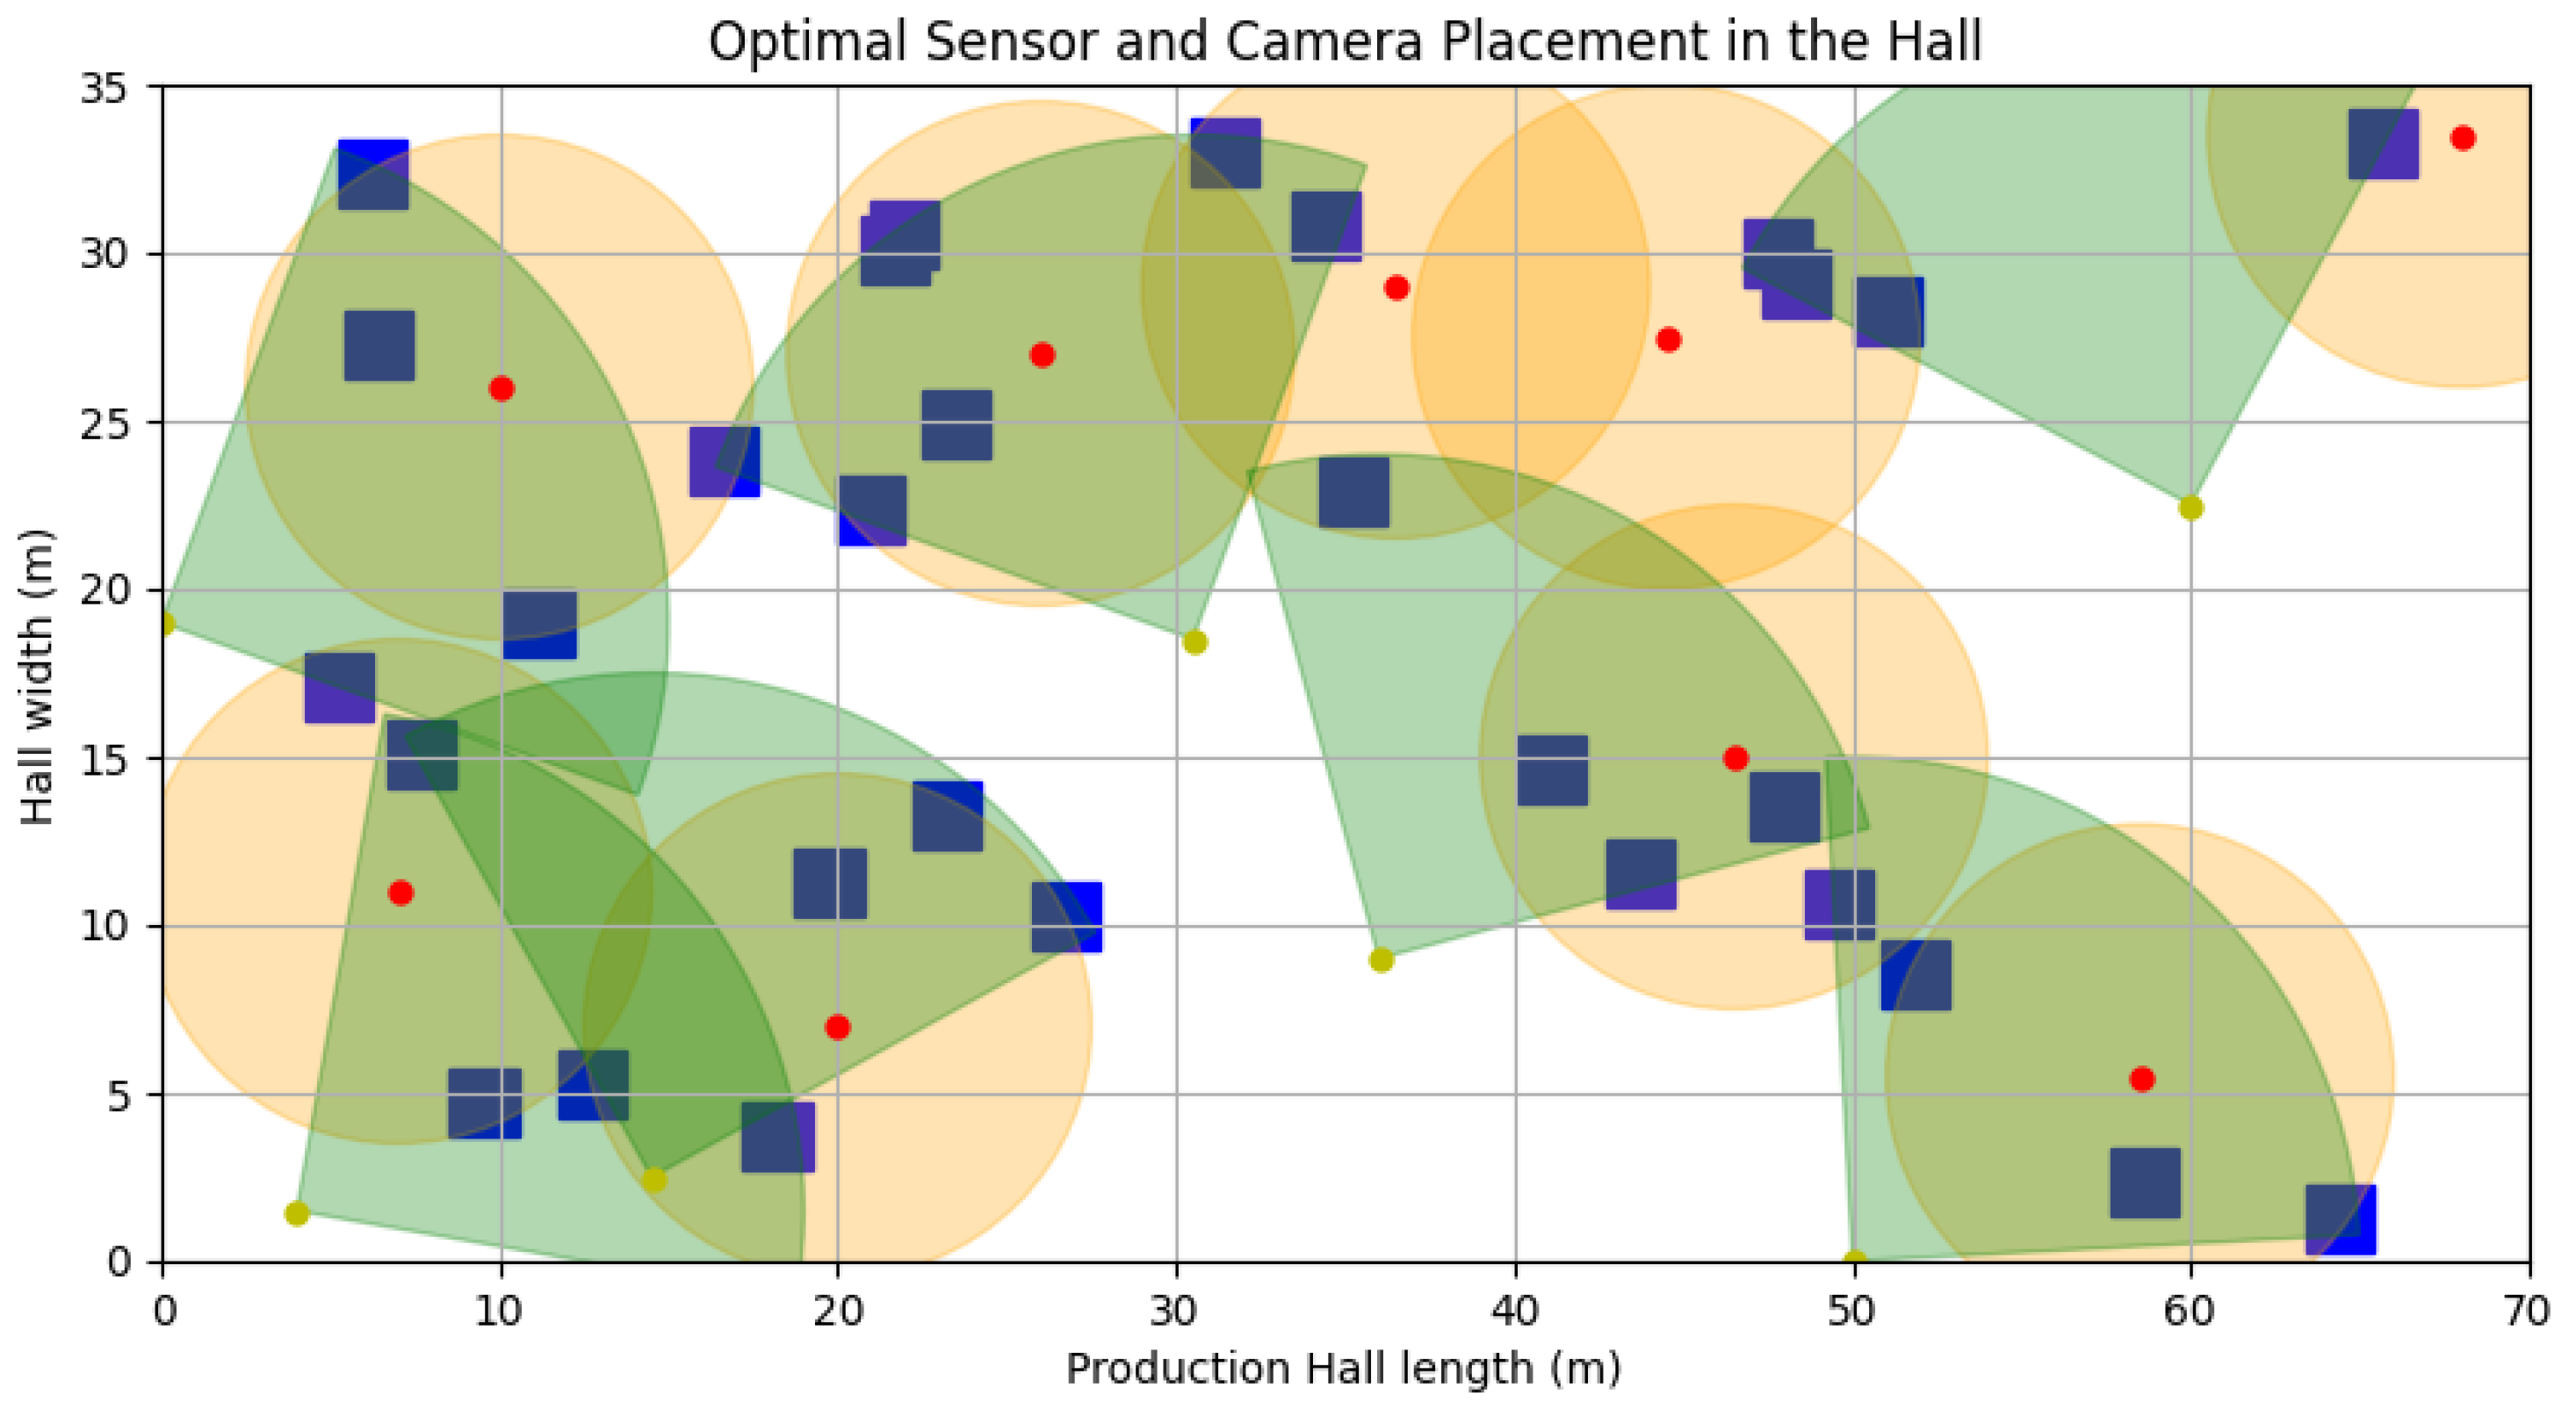
4.1. Results of Experiment Number 1
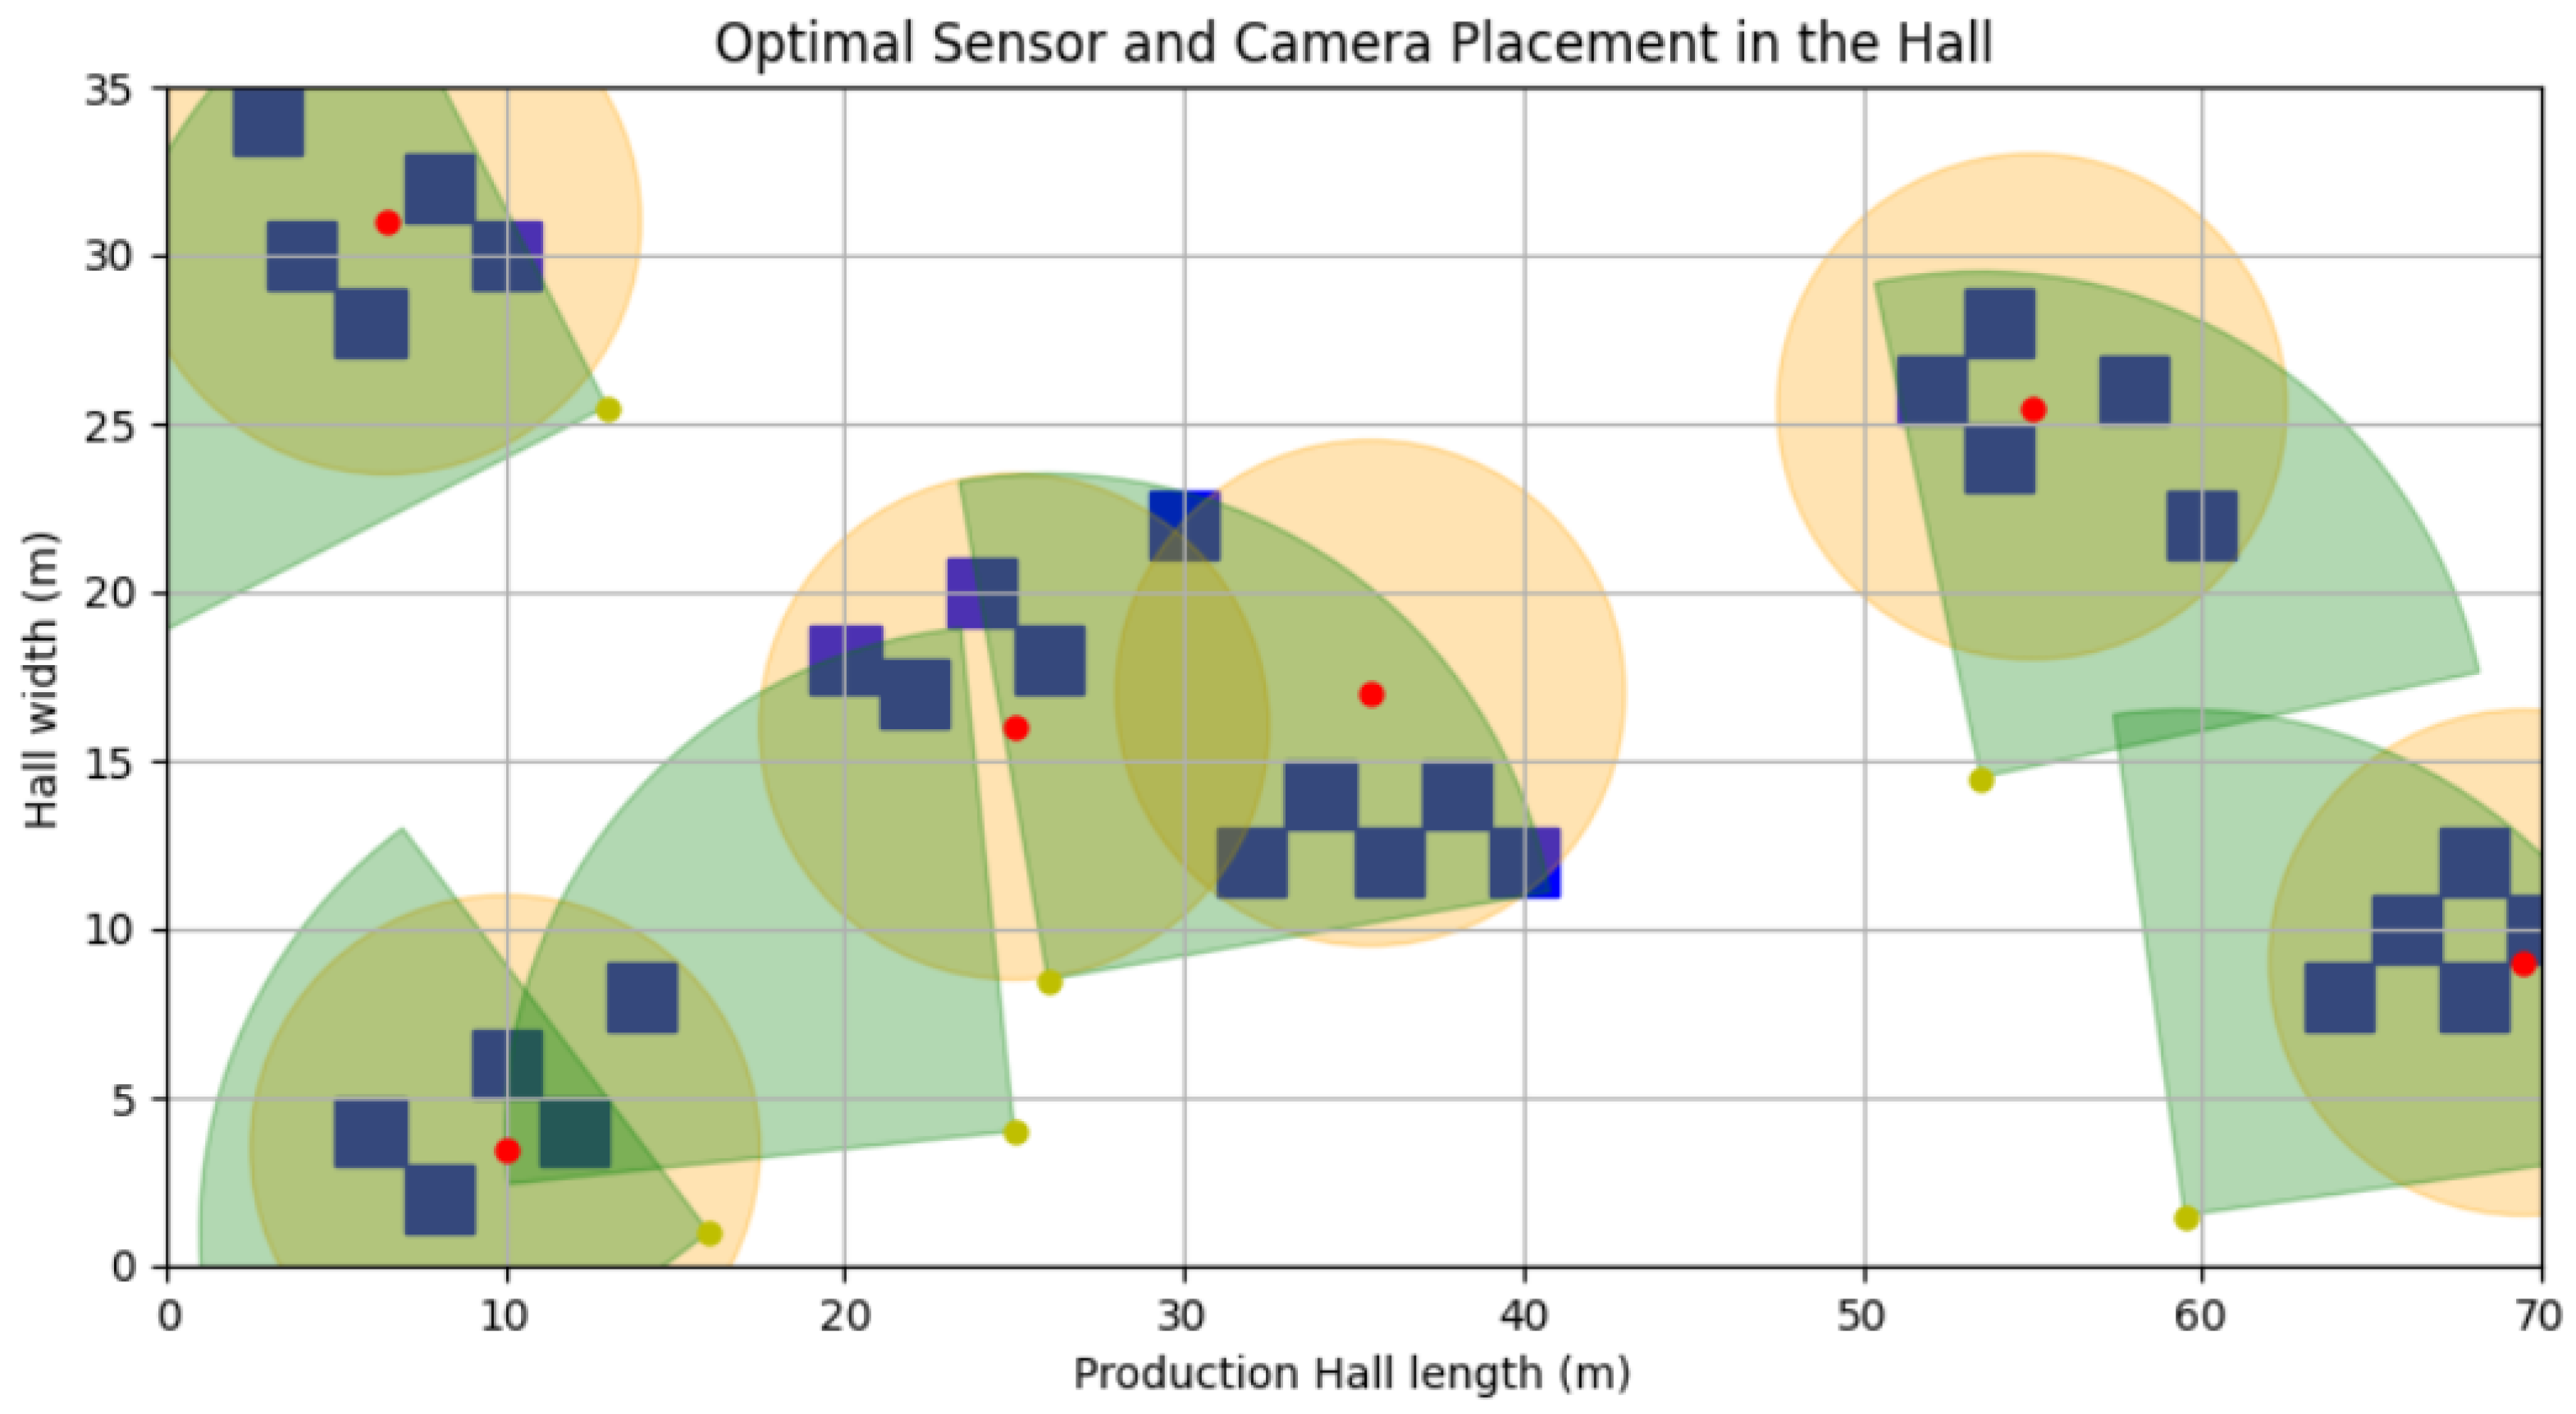
4.2. Results of Experiment Number 2
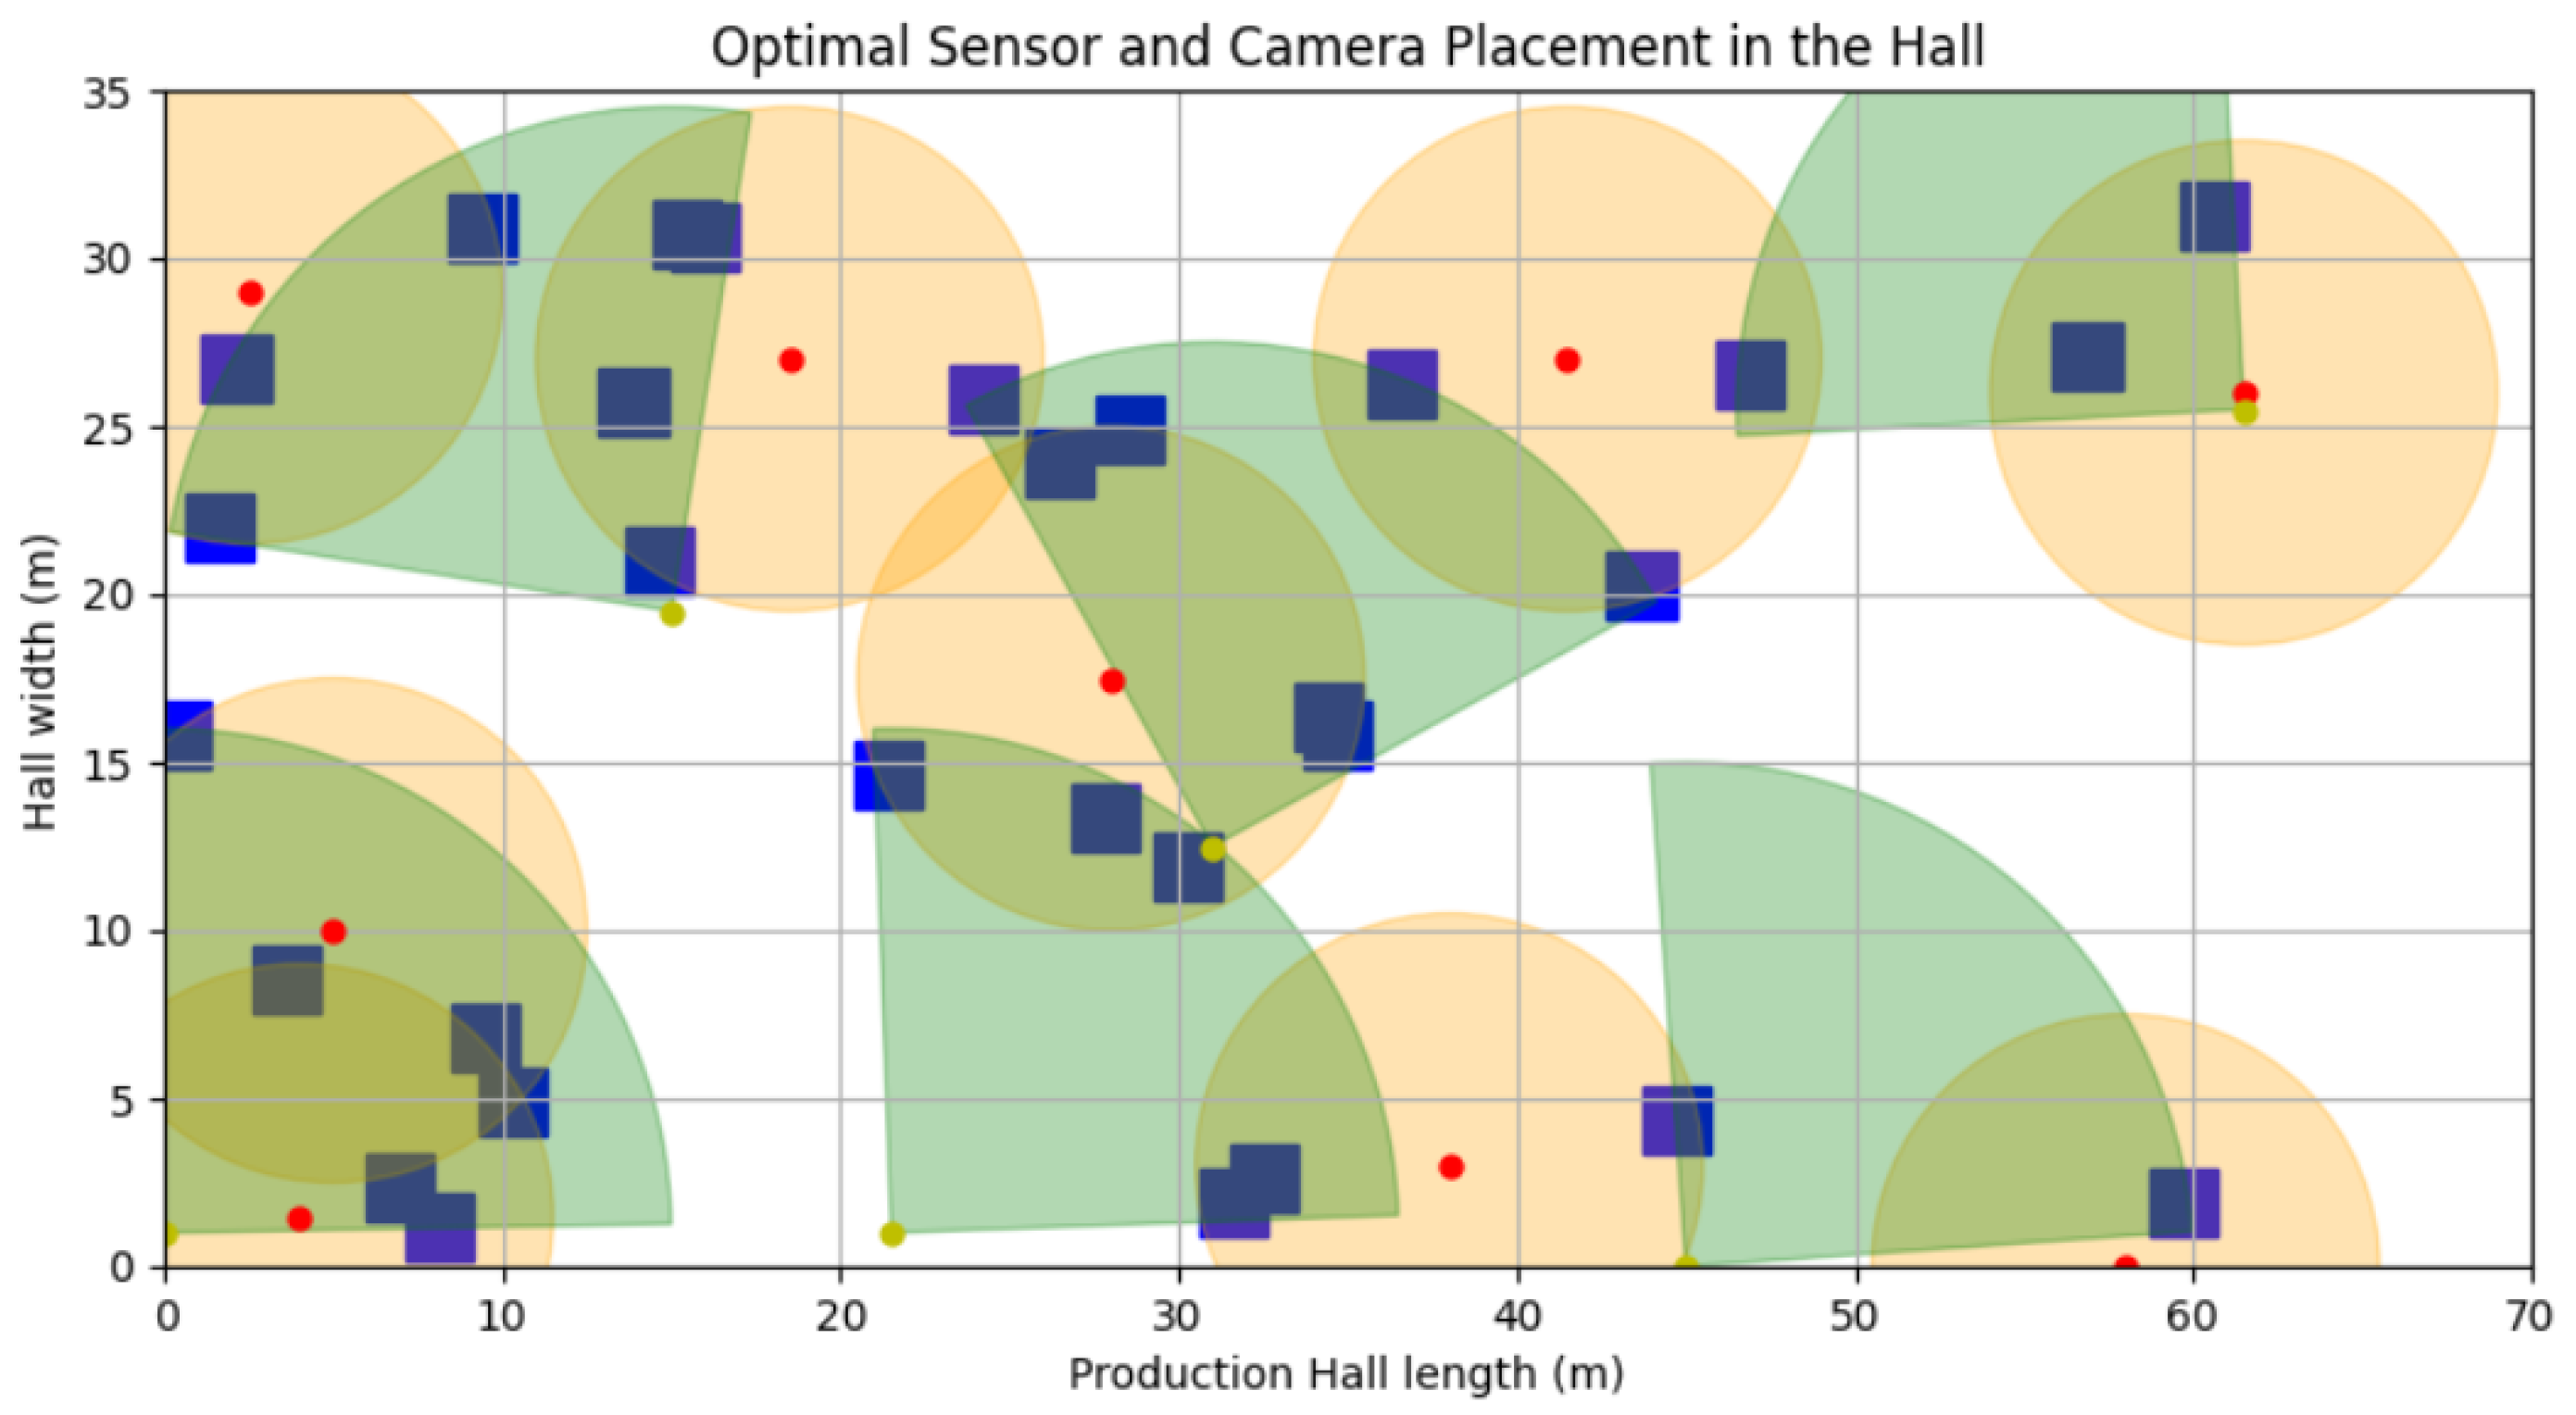
4.3. Results of Experiment Number 3
4.4. Algorithmic Convergence Evaluation
4.5. Coverage Evaluation
5. Discussion
5.1. Experimental Examples and Machine Placement Strategy
5.2. Convergence Patterns and Efficiency
5.3. Coverage Analysis and Significance
5.4. Innovations and Methodological Contributions
6. Conclusions
Author Contributions
Funding
Data Availability Statement
Conflicts of Interest
References
- Yap, F.G.; Yen, H.H. A Survey on sensor coverage and visual data capturing/processing/transmission in wireless visual sensor networks. Sensors 2014, 14, 3506–3527. [Google Scholar] [CrossRef]
- Marks, M. A survey of multi-objective deployment in wireless sensor networks. J. Telecommun. Inf. Technol. 2010, 3, 36–41. [Google Scholar]
- Zhang, J.; Wu, G.; Song, S. Video summarization generation based on graph structure reconstruction. Electronics 2023, 12, 4757. [Google Scholar] [CrossRef]
- Akbarzadeh, V.; Gagné, C.; Parizeau, M.; Mostafavi, M. Black-box optimization of sensor placement with elevation maps and probabilistic sensing models. In Proceedings of the International Symposium on Robotic and Sensors Environments (ROSE), Montreal, QC, Canada, 17–18 September 2011; pp. 89–94. [Google Scholar]
- Akbarzadeh, V.; Gagné, C.; Parizeau, M.; Mostafavi, M.; Argany, M. Probabilistic sensing model for sensor placement optimization based on line-of-sight coverage. IEEE Trans. Instrum. Meas. 2012, 62, 293–303. [Google Scholar] [CrossRef]
- Whitworth, A.; Droitcour, A.; Song, C.; Boric-Lubecke, O.; Lubecke, V. Characterization technique for a doppler radar occupancy Sensor. Electronics 2023, 12, 4888. [Google Scholar] [CrossRef]
- Akbarzadeh, V.; Ko, A.; Gagné, C.; Parizeau, M. Topography-aware sensor deployment optimization with CMA-ES. In Proceedings of the International Conference on Parallel Problem Solving from Nature (PPSN), Krakow, Poland, 11–15 September 2010; pp. 141–150. [Google Scholar]
- Rebai, M.; Le Berre, M.; Snoussi, H.; Hnaien, F.; Khoukhi, L. Sensor deployment optimization methods to achieve both coverage and connectivity in wireless sensor networks. Comput. Oper. Res. 2015, 59, 11–21. [Google Scholar] [CrossRef]
- Kong, Y.; Zhao, X.; Jia, G.; Hong, J.; Zhang, F. Sensor deployment optimization methods in electromagnetic field rased on EEIF-PLI. IEEE Sens. J. 2023, 23, 4216–4227. [Google Scholar] [CrossRef]
- Yi, T.H.; Li, H.N. Methodology developments in sensor placement for health monitoring of civil infrastructures. Int. J. Distrib. Sens. Netw. 2012, 8, 612726. [Google Scholar] [CrossRef]
- Yi, T.H.; Li, H.N.; Gu, M. A new method for optimal selection of sensor location on a high-rise building using simplified finite element model. Struct. Eng. Mech. 2011, 37, 671–684. [Google Scholar] [CrossRef]
- Argany, M.; Mostafavi, M.A.; Karimipour, F. Voronoi-based approaches for geosensor networks coverage determination and optimisation: A survey. In Proceedings of the IEEE 2010 International Symposium on Voronoi Diagrams in Science and Engineering (ISVD), Quebec, QC, Canada, 28–30 June 2010; pp. 115–123. [Google Scholar]
- Wang, G.; Cao, G.; Berman, P.; La Porta, T. Bidding protocols for deploying mobile sensors. IEEE Trans. Mob. Comput. 2007, 6, 563–576. [Google Scholar] [CrossRef]
- Wang, J.; Wang, Y.; Song, J.; Cheng, H. IoV vulnerability classification algorithm based on knowledge graph. Electronics 2023, 12, 4749. [Google Scholar] [CrossRef]
- Lv, P.; Zhang, J.; Lu, M. An optimal method for multiple observers sitting on terrain based on improved simulated annealing techniques. In Proceedings of the 19th International Conference on Advances in Applied Artificial Intelligence: Industrial, Engineering and Other Applications of Applied Intelligent Systems (IEA/AIE), Annecy, France, 27–30 June 2006; Springer: Berlin/Heidelberg, Germany, 2006; pp. 373–382. [Google Scholar]
- Franklin, W.; Vogt, C. Multiple observer siting on terrain with intervisibility or lores data. In Proceedings of the Congress of International Society for Photogrammetry and Remote Sensing (ISPRS), Istanbul, Turkey, 12–23 July 2004; pp. 12–23. [Google Scholar]
- De Floriani, L.; Marzano, P.; Puppo, E. Line-of-sight communication on terrain models. Int. J. Geogr. Inf. Sci. 1994, 8, 329–342. [Google Scholar] [CrossRef]
- Aspbury, A.; Gibson, R. Long-range visibility of greater sage grouse leks: A GIS-based analysis. Anim. Behav. 2004, 67, 1127–1132. [Google Scholar] [CrossRef]
- Kidner, D.; Sparkes, A.; Dorey, M. Geographical information and planning. In GIS Wind Farm Planning; Springer: Berlin/Heidelberg, Germany, 1999; pp. 203–223. [Google Scholar]
- Agarwal, P.; Ezra, E.; Ganjugunte, S. Efficient sensor placement for surveillance problems. In Proceedings of the 5th IEEE International Conference on Distributed Computing in Sensor Systems, Marina Del Rey, CA, USA, 8–10 June 2009; pp. 301–314. [Google Scholar]
- Johnson, M.; Bar-Noy, A. Pan and scan: Configuring cameras for coverage. In Proceedings of the 2011 Proceedings IEEE International Conference on Computer Communications (INFOCOM), Shanghai, China, 10–15 April 2011; pp. 1071–1079. [Google Scholar]
- Horster, E.; Lienhart, R. Approximating optimal visual sensor placement. In Proceedings of the 2006 IEEE International Conference on Multimedia and Expo, Toronto, ON, Canada, 9–12 July 2006; pp. 1257–1260. [Google Scholar]
- Zhao, J.; Cheung, S.; Nguyen, T. Optimal camera network configurations for visual tagging. IEEE J. Sel. Top. Signal Process. 2008, 2, 464–479. [Google Scholar] [CrossRef]
- Papadimitriou, C.; Beck, J.L.; Au, S.K. Entropy-based optimal sensor location for structural model updating. J. Vib. Control 2000, 6, 781–800. [Google Scholar] [CrossRef]
- Basseville, M.; Benveniste, A.; Moustakides, G.; Rougee, A. Optimal sensor location for detecting changes in dynamical behavior. IEEE Trans. Autom. Control 1987, 32, 1067–1075. [Google Scholar] [CrossRef]
- Zarzycki, H.; Czerniak, J.M.; Dobrosielski, W.T. Detecting nasdaq composite index trends with OFNs. In Theory and Applications of Ordered Fuzzy Numbers; Studies in Fuzziness and Soft Computing; Springer: Cham, Switzerland, 2017; Volume 356. [Google Scholar]
- Ewald, D.; Zarzycki, H.; Apiecionek, Ł.; Czerniak, J.M. Ordered fuzzy numbers applied in bee swarm optimization systems. J. Univers. Comput. Sci. 2020, 26, 1475–1494. [Google Scholar] [CrossRef]
- Del Gallo, M.; Mazzuto, G.; Ciarapica, F.E.; Bevilacqua, M. Artificial intelligence to solve production scheduling problems in real industrial settings: Systematic Literature Review. Electronics 2023, 12, 4732. [Google Scholar] [CrossRef]
- Kumar Mohapatra, P.; Kumar Rout, S.; Kishoro Bisoy, S.; Kautish, S.; Hamzah, M.; Jasser, M.B.; Mohamed, A.W. Application of bat algorithm and its modified form trained with ANN in channel equalization. Symmetry 2022, 14, 2078. [Google Scholar] [CrossRef]
- Meguerdichian, S.; Koushanfar, F.; Potkonjak, M.; Srivastava, M. Coverage problems in wireless ad-hoc sensor networks. In Proceedings of the Twentieth Annual Joint Conference of the IEEE Computer and Communications Societies (INFOCOM 2001), Anchorage, AK, USA, 22–26 April 2001; pp. 1380–1387. [Google Scholar]
- Lozano Domínguez, J.M.; Redondo González, M.J.; Davila Martin, J.M.; Mateo Sanguino, T.d.J. Using sensor fusion and machine learning to distinguish pedestrians in artificial intelligence-enhanced crosswalks. Electronics 2023, 12, 4718. [Google Scholar] [CrossRef]
- Krause, A.; Singh, A.; Guestrin, C. Near-optimal sensor placements in Gaussian processes: Theory, efficient algorithms and empirical studies. J. Mach. Learn. Res. 2008, 9, 235–284. [Google Scholar]
- Cortes, J.; Martinez, S.; Karatas, T.; Bullo, F. Coverage control for mobile sensing networks. IEEE Trans. Robot. Autom. 2004, 20, 243–255. [Google Scholar] [CrossRef]
- Schwager, M.; Julian, B.J.; Angermann, M.; Rus, D. Eyes in the Sky: Decentralized control for the deployment of robotic camera networks. Proc. IEEE. 2011, 99, 1541–1561. [Google Scholar] [CrossRef]
- Fortin, F.A.; de Rainville, F.M.; Gardner, M.A.; Parizeau, M.; Gagné, C. DEAP: Evolutionary algorithms made easy. J. Mach. Learn. Res. 2012, 13, 2171–2175. [Google Scholar]
- DS-2TD1228-2/QA Hikvision. Available online: https://www.hikvision.com/pl/products/Thermal-Products/Security-thermal-cameras/heatpro-series/ds-2td1228-2-qa/ (accessed on 23 December 2023).
- DS-2TD1228-2/QA(O-STD). Available online: https://www.dvs.co.uk/products/ds-2td1228-2-qao-std/ (accessed on 23 December 2023).
- Panoramic-PIR-Detector. Available online: https://commerce.boschsecurity.com/in/en/DS936-Low-Profile-Panoramic-PIR-Detector/p/2628145931/ (accessed on 23 December 2023).
- Panoramic-PIR-Detector. Available online: https://hexagonvalley.com.au/wp-content/uploads/2019/05/DS936_Series_Data_sheet_enUS_2628645131.pdf (accessed on 23 December 2023).
- EN 50131-2-2:2017; Alarm Systems—Intrusion and Hold-up Systems—Part 2-2: Intrusion Detectors—Passive Infrared Detectors. British Standards Institution: London, UK, 2021.
- Skubisz, O.; Zarzycki, H. An Application of Particle Swarm Optimization Algorithm in the Sensor Placement Optimization Problem. In Proceedings of the Twenty First International Workshop on Intuitionistic Fuzzy Sets and Generalized Nets, Warsaw, Poland, 20 October 2023; Lecture Notes in Networks and Systems. Springer: Cham, Switzerland, 2024. [Google Scholar]


| Placement of Machines in Production Hall | ||||||||
| ID | Type | X | Y | ID | Type | X | Y | |
| M1 | Machine | 30 | 22 | M16 | Machine | 10 | 6 | |
| M2 | Machine | 14 | 8 | M17 | Machine | 24 | 20 | |
| M3 | Machine | 40 | 12 | M18 | Machine | 34 | 14 | |
| M4 | Machine | 60 | 22 | M19 | Machine | 54 | 28 | |
| M5 | Machine | 68 | 8 | M20 | Machine | 70 | 10 | |
| M6 | Machine | 6 | 4 | M21 | Machine | 12 | 4 | |
| M7 | Machine | 20 | 18 | M22 | Machine | 26 | 18 | |
| M8 | Machine | 38 | 14 | M23 | Machine | 32 | 12 | |
| M9 | Machine | 58 | 26 | M24 | Machine | 52 | 26 | |
| M10 | Machine | 66 | 10 | M25 | Machine | 68 | 12 | |
| M11 | Machine | 8 | 2 | M26 | Machine | 4 | 30 | |
| M12 | Machine | 22 | 17 | M27 | Machine | 6 | 28 | |
| M13 | Machine | 36 | 12 | M28 | Machine | 8 | 32 | |
| M14 | Machine | 54 | 24 | M29 | Machine | 10 | 30 | |
| M15 | Machine | 64 | 8 | M30 | Machine | 3 | 34 | |
| Placement of Motion Sensors and Thermal Cameras | ||||||||
| ID | Type | X | Y | ID | Type | X | Y | Angle |
| A1 | Motion sensor | 6.5 | 31 | C1 | Thermal camera | 13 | 25.5 | 162 |
| A2 | Motion sensor | 10 | 3.5 | C2 | Thermal camera | 16 | 1 | 172 |
| A3 | Motion sensor | 25 | 16 | C3 | Thermal camera | 25 | 4 | 141 |
| A4 | Motion sensor | 35.5 | 17 | C4 | Thermal camera | 26 | 8.5 | 55 |
| A5 | Motion sensor | 55 | 25.5 | C5 | Thermal camera | 53.5 | 14.5 | 57 |
| A6 | Motion sensor | 69.5 | 9 | C6 | Thermal camera | 59.5 | 1.5 | 53 |
| Placement of Machines in Production Hall | ||||||||
| ID | Type | X | Y | ID | Type | X | Y | |
| M1 | Machine | 9.43 | 30.95 | M16 | Machine | 14.66 | 21.00 | |
| M2 | Machine | 56.86 | 27.12 | M17 | Machine | 27.79 | 13.34 | |
| M3 | Machine | 34.72 | 15.78 | M18 | Machine | 26.46 | 23.93 | |
| M4 | Machine | 15.48 | 30.73 | M19 | Machine | 13.86 | 25.74 | |
| M5 | Machine | 24.19 | 25.79 | M20 | Machine | 60.63 | 31.27 | |
| M6 | Machine | 9.46 | 6.83 | M21 | Machine | 8.16 | 1.21 | |
| M7 | Machine | 3.59 | 8.52 | M22 | Machine | 10.33 | 4.95 | |
| M8 | Machine | 0.32 | 15.83 | M23 | Machine | 2.12 | 26.74 | |
| M9 | Machine | 34.37 | 16.35 | M24 | Machine | 59.67 | 1.91 | |
| M10 | Machine | 46.90 | 26.54 | M25 | Machine | 1.64 | 22.04 | |
| M11 | Machine | 44.73 | 4.39 | M26 | Machine | 36.61 | 26.28 | |
| M12 | Machine | 21.41 | 14.64 | M27 | Machine | 16.00 | 30.66 | |
| M13 | Machine | 32.52 | 2.67 | M28 | Machine | 28.54 | 24.93 | |
| M14 | Machine | 30.29 | 11.87 | M29 | Machine | 6.97 | 2.37 | |
| M15 | Machine | 31.60 | 1.94 | M30 | Machine | 43.67 | 20.23 | |
| Placement of Motion Sensors and Thermal Cameras | ||||||||
| ID | Type | X | Y | ID | Type | X | Y | Angle |
| A1 | Motion sensor | 2.5 | 29 | C1 | Thermal camera | 0 | 1 | 46 |
| A2 | Motion sensor | 4 | 1.5 | C2 | Thermal camera | 15 | 19.5 | 126 |
| A3 | Motion sensor | 5 | 10 | C3 | Thermal camera | 21.5 | 1 | 47 |
| A4 | Motion sensor | 18.5 | 27 | C4 | Thermal camera | 31 | 12.5 | 74 |
| A5 | Motion sensor | 28 | 17.5 | C5 | Thermal camera | 45 | 0 | 49 |
| A6 | Motion sensor | 38 | 3 | C6 | Thermal camera | 61.5 | 25.5 | 138 |
| A7 | Motion sensor | 41.5 | 27 | |||||
| A8 | Motion sensor | 58 | 0 | |||||
| A | Motion sensor | 61.5 | 26 | |||||
| Placement of Machines in Production Hall | ||||||||
| ID | Type | X | Y | ID | Type | X | Y | |
| M1 | Machine | 18.20 | 3.74 | M16 | Machine | 64.43 | 1.30 | |
| M2 | Machine | 26.75 | 10.25 | M17 | Machine | 19.74 | 11.30 | |
| M3 | Machine | 47.96 | 13.55 | M18 | Machine | 5.22 | 17.14 | |
| M4 | Machine | 21.94 | 30.56 | M19 | Machine | 16.63 | 23.84 | |
| M5 | Machine | 7.70 | 15.13 | M20 | Machine | 34.41 | 30.84 | |
| M6 | Machine | 12.72 | 5.24 | M21 | Machine | 58.63 | 2.38 | |
| M7 | Machine | 49.61 | 10.62 | M22 | Machine | 23.23 | 13.31 | |
| M8 | Machine | 6.20 | 32.36 | M23 | Machine | 6.41 | 27.28 | |
| M9 | Machine | 9.53 | 4.69 | M24 | Machine | 43.73 | 11.55 | |
| M10 | Machine | 20.97 | 22.37 | M25 | Machine | 65.67 | 33.28 | |
| M11 | Machine | 31.46 | 33.04 | M26 | Machine | 23.49 | 24.87 | |
| M12 | Machine | 47.81 | 29.98 | M27 | Machine | 35.24 | 22.92 | |
| M13 | Machine | 51.88 | 8.53 | M28 | Machine | 48.33 | 29.10 | |
| M14 | Machine | 21.71 | 30.05 | M29 | Machine | 41.12 | 14.67 | |
| M15 | Machine | 51.02 | 28.24 | M30 | Machine | 11.15 | 18.96 | |
| Placement of Motion Sensors and Thermal Cameras | ||||||||
| ID | Type | X | Y | ID | Type | X | Y | Angle |
| A1 | Motion sensor | 7 | 11 | C1 | Thermal camera | 0 | 19 | 25 |
| A2 | Motion sensor | 10 | 26 | C2 | Thermal camera | 4 | 1.5 | 35 |
| A3 | Motion sensor | 20 | 7 | C3 | Thermal camera | 14.5 | 2.5 | 74 |
| A4 | Motion sensor | 26 | 27 | C4 | Thermal camera | 30.5 | 18.5 | 115 |
| A5 | Motion sensor | 36.5 | 29 | C5 | Thermal camera | 36 | 9 | 60 |
| A6 | Motion sensor | 44.5 | 27.5 | C6 | Thermal camera | 50 | 0 | 48 |
| A7 | Motion sensor | 46.5 | 15 | C7 | Thermal camera | 60 | 22.5 | 107 |
| A8 | Motion sensor | 58.5 | 5.5 | |||||
| A9 | Motion sensor | 68 | 33.5 | |||||
| Run | Iterations to Convergence | Execution Time (ms) |
|---|---|---|
| 1 | 67 | 5245 |
| 2 | 62 | 4979 |
| 3 | 71 | 5601 |
| 4 | 68 | 5315 |
| 5 | 77 | 6290 |
| Method | Average Safety Coverage (%) |
|---|---|
| BA-optimized | 98.3 |
| Random placement | 58.4 |
Disclaimer/Publisher’s Note: The statements, opinions and data contained in all publications are solely those of the individual author(s) and contributor(s) and not of MDPI and/or the editor(s). MDPI and/or the editor(s) disclaim responsibility for any injury to people or property resulting from any ideas, methods, instructions or products referred to in the content. |
© 2024 by the authors. Licensee MDPI, Basel, Switzerland. This article is an open access article distributed under the terms and conditions of the Creative Commons Attribution (CC BY) license (https://creativecommons.org/licenses/by/4.0/).
Share and Cite
Zarzycki, H.; Ewald, D.; Prokopowicz, P. Leveraging Swarm Intelligence for Optimal Thermal Camera and Sensor Placement in Industrial Environments. Electronics 2024, 13, 601. https://doi.org/10.3390/electronics13030601
Zarzycki H, Ewald D, Prokopowicz P. Leveraging Swarm Intelligence for Optimal Thermal Camera and Sensor Placement in Industrial Environments. Electronics. 2024; 13(3):601. https://doi.org/10.3390/electronics13030601
Chicago/Turabian StyleZarzycki, Hubert, Dawid Ewald, and Piotr Prokopowicz. 2024. "Leveraging Swarm Intelligence for Optimal Thermal Camera and Sensor Placement in Industrial Environments" Electronics 13, no. 3: 601. https://doi.org/10.3390/electronics13030601
APA StyleZarzycki, H., Ewald, D., & Prokopowicz, P. (2024). Leveraging Swarm Intelligence for Optimal Thermal Camera and Sensor Placement in Industrial Environments. Electronics, 13(3), 601. https://doi.org/10.3390/electronics13030601